chronic kidney disease chronic kidney disease is a slow loss of renal function over time. this leads...
TRANSCRIPT

Chronic Kidney Disease
Chronic Kidney Disease is a slow loss of renal function over time. This leads to a decreased ability to remove waste products from the body and perform homeostatic functions.
Epidemiology
• CKD affects about 26 million people in the US• Approximately 19 million adults are in the
early stages of the disease – On the rise do to increasing prevalence of
diabetes and hypertension• Total cost of ESRD in US was approximately
$40 billion in 2008


Clinical Definition
• Glomerular Filtration Rate of less than 60 ml/minute per 1.73m2 per body surface area (normal is 125ml/min) .
• Presence of kidney damage, regardless of the cause, for three or more months

Measuring kidney functioneGFR: MDRD calculation
eGFR = 175 x SerumCr-1.154 * age-0.203 * 1.212 (if patient is black) * 0.742 (if female)
•Creatinine is a muscle waste product that is cleared by kidney filtration.•Low kidney function leads to high levels of creatinine.•Amount of muscle influences amount of creatinine made. High levels of muscle gives higher creatinine baseline, independent of kidney function.•Older people produce less creatinine from their muscles.•African Americans produce more creatinine.•Women produce less creatinine•10% error from true GFR

CKD Symptoms• Hematuria (blood in urine)• Flank pain• Edema• Hypertension• Signs of uremia• Lethargy and fatigue• Loss of appetite• If asymptomatic may have elevated serum
creatinine concentration or an abnormal urinalysis


In the early stages of CKD, people do not notice any symptoms. The disease often develops so slowly that many people don't realize they're sick until the disease is advanced. In 2006, CKD was responsible for the death of nearly 45,000 people, ranking as the ninth leading cause of death in the United States.
However, the risk for kidney disease can be reduced by preventing – when possible – diabetes and high blood pressure and managing these conditions when present.

Kidney function declines with age in humans
Poor kidney function is a risk factor for death from major age-related diseases:-Chronic kidney disease-Cardiovascular disease-Stroke-Type 2 Diabetes
Levey et al. 2009; Fan et al. 2011
GlomerularFiltration
Rate
Risk Factors
• Age of more than 60 years• Hypertension and Diabetes – Responsible for 2/3 of cases
• Cardiovascular disease • Family history of the disease. • Race and ethnicity
• Highest incidence is for African Americans• Hispanics have higher incidence rates of ESRD than
non-Hispanics.

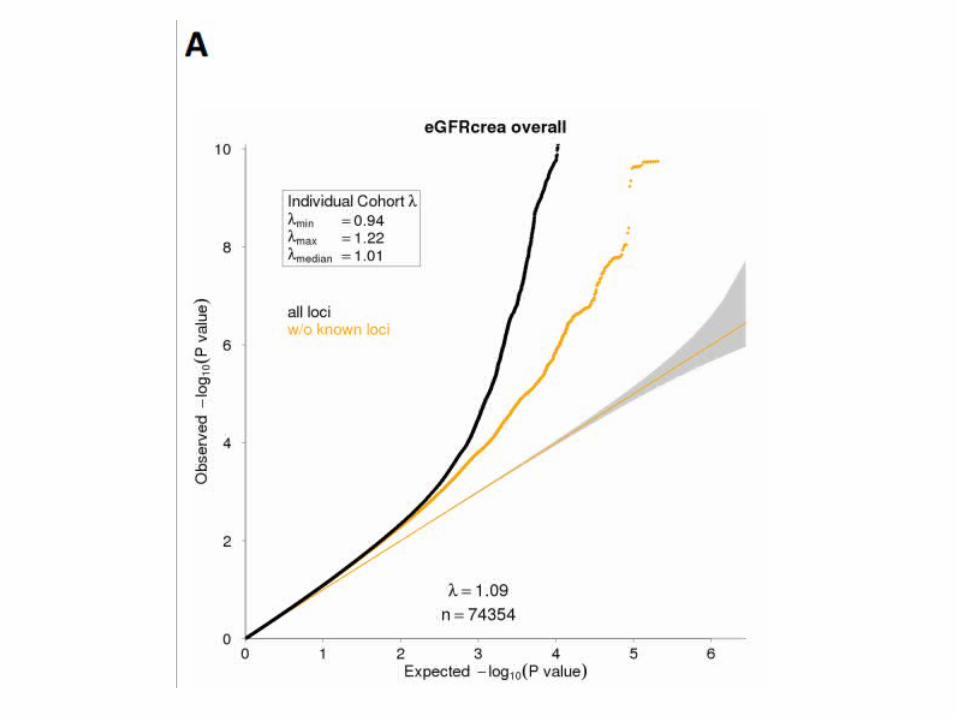
•Meta-analysis of genome-wide association data from 20 Studies•67,093 Caucasian individuals •Serum creatinine (eGFRcrea), cystatin C (eGFRcys), and CKD (eGFRcrea <60 ml/min/1.73m2; n = 5,807 CKD cases). •20 new loci


UMOD• Uromodulin (UMOD) is the most abundant protein in urine.• SNP rs12917707 is a weak allele in the UMOD locus
• Affects expression• Risk allele is 18% frequency• Associated with chronic kidney disease
• Strong alleles in UMOD alter the structure of the protein, preventing its release from kidney cells. Abnormal buildup of uromodulin may trigger the self-destruction (apoptosis) of cells in the kidneys, causing kidney disease.
• These strong alleles are autosomal dominant and cause• medullary cystic kidney disease-2 (MCKD2), • glomerulocystic kidney disease with hyperuricemia• isosthenuria (GCKDHI)• familial juvenile hyperuricemic nephropathy (FJHN).
common variants of genes responsible for severe, monogenic disorders may be associated with milder presentations in the general population
• Meta-analysis of genome-wide association data from 20 Studies
• 130K Caucasian individuals • Serum creatinine (eGFRcrea)• 6 new loci for CEU• For African Americans, over 95% of SNPs were observed
to have the same effect direction in cross-ethnic analyses.


Chronic Kidney DiseaseSN
P
gen
otyp
e
risk
alle
le
OR
Pval
ue
link
How to make a Genetic Risk Score
1. Count alleles

Chronic Kidney Disease
SNP
gen
otyp
e
risk
alle
le
Scor
e
Runn
ing
Sco
re
1 1
2 3
0 3
0 3
0 3
2 5
0 5
2 7
2 9 out of 18 possible

Summing the risk alleles 16 loci account for 1.4% of the variation in eGFRcrea.
How to make a Genetic Risk Score
1. Count alleles2. Weight using odds ratios

Chronic Kidney DiseaseWeight by odds ratios
Odds ratio ≈ effect sizeBut odds ratio affected by allele frequency, so can’t really compare two alleles(They could have at least tried!)

How to make a Genetic Risk Score
1. Count alleles2. Weight using odds ratios3. Weight by increased likelihood

Recall from Class GWASOdds Ratio ≠ Increased Risk
P-value OR IR
Lactose Intolerance
rs4988235 .09 2.7 1.2
Eye Color rs7495174 .0093 inf inf
Asparagus rs4481887 .084 2.35 1.18
Bitter Taste rs713598 .000498 0.22 0.519
Earwax rs17822931 .004 4.6 2.6
Increased Risk can be multiplied together.Usually don’t know increased risk in case/control study

How to make a Genetic Risk Score
1. Count alleles2. Weight using odds ratios3. Weight by increased likelihood4. Linear Regression

GRS using linear regression
eGFR = (-.006)(#A alleles at rs1933182) + (.004)(#C alleles at rs267734) + …
Kottgen et al. should have used this!!
How to make a Genetic Risk Score
1. Count alleles (bad)2. Weight using odds ratios (OK)3. Weight by increased likelihood (good)4. Linear Regression (good)

Other Genetic Risk ScoresDisease SNPs Method Result Date
Type 2 diabetes 18 Logistic regression. The genotype score resulted in the appropriate risk reclassification of, at most, 4% of the subjects.
2008
Type 2 diabetes 20 # alleles AUC = .54 2010
Myocardial Infarction
3 # alleles AUC with clinical predictors = .67AUC with clincial predictors and GRS = .68
2011
Coronary Heart Disease
13 Linear regression bottom quintile vs top quintile = 1.66 increased risk adjusting for traditional risk factors
2010
Cardiovascular disease
101 # alleles No improvement over clinical parameters
2011

Inflammatory Bowel/Crohn’s Disease
Signs and symptoms include:Diarrhea. Diarrhea is a common problem for people with IBD.Fever and fatigue. Many people with IBD experience a low-grade fever. You may also feel tired or have low energy.Abdominal pain and cramping. Inflammation and ulceration can affect the normal movement of contents through your digestive tract and may lead to pain and cramping. You may also experience nausea and vomiting.Blood in your stool. You might notice bright red blood in the toilet bowl or darker blood mixed with your stool. You can also have bleeding you don't see (occult blood).Reduced appetite. Abdominal pain and cramping, as well as inflammation, can affect your appetite.Unintended weight loss. You may lose weight and even become malnourished because you cannot properly digest and absorb food.
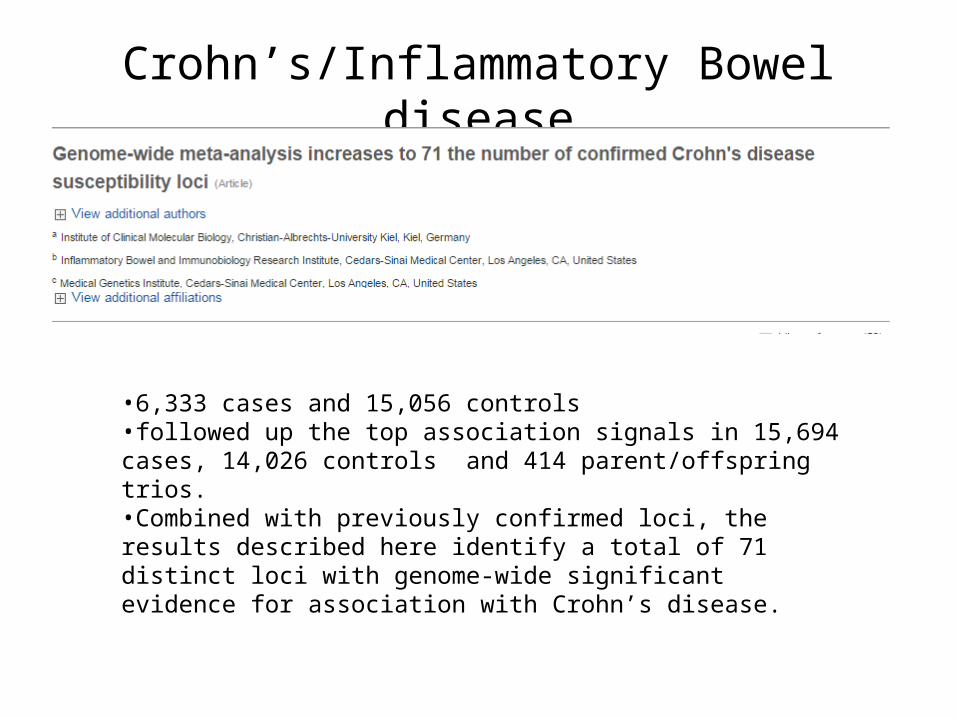
Crohn’s/Inflammatory Bowel disease
•6,333 cases and 15,056 controls•followed up the top association signals in 15,694 cases, 14,026 controls and 414 parent/offspring trios.•Combined with previously confirmed loci, the results described here identify a total of 71 distinct loci with genome-wide significant evidence for association with Crohn’s disease.

71 Inf. Bowel Disease loci

Crohn’s disease12 markers
23andme.com

Crohn’s disease23andme.com
Inflammatory Bowel DiseaseGenetic Risk Score

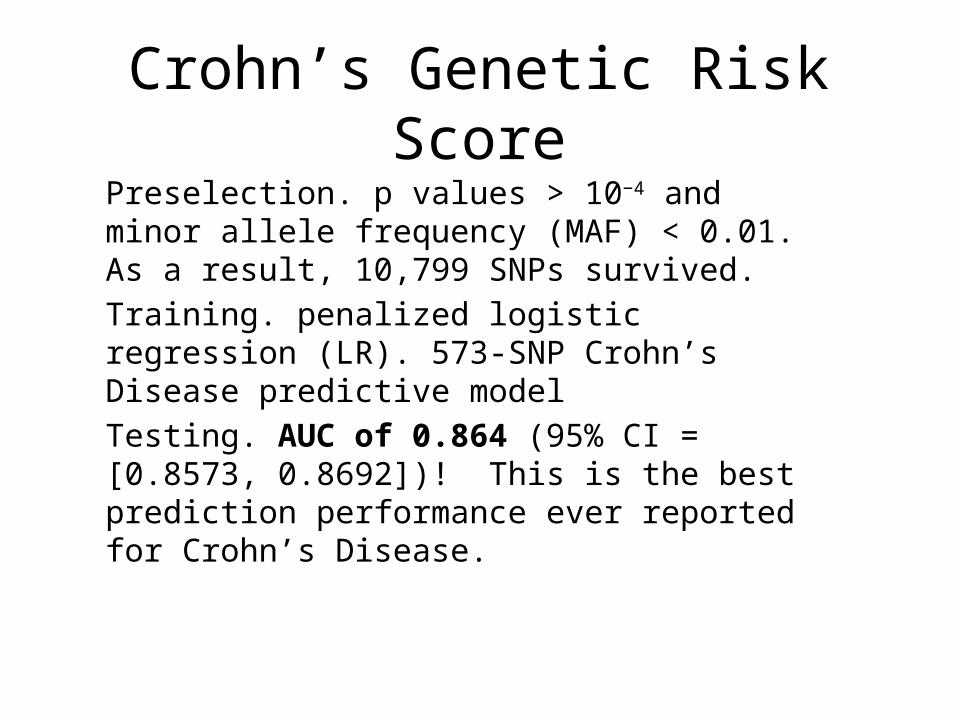
Crohn’s Genetic Risk ScorePreselection. p values > 10−4 and minor allele frequency (MAF) < 0.01. As a result, 10,799 SNPs survived. Training. penalized logistic regression (LR). 573-SNP Crohn’s Disease predictive modelTesting. AUC of 0.864 (95% CI = [0.8573, 0.8692])! This is the best prediction performance ever reported for Crohn’s Disease.
Crohn’s disease Genetic Risk Score
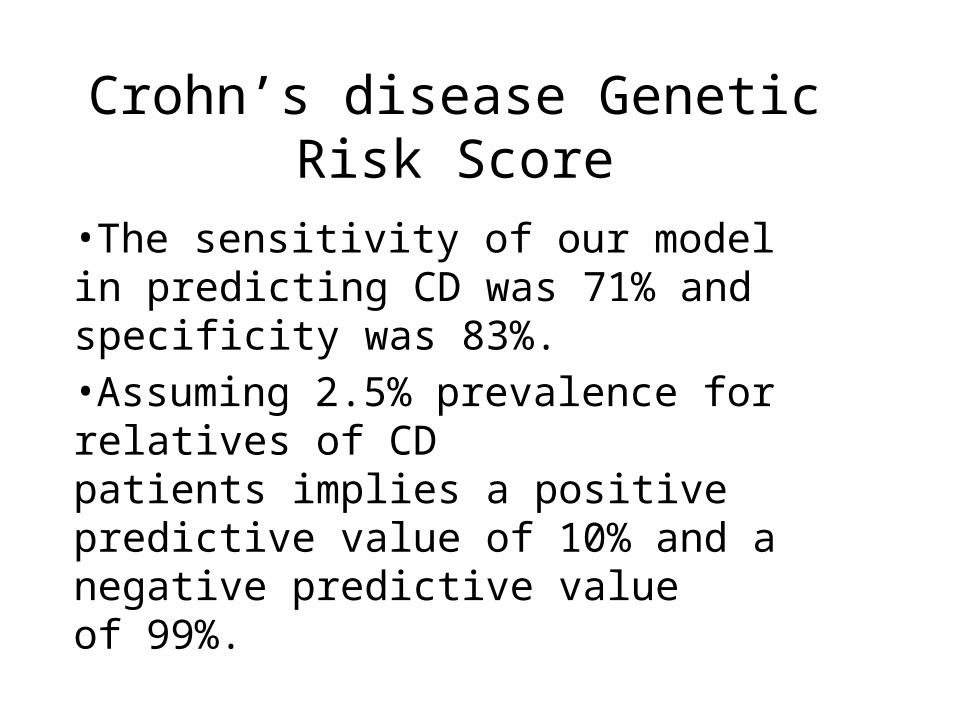
•The sensitivity of our model in predicting CD was 71% and specificity was 83%.•Assuming 2.5% prevalence for relatives of CD patients implies a positive predictive value of 10% and a negative predictive value of 99%.