chronic hypercortisolism causes more persistent visceral
TRANSCRIPT

https://doi.org/10.1530/JOE-19-0168https://joe.bioscientifica.com © 2019 Society for Endocrinology
Printed in Great BritainPublished by Bioscientifica Ltd.
Journal of Endocrinology
242:2 65–77G García-Eguren et al. CORT overexposure induces long-term adiposity
-19-0168
RESEARCH
Chronic hypercortisolism causes more persistent visceral adiposity than HFD-induced obesity
Guillermo García-Eguren1, Oriol Giró1, María del Mar Romero2,3,4, Mar Grasa2,3,4 and Felicia A Hanzu1,5,6,7
1Group of Endocrine Disorders, IDIBAPS, Barcelona, Spain2Department of Biochemistry and Molecular Biomedicine, Section of Nutrition, Faculty of Biology, University of Barcelona, Barcelona, Spain3Institute of Biomedicine, University of Barcelona, Barcelona, Spain4Centro de Investigación Biomédica en Red de Obesidad y Nutrición (CIBEROBN), Carlos III Health Institute, Madrid, Spain5Department of Endocrinology and Nutrition, Hospital Clinic of Barcelona, Barcelona, Spain6Centro de Investigación Biomédica en Red de Diabetes y Enfermedades Metabólicas Asociadas (CIBERDEM), Carlos III Health Institute, Madrid, Spain7Department of Medicine, Faculty of Medicine and Health Sciences, University of Barcelona, Barcelona, Spain
Correspondence should be addressed to F A Hanzu: [email protected]
Abstract
Excessive and prolonged glucocorticoid (GC) exposure, resulting from either prescribed or endogenous hypercortisolism, is associated with a high cardiovascular and metabolic burden (Cushing’s syndrome). Although previous studies in humans and mice have reported heterogeneous data about the persistence of metabolic syndrome features after remission of hypercortisolism, there is still controversy as to whether this is due to the deleterious changes induced by GCs during active disease or the result of various other factors interfering in the recovery period. In order to study metabolic effects after remission, we used a reversible mouse model of corticosterone (CORT) (100 µg/mL) administration in drinking water for 5 weeks, followed by a 10-week recovery period. We compared CORT-induced effects at these time points with a high-fat diet-treated group (HFD 45%) and a vehicle group (VEH). Plasma CORT, 11β-HSD activity, food intake, glucose levels, interscapular brown adiposity, hepatic triglycerides and muscle mass were found altered during CORT treatment but normalized after recovery. Although hyperinsulinemia and insulin resistance were increased during CORT and HFD treatment, insulin homeostasis remained altered following the recovery period only in CORT-treated mice. Subcutaneous and visceral adipose tissues (SAT and VAT) were enlarged during HFD and CORT treatment as measured by MRI. However, increased muscle lipid content, adiposity and macrophage infiltration in VAT were only present in the CORT group following recovery. Taken together, CORT-induced insulin alterations were more potent than HFD-induced ones during the same period of treatment, and also more persistent long term. Moreover, we demonstrated that CORT treatment induces more long-lasting VAT enlargement than HFD.
2
Key Words
f Cushing’s syndrome
f glucocorticoids
f insulin resistance
f fat distribution
f long-term metabolic changes
242
Journal of Endocrinology (2019) 242, 65–77
Downloaded from Bioscientifica.com at 12/05/2021 11:42:49AMvia free access
https://doi.org/10.1530/JOE-19-0168https://joe.bioscientifica.com © 2019 Society for Endocrinology
Published by Bioscientifica Ltd.Printed in Great Britain
66CORT overexposure induces long-term adiposity
G García-Eguren et al. 242:2Journal of Endocrinology
Introduction
Chronic exposure to excess glucocorticoid (GC) levels, resulting from either endogenous Cushing’s syndrome (CS) or exogenous GC therapy, causes several adverse outcomes, including obesity, insulin resistance, dyslipidemia, myopathy, osteoporosis and increased cardiovascular thrombotic morbidity and mortality (Rockall et al. 2003, Vegiopoulos & Herzig 2007, Fardet et al. 2012, Schakman et al. 2013, Henneicke et al. 2014). Although endogenous CS is a rare disease (Feelders et al. 2015), an estimated 1–2% of the global adult population receives long-term treatment with GCs for a broad spectrum of inflammatory and autoimmune diseases (van Staa 2000, Overman et al. 2013) with similar cardiometabolic side effects. Despite significant improvements in CS phenotype after medical treatment, cardiometabolic risk remains increased in these patients, even after long-term remission (Colao et al. 1999, Pivonello et al. 2005, Aranda et al. 2018). Specifically, several studies in humans have reported persistent abdominal fat accumulation, insulin resistance and systemic low-grade inflammation (Barahona et al. 2009, Geer et al. 2012, Wagenmakers et al. 2015, Shah et al. 2017). However, interpreting these clinical studies has important limitations, due to the scarce number of patients with pure hypercortisolemic features and the presence of multiple confounding factors that can interact in the remission period. Therefore, it is still not known whether the cardiometabolic risk phenotype in remission is due to the persistent harm induced by GCs during active disease in target tissues, a non-physiological adrenal replacement therapy, other associated hormonal deficiencies or to their overall interplay (Lönn et al. 1994, Pirlich et al. 2002, Ueland et al. 2003, Wagenmakers et al. 2016).
In order to establish an accessible method to study CS remission, we used a reversible mouse model of hypercortisolism previously described by Karatsoreos et al. (2010) that reproduces the CS phenotype, including increased adiposity, decreased lean mass and elevated plasma insulin levels. Although other authors have also previously characterized the active phenotype of this reversible model of CS in detail (Karatsoreos et al. 2010, Morgan et al. 2014, Yu et al. 2014), only a few studies have been published regarding the long-term effects of previous GC treatment on metabolic target tissues, with inconsistent results depending on corticosterone (CORT) dose, age at treatment initiation and the time point of analysis during the recovery period (Cassano et al. 2012, Auvinen et al. 2013, Fransson et al. 2013, Kinlein et al. 2017).
In the present study, we aim to evaluate the persistent metabolic fingerprints induced during active
CS on adipose tissue and insulin homeostasis after a long recovery period enabling adrenal axis reestablishment. For this purpose, we used a mouse model of stable CORT administration (100 µg/mL) in drinking water for 5 weeks, followed by a 10-week recovery period and compared it at two time points with a high-fat diet-treated group (HFD 45%) or a vehicle one (VEH), to evaluate the metabolic effects of the treatment.
Materials and methods
Animals and treatment
Six-week-old male C57BL/6J mice (Charles River Laboratories) were group-housed (five per cage) and subjected to a 12-h light–darkness cycle (lights on at 08:00 h). Animals were acclimatized to the animal facility for 1 week following arrival with ad libitum access to food and drinking water. After the acclimatization phase, three different groups were established for 5 weeks of treatment. The CORT group was fed ad libitum on a chow diet, and regular drinking water was replaced with a solution containing 100 µg/mL of free corticosterone (Sigma) dissolved in 100% ethanol (EtOH), and then diluted in regular water to achieve a final EtOH concentration of 0.66%. With an average water consumption of 175 mL per cage during the first week of treatment and assuming that single-mouse consumption was proportionate to the cage average, a consumption of 5 mL per mouse per day was obtained. Therefore, a daily exposure of approximately 500 µg CORT per mouse was established for the rest of the treatment. Water consumption average of each cage was measured twice a week, and, if necessary, solutions were replaced with the proper amount of corticosterone needed to maintain the established CORT exposure level.
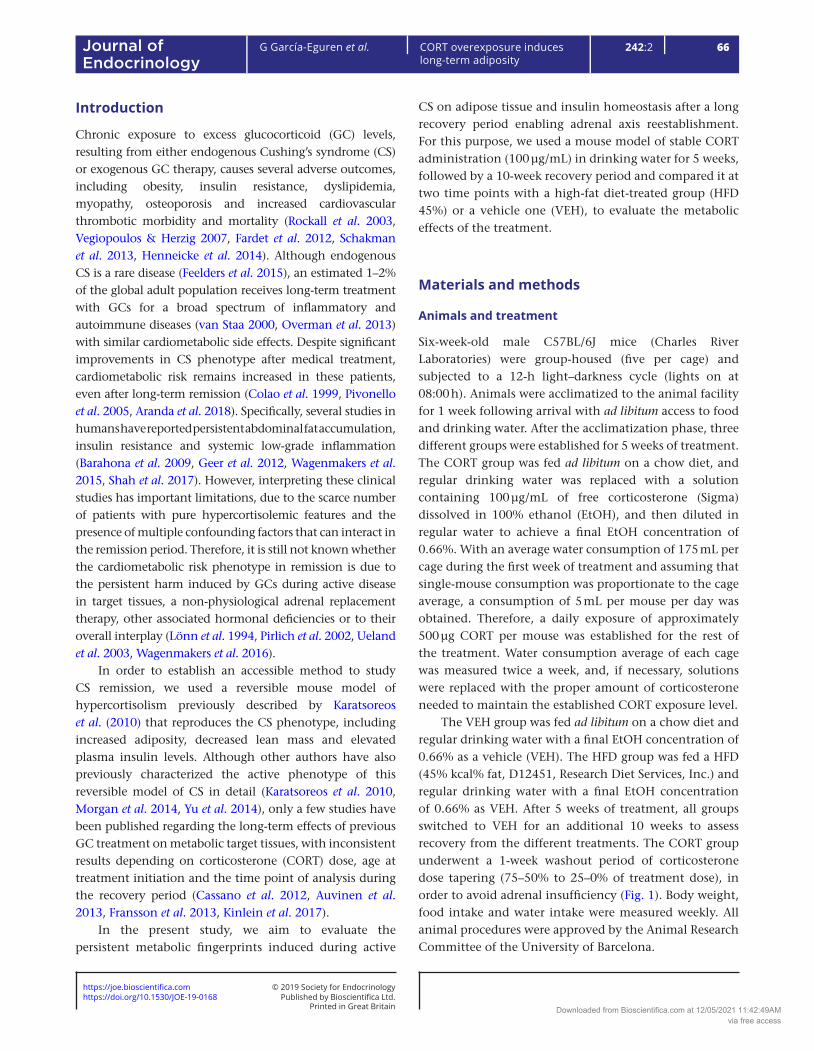
The VEH group was fed ad libitum on a chow diet and regular drinking water with a final EtOH concentration of 0.66% as a vehicle (VEH). The HFD group was fed a HFD (45% kcal% fat, D12451, Research Diet Services, Inc.) and regular drinking water with a final EtOH concentration of 0.66% as VEH. After 5 weeks of treatment, all groups switched to VEH for an additional 10 weeks to assess recovery from the different treatments. The CORT group underwent a 1-week washout period of corticosterone dose tapering (75–50% to 25–0% of treatment dose), in order to avoid adrenal insufficiency (Fig. 1). Body weight, food intake and water intake were measured weekly. All animal procedures were approved by the Animal Research Committee of the University of Barcelona.
Downloaded from Bioscientifica.com at 12/05/2021 11:42:49AMvia free access
https://doi.org/10.1530/JOE-19-0168https://joe.bioscientifica.com © 2019 Society for Endocrinology
Published by Bioscientifica Ltd.Printed in Great Britain
67
Research
G García-Eguren et al. CORT overexposure induces long-term adiposity
242:2Journal of Endocrinology
All basal and dynamic tests were performed under fasting conditions at the end of treatment (5 weeks), and after recovery (15 weeks), and tissue samples were collected after killing.
Plasma CORT and NEFA quantification
Mouse blood was obtained from the tail vein in heparin-coated tubes. Blood was centrifuged to separate plasma from whole blood and stored at −80°C until analysis. Plasma non-esterified fatty acids (NEFAs) were measured according to the manufacturer’s instructions (Zen-Bio, Inc., Research Triangle, NC, USA). Plasma CORT samples were collected during the first hour of light at 08:00 h, and CORT levels were measured by EIA (Arbor Assays). The intra and inter-assay coefficients of variation were 6.3 or 7.5%, and the limit of detection was 16.9 pg/mL.
Liver and skeletal muscle triglyceride content
Frozen liver and quadriceps muscle samples were pulverized under liquid nitrogen, and 100 mg portions were digested in 3 M KOH (65% ethanol) during 1 h at 70°C followed by overnight incubation at room temperature. Once all triglycerides were extracted, samples were diluted to a final concentration of 100 mg tissue in 500 µL Tris–HCl 50 mM and measured according to Triglycerides-LQ Kit’s instructions (Spinreact, Girona, Spain).
11β-HSD activity in white adipose tissue
Small pieces of fresh epididymal adipose tissue were manually homogenized on ice, and homogenates were diluted to obtain a final concentration of 0.05 mg protein/mL. The reaction tubes containing 15 nM of mixed cold [3H]-corticosterone (Perkin Elmer) were covered and incubated at 37°C for 10 or 30 min. Steroids were extracted with ethyl acetate, and the dried pellet was resuspended in ethanol. Hormones were separated by thin layer chromatography in silica gel Polygram SIL N-HR/UV254 (Macherey-Nagel, Düren, Germany) using diclormethane:acetone (4:1) as a mobile phase.
Cold standards of 11-dehydrocorticosterone and corticosterone were used to identify their specific zone migration. Each hormone zone was mixed with scintillation solution Ecoscint H (National Diagnostics, Nottingham, UK) in order to quantify the radioactivity. 11β-HSD dehydrogenase activity was expressed as pmol of 11β-dehydrocorticoterone produced per mg of protein and hour of incubation.
Metabolic assessments
For glucose tolerance test (GTT), mice were fasted for 6 h before blood glucose was measured from tail vein nicks using a glucometer (Glucocard, Arkray, Kyoto, Japan) at 0, 15, 30, 60, 90 and 120 min after d-glucose i.p. injection (2 g/kg). Blood samples were taken at baseline, 15 and 30 min for insulin determination, measured using the Ultra-Sensitive Mouse Insulin ELISA kit (Crystal Chem, Zaandam, Netherlands). The intra- and inter-assay coefficients of variation were ≤10%, and the assay range was 0.1–12.8 ng/mL. The insulin resistance score (HOMA-IR) was calculated using the following formula: fasting plasma glucose (millimolar) × fasting plasma insulin (microunits per liter) divided by 22.5. For insulin tolerance test (ITT), mice were fasted for 6 h before injected with insulin (Humulin R, Lilly) at a dose of 0.5 UI/kg of body weight and blood glucose were measured at the same time points as with GTT.
Histological analysis of adipose tissue
The collected epididymal WAT and interscapular BAT were fixed in 4% formalin solution, dehydrated, paraffin-embedded and sectioned. Sections (5 µm thick) were stained with hematoxylin and eosin, and then examined and photographed under an Olympus microscope (Olympus Iberia). White adipocyte size and distribution were measured for at least 100 individual cells per mice with ImageJ software (National Institutes of Health), as previously described (Parlee et al. 2014). As it was difficult to outline the cells in BAT because of the accumulation of lipid in the cytoplasm; lipid area, normalized to the number of nuclei per field, was quantified in BAT.
Immunofluorescence of macrophages in white adipose tissue
Sections of 5 µm from the paraffin-embedded epididymal adipose tissue were deparaffinized and rehydrated in water. A pre-treatment using proteinase K was performed,
Time in weeks
0 1 2 3 4 5 156 7 8 9 10 11 12 13 14
CORT or HFD treatment Recovery
Figure 1Schematic diagram summarizing the different treatments and periods.
Downloaded from Bioscientifica.com at 12/05/2021 11:42:49AMvia free access

https://doi.org/10.1530/JOE-19-0168https://joe.bioscientifica.com © 2019 Society for Endocrinology
Published by Bioscientifica Ltd.Printed in Great Britain
68CORT overexposure induces long-term adiposity
G García-Eguren et al. 242:2Journal of Endocrinology
and slides were blocked in 5% donkey serum for 1 h at room temperature, followed by overnight incubation with F4/80 antibody (1:100; Abcam) at 4°C. A secondary anti-rat Cy3 antibody (1:200; Jackson Immunoresearch) was incubated for 2 h, and finally Hoescht was stained for nuclei. Images were acquired using a Leica DMI6000B inverted fluorescence microscope (Leica Microsystems).
In vivo nuclear magnetic resonance imaging (NMRI)
Animals were weighed, anesthetized and placed in a supine position. In vivo MRI experiments were conducted on a 7.0 T BioSpec 70/30 horizontal animal scanner (Bruker BioSpin, Ettlingen, Germany). Whole body fat images were acquired by an axial Turbo RARE (Rapid Acquisition with Relaxation Enhancement) sequence without suppressing the fat signal. Adipose tissue compartments were segmented semi-automatically using the image analysis software ITK-SNAP, version 3.4.0 (Yushkevich et al. 2006). Briefly, the operator manually placed foreground seeds in the AT depots, and an algorithm then determined the boundary between total adipose tissue (TAT) and other tissues based on voxel intensity threshold. Segmentations in a three-plane view were interactively reviewed until the segmentation was satisfactory. From TAT volume segmentation, the visceral adipose tissue (VAT) volume was manually segmented as the white adipose depots inside the well-defined parietal peritoneum. The subcutaneous adipose tissue (SAT) volume was calculated as the difference between the TAT and VAT volumes. Volumes of the different adipose compartments were calculated by multiplying the number of segmented voxels by the voxel volume resolution. A density factor of 0.915 g/mL was used to convert fat volumes into fat mass (Bidar et al. 2012).
RNA extraction and real-time PCR
Total RNA was extracted from epididymal adipose tissue using RNeasy Lipid Tissue Mini Kit (Qiagen) and reverse-transcribed into cDNA with a SuperScript™ III Reverse Transcriptase (Invitrogen), according to the manufacturer’s instructions. Real-time PCR was performed using predesigned TaqMan primers and probes (Applied Biosystems) on an Applied Biosystems 7900HT real-time PCR system. The data were analyzed with TBP mRNA as the internal control, using the cycle threshold (2−ΔΔCt) method. Based on the Ct values adipose expression of TBP, mRNA was not affected by CORT or HFD treatment.
Statistical analysis
Statistical analyses were performed using one-way or two-way ANOVAs with Tukey’s post hoc correction (GraphPad Prism). Data are presented as the mean ± s.e.m. Differences were considered statistically significant at P < 0.05.
Results
HFD or CORT treatment induced reversible changes in bodyweight and food or water intake
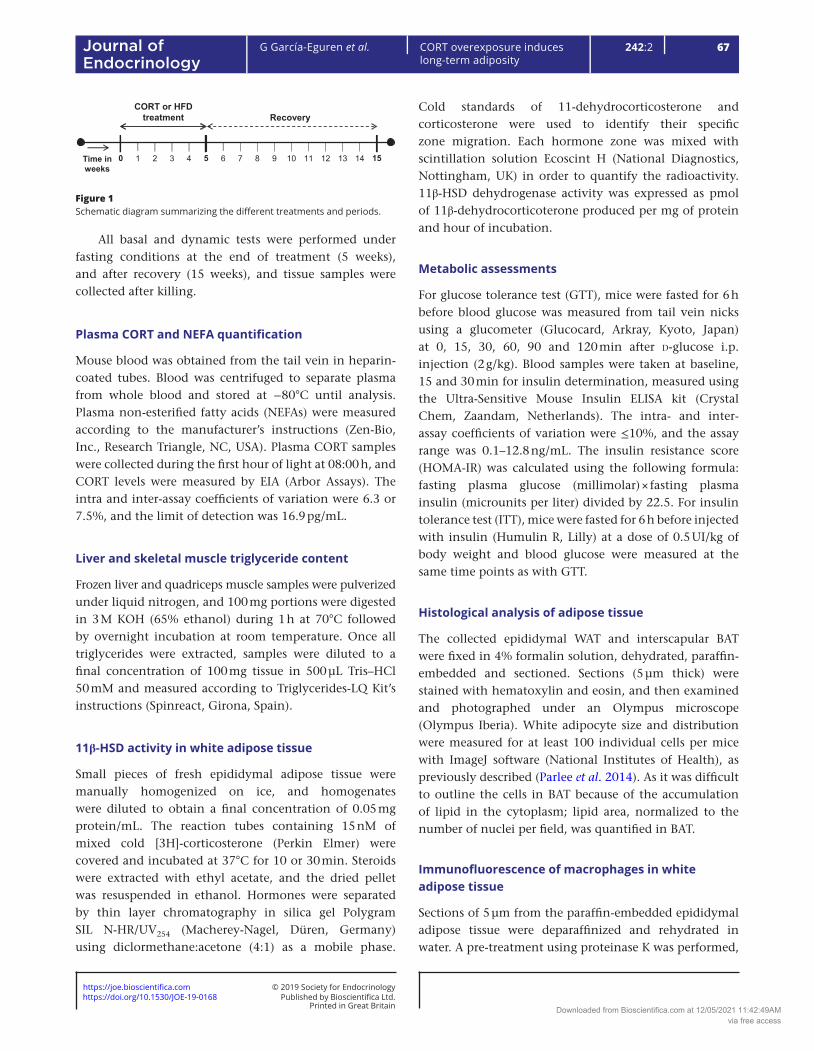
Both groups, treated with HFD or CORT in the drinking water for five consecutive weeks, showed an increase in bodyweight gain (+29.7% for HFD and +19.8% for CORT group, Fig. 2A) compared to the VEH group, although only the HFD group reach statistical significance at the end of the treatment. After that, the removal of HFD or CORT, respectively, resulted in a deceleration of bodyweight gain until both groups were comparable to the VEH group at the end of the recovery period. CORT treatment rapidly increased water intake (with properly adjusted CORT dose) from week one until the end of treatment (+90.9% vs VEH, Fig. 2B), achieving significant differences when compared with VEH and HFD groups; nevertheless, these differences disappeared during the recovery period. As expected, HFD caused a significant increase in caloric intake during treatment (+41.5% vs VEH at 5 weeks, Fig. 2C). Similarly, CORT treatment significantly increased caloric intake from week 2 until the end of treatment due to hyperphagia (+15.5% vs VEH, Fig. 2C), as compared to the VEH group. HFD induced a progressive caloric intake increase during treatment, whereas CORT-induced food intake increase was maintained stable, resulting in a final significant difference between both groups at the end of treatment (+22.4% HFD vs CORT, Fig. 2C). After treatment, food intake normalized at week 9 for both treated groups and did not differ from VEH for the remainder of the experiment (Fig. 2C).
Plasma CORT levels, adipose tissue 11β-HSD activity and expression were transiently increased in the CORT-treated group
To probe animal model reversibility, we measured circulating CORT levels at the end of treatment and at the end of the recovery period. As expected, CORT administration induced a significant increment, up to five-fold or six-fold, on plasmatic CORT levels during treatment compared to HFD or VEH group, respectively (Fig. 2D).
Downloaded from Bioscientifica.com at 12/05/2021 11:42:49AMvia free access
https://doi.org/10.1530/JOE-19-0168https://joe.bioscientifica.com © 2019 Society for Endocrinology
Published by Bioscientifica Ltd.Printed in Great Britain
69
Research
G García-Eguren et al. CORT overexposure induces long-term adiposity
242:2Journal of Endocrinology
After the gradual washout of CORT administration and the end of the 10-week recovery period, circulating CORT levels of CORT-treated mice, returned to basal HFD or VEH levels (Fig. 2D). As GC effects depend not only upon circulating levels but also on tissue-specific metabolism by 11β-HSD enzymes, we determined their activity and expression in the epididymal white adipose tissue depot. The CORT-treated group presented a significant increase in 11β-HSD activity at the end of treatment compared to HFD or VEH (+7.37-fold or +2.9-fold respectively, Fig. 2E); however, after the recovery period the activity normalized to VEH levels. By contrast, as reported in other studies (Morton et al. 2004, Man et al. 2011), HFD treatment tended to negatively affect 11β-HSD activity although no statistically significant differences were observed at these time points (Fig. 2E).
Gene expression levels were determined in order to specifically assess the expression of the 11β-HSD1 enzyme in the epididymal depot. In consonance with the elevated 11β-HSD activity reported, CORT treatment significantly increased 11β-HSD1 mRNA levels (up to three-fold
compared to VEH, Fig. 2F), whereas gene expression at the end of the recovery period presented similar levels among all groups. HFD treatment did not have any effect on gene expression at these time points.
Insulin resistance state was persistent long term in the CORT-treated group but not in the HFD group
In order to evaluate the interrelated metabolic state of glucose and insulin in CORT- or HFD-treated groups, glucose tolerance and insulin resistance parameters were analyzed (Fig. 3). As expected after treatment, the HFD group showed glucose intolerance (Fig. 3B and H), impaired insulin sensitivity (Fig. 3A and G), hyperglycemia and elevated HOMA-IR levels when compared to VEH (Table 1). However, insulin response pattern during GTT was similar to the VEH group (Fig. 3C). Following the recovery period, glucose tolerance (Fig. 3E and H), HOMA-IR (Table 1) and insulin sensitivity normalized to VEH levels (Fig. 3D and G). CORT-treated mice displayed
Figure 2Effects of CORT or HFD treatment on body weight, water intake, food intake and CORT metabolism are reversible. (A) Body weight gain (n = 10–16 mice/group), (B) water intake and (C) food intake were measured weekly (n = 4 cages/group: 5 mice/cage). (D) Plasma corticosterone, (E) 11b-HSD activity and (F) 11β-HSD1 mRNA expression levels were measured at the end of treatment and recovery periods (n = 4–15 mice/group/time). Data are expressed as the means ± s.e.m. Two-way ANOVA followed by Tukey post hoc test. aP < 0.05, bP < 0.01, cP < 0.001 versus VEH. 1P < 0.05, 2P < 0.01, 3P < 0.001 versus HFD.
Weeks of experiment
Bod
yw
eigh
tgai
n(g
)
0 1 2 3 4 5 7 9 11 13 150
2
4
6
8
10
12
1
a
a
a
Cor
ticos
tero
ne(n
g/m
l)
Treatment Recovery0
50
100
150
200
250
300 c3
11b H
SD1
mRN
Aex
pres
sion
(A.U
.)Treatment Recovery
0
1
2
3
4
5
b2
11bH
SDac
tivity
(pm
ol/m
gpr
ot·h
)
Treatment Recovery0
100
200
300
400
500
c3
HFDVEH
CORT
VEHHFDCORT
A
D
B C
E F
Weeks of experimentW
ater
inta
ke(m
l/day
·mou
se)
0 1 2 3 4 5 7 9 11 13 150
2
4
6
8
10
12
c2
c3
c3c3 c3
Weeks of experiment
Food
inta
ke(K
cal/d
ay· m
ouse
)
0 1 2 3 4 5 7 9 11 13 156
8
10
12
14
16
18
3 ba b a2
b
c c cc
a
a
Table 1 CORT treatment induces long-term increased plasma insulin and HOMA-IR levels.
TimePlasma glucose (mg/dL) Plasma insulin (ng/mL)
VEH HFD CORT VEH HFD CORT
Treatment 123.06 ± 5.39 165.75 ± 9.40 102.50 ± 6.554 0.70 ± 0.05 0.85 ± 0.11 15.12 ± 3.05d4
Recovery 121.56 ± 4.37 112.67 ± 7.18 104.67 ± 3.48 0.67 ± 0.05 0.78 ± 0.10 1.08 ± 0.08b1
HOMA-IR
VEH HFD CORTTreatment 5.37 ± 0.53 8.70 ± 1.61 86.32 ± 15.68d4
Recovery 4.87 ± 0.37 5.14 ± 0.48 6.93 ± 0.62a1
Data are expressed as group means ± s.e.m. (n = 9–16 mice/group/time). One-way ANOVA and post hoc Tukey test with aP < 0.05, bP < 0.01, cP < 0.001, dP < 0.0001 versus VEH. 1P < 0.05, 2P < 0.01, 3P < 0.001, 4P < 0.0001 versus HFD group.
Downloaded from Bioscientifica.com at 12/05/2021 11:42:49AMvia free access

https://doi.org/10.1530/JOE-19-0168https://joe.bioscientifica.com © 2019 Society for Endocrinology
Published by Bioscientifica Ltd.Printed in Great Britain
70CORT overexposure induces long-term adiposity
G García-Eguren et al. 242:2Journal of Endocrinology
significantly enhanced glucose clearance and decreased fasting plasma glucose (Fig. 3B, H and Table 1) compared to VEH. These results could be explained due to the remarkable basal hyperinsulinemia and the corresponding insulin response to GTT during CORT treatment (Fig. 3C, I and Table 1), despite the severe insulin resistance observed in this group (Fig. 3A and G). As a result, HOMA-IR score was significantly increased up to 16-fold versus VEH, or 9-fold versus HFD, at the end of the treatment period in the CORT-treated group (Table 1). Removal of CORT administration resulted in normalization of glucose tolerance (Fig. 3E and H) and fasting glucose compared to the VEH and HFD groups (Table 1). Interestingly, sustained decrease of insulin sensitivity was statistically significant at the end of recovery compared with VEH (Fig. 3D and G). Although the magnitude of change decreased after CORT removal and the insulin response to GTT was similar to VEH (Fig. 3F and I), HOMA-IR and insulin levels at baseline were significantly elevated at the end of the recovery period when compared with VEH or HFD groups (Table 1). Thus, CORT treatment not only induced more deleterious effects on insulin sensitivity during treatment but also resulted in more persistent long-term effects compared to the HFD group.
Circulating free fatty acids and liver lipid content changes were reversible in HFD- and CORT-treated animals, whereas muscle lipid content remained increased in the CORT group
To further analyze the metabolic tissues involved in CS disease, we measured the quadriceps mass and TAG content, circulating NEFA levels and liver weight and TAG content (Table 2). As expected, CORT treatment significantly induced skeletal mass loss (−36.95% vs VEH or −24.67% vs HFD) and tended to increase liver weight at the end of treatment. In the HFD group, the liver and quadriceps absolute weight was similar to the VEH group (data not shown) and presented differences after normalization to the % of total body weight, as shown in Fig. 2A. However, these alterations observed during treatment in the HFD or CORT groups reverted at the end of the recovery period until normalized to VEH group levels.
As expected with this phenotype following treatment, NEFA, muscle and liver TAG content were also significantly elevated in the CORT group compared to VEH (Table 2). Similarly, HFD treatment induced a significant increase in muscle and liver TAG content during treatment when
Figure 3Metabolic test analysis of mice treated with HFD or CORT at the end of treatment and recovery. Normalized intraperitoneal insulin tolerance tests (ITT) at the end of treatment (A) and recovery (D) with the respective area under the curve of each time period (G) (n = 5–10 mice/group). Normalized intraperitoneal glucose tolerance tests (GTT) at the end of treatment (B) and recovery (E) with the respective area under the curve of each time period (H) (n = 5 mice/group). Insulin response pattern during GTT at the end of treatment (C) and recovery (F) with the respective area under the curve (I) (n = 4–5 mice/group). Data are expressed as the means ± s.e.m. Two-way ANOVA followed by Tukey post hoc test. aP < 0.05, bP < 0.01, cP < 0.001, versus VEH. 1P < 0.05, 2P < 0.01, 3P < 0.001, versus HFD.
GTT - Treatment
Minutes
Glu
cose
(%ba
sall
evel
s)
0 15 30 60 1200
100
200
300
400
b3
a
c3
c
b33
GTT - Recovery
Minutes
Glu
cose
(%ba
sall
evel
s)
0 15 30 60 1200
100
200
300
400
c3
ITT
AU
C(r
elat
ive
toVE
H)
Treatment Recovery0.0
0.5
1.0
1.5
2.0c2
b
ITT - Treatment
Minutes
Glu
cose
(%ba
sall
evel
s)
0 15 30 60 1200
20
40
60
80
100
120
c1c2
b
c3
a
c1
ITT - Recovery
Minutes
Glu
cose
(%ba
sall
evel
s)
0 15 30 60 1200
20
40
60
80
100
120
aa b
a
GTT
AU
C(r
elat
ive
toVE
H)
Treatment Recovery0.0
0.5
1.0
1.5 c
c3
HFDVEH
CORT
E
B
HFDVEH
CORT
H
A
D
G
VEHHFDCORT
Insulin GTT - Treatment
Minutes
Insu
lin(%
basa
llev
els)
0 15 300
50
100
150
200
250
c2
Insulin GTT - Recovery
Minutes
Insu
lin(%
basa
llev
els)
0 15 300
50
100
150
200
250
Insulin GTT
AU
C(r
elat
ive
toVE
H)
Treatment Recovery0.0
0.5
1.0
1.5
C
F
I
Downloaded from Bioscientifica.com at 12/05/2021 11:42:49AMvia free access

https://doi.org/10.1530/JOE-19-0168https://joe.bioscientifica.com © 2019 Society for Endocrinology
Published by Bioscientifica Ltd.Printed in Great Britain
71
Research
G García-Eguren et al. CORT overexposure induces long-term adiposity
242:2Journal of Endocrinology
compared to the VEH group. After the recovery period, only muscle lipid content in the CORT group remained significantly elevated compared to VEH mice.
Chronic CORT treatment induced reversible lipid accumulation in BAT
Given the known effects of GCs on adipose tissue, interscapular brown adipose tissue (iBAT) mass and histological analyses were evaluated during treatment and after recovery (Fig. 4). HFD treatment had no detectable
effects on iBAT relative weight and lipid accumulation compared to the VEH group (Fig. 4A and C respectively). By contrast, as a result of CORT administration, a significant increase in lipid accumulation (up to 3.39-fold vs VEH and 2.64-fold vs HFD) and clear hypertrophy of brown adipocytes were observed when compared to VEH or HFD groups (Fig. 4B and C). Consequently, iBAT weight was significantly increased after treatment in the CORT group (Fig. 4A). Nevertheless, these effects were reversible and normalized to VEH or HFD group levels at the end of the recovery period (Fig. 4A, B and C).
Table 2 Effects of CORT treatment on muscle, liver and circulating lipids.
TimeLiver weight (% body weight) Liver TAG content (mg TAG/g of tissue)
VEH HFD CORT VEH HFD CORT
Treatment 4.01 ± 0.15 3.58 ± 0.12 4.21 ± 0.102 36.67 ± 3.29 70.09 ± 8.38b 55.86 ± 6.11a
Recovery 4.12 ± 0.12 4.07 ± 0.26 3.92 ± 0.08 38.51 ± 3.21 43.70 ± 8.50 44.38 ± 4.01Quadriceps weight (% body weight) Quadriceps TAG content (mg TAG/g of tissue)
VEH HFD CORT VEH HFD CORTTreatment 0.92 ± 0.05 0.77 ± 0.10a 0.58 ± 0.08c,2 5.87 ± 0.86 11.75 ± 1.20a 18.01 ± 1.98c,1
Recovery 0.87 ± 0.07 0.81 ± 0.05 0.80 ± 0.10 5.27 ± 0.87 7.06 ± 1.43 12.24 ± 2.42a
Non-esterified free fatty acids (mmol/L)
VEH HFD CORTTreatment 0.85 ± 0.08 1.08 ± 0.10 1.80 ± 0.11c,3
Recovery 0.48 ± 0.08 0.40 ± 0.08 0.48 ± 0.05
Data are expressed as group means ± s.e.m. (n = 5–10 mice/group/time). One-way ANOVA and post hoc Tukey test with aP < 0.05, bP < 0.01, cP < 0.001 versus VEH. 1P < 0.05, 2P < 0.01, 3P < 0.001 versus HFD group.
Figure 4CORT-induced BAT adiposity is transient. (A) Interscapular brown adipose tissue (iBAT) mass relative to bodyweight during treatment and recovery (n = 10–15 mice/group/time). (B) Histological sections stained with hematoxylin and eosin of iBAT. Scale bar: 40 µm. (C) Lipid area accumulation per brown adipocyte (n = 4–5 mice per group. 50–200 adipocytes per mouse). Data are expressed as the means ± s.e.m. Two-way ANOVA followed by Tukey post hoc test. cP < 0.001 versus VEH. 3P < 0.001 versus HFD.
iBAT
(%of
BW
)
Treatment Recovery0.0
0.2
0.4
0.6
0.8
1.0
1.2
c3
Lipi
d ar
ea / a
dipo
cyte
(µm
2 )
Treatment Recovery0
250
500
750
1000
1250
1500c3
Treatment Recovery
VEH
HFD
CO
RT
VEHHFDCORT
AB
C
Downloaded from Bioscientifica.com at 12/05/2021 11:42:49AMvia free access

https://doi.org/10.1530/JOE-19-0168https://joe.bioscientifica.com © 2019 Society for Endocrinology
Published by Bioscientifica Ltd.Printed in Great Britain
72CORT overexposure induces long-term adiposity
G García-Eguren et al. 242:2Journal of Endocrinology
Epididymal adiposity was increased over the long term only by chronic CORT treatment
As expected, HFD or CORT treatment resulted in a significant increase (up to 2.76-fold or 2.66-fold respectively) of epididymal WAT (eWAT) mass compared to the VEH group (Fig. 5A). In consonance, both treatments induced similar levels of adipocyte hypertrophy (Fig. 5B and C) and showed the same adipocyte size distribution pattern at the end of treatment (Fig. 5D). After the recovery period, the HFD-treated group decreased adipocyte area normalized to VEH levels (Fig. 5B and C), and also the adipocyte size distribution pattern changed until almost overlapping with the VEH group (Fig. 5E). Importantly, although the magnitude of change decreased, only the CORT-treated group maintained a statistically significant increase in eWAT mass when compared with VEH or HFD animals (+70% or +55.78% respectively. Fig. 5A). Moreover, adipocyte hypertrophy continued a long-term increase (Fig. 5B and C), and the adipocyte size
distribution pattern is almost indistinguishable between treatment and after the recovery period (Fig. 5E).
HFD or CORT treatment resulted in a sustained SAT mass increase, whereas VAT mass only remained significantly elevated in the CORT-treated group after recovery
In order to determine whole body adipose tissue distribution and evolution during treatment or recovery, total fat mass was segmented into SAT or VAT and quantified in the same mice at these two time points by NMRI (Fig. 6C). As expected, HFD or CORT treatment induced a marked increase in both SAT (+187.49% and +235.41% respectively) and VAT mass (+155.19% and +163.92% respectively) compared to VEH mice (Fig. 6A and B). After the recovery period, although the magnitude of change decreased in the same way in both groups (Fig. 6D), SAT mass levels remained significantly elevated
Figure 5Epididymal adiposity is increased in the long term only by CORT treatment. (A) Epididymal white adipose tissue (eWAT) mass relative to body weight (n = 10–16 mice/group/time). (B) eWAT sections stained with hematoxylin and eosin. Scale bar: 80 µm. (C) eWAT adipocyte area and (D) treatment or (E) recovery adipocyte area distribution in eWAT (n = 5 mice group/time). Values are expressed as means ± s.e.m. Two-way ANOVA followed by Tukey post hoc test. aP < 0.05, bP < 0.01, cP < 0.001 versus VEH. 1P < 0.05, 2P < 0.01, 3P < 0.001 versus HFD.
Adip
ocyt
ear
ea(µ
m2 )
Treatment Recovery0
1000
2000
3000
4000
c
c
b1
eWAT
(%of
BW)
Treatment Recovery0
1
2
3
4c
c
a1
Treatment Recovery
VEH
HFD
CO
RT
Adipocytes distribution - Treatment
Area (mm2)
%Ad
ipoc
ytes
50010
0015
0020
0025
0030
0035
0040
0045
0050
0055
0060
0065
0070
0075
0080
000
10
20
30
40
c
c
c
c
c
cb1
c
c c
c
c
cb
c c
a
Adipocytes distribution - Recovery
Area (mm2)
%Ad
ipoc
ytes
50010
0015
0020
0025
0030
0035
0040
0045
0050
0055
0060
0065
0070
0075
0080
000
10
20
30
40
b2c3
c1
a a
VEHHFDCORT
HFDVEH
CORT
AB
C
D E
Downloaded from Bioscientifica.com at 12/05/2021 11:42:49AMvia free access

https://doi.org/10.1530/JOE-19-0168https://joe.bioscientifica.com © 2019 Society for Endocrinology
Published by Bioscientifica Ltd.Printed in Great Britain
73
Research
G García-Eguren et al. CORT overexposure induces long-term adiposity
242:2Journal of Endocrinology
in the HFD- and CORT-treated groups (+75.54% and +104.02% respectively. Fig. 6A). Importantly, only CORT-treated mice maintained long-term significant increase of VAT mass (+69.32%) versus VEH. In addition, removal of HFD or CORT treatment induced a different grade of VAT mass loss (−160.87 and −87.74% respectively) between both groups, resulting in a reduction by almost half (45.5%) in the CORT group compared to HFD (Fig. 6E). Thus, CORT treatment induced more persistent and statistically significant changes in VAT compared to the HFD group.
CORT treatment induced persistent macrophage infiltration in VAT
Resident adipose tissue macrophages (ATMs) have important roles in tissue homeostasis and insulin sensitivity regulation. Taking into account our previous results of long-term increased visceral fat accumulation in
CORT-treated mice after the recovery period, we decided to analyze the grade of macrophage infiltration and the inflammatory state of eWAT depot at this time point. HFD-treated mice did not show significant differences in ATM markers compared to VEH (Fig. 7B). By contrast, ATMs infiltration in the CORT group was significantly increased as evidenced by F4/80 immunohistochemistry and mRNA expression (Fig. 7A and B). Both M1 (Itgax) and M2 (Mrc1) macrophage markers were elevated up to 2.16-fold and 1.58-fold, respectively, compared to the VEH group. Ccl2 (MCP-1) gene expression also tended to be altered in the CORT group but did not reach statistical significance at the mRNA level.
Discussion
CS phenotype, resulting from either chronic endogenous hypercortisolism or exogenous prescribed GC treatment,
Figure 6SAT mass remained significantly elevated in CORT and HFD treatments after recovery but only the CORT-treated group resulted in a sustained VAT mass. (A) Subcutaneous adipose tissue (SAT) and (B) VAT mass relative to VEH (n = 5 mice/group/time). (C) 3D reconstruction of whole body fat distribution magnetic resonance images; SAT is represented in yellow and VAT in red. (D) SAT and (E) VAT mass variation relative to VEH between treatment and recovery (n = 5 mice group/time). Values are expressed as means ± s.e.m. Two-way ANOVA (A and B) or one-way ANOVA (D and E) followed by Tukey post hoc test were used. aP < 0.05, bP < 0.01, cP < 0.001 versus VEH. 1P < 0.05 versus HFD.
SAT mass
%ch
ange
from
VEH
Treatment Recovery0
50
100
150
200
250
300
c
c
b
c
VAT mass
%ch
ange
from
VEH
Treatment Recovery0
50
100
150
200
250
300
c c
a
SAT mass variation(∆Treatment - Recovery)
%ch
ange
from
VEH
VEH HFD CORT-400
-300
-200
-100
0
bc
VAT mass variation(∆Treatment - Recovery)
%ch
ange
from
VEH
VEH HFD CORT-200
-150
-100
-50
0
c
a1
VEHHFDCORT
Trea
tmen
tR
ecov
ery
VEH HFD CORT
A B
C
D E
Figure 7Macrophages infiltration in eWAT after recovery. (A) Immunofluorescence images of epididymal white adipose tissue (eWAT); in blue, Hoechst stain, and in red, macrophage antibody F4/80 is shown. (B) eWAT relative mRNA expression of macrophage markers (Adgre1, Mrc1, Itgax and CcI2) (n = 5–10 mice/group/time). Values are expressed as means ± s.e.m. One-way ANOVA followed by Tukey post hoc test. aP < 0.05 versus VEH. 3P < 0.001 versus HFD.
VEH
HFD
CO
RT
Hoechst F4/80 MergeA
mRN
A(A
U)
Adgre1 Mrc1 Itgax Ccl20.0
0.5
1.0
1.5
2.0
2.5
3.0
a
a3
a
B VEHHFDCORT
Downloaded from Bioscientifica.com at 12/05/2021 11:42:49AMvia free access

https://doi.org/10.1530/JOE-19-0168https://joe.bioscientifica.com © 2019 Society for Endocrinology
Published by Bioscientifica Ltd.Printed in Great Britain
74CORT overexposure induces long-term adiposity
G García-Eguren et al. 242:2Journal of Endocrinology
induces a high cardiovascular and metabolic burden during active disease. Moreover, a long time after remission of hypercortisolism in endogenous CS, a metabolic syndrome-like phenotype persists with central obesity, insulin resistance and systemic inflammation (Geer et al. 2012, Wagenmakers et al. 2015, Shah et al. 2017). Clinical data have important limitations in the understanding of mechanisms involved due to the scarce number of patients with pure hypercortisolemic features, and the presence of other multiple confounding factors that can interact in the phenotype during the remission period.
In the present study, we aimed to evaluate the GC persistent metabolic alterations induced during CS on insulin homeostasis and adipose tissue as a target tissue. We used the previously described and non-invasive reversible CS model of Karatsoreos et al. (2010), administrating corticosterone at 100 μg/ml in drinking water during 5 weeks in adult mice, and we prolonged the observational period of recovery. Thereby, we performed the analysis of the remission-phenotype much later after recovery from hypercortisolism, after presuming the achievement of a newly stabilized state of the adrenal axis.
In our study, food intake, plasma corticosterone and 11β-HSD1 adipose tissue activity and expression were increased in the CORT group during active treatment and returned to vehicle values after the recovery period. This finding rules out the possibility that persistent changes in these parameters could be responsible for the long-term metabolic derangements observed in the CORT-treated mice. Surprisingly, during treatment, the CORT group showed significantly decreased fasting glucose levels and improved glucose clearance in the GTT, probably due to the remarkably high insulin levels and the proper insulin response in the GTT. Over the long term, at the end of the recovery period fasting glucose levels tended to remain lower, while glucose clearance was similar to that of the VEH mice. These results were in line with a recent study using the same animal model but in younger mice (3-week-old mice; Kinlein et al. 2017). Nevertheless, differences with other previous studies, which reported hyperglycemia and glucose intolerance using the same animal model (Karatsoreos et al. 2010, Fransson et al. 2013), could be explained by considering the method of CORT dosage. These studies do not report water consumption levels, which is key, since CORT administration to mice is through water. Thus, we assume that these studies do not adjust the CORT dose based on the average water intake of each cage during treatment, whereas in our work, CORT dosage was readjusted as much as possible to maintain
a controlled and constant CORT exposure in each cage. Therefore, CORT effects on glucose metabolism seem to be dependent on CORT administration pattern and age.
Consistent with similar published reports (Karatsoreos et al. 2010, Auvinen et al. 2013, Kinlein et al. 2017), CORT treatment caused hyperinsulinemia, impaired insulin sensitivity and increased HOMA-IR levels. Intriguingly, over the long term, at the end of the recovery period, insulin resistance and hyperinsulinemia was still maintained in the CORT group, although to a lesser degree than during active treatment. This insulin sensitivity impairment after recovery period was probably due, at least in part, to the persistently increased WAT and lipid content in skeletal muscle (Geer et al. 2014, Hamrick et al. 2016). Moreover, it is worth noting that recent data from studies using the same adult mice model of CS report a marked positive effect on β-cell mass until 4 weeks after remission of hypercortisolism (Courty et al. 2019), despite the toxic effects due to GC previously observed in vitro (Lambillotte et al. 1997, Rafacho et al. 2014). Compared with CORT, HFD treatment induced glucose intolerance and insulin resistance, which fits with the increased adiposity and lipid content in liver and skeletal muscle (Winzell et al. 2007, Montgomery et al. 2017). However, the switch to chow diet during the recovery period normalized glucose and insulin homeostasis to VEH group levels. Thus, in our work, we evidenced that not only were these CORT-induced insulin alterations more potent than HFD-induced ones during the same period of treatment, but also they were more persistent long term.
Adipose tissue is one of the most important metabolic target tissues of GC actions, however, understanding the deleterious changes induced during the active hypercortisolemic state that persists after long-term remission of Cushing syndrome remains a challenge. Various in vivo and in vitro studies show that GCs affect BAT activity, in part due to increased lipid content per adipocyte (Cassano et al. 2012, Van DenBeukel et al. 2015, Doig et al. 2017). We observed a clear increase in iBAT weight and a hypertrophy of brown adipocytes caused by increased lipid content during CORT treatment in mice. However, as restoration at the histological level after the recovery period suggested normalization of iBAT tissue in the CORT group, we did not pursue further analysis regarding function or gene expression profile in iBAT tissue, leaving this matter open to further studies.
Regarding WAT, CORT- and HFD-treated mice exhibited similar increases in epididymal adiposity and in adipocyte hypertrophy, in agreement with previous studies in reversible CS mice models (Karatsoreos et al. 2010,
Downloaded from Bioscientifica.com at 12/05/2021 11:42:49AMvia free access

https://doi.org/10.1530/JOE-19-0168https://joe.bioscientifica.com © 2019 Society for Endocrinology
Published by Bioscientifica Ltd.Printed in Great Britain
75
Research
G García-Eguren et al. CORT overexposure induces long-term adiposity
242:2Journal of Endocrinology
Auvinen et al. 2013, Kinlein et al. 2017). Moreover, during treatment, adipocyte size distribution in both groups was practically indistinguishable; however, after the recovery period in the HFD-treated group, adiposity and adipocyte area and distribution returned to VEH group levels. Interestingly, persistent adiposity, adipocyte hypertrophy and size distribution patterns were maintained only in CORT-treated mice.
To our knowledge, there are only two previous studies regarding long-term body composition changes after CORT administration using this animal model. The first one only report long-lasting changes in fat mass in mice treated with CORT plus HFD (45%) but not in CORT-treated mice on a chow diet (Auvinen et al. 2013). These results could be explained due to the fact that they use half the CORT dose (50 µg/mL) for only 4 weeks of treatment followed by 8 weeks of recovery, and that, when using such a low dose, long-lasting changes are only observable by adding a HFD diet. The second one use the same CORT dose (100 µg/mL) that we employed in the present study, but it do not readjust the dose to keep a constant CORT exposure over the treatment period; furthermore, phenotype analysis was performed at the halfway time point during the recovery period (four weeks of treatment + four weeks of recovery) using two different aged mice groups (nine-week-old adults and three-week-old ‘young adolescent’ mice) (Kinlein et al. 2017). Significantly increased body fat mass was seen only in the young adolescent mice after the recovery period, although a slight increase was also observed in the adult mice. In the study in question, the authors suggested an age-dependent influence on long-lasting changes in body fat mass.
Our mice were 7 weeks at the beginning of treatment, an age commonly considered as corresponding to young adulthood. This makes us to wonder if the previously discussed differences in CORT dosage patterns and minor age differences could possibly explain, in part, why metabolic GC target tissues exposed to high and controlled doses of GCs at a younger age and over a sufficient period of time could be more sensitive to this pathologic condition, while retaining the metabolic memory of CORT treatment for much longer.
Given the persistent increased adiposity in the present study, we further analyzed adipose tissue distribution between SAT and VAT during treatment and after recovery using MRI. Both HFD and CORT treatments induced, in a similar way, a notable enlargement of SAT and VAT mass compared to the VEH group, which is in concordance with previous reports in which total body fat mass is increased (Kinlein et al. 2017) and both, SAT and VAT are enlarged
after CORT administration (Gounarides et al. 2008). Following recovery, SAT mass loss was similar between HFD and CORT groups, even though SAT mass differences were still statistically significant in both groups as compared to the VEH mice. However, VAT mass variation between time points was significantly less pronounced in the CORT mice compared to the HFD mice, resulting in a significantly increased VAT mass at the end of recovery only in the CORT group. These depot-specific differences during long-term recovery could be explained due to intrinsic adipose depot properties; for example, VAT is a more GC-sensitive and metabolically-active adipose depot than SAT, with an increased response to GC action and higher GC receptor expression levels. (Rebuffé-Scrive et al. 1990, Hocking et al. 2010).
Moreover, persistent VAT mass enlargement in the CORT group resulted in an increased grade of both M1 and M2 macrophage infiltration and elevated MCP-1 expression. Taken together with the observed adipocyte hypertrophy and altered adipocytes size pattern, these changes suggested a potentially deleterious effect for macrophage infiltration and hypoxia on visceral adipocytes and systemic insulin sensitivity (Nawaz et al. 2017). All these findings were in line with previous studies in humans in which persisting visceral-abdominal fat accumulation and increased pro-inflammatory profile are reported after long-time remission of endogenous Cushing syndrome (Barahona et al. 2009, Wagenmakers et al. 2015, Shah et al. 2017).
In summary, GC deleterious effects on metabolic memory seem to directly depend on GC dosage pattern, mouse age at the beginning of treatment and the time point of analysis after remission. In this sense, the selection of an adequate time point in order to overcome the period of endogenous adrenal axis suppression during early remission after CS is essential to avoid false normalization of metabolic target tissue function.
Thus, we evidenced that not only CORT-induced alterations in insulin homeostasis were more potent than HFD-induced ones during the same period of treatment, but also that these changes were more persistent long term. Moreover, we demonstrated that CORT treatment caused more long-lasting, potentially permanent VAT enlargement, associated with increased macrophage infiltration, than HFD treatment.
Deeper knowledge is therefore needed to elucidate the mechanisms and the metabolic crosstalk between the altered insulin resistance, increased visceral adiposity and ectopic fat accumulation that persists long-term after the remission of chronic hypercortisolism.
Downloaded from Bioscientifica.com at 12/05/2021 11:42:49AMvia free access

https://doi.org/10.1530/JOE-19-0168https://joe.bioscientifica.com © 2019 Society for Endocrinology
Published by Bioscientifica Ltd.Printed in Great Britain
76CORT overexposure induces long-term adiposity
G García-Eguren et al. 242:2Journal of Endocrinology
Declaration of interestThe authors declare that there is no conflict of interest that could be perceived as prejudicing the impartiality of the research reported.
FundingThis work was supported by a grant of the Carlos III Health Institute of MINECO, Spain (FIS PI_1500859), and by an AGAUR grant (2016FI_B00702) from the Government of Catalonia, Spain.
AcknowledgementsThe authors would like to thank: Ramon Gomis from the Diabetes Laboratory of IDIBAPS for all the support provided in the setup of the study; Kimberly Katte of the Fundation Astra Zeneca Chair in Diabetes Innovation for linguistic assistance; Guadalupe Soria and Xavier Lopez of the IDIBAPS Experimental Imaging Research (7T MRI) Unit team and Ainhoa García Alamán for technical assistance with metabolic test and animal handling.
ReferencesAranda G, Fernandez-Ruiz R, Palomo M, Romo M, Mora M, Halperin I,
Casals G, Enseñat J, Vidal O, Diaz-Ricart M, et al. 2018 Translational evidence of prothrombotic and inflammatory endothelial damage in Cushing syndrome after remission. Clinical Endocrinology 88 415–424. (https://doi.org/10.1111/cen.13521)
Auvinen HE, Coomans CP, Boon MR, Romijn JA, Biermasz NR, Meijer OC, Havekes LM, Smit JWA, Rensen PCN & Pereira AM 2013 Glucocorticoid excess induces long-lasting changes in body composition in male C57BI/6J mice only with high-fat diet. Physiological Reports 1 e00103. (https://doi.org/10.1002/phy2.103)
Barahona MJ, Sucunza N, Resmini E, Fernández-Real JM, Ricart W, Moreno-Navarrete JM, Puig T, Farrerons J & Webb SM 2009 Persistent body fat mass and inflammatory marker increases after long-term cure of Cushing’s syndrome. Journal of Clinical Endocrinology and Metabolism 94 3365–3371. (https://doi.org/10.1210/jc.2009-0766)
Bidar AW, Ploj K, Lelliott C, Nelander K, Winzell MS, Bottcher G, Oscarsson J, Storlien L & Hockings PD 2012 In vivo imaging of lipid storage and regression in diet-induced obesity during nutrition manipu lation. American Journal of Physiology: Endocrinology and Metabolism 303 E1287–E1295. (https://doi.org/10.1152/ajpendo.00274.2012)
Cassano AE, White JR, Penraat KA, Wilson CD, Rasmussen S & Karatsoreos IN 2012 Anatomic, hematologic, and biochemical features of C57BL/6NCrl mice maintained on chronic oral corticosterone. Comparative Medicine 62 348–360.
Colao A, Pivonello R, Spiezia S, Faggiano A, Ferone D, Filippella M, Marzullo P, Cerbone G, Siciliani M & Lombardi G 1999 Persistence of increased cardiovascular risk in patients with Cushing’s disease after five years of successful cure. Journal of Clinical Endocrinology and Metabolism 84 2664–2672. (https://doi.org/10.1210/jcem.84.8.5896)
Courty E, Besseiche A, Do TTH, Liboz A, Aguid FM, Quilichini E, Buscato M, Gourdy P, Gautier JF, Riveline JP, et al. 2019 Adaptive β-cell neogenesis in the adult mouse in response to glucocorticoid-induced insulin resistance. Diabetes 68 95–108. (https://doi.org/10.2337/db17-1314)
Doig CL, Fletcher RS, Morgan SA, Mccabe EL, Larner DP, Tomlinson JW, Stewart PM, Philp A & Lavery GG 2017 HSD1 modulates the set point of brown adipose tissue response to glucocorticoids in male mice. Endocrinology 158 1964–1976. (https://doi.org/10.1210/en.2016-1722)
Fardet L, Petersen I & Nazareth I 2012 Risk of cardiovascular events in people prescribed glucocorticoids with iatrogenic Cushing’s syndrome cohort study. BMJ 345 1–13. (https://doi.org/10.1136/bmj.e4928)
Fransson L, Franzén S, Rosengren V, Wolbert P, Sjöholm Å & Ortsäter H 2013 Β-cell adaptation in a mouse model of glucocorticoid-induced metabolic syndrome. Journal of Endocrinology 219 231–241. (https://doi.org/10.1530/JOE-13-0189)
Geer EB, Shen W, Strohmayer E, Post KD & Freda PU 2012 Body composition and cardiovascular risk markers after remission of Cushing’s disease: a prospective study using whole-body MRI. Journal of Clinical Endocrinology and Metabolism 97 1702–1711. (https://doi.org/10.1210/jc.2011-3123)
Geer EB, Islam J & Buettner C 2014 Mechanisms of glucocorticoid-induced insulin resistance: focus on adipose tissue function and lipid metabolism. Endocrinology and Metabolism Clinics of North America 43 75–102. (https://doi.org/10.1016/j.ecl.2013.10.005)
Gounarides JS, Korach-André M, Killary K, Argentieri G, Turner O & Laurent D 2008 Effect of dexamethasone on glucose tolerance and fat metabolism in a diet-induced obesity mouse model. Endocrinology 149 758–766. (https://doi.org/10.1210/en.2007-1214)
Hamrick MW, McGee-Lawrence ME & Frechette DM 2016 Fatty infiltration of skeletal muscle: mechanisms and comparisons with bone marrow adiposity. Frontiers in Endocrinology 7 69. (https://doi.org/10.3389/fendo.2016.00069)
Henneicke H, Gasparini SJ, Brennan-Speranza TC, Zhou H & Seibel MJ 2014 Glucocorticoids and bone: local effects and systemic implications. Trends in Endocrinology and Metabolism 25 197–211. (https://doi.org/10.1016/j.tem.2013.12.006)
Hocking SL, Wu LE, Guilhaus M, Chisholm DJ & James DE 2010 Intrinsic depot-specific differences in the secretome of adipose tissue, preadipocytes, and adipose tissue-derived microvascular endothelial cells. Diabetes 59 3008–3016. (https://doi.org/10.2337/db10-0483)
Karatsoreos IN, Bhagat SM, Bowles NP, Weil ZM, Pfaff DW & McEwen BS 2010 Endocrine and physiological changes in response to chronic corticosterone: a potential model of the metabolic syndrome in mouse. Endocrinology 151 2117–2127. (https://doi.org/10.1210/en.2009-1436)
Kinlein SA, Shahanoor Z, Romeo RD & Karatsoreos IN 2017 Chronic corticosterone treatment during adolescence has significant effects on metabolism and skeletal development in male C57BL6/N mice. Endocrinology 158 2239–2254. (https://doi.org/10.1210/en.2017-00208)
Lambillotte C, Gilon P & Henquin JC 1997 Direct glucocorticoid inhibition of insulin secretion. An in vitro study of dexamethasone effects in mouse islets. Journal of Clinical Investigation 99 414–423. (https://doi.org/10.1172/JCI119175)
Lönn L, Kvist H, Ernest I & Sjöström L 1994 Changes in body composition and adipose tissue distribution after treatment of women with Cushing’s syndrome. Metabolism: Clinical and Experimental 43 1517–1522. (https://doi.org/10.1016/0026-0495(94)90010-8)
Man TY, Michailidou Z, Gokcel A, Ramage L, Chapman KE, Kenyon CJ, Seckl JR & Morton NM 2011 Dietary manipulation reveals an unexpected inverse relationship between fat mass and adipose 11β-hydroxysteroid dehydrogenase type 1. American Journal of Physiology: Endocrinology and Metabolism 300 E1076–E1084. (https://doi.org/10.1152/ajpendo.00531.2010)
Montgomery MK, Brown SHJ, Mitchell TW, Coster ACF, Cooney GJ & Turner N 2017 Association of muscle lipidomic profile with high-fat diet-induced insulin resistance across five mouse strains. Scientific Reports 7 13914. (https://doi.org/10.1038/s41598-017-14214-1)
Morgan SA, McCabe EL, Gathercole LL, Hassan-Smith ZK, Larner DP, Bujalska IJ, Stewart PM, Tomlinson JW & Lavery GG 2014 11β-HSD1 is the major regulator of the tissue-specific effects of circulating glucocorticoid excess. PNAS 111 E2482–E2491. (https://doi.org/10.1073/pnas.1323681111)
Morton NM, Ramage L & Seckl JR 2004 Down-regulation of adipose 11β-hydroxysteroid dehydrogenase type 1 by high-fat feeding in mice: a potential adaptive mechanism counteracting metabolic disease. Endocrinology 145 2707–2712. (https://doi.org/10.1210/en.2003-1674)
Downloaded from Bioscientifica.com at 12/05/2021 11:42:49AMvia free access

https://doi.org/10.1530/JOE-19-0168https://joe.bioscientifica.com © 2019 Society for Endocrinology
Published by Bioscientifica Ltd.Printed in Great Britain
77
Research
G García-Eguren et al. CORT overexposure induces long-term adiposity
242:2Journal of Endocrinology
Nawaz A, Aminuddin A, Kado T, Takikawa A, Yamamoto S, Tsuneyama K, Igarashi Y, Ikutani M, Nishida Y, Nagai Y, et al. 2017 CD206+ M2-like macrophages regulate systemic glucose metabolism by inhibiting proliferation of adipocyte progenitors. Nature Communications 8 286. (https://doi.org/10.1038/s41467-017-00231-1)
Overman RA, Yeh JY & Deal CL 2013 Prevalence of oral glucocorticoid usage in the United States: a general population perspective. Arthritis Care and Research 65 294–298. (https://doi.org/10.1002/acr.21796)
Parlee SD, Lentz SI, Mori H & MacDougald OA 2014 Quantifying size and number of adipocytes in adipose tissue. Methods in Enzymology 537 93–122. (https://doi.org/10.1016/B978-0- 12-411619-1.00006-9)
Pirlich M, Biering H, Gerl H, Ventz M, Schmidt B, Ertl S & Lochs H 2002 Loss of body cell mass in Cushing’s syndrome: effect of treatment. Journal of Clinical Endocrinology and Metabolism 87 1078–1084. (https://doi.org/10.1210/jcem.87.3.8321)
Pivonello R, Faggiano A, Lombardi G & Colao A 2005 The metabolic syndrome and cardiovascular risk in Cushing’s syndrome. Endocrinology and Metabolism Clinics of North America 34 327–339, viii. (https://doi.org/10.1016/j.ecl.2005.01.010)
Rafacho A, Ortsäter H, Nadal A & Quesada I 2014 Glucocorticoid treatment and endocrine pancreas function: implications for glucose homeostasis, insulin resistance and diabetes. Journal of Endocrinology 223 R49–R62. (https://doi.org/10.1530/JOE-14-0373)
Rebuffé-Scrive M, Brönnegard M, NILSSON A, Eld J, Gustafsson JA & Björntorp P 1990 Steroid hormone receptors in human adipose tissues. Journal of Clinical Endocrinology and Metabolism 71 1215–1219. (https://doi.org/10.1210/jcem-71-5-1215)
Rockall AG, Sohaib SA, Evans D, Kaltsas G, Isidori AM, Monson JP, Besser GM, Grossman AB & Reznek RH 2003 Computed tomography assessment of fat distribution in male and female patients with Cushing’s syndrome. European Journal of Endocrinology 149 561–567. (https://doi.org/10.1530/eje.0.1490561)
Schakman O, Kalista S, Barbé C, Loumaye A & Thissen JP 2013 Glucocorticoid-induced skeletal muscle atrophy. International Journal of Biochemistry and Cell Biology 45 2163–2172. (https://doi.org/10.1016/j.biocel.2013.05.036)
Shah N, Ruiz HH, Zafar U, Post KD, Buettner C & Geer EB 2017 Proinflammatory cytokines remain elevated despite long-term remission in Cushing’s disease: a prospective study. Clinical Endocrinology 86 68–74. (https://doi.org/10.1111/cen.13230)
Sharma ST, Nieman LK & Feelders RA 2015 Cushing’s syndrome: epidemiology and developments in disease management. Clinical Epidemiology 7 281–293. (https://doi.org/10.2147/CLEP.S44336)
Ueland T, Kristo C, Godang K, Aukrust P & Bollerslev J 2003 Interleukin-1 receptor antagonist is associated with fat distribution in endogenous Cushing’s syndrome: a longitudinal study. Journal of Clinical Endocrinology and Metabolism 88 1492–1496. (https://doi.org/10.1210/jc.2002-021030)
van den Beukel JC, Boon MR, Steenbergen J, Rensen PCN, Meijer OC, Themmen APN & Grefhorst A 2015 Cold exposure partially corrects disturbances in lipid metabolism in a male mouse model of glucocorticoid excess. Endocrinology 156 4115–4128. (https://doi.org/10.1210/en.2015-1092)
van Staa TP, Leufkens HG, Abenhaim L, Begaud B, Zhang B & Cooper C 2000 Use of oral corticosteroids in the United Kingdom. QJM 93 105–111. (https://doi.org/10.1093/qjmed/93.2.105)
Vegiopoulos A & Herzig S 2007 Glucocorticoids, metabolism and metabolic diseases. Molecular and Cellular Endocrinology 275 43–61. (https://doi.org/10.1016/j.mce.2007.05.015)
Wagenmakers M, Roerink S, Gil L, Plantinga T, Smit J, Netea-Maier R & Hermus A 2015 Persistent centripetal fat distribution and metabolic abnormalities in patients in long-term remission of Cushing’s syndrome. Clinical Endocrinology 82 180–187. (https://doi.org/10.1111/cen.12639)
Wagenmakers MAEM, Roerink SHPP, Schreuder THA, Plantinga TS, Holewijn S, Thijssen DHJ, Smit JW, Rongen GA, Pereira AM, Wagenmakers AJM, et al. 2016 Vascular health in patients in remission of Cushing’s syndrome is comparable with that in BMI-matched controls. Journal of Clinical Endocrinology and Metabolism 101 4142–4150. (https://doi.org/10.1210/jc.2016-1674)
Winzell MS, Magnusson C & Ahrén B 2007 Temporal and dietary fat content-dependent islet adaptation to high-fat feeding-induced glucose intolerance in mice. Metabolism: Clinical and Experimental 56 122–128. (https://doi.org/10.1016/j.metabol.2006.09.008)
Yu J, Yu B, He J, Zheng P, Mao X, Han G & Chen D 2014 Chronic glucocorticoid exposure-induced epididymal adiposity is associated with mitochondrial dysfunction in white adipose tissue of male C57BL/6J mice. PLoS ONE 9 e112628. (https://doi.org/10.1371/journal.pone.0112628)
Yushkevich PA, Piven J, Hazlett HC, Smith RG, Ho S, Gee JC & Gerig G 2006 User-guided 3D active contour segmentation of anatomical structures: significantly improved efficiency and reliability. NeuroImage 31 1116–1128. (https://doi.org/10.1016/j.neuroimage.2006.01.015)
Received in final form 10 May 2019Accepted 20 May 2019Accepted Preprint published online 20 May 2019
Downloaded from Bioscientifica.com at 12/05/2021 11:42:49AMvia free access