christmas colors : colormorph distribution of
TRANSCRIPT

UC BerkeleyStudent Research Papers, Fall 2006
TitleChristmas Colors : Colormorph Distribution of Spirobranchus Giganteus Pallas 1766 on Moorea, French Polynesia
Permalinkhttps://escholarship.org/uc/item/12t2697d
AuthorSong, Daniel S.
Publication Date2006-12-01
eScholarship.org Powered by the California Digital LibraryUniversity of California

CHRISTMAS COLORS: COLORMORPH DISTRIBUTION OF SPIROBRANCHUS GIGANTEUS PALLAS 1766 ON MOOREA,
FRENCH POLYNESIA
DANIEL S. SONG
Environmental Sciences, University of California, Berkeley 94720 USA
Abstract. Spirobranchus giganteus Pallas 1766 is an obligate associate of coral. This study focused on the distribution of five branchial crown colormorphs (Blue, Brown, Marigold, Purple, and White) on eight coral species (Acropora I, Acropora II, Porites I, Porites II, Porites III, Porites IV, Porites V, Porites VI) by quadrat sampling method. White was the most abundant colormorph, representing 24.0% of the total. Blue was the least abundant colormorph at 9.5% of the total. There were no significant differences in Shannon‐Weiner Diversity Index (H’) of colormorphs between coral species. Also, relative colormorph abundance did not differ significantly between coral species or between the Front and Back positions. Only Blue and Marigold differed significantly in relative abundance between Top, Midde, and Bottom positions. Findings support a colormorph distribution of colormorphs. There are two possible explanations: 1) mortality and selection effects on distribution and 2) phenotypic plasticity, a combination of genetic and environmental factors contributing to the occurrence of certain phenotypes.
Key words: density; coral species; suspension feeding; phenotype; branchial crown;
Polychaeta
INTRODUCTION
Coral reefs are complex systems that provide a multitude of habitats for associates, which use the tissue and skeleton as substrate (Frank et al. 1995). Risk et al. (2001) define “associate” as sessile invertebrates that live in or on the coral. Spirobranchus giganteus Pallas 1766 is one of the most conspicuous and colorful of coral associates.
Spirobranchus giganteus is an obligate associate of coral and found in tropical and sub tropical waters (Marsden and Meeuwig 1990). Hove (1970) divided S. giganteus into two sub‐species: Spirobranchus giganteus corniculatus Grube 1862 in the Pacific and Spirobranchus giganteus giganteus Pallas 1766 in the Atlantic and Caribbean.
Spirobranchus giganteus is sequentially hermaphroditic and is a broadcast spawner
(Kurpiyanova et al. 2001). The pelagic larvae stage lasts between 9 and 12 days (Marsden 1987). The adult worm can live between 10 ‐ 35 years (Smith 1985) with a few surviving over 40 years (Nishi and Nishihira 1996, Nishi and Kikuchi 1996). The species does not burrow, instead it builds a calcareous tube on the surface and the coral colony grows around it (Smith 1984).
As active suspension feeding adults, the paired branchial crowns protrude from the margins of the tube. Each crown is composed of successively smaller tentacle whorls layered with 4 ‐ 6 spiraling about a central stalk (Fig. 1). Tentacles consist of radioles with cilia laden pinnules. The cilia serve to whip water in between the pinnules (Strathmann et al. 1984).
Branchial crowns appear in a wide variety of colormorphs (e.g. blue, brown, marigold,

purple, and white). The downward slope and colorful appearance may be the source of its common name,“Christmas Tree worm”.
The presence of branchial crowns and tubes facilitate the flow of water and excrements about the coral surface (Mokady et al. 1998). Spirobranchus giganteus also protects coral against predation by irritating the underside of starfish Acanthaster planci Linnaeus 1758, inducing it to move (Devantier et al. 1986).
Ben‐Tzvi et al. (2006) found that 1) S. giganteus colonized area was kept alive and continued to grow while areas adjacent to colonization died and 2) that coral tissue surrounding S. giganteus showed no predatory damage and the colonies recovered.
Previous distribution studies of S. giganteus show that distribution among coral is non‐random and worm densities are higher on certain coral species (Hunte et al. 1990a, Marsden 1990, Marsden and Meeuwig 1990).
Distribution patterns of sessile invertebrates on coral may be affected by mortality rates (Connell 1985). Spirobranchus giganteus tends to cluster with increasing number of worms per colony (Dai and Yang 1995).
Hunte et al. (1990b) found that the more heavily colonized the coral, the larger the worm; larger worms were found to possess increased gamete production. The density of S. giganteus were found to increase with depth (Floros et al. 2005).
FIG. 1. Picture of a Blue S. giganteus colormorph. a) spiraling whorl, b) Individual tentacles with radioles and cilia, c) central stalk and d) operculum.
a
b
c
d

Colormorphs of S. giganteus have not been extensively studied as in the case of other organisms, such as snails. Snail shell colormorphs were found to vary with abiotic environmental factors such as nutrients (Slotow and Ward 1997) and stresses, such as high temperatures (Etter 1988).
One approach to clarifying the occurrence of different Spirobranchus giganteus phenotypes is to investigate the distribution of branchial crown colormorphs. The primary purpose of this study is to study the distribution of five branchial crown colormorphs. This paper focuses on the abundance and diversity of colormorphs at different coral positions and species.
METHODS
Site description
The distribution of branchial crown colormorphs was studied on Moorea, French Polynesia at two different sties: Temae public beach (Temae) and near the Sheraton Hotel (Sheraton; Fig. 2). The survey was conducted during October and November 2006.
Temae beach (‐17°27ʹ56ʹʹN, ‐151°30ʹ34ʹʹW) is a government protected public beach, within the reef crest. The depth varied between 1 ‐ 3 m.
The Sheraton (‐17°28’49”N, ‐149°50’50”W) is within the Plan de Gestion de l’Espace Maritime (PGEM) Marine Protected Area (MPA). Sampling took place between 100 ‐ 140 m from the Sheraton Hotel and depths varied between 2 ‐ 4 m.
Sampling
Quadrats were 3 x 3 m in size and marked
off with weighted flags. The quadrats were placed randomly at Temae Beach by kayak, inside the reef crest and at the Sheraton Hotel site by motorboat. To standardize quadrats, the bottom‐right corner was set first and both the bottom and top edges were lined up as closely parallel to the reef crest as possible.
Coral‐host
Eight different coral species were examined. Coral colonies were included if more than half the coral was present within the quadrat. They were only recorded if live worms were present. Individual coral colonies were determined as separate if they were not visibly attached at the base.
The water temperature at the base, the largest diameter, the tallest height, and GPS location (Garmin 76Cx) of each coral were recorded. Corals were identified to genus offsite with digital photographs and a field guide (Allen and Steen 1994, Vernon 2000). Photographs were taken with a Casio X‐Slim and a Casio underwater housing unit.
Colormorph count
Worm presence was determined by visual evidence of living S. giganteus inside their tube. Branchial crown colormorphs were only recorded once, only when at least one crown was exposed.
When possible, I positioned myself down‐current to reduce turbulence. Positions on corals were standardized by three equal horizontal and two equal vertical planes (Top, Middle, Bottom; Front, Back). The Front of the
FIG. 2. Sheraton Hotel and Temae public beach, Moorea, French Polynesia.

coral was determined as the plane facing the reef crest.
Colormorph designation
A preliminary survey of branchial crown colormorphs at Temae Beach determined the five colormorphs to study: Blue, Brown, Marigold, Purple, and White (Fig. 3). Colormorphs were designated visually, on‐site, by the majority color. Each worm was only counted once and in only one colormorph category.
Variations in colormorph patterns were great. I observed instances where
colormorphs were not homogenous. Crowns occurred in various shades and tints (i.e. light purple, dark yellow, tan) and patterns (i.e. banded, striped, dotted).
Statistical analysis
My question was aimed toward patterns
on the island as a whole, thus I did not compare sites on the island.
Surface area of coral colonies was estimated to = 2 π r2, under the assumption that the shape of coral colonies are approximately hemispherical (Dahl 1973). The radius was an average of the height and
A. B.
C. D. E.
FIG. 3. Colormorph categories: A) Marigold, B) White C) Brown D) Blue and E) Purple.

TABLE 1. Summary of worms and coral surveyed: coral species abundance (n), total surface area (SA, m2), and S. giganteus abundance
Species n SA Colormorph White Brown Purple Marigold Blue
Acropora I 1 9.12 7 4 1 18 3 Acropora II 2 2.47 9 13 6 8 3 Porites I 4 5.17 38 28 32 28 13 Porites II 8 16.67 46 42 36 39 14 Porites III 5 7.13 23 14 33 39 19 Porites IV 6 17.12 83 88 59 54 27 Porites V 5 10.79 53 49 47 75 24 Porites VI 4 9.14 59 53 51 53 23 Total 35 77.61 318 291 265 314 126
of half the diameter. Shannon‐Weiner (Shannon and Weiner
1953) Diversity Index, H’, was calculated for colormorphs at several levels: individual corals; the front and back; and the top, middle, and bottom. The Shapiro‐Wilk W‐statistic was used to test the worm and coral surface area data for normality.
Parametric analyses were not possible as the data were non‐normally distributed and could not be normalized through transformations.
Kruskal‐Wallis (K‐W) test was used to calculate significant differences in mean values to determine: if H’ of individual corals differed between species; if the relative abundances differed between positions (Front & Back; Top, Middle, & Bottom); if the relative abundance of colormorphs and abundance of worms differed between positions (Front‐Back; Top‐Middle‐Bottom); and if the relative colormorph abundance for each corals differed between coral species.
If significant differences were found, Tukey’s test was used to detect where the differences occurred.
Spearman’s rank correlation coefficient analyses were used to determine whether surface area correlated with relative abundance of colormorphs.
Kruskal‐Wallis tests, Tukey’s tests, and
Spearman’s correlation analyses were performed using JMP 5.1 (SAS Institute 2003).
RESULTS
Distribution of S. giganteus
A total of 1,314 S. giganteus were recorded on 8 species of coral (Table 1). The distribution of worms was not normal (S‐W: P < 0.001). White (318 individuals) was most abundant and Blue (126) was least abundant. Porites I had the highest, 26.9 (worms / m2) and Acropora I had the lowest overall density, 3.62 (worms / m2).
Coral species
There were no significant differences in
relative abundances of colormorphs between coral species (K‐W: P > 0.24). There were no significant differences in H’ of colormorphs between coral species (P = 0.09; Appendix A).
Distribution of coral surface area was not normal (S‐W: P < 0.001). Using Spearman’s rank correlation coefficient, Brown was the only colormorph not significantly correlated with surface area (Brown rs=0.13, P = 0.460; Table 2).

TABLE 3. Probability values (P) for the K‐W test to determine significant differences in relative
colormorph abundances between positions (mean ± SE).
Color P Position
Front Back Blue 0.957 0.076 ± 0.063 0.112 ± 0.182 Brown 0.559 0.232 ± 0.162 0.212 ± 0.188
Marigold 0.841 0.196 ± 0.140 0.185 ± 0.136 Purple 0.633 0.230 ± 0.191 0.211 ± 0.198 White 0.837 0.266 ± 0.190 0.251 ± 0.166
TABLE 2. Spearman’s rank correlation between colormorph abundance and coral surface area, Rho and probability values (P).
Colormorph Spearman’s rank correlation
Rho P
Blue 0.3891 0.021
Brown 0.1292 0.460 Marigold 0.4257 0.012
Purple 0.4144 0.013
White 0.5485 0.001
Front‐Back Position The relative worm abundance differed significantly between the front and back positions (K‐W: P < 0.001; Table 3). The front was colonized more ( x ˉ = 0.59) than the Back ( x ˉ = 0.41). The relative abundances of each colormorph did not differ significantly between the Front and Back (White, P = 0.84; Brown, P = 0.56; Marigold, P = 0.84; Purple, P = 0.633; Blue, P = 0.96).
Top‐Middle‐Bottom Position Relative abundance of worms differed significantly Top to Bottom (K‐W: P < 0.001). The Top position was colonized the most followed by the Middle and both were different from the Bottom position, the least colonized ( x ˉ = 0.42, x ˉ = 0.38, & x ˉ = 0.20,
respectively). The relative abundances of Blue and Marigold (P = 0.002 and P = 0.008 respectively) differed significantly from Top to Bottom, both colormorphs favoring the Top and Middle positions over the Bottom. The relative abundances of the other colormorphs were not significantly different at each position (Fig. 4).
DISCUSSION
In summary, this study found that there
were no differences 1) in H’ between coral species and 2) in relative colormorph abundance.
The findings of this study suggest that there are no differences in colormorph diversity as well as abundance of colormorphs on coral.
Mortality and phenotypic plasticity may explain this study’s findings of colormorph distribution.
Death is a possible explanation for the apparent random distribution of colormorphs. Mortality by density‐independent means, such as predation and habitat constraints, may affect distribution of marine sessile invertebrates (Connell 1985).
Like the polymorphic Littorina sp., a Mangrove snail, which was found to change in colormorph frequencies over time (Hughes and Mather 1985, Johannesson and Ekendahl 2002) a similar change in distribution also studied in (Argiope keyserlingi), the St.

TABLE 4. Probability values (P) for K‐W test to determine which colormorphs differed between coral positions (Top, Middle, and Bottom).
Colormorph P Position
Top Middle Bottom Blue 0.002 0.086 ± 0.010 0.101± 0.091 0.037± 0.076 Brown 0.879 0.218 ± 0.171 0.200 ± 0.167 0.225 ± 0.260
Marigold 0.008 0.262 ± 0.219 0.199 ± 0.176 0.135 ± 0.176 Purple 0.900 0.212 ± 0.195 0.196 ± 0.154 0.240 ± 0.234 White 0.567 0.223 ± 0.169 0.276 ± 0.208 0.278 ± 0.262
Andrew’s Cross spider (Hoese et al. 2006). In both cases, distributions of colormorphs were attributed to predation.
S. giganteus predation has not been well documented. On a few occasions, I did observe damaged branchial crowns as well as completely missing or partially broken opercula. This could indicate possible attempts at predation by.
The abiotic aspects of the environment may also have an effect on colormorph distribution. Sessile invertebrates were found to influence the flow of water around coral surface areas, thus affecting nutrition available to the worms (Ben‐Tzvi et al. 2006).
This may lead to the accessibility of certain nutrients, such as n the case of a desert landsnail (Trochoidea simulata). Slotow and Ward (1997) found that CaCO3 abundance was a predictor to the frequency of shell colormorphs in T. simulata.
Environmental stress is also a potential factor influencing polymorphism. In the case of Nucella lapillus, an intertidal snail, high energy wave action and temperature was related to increased polymorphism, where as sheltered snails exhibited a higher frequency of white shells (Etter 1988).
The depths of the coral colonies in both Temae and Sheraton were relatively low in comparison to some worms found in excess of 18 m (Floros et al. 2005). The close proximity to the surface of the water may influence the fauna composition as well as subject coral and worms to abiotic factors such as sun light,
current speeds, and current direction. The consideration of both environmental
and genetic factors may also be a possible explanation for. Hadfield et al. (2006) found that phenotypes were poor proxies for insight in genetic patterns for color of Parus caeruleus (Tit bird) but found presence of common environmental factors to be important.
Phenotypic plasticity may help explain the dichotomy between the environment and genetics. Phenotypic plasticity is the consideration of both nature (genetics) and nurture (environment) to explain variations in phenotype (Pigliucci 2001).
In the example of Daphnia magna, depending on the abundance of food, D. magna produced varying clutch sizes, responding to environmental stresses. D. magna would produce larger clutch sizes when food was scarce and smaller clutch sizes for when food was abundant (Ebert et al. 1993).
As it relates to S. giganteus, there is the possibility that colormorphs may not be any one single factor influencing phenotype. It could be influenced by a polymorphic genotype, environmental factors, or even both.
The possibility exists that the cause of branchial crown colormorphs could be dictated by a combination of abiotic and genetic factors beyond the scope of this study.
The findings of this study calls prompts a meaningful question in regards to phenotype distributions: are colormorphs heritable?
A more proximal study could be conducted to determine spatial distribution

patterns at the individual coral level (i.e. nearest neighbor method) done similarly with worm‐density studies (Dai and Yang 1995).
The next step in uncovering the pattern of colormorph distribution would be to investigate the genetic factors. This would shed light as to the mechanisms that may be responsible for S. giganteus branchial crown colormorphs and for their distribution.
ACKNOWLEDGEMENTS
I would like to thank:
Jere Lipps and Carole Hickman for their constant availability, Vince Resh for a source of endless enthusiasm, Jamie Bartolome for his statistical prowess, and Brent Mishler for his encouragement.
Elena Kupriyanova for graciously offering her help for a curious undergraduate.
Liz Perotti, Alison Purcell, and Erica Spotswood for all their help.
Carol Chang and Tom Hata for their valued company and assistance throughout.
And the rest of my colleagues for their help and lifetime supply of memories.
LITERATURE CITED
Allen, G. R., and R. Steen. 1994. Indo‐Pacific Coral Reef Field Guide. Tropical Reef Research, Singapore. Ben‐Tzvi, O., S. Einbinder, and E. Brokovich.
2006. A beneficial association between a polychaete worm and a scleractinian coral? Coral Reefs 25:98.
Connell, J. H. 1985. The consequences of variation in initial settlement vs. post‐settlement mortality in rocky intertidal communities. Journal of Experimental Marine Biology and Ecology 93:11‐45.
Dahl, A. L. 1973. Surface area in ecological analysis, quantification of benthic coral reef algae. Marine Biology 23:239‐249.
Dai, C.‐F., and H.‐P. Yang. 1995. Distribution of Spirobranchus giganteus corniculatus (Hove) on the coral reefs of southern Taiwan. Zoological Studies 34:117‐125.
Devantier, L. M., R. E. Reichelt, and R. H. Bradbury. 1986. Does Spirobranchus giganteus protect host Porites from predation by Acanthaster planci: predator pressure as a mechanism of coevolution. Marine Ecology Progress Serie 32:307‐310.
Ebert, D., L. Yampolsky, and S. C. Stearns. 1993. Genetics of life history in Daphnia magna. I. herbitatbilities at two food levelss. Heredity 70:335‐343.
Etter, R. J. 1988. Physiological Stress and Color Polymorphism in the Intertidal snail Nucella Lapillus. Evolution 42:660‐680.
Floros, C. D., M. G. Samways, and B. Armstrong. 2005. Polychaete (Spirobranchus giganteus) loading on South African corals. Aquatic Conservation 15:289‐298.
Frank, U., I. Brickner, B. Rinkevich, Y. Loya, R. P. M. Bak, Y. Achituv, and M. Ilan. 1995. Allogeneic and xenogeneic interactions in reef‐building corals may induce tissue growth without calcification. Marine Ecology Progress Series 124:181‐188.
Hadfield, J. D., A. Nutall, D. Osorio, and I. P. F. Owens. 2006. Testing the phenotypic gambit: phenotypic, genetic and environmental correlations of colour. Journal of Evolutionary Biology:1‐9.
Hoese , F. J., E. A. J. Law, D. Rao, and M. E. Herberstein1). 2006. Distinctive yellow bands on a sit‐and‐wait predator: prey attractant or camouflage? Behavior 143:763‐781.
Hove, H. A. 1970. Serpulinae (Polychaeta) from the Caribbean. 1. The genus Spirobranehus. Studies of Fauna of Curacao and Other Caribbean Islands 32:1‐57.
Hughes, J. M., and P. B. Mather. 1985. Evidence for Predation as a Factor in Determining Shell Color Frequencies in a Mangrove Snail Littorina SP. (Prosobranchia: Littorinidae. Evolution 40:68‐77.
Hunte, W., B. E. Conlin, and J. R. Marsden. 1990a. Habitat selection in the tropical polychaete Spirobranchus giganteus . 1. Distribution on corals. Marine Biology 104:87‐92.
Hunte, W., J. R. Marsden, and B. E. Conlin. 1990b. Habitat selection in the tropical polychaete Spirobranchus giganteus . 3. Effects of coral species on body size and body proportions. Marine Biology 104:101‐107.
Johannesson, K., and A. Ekendahl. 2002. Selective predation favouring cryptic individuals of marine snails (Littorina). Biological Journal of the Linnean Society 76: 134‐144
Kurpiyanova, E., E. Nishi, H. A. t. Hove, and A. V. Rzhavsky. 2001. Life‐history patterns in serpulimorph polychaetes: ecological and evolutionary perspectives. Oceanography and Marine Biology 39:1‐102.
Marsden, J. R. 1987. Coral preference behaviour by planktotrophic larvae of Spirobranchus giganteus corniculatus (Serpulidae: Polychaeta). Coral Reefs 6:71‐74.
Marsden, J. R., B. E. Conlin, and W. Hunte. 1990. Habitat selection in the tropical polychaete Spirobranchus giganteus . 2. Larval preferences for corals. Marine Biology 104:93‐99.
Marsden, J. R., and J. Meeuwig. 1990. Preferences of planktotrophic larvae of the tropical serpulid Spirobranchus‐giganteus pallas for exudates of corals from a Barbados West Indies reef. Journal of Experimental Marine Biology and Ecology 137:95‐104.
Mokady, O., Y. Loya, and B. Lazar. 1998. Ammonium contribution from boring bivalves to their coral host ‐ a mutualistic symbiosis? Marine Ecology Progress Series 169:295‐301.
Nishi, E., and T. Kikuchi. 1996. Preliminary observation of the tropical serpulid Spirobranchus giganteus corniculatus Pallas. Publications from the Amakusa Marine Biological Laboratory, Kyushu University 12:45‐54.
Nishi, E., and M. Nishihira. 1996. Age‐estimation of the Christmas tree worm Spirobranchus giganteus (Polychaeta, Serpulidae) living buried in the coral skeleton from the coral‐growth band of the host coral. Fisheries Science 62:400‐403.
Pigliucci, M. 2001. Phenotypic Plasticity. John Hopkins University Press, Baltimore, MD.
Risk, M. J., J. M. Heikoop, E. N. Edinger, and M. V. Erdmann. 2001. The assessment ʹtoolboxʹ: Community‐based reef evaluation methods coupled with geochemical techniques to identify sources of stress. Bulletin of Marine Science 69:443‐458.
Shannon, C. E., and W. Weiner. 1953. The Mathematical Theory of Communication. University of Ilinois Press, Urbana, USA.
Slotow, R., and D. Ward. 1997. Habitat Constraints on Shell‐Colour Variation of a Desert Landsnail, Trochoidea Simulata. The Journal of Molluscan Studies 63:197‐205.
Smith, R. 1984. Development and settling of Spirobranchus‐giganteus polychaeta serpulidae. Pages 461‐483 in P. A. Hutchings, editor. First International Polychaete Conference. The Linnean Society of New South Wales, Sydney.
Smith, R. 1985. Photoreceptors of serpulid polychaetes. James Cook University of North Queensland, Townsville, Australia.
Strathmann, R. R., R. A. Cameron, and M. F. Strathmann. 1984. Spirobranchus‐giganteus breaks a rule for suspension feeders. Journal of Experimental Marine Biology and Ecology 79:245‐249.
Vernon, J. E. N. 2000. Corals of the World. Australian Institute of Marine Science, Townsville, Australia.
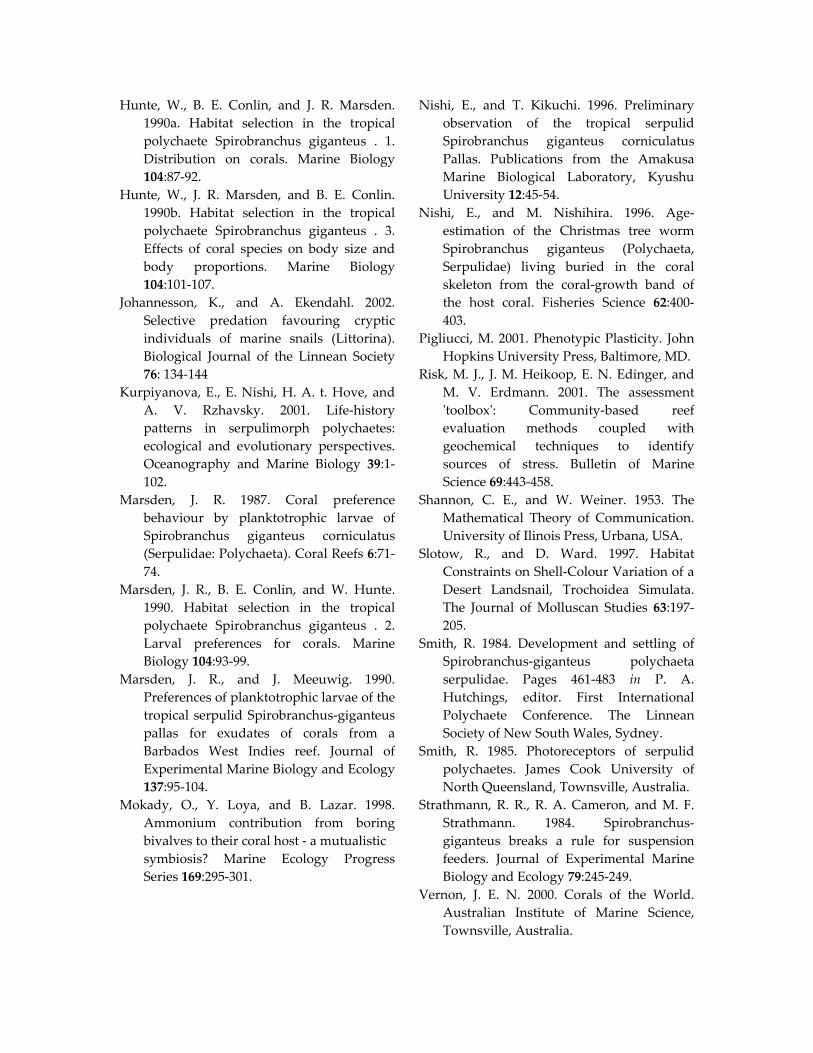
APPENDIX A
Abundance of each coral species (n), mean H’ value for total coral species with standard deviation.
Species n Mean Standard deviation Acropora I 1 1.178 * Acropora II 2 1.360 0.148 Porites I 4 1.200 0.407 Porites II 8 1.392 0.0959 Porites III 5 1.127 0.358 Porites IV 6 1.403 0.119 Porites V 5 1.497 0.032 Porites VI 4 1.540 0.019
*only 1 individual
APPENDIX B
Abundance of each coral species (n), mean H’ value (Mean) for total coral species with standard deviation.
Colormorph K‐W Tukeyʹs Test Results
Acropora I
Acropora II
Porites I
Porites II
Porites III
Porites IV
Porites V
Porites VI
Blue 0.6657 Brown 0.2450
Marigold 0.2395 No Significant Differences Found Purple 0.5402 White 0.7258
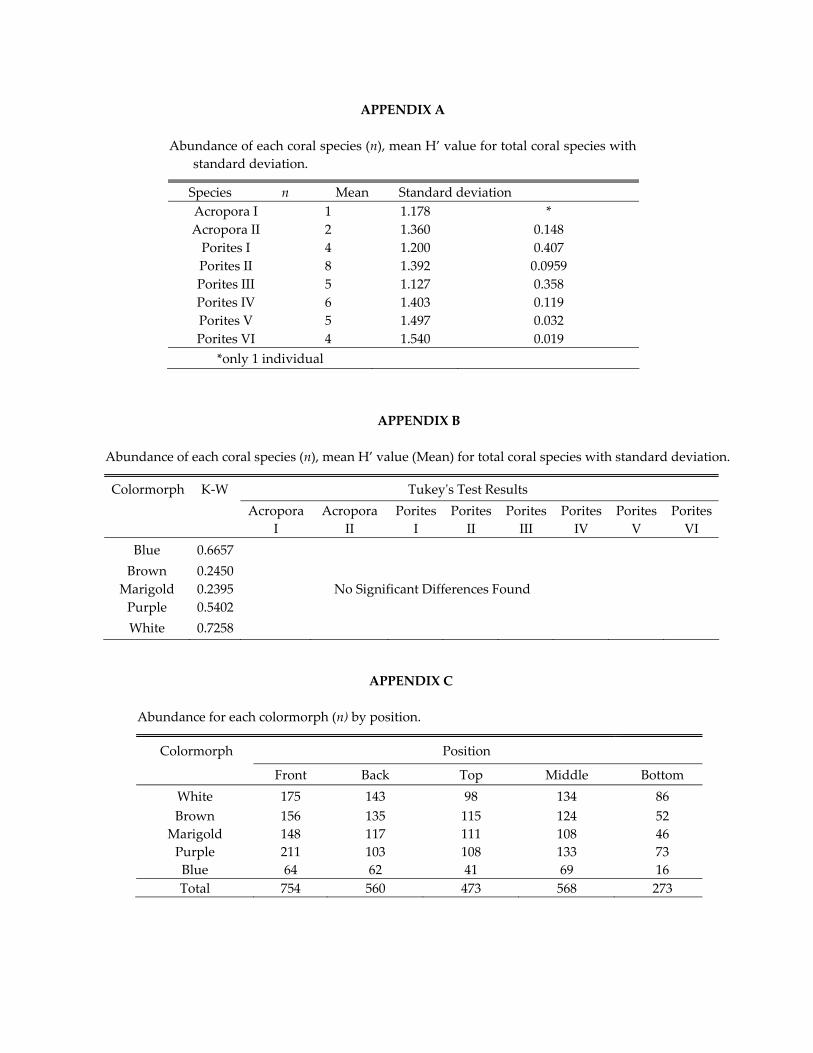
APPENDIX C
Abundance for each colormorph (n) by position.
Colormorph Position
Front Back Top Middle Bottom White 175 143 98 134 86 Brown 156 135 115 124 52
Marigold 148 117 111 108 46 Purple 211 103 108 133 73 Blue 64 62 41 69 16 Total 754 560 473 568 273

APPENDIX D
Site maps of Temae public beach and Sheraton Hotel with coral reef boundary and individual coral.

APPENDIX E
Various colormorphs of S. giganteus corniculatus.