chris smith director of policy, 2018 transit funding and ... · intermittent teleworking increased...
TRANSCRIPT

2018 Transit Funding and Reforms
Virginia Association of Counties
August 16, 2018
Chris SmithDirector of Policy, Communications,
and Legislative Affairs
1VACO8/16/2018
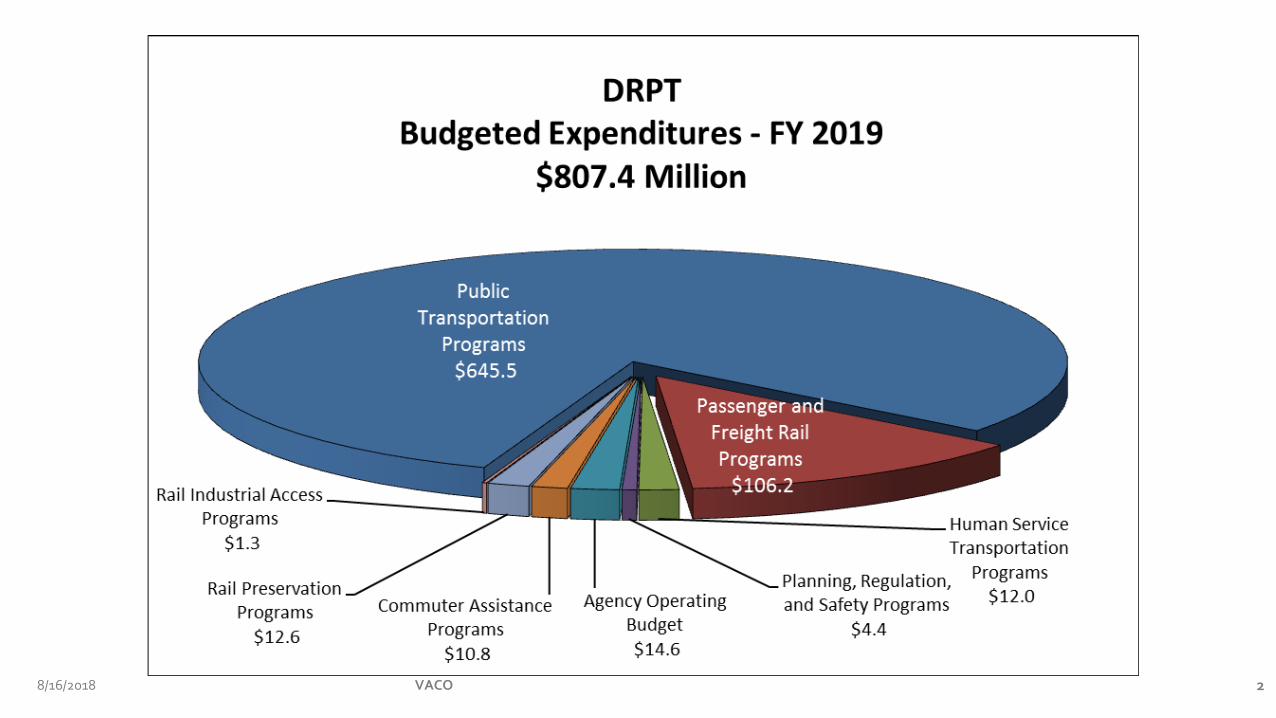
FY 19-FY 24 SYIP
VACO 28/16/2018
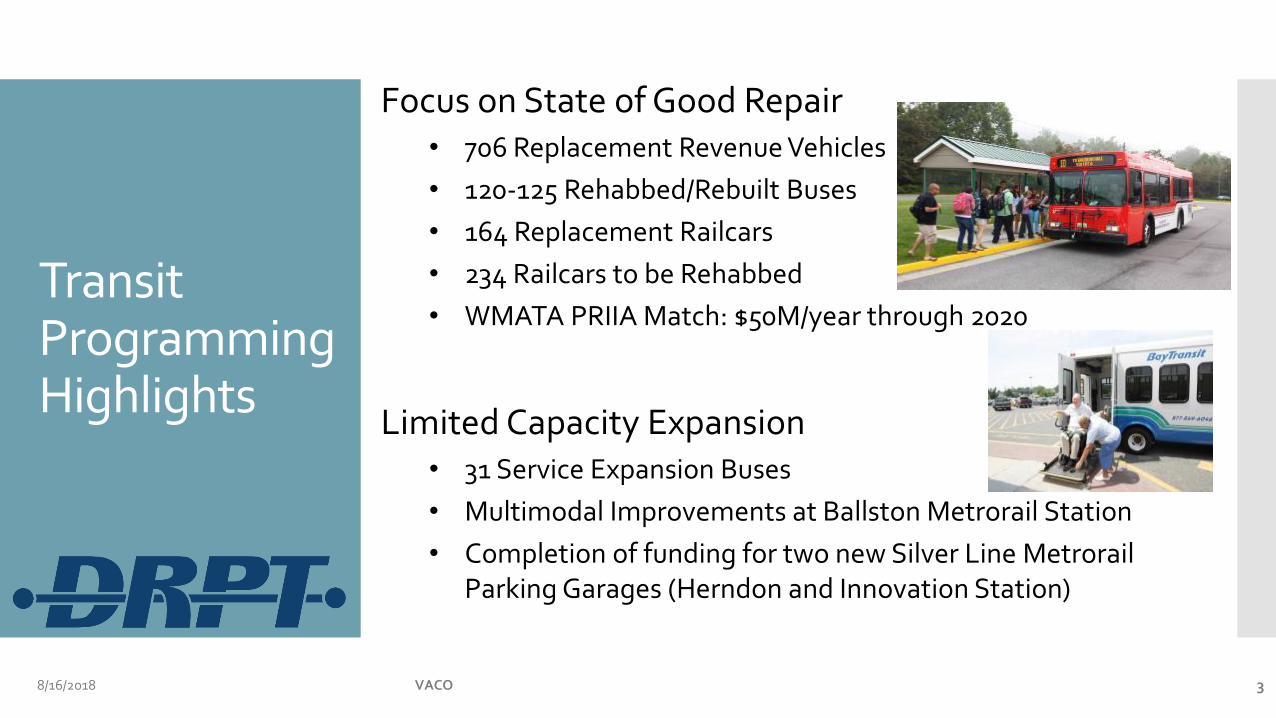
TransitProgrammingHighlights
Focus on State of Good Repair• 706 Replacement Revenue Vehicles
• 120-125 Rehabbed/Rebuilt Buses
• 164 Replacement Railcars
• 234 Railcars to be Rehabbed
• WMATA PRIIA Match: $50M/year through 2020
Limited Capacity Expansion• 31 Service Expansion Buses
• Multimodal Improvements at Ballston Metrorail Station
• Completion of funding for two new Silver Line Metrorail Parking Garages (Herndon and Innovation Station)
VACO8/16/2018 3

TransitProgrammingHighlights
VACO
Safety Enhancements
• Light Rail Advance Warning Intersection Control System (HRT)
Facility/Fleet Improvements
• Bus Stop & Shelter Improvements (NVTC –Arlington/Fairfax Counties)
• Design of new Bus Operations & Maintenance Facility (NVTC –
Arlington County)
• Engineering/Design for Transfer Facility (WATA)
Demonstration/Travel Demand Management
• Vanpool Assistance Programs
• Stafford-Quantico Bus Service
• Pedestrian Collision Avoidance System
for Bus Systems
8/16/2018 4

Review existing grants (federal & state), project progress, transit development plans and state of good repair in making recommendations for capital funding
Capital Funds: Allocated based on TSDAC funding tiers
Operating Funds: $54.0 M allocated on operating costs
Remainder allocated with performance metrics✓ Net Cost per Rider – 50%
✓ Riders per Revenue Mile – 25%
✓ Riders per Revenue Hour – 25%
Transit Funding Allocation Process
VACO8/16/2018 5
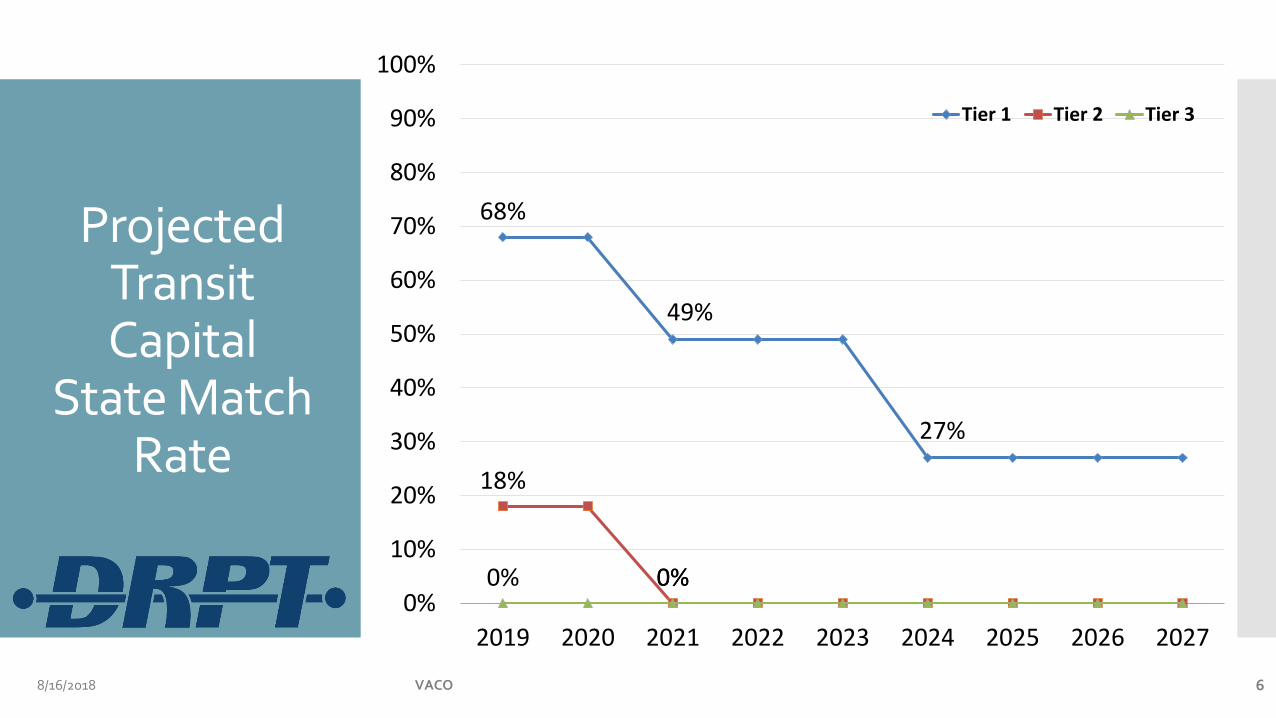
ProjectedTransit Capital
State Match Rate
68%
49%
27%
18%
0%0% 0%0%
10%
20%
30%
40%
50%
60%
70%
80%
90%
100%
2019 2020 2021 2022 2023 2024 2025 2026 2027
Tier 1 Tier 2 Tier 3
6VACO8/16/2018

VACO 7
Statewide Funding Needs: Outlook is Uncertain
2017 Revenue Advisory Board Final Report Average of $130 million needed annually
over next 10 years
Needs forecasts conducted in 2016 using 2014-2015 transit agency data
FY 2018 and FY 2019 capital applications were below projected needs
2017 Revenue Advisory Board Report: Future Transit Capital Funding Gap (in $millions)
8/16/2018
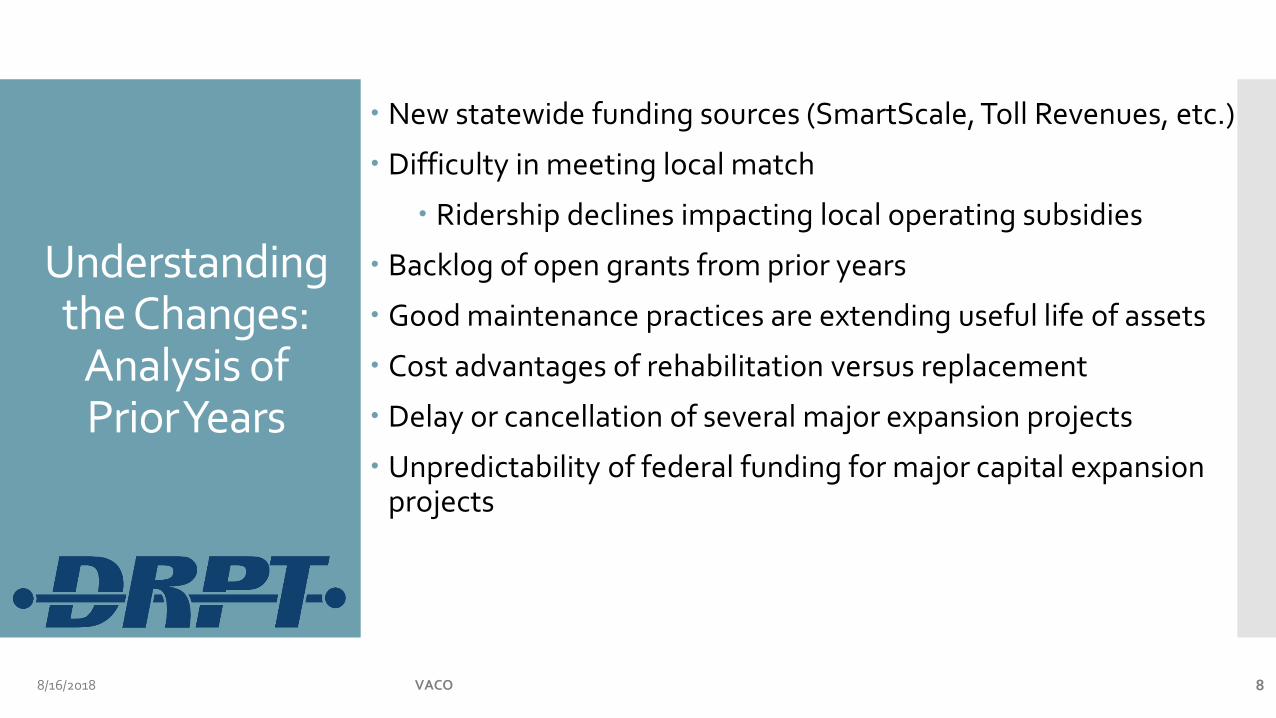
Understanding the Changes:
Analysis of Prior Years
VACO 8
New statewide funding sources (SmartScale, Toll Revenues, etc.)
Difficulty in meeting local match
Ridership declines impacting local operating subsidies
Backlog of open grants from prior years
Good maintenance practices are extending useful life of assets
Cost advantages of rehabilitation versus replacement
Delay or cancellation of several major expansion projects
Unpredictability of federal funding for major capital expansion projects
8/16/2018

From 2007 to 2015
Bus use nearly doubled from 1.8% to 3.0%
Total transit use rose from 5.1% to 6.8% — a 33% increase
Teleworking increased 4.5% to 8.3% — an 84% increase
Intermittent teleworking increased from 12% to 19% — 1 in 5 Virginia workers now telecommute occasionally
Virginia employers offering formal teleworking programs rose from 12% to 20%
From 2015 to present
National bus ridership decreased 6.7%
Total transit ridership in Virginia declined 13% 9% from 2016-17 alone
7 systems showed increases in ridership, most notable of which were GLTC, Blacksburg, VRE
TraditionalPublic
TransportationRidership
Trends
VACO 98/16/2018

SMART SCALE
Funds 100% of expansion costs with no local match requirement
$178 million to transit in SMART Scale Rounds 1 and 2
Toll Revenues to Transit
State Rail Funds used for Commuter Rail
Northern Virginia Dedicated Funds NVTA: $311 million in transit expansion
NVTC: $29 million in regional gas taxes to WMATA
Federal TIGER Grants $25 million to GRTC for Richmond BRT
Dedicated state funding for Vanpools $1.2 million annually
Since 2014: New Statewide
FundingSources for
Transit
VACO 108/16/2018

Completed Projects The Hopper: Lynchburg Central Business District Circulator
Danville Transit System Bus Shelter & Transit Buses
I-66 TDM Strategies
Round 2 High Scoring Projects VRE Fredericksburg Line Capacity Expansion—Highest Raw
Benefit Score
Columbia Pike Smart Corridor-3rd Highest Benefit/Cost Score
Greater Roanoke Transit Company Smart Way Vehicle Expansion-4th Highest Benefit/Cost Score
Transit Projects are Competing
Well in SMARTScale
VACO 118/16/2018

Toll Revenues to
Transit
I-66 Outside the Beltway
• $800M over the next 50 years to support enhanced transit service
I-66 Inside the Beltway
• New and improved travel choices that include transit, TDM, bicycle, pedestrian, and roadway options
I-395
• $15M annual transit investment to fund new and improved travel choices in corridor
I-64 (Hampton Roads)
• Support enhanced express bus and vanpooling in the I-64 Express Lanes corridor
8/16/2018 12VACO

2018 General
Assembly Reforms
Restructured Mass Transit Trust Fund
$154 million additional annually for WMATA with Reforms
No CPR Bond Reauthorization for Transit Capital
Capital Project Prioritization Implementation with FY20-25 Six-Year Improvement Program
Separate Processes for state of good repair/minor enhancement and major expansion
Performance Based Operating Assistance Implementation with FY20 for entire program
Based on TSDAC service delivery factors
Strategic Plans Larger agencies in urban areas (50,000+ population and 20+ buses)
Guidelines by December 1, 2018
VACO 138/16/2018

14
Restructured Mass Transit Trust Fund
31%
12.5%
3%
53.50%
Statewide Operating
Statewide Capital
Special
WMATA Operatingand Capital
VACO8/16/2018

Effective July 1, 2019
State of Good Repair Based on transit asset management principles, including
federal requirements for Transit Asset Management
Major Expansion Based on SMART SCALE factors:
Congestion mitigation
Economic development
Accessibility
Safety
Environmental quality
Land use
Statewide Transit Capital
Prioritization
15VACO8/16/2018

Project Types
State-of-Good Repair (SGR): Projects/programs to replace or rehabilitate an existing asset
Includes acquiring assets/technology to serve current functions
Minor Enhancement: Projects/programs to add capacity, new technology, or a customer enhancement meeting the following:
Project costs less than $2 million, OR
Expansion vehicles: less than 5 vehicles or less than 5% of fleet
Major Expansion: New projects/programs that add, expand, or improve service (greater than $2M)
VACO 168/16/2018

Transit Capital Program Structure
8/16/2018 17
SGR
(90-95%)
Minor Enhancement
(5-10%)
Fun
din
g
Leve
lFunding level to be determined based
on review of needs, funding can be
moved to SGR but not from SGR to
expansion
Stat
e
Mat
ch
Rat
e
68% single rate 68% single rate up to 50%
State of Good Repair and Minor Enhancement
(80%) Expansion
(20%)
Minimum funding level (floor) for SGR
Funding can be moved from expansion to SGR based on need
Funding can move from Expansion to SGR
Funding cannot move from SGR to Expansion
VACO

Structure for Capital ProgramPrioritization
SGR Ranking
Expansion Ranking
Project Submittal
Project Type
SGR
Major ExpansionMinor
Enhanc.
Minor Enhanc. Ranking
Cost Effectiveness Score
Technical Score:Asset Condition +
Service Impact
Weighting
Technical Score
6 Criteria
Technical Score:Service Impact
Transit Capital Share
of Cost
Funding Allocation
18VACO8/16/2018

Continuing coordination with TSDAC
Extensive outreach to MPOs, transit agencies, and local governments
Working off the framework from the Revenue Advisory Board report (principles approved by CTB in July 2017)
State of Good Repair/Minor Enhancement – 80% of program funding
Board can use discretion to shift funds from Major expansion to State of Good Repair
Establishment of a single matching rate across asset types, with State of Good Repair/Minor Enhancement matched at a higher rate than Major Expansion
Maintain minimum local matching of 4%
Capital Prioritization –Status
19VACO8/16/2018

December 4th –Workshop briefing on operating allocation
December 20th – Release draft operating allocation policy for public comment
December/January – Legislator outreach on draft CTB policy for operating allocation
January 15th –Workshop briefing on draft CTB policy for operating allocation
February 20th –Action on CTB policy for operating allocation
Next Steps –Operating Allocation
20VACO8/16/2018

•Required every five years from transit agencies with 20+ bus fleet serving urbanized areas of 50,000+ population
• Impacted Agencies:UrbanTransitAgency
Strategic Plans
21
Alexandria (DASH) Arlington Transit
Fairfax Connector Loudoun Transit
PRTC Blacksburg Transit
Charlottesville Area Transit Fredericksburg Transit
GLTC- Lynchburg GRTC- Richmond
GRTC- Roanoke Harrisonburg Transit
Hampton Roads Transit Petersburg Area Transit
Radford Transit Williamsburg Area Transit
VACO8/16/2018
September 7th –TSDAC meeting to review CTB policy guidance and operating formula
September 10th – Release draft prioritization and strategic planning policy for public comment
September/October –Outreach to legislators on proposed CTB policy for transit capital prioritization and strategic planning
September 17th-Workshop briefing on draft CTB policy for prioritization and strategic planning
October 30th –Action on CTB policy for transit capital prioritization and strategic planning
Next Steps –Capital and Strategic Plans
22VACO8/16/2018

FTA certified DRPT State Safety Oversight Program for The Tide in April 2018 – 1 Year ahead of deadline
Metro Safety Commission VA appointed its two primary members and one alternate
MSC hired executive director
April 2019 certification deadline to avoid 100% statewidewithholding penalty
StateSafety
Oversight
VACO 238/16/2018

Making the Case for FundingIncreased AccountabilityLong-Term Strategic PlanningHigh Quality DataImpact of Emerging Technology
Future of Transit
in Virginia
VACO 248/16/2018