chp & iaq equipment opportunities - … & iaq equipment opportunities technology discussion...
TRANSCRIPT

CHP & IAQ Equipment OpportunitiesTechnology DiscussionAugust 10, 2001
Presented by:John Cuttica, Energy Resource Center, UICRich Sweetser, EXERGY Partners Corp.John Kelly, GTI Distributed Energy Division
August 10, 2001

Video courtesy of Plug Power
Can You Hear the Footsteps?
Agenda
IntroductionUSDOE’s Perspective on DG/CHPCase Study and Technology OverviewEnergy Pricing OverviewDOE Midwest Region Application CenterApplication Center Support Options
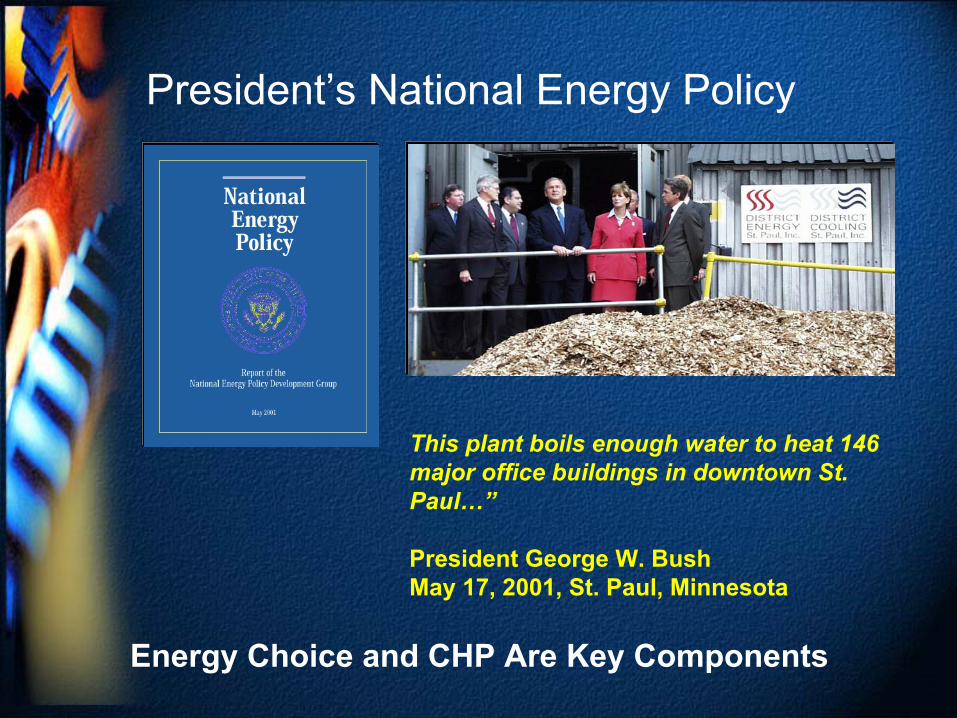
This plant boils enough water to heat 146 major office buildings in downtown St. Paul…”
President George W. BushMay 17, 2001, St. Paul, Minnesota
Energy Choice and CHP Are Key Components
President’s National Energy Policy

National Energy Policy on CHPCHP is environmentally preferred, cost effective, efficient, and reliable. CHP is defined as part of the distributed energy group of technologies that can reduced transmission and distribution (T&D) losses and defer the need to construct expensive new T&D assets. Distributed energy technologies also include: stationary fuel cells, landfill methane, small-scale wind, and photovoltaics. Location of CHP at or near the end-use site allows for use of waste heat and waste-fuels. Barriers to CHP are identified as:
Delay and difficulties obtaining air permits, including lack of recognition of CHPair quality benefits. Difficulties in siting due to local ordinances. Lack of standards governing utility interconnection. Inequitable tax treatment.

U.S. CHP Installations
Paper16%
Chemicals31%
Food9%
Refining13%
Metals5%
Other Ondustrial20%
Comml/Inst9%
52,800 MW – 1999
Source: U.S. DOE-EIA and Onsite-Sycom

Source:, OSEC
Other Industrial29%
U.S. CHP for Industry Potential
Paper30%
Chemicals11%
Food9%
Refining13%
Metals8%
Estimated CHP Potential: 88,000 MW
Source: U.S. DOE-EIA and Onsite Sycom

U.S. CHP for Buildings PotentialEstimated CHP Potential: 75,000 MW
Health Care24%
Education27%
Food Sales/Serv
10% Lodging7%
Office Buildings
21%
Other11%
Source: U.S. DOE-EIA and Onsite-Sycom

Office of DER Vision 2020
The United States will have the cleanest and most efficient and reliable energy system in the world by maximizing the use of affordable distributed energy resources.

Office of DER Mission 2020To lead a national effort to:
Develop the “next generation” of clean, efficient, reliable, and affordable distributed energy technologies;
Document the energy, economic, and environmental benefits of the expanded use of distributed energy resources and disseminate the findings widely; and
Implement deployment strategies, including national and international standards, that address infrastructure, energy delivery, institutional, and regulatory needs.

Slight Detour – Indoor Air Quality

IAQ Findings

Comfort to Productivity Link Made
It stands to reason that if you are comfortable you can be more productive than if you are not comfortable.
Professor P. Ole Fanger, D.Sc. Director, International Centre for Indoor Environment and Energy at the Technical University of Denmark, is the world’s leading expert on human interaction with indoor environments. Professor Fanger has recently published a series experimental results linking comfort to productivity and ventilation air and humidity control to improved comfort.

Desiccants eliminate common moisture problems in buildings
STOP
DUST M
ITES
ELIM
INATE
BACTERIA
ERADIC
ATE
MOLD D
AMAGE
PREV
ENT
CORROSION
FORGET
FUNGUS
DOE Working on Desiccant TechnologyDesiccant systems are widely used for energy recovery, to provide precision humidity control in industry and to control operating costs in today's supermarkets. Ongoing work at ORNL, at NREL and within industry has yielded significant advances in performance, applications and material cost reduction. Desiccant humidity control is expected to become an essential engineering tool to manage moisture within 21st
century buildings.

Desiccant Technology
Rotating Desiccant Wheel~ 20 rev/hr
Drive motor
ReactivationHeater
ReactivationAir
ReactivationSide
ProcessSide
Hot, Low RHWarm, High RH
Cool, High RH Warm, Low RHProcessAir
Rotating Desiccant Wheel~ 20 rev/hr
Drive motor
ReactivationHeater
ReactivationAir
ReactivationSide
ProcessSide
Hot, Low RHWarm, High RH
Cool, High RH Warm, Low RHProcessAir

Back on Track with CHP

Institutional and District Energy
> 172,148,208 sq ft of buildings connected to institutional and district energy systems. In 1999 customers totaling more than 21,783,280 sq ft of space had been added to institutional and district energy systems.

OPRYLAND Hotel and Convention Center
Case Study provided by:IC Thomason Associates, Inc.
Consulting EngineersNashville, TN
Typical Private Sector System
5 MW gas turbine systemwith heat recovery, chiller
1,000 RT double-effect absorption chiller
Inlet air cooler uses 300 RT of CW output
Operating since 1996
O&M costs reduced from $3 million /yr “pre-CHP” to $2 million/yr

University of IllinoisRepresenting Institutional Facilities

East Campus

Original Installation in 1993
Two Cooper-Bessemer 20-cylinder LSVB, 6.28 MW engines, installed in 1993, are also used at the east campus plant. Cooper-Bessemer's LSVB power engines are four cycle designed engines for high-horsepower, continuous-duty operation.
Seasonal Load East Campus
0
2
4
6
8
10
12
14
16
18
20
1 2 3 4 5 6 7 8 9 10 11 12
Month
Meg
awat
ts
Base LoadCooper Engines

Additional Units for Seasonal Load
Two Wartsila 18V28SG engines driving ABB generators rated 4.1 MW each were added in 2000 to pick up the east campus' seasonal load
Seasonal Load East Campus
0
2
4
6
8
10
12
14
16
18
20
1 2 3 4 5 6 7 8 9 10 11 12
Month
Meg
awat
ts
Base LoadCooper Engines
Seasonal LoadWartsila Engines

Heat Recovery System
4 – exhaust gas heat recovery systems Total rating: 8.8 MWth (30 MMBTUH)
2 – jacket water heat recovery systems (one each for the Cooper Engines) Total rating: 2.4 MWth (8 MMBTUHth)

Heating & CoolingHeating loop consists of;
Two dual fuel 22 MWth(75 MMBTUH) One 15 MWth(50 MMBTUH)
Cooling loop consists of;Three absorption chillers (decentralized) totaling 5.3 MWth (1,500 RT) One absorption chiller (central) totaling 3.5 MWth (1,000 RT)Three centrifugal chillers (central) totaling21 MWth (6,000 RT)

Financials
1993 Plant (2 – 6.28 MW Cooper Engines)Capital cost $15,000,000Annual operating savings ~$2,000,000Systems simple paid back in 7.5 years
2000 Plant AdditionAdding (2-4.2 MW Wartsila Engines)

West Campus CHP Plant
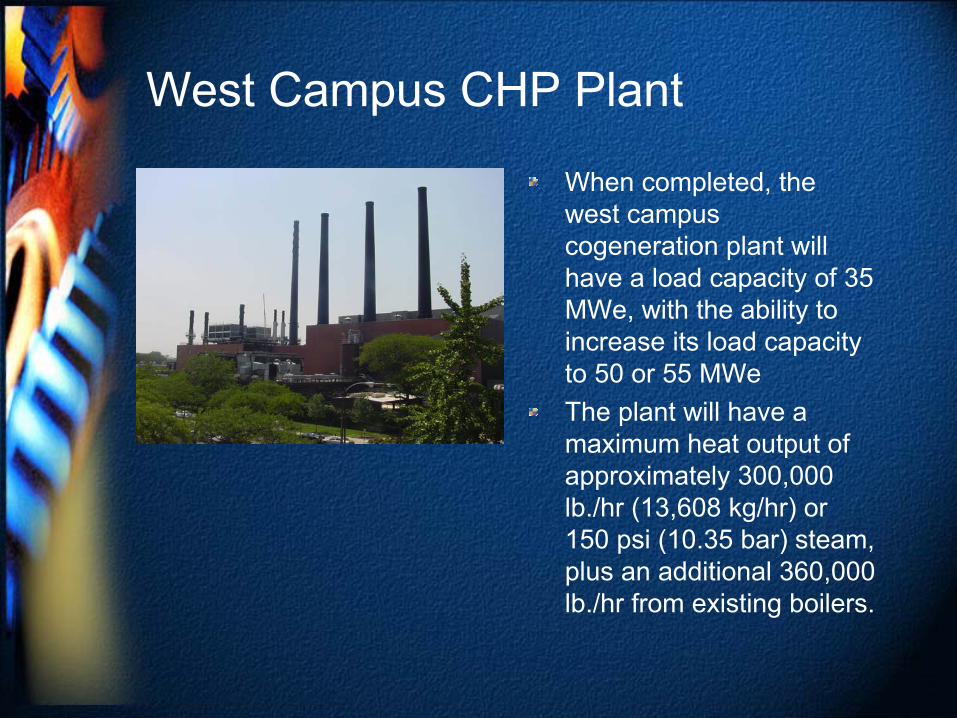
West Campus CHP Plant
When completed, the west campus cogeneration plant will have a load capacity of 35 MWe, with the ability to increase its load capacity to 50 or 55 MWeThe plant will have a maximum heat output of approximately 300,000 lb./hr (13,608 kg/hr) or 150 psi (10.35 bar) steam, plus an additional 360,000 lb./hr from existing boilers.

Base Load Gas Turbines
Three Solar Taurus 70 combustion turbines.The turbines will each drive Ideal Electric generators. Output of 7 MWe per unit.
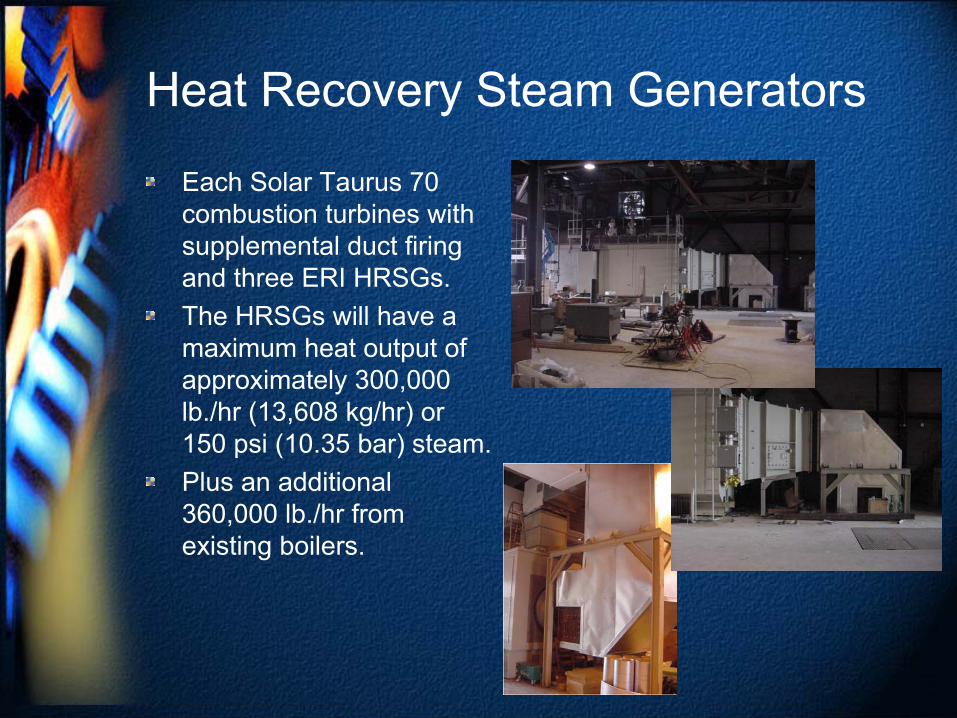
Heat Recovery Steam Generators
Each Solar Taurus 70 combustion turbines with supplemental duct firing and three ERI HRSGs.The HRSGs will have a maximum heat output of approximately 300,000 lb./hr (13,608 kg/hr) or 150 psi (10.35 bar) steam.Plus an additional 360,000 lb./hr from existing boilers.

Engines
Three 5.2 MW Wartsila18V34SG lean burn, reciprocating engines will drive ABBgenerators.The Wartsila engines currently have no heat recovery. The engines are equipped with catalytic oxidizers for pollution control

Financials
2001 Plant 3 – 5.0 MWe Wartsila Engine/Generators3 – 7.0 MWe Solar Gas Turbines3 – HRSGs 45.4 kg/hr (360,000 lb/hr) steamCapital cost $38,000,000Annual operating savings ~$6 to 8,000,000Systems simple paid back in 4.75 to 6.5 years simple payback

Hospital
Three 1,200 rpm natural gas Engine Generators With Heat Recovery 3.45 MWe(125 psi Steam) to 700 Ton Double Effect Absorption Chiller11 MMBTUH W.J. Heat Recovery. System Eff. 73% $890,000 / Yr Savings

Institutional
Four 1200 rpm natural gas Engine Generators3.1 MWe240 F Hot Water W.J. Heat Recovery5.0 mmBtu/Hr To Main Campus Heating Loop.System Eff. 50$600,000 / Yr Savings
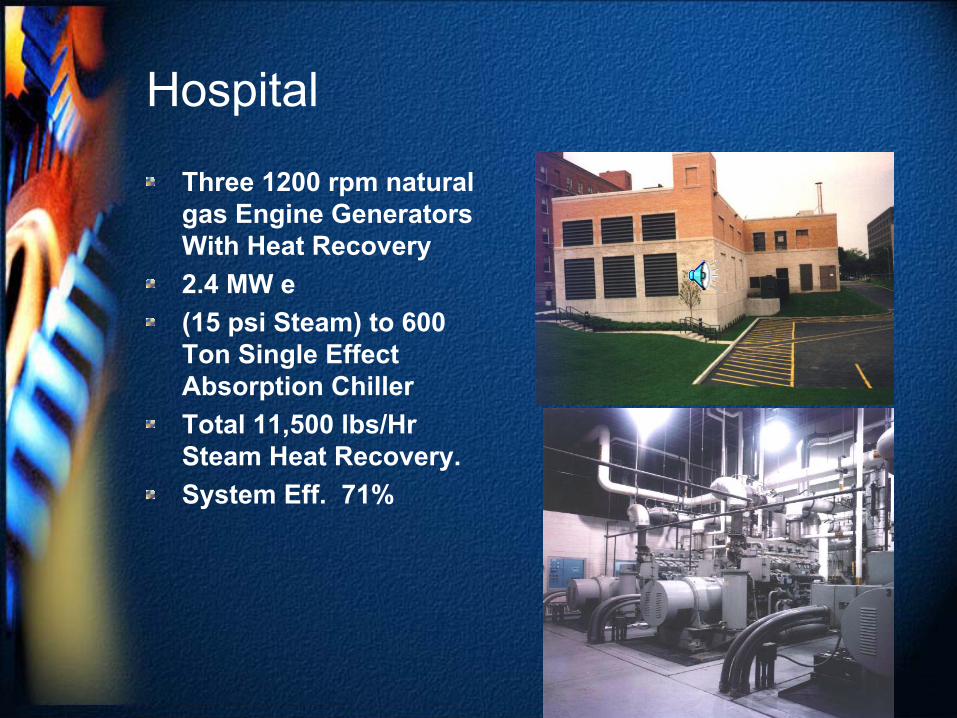
Hospital
Three 1200 rpm natural gas Engine Generators With Heat Recovery 2.4 MW e(15 psi Steam) to 600 Ton Single Effect Absorption ChillerTotal 11,500 lbs/Hr Steam Heat Recovery.System Eff. 71%

Industrial
Seven 1200 rpm natural gas Engine Generator4.9 MW eWith Heat Recovery of 15 Psi Steam for Heating & Process.Total Steam Production of 15,000 Lbs/Hr.Pay Back in under 3 Years and provides Power to Cool the Entire Manufacturing Floor

The Future of the Technological Base

Distributed Energy ResourcesLiBr Absorption Chillers
20104 Broad market penetration through
25% cost reduction 30% more efficiency and integration with BCHP systems
20004 Good technologies,
but limited penetration

Distributed Energy ResourcesDesiccant Dehumidifiers
20004 Niche market equipment
for high value humidity control applications
20104 Mainstream humidity control using
new solid desiccant materials & new liquid technologies resulting in 50% cost reductions

Engines
20004 25 - 40% 4 2-3 grams/kWh NOx
20074 50% Efficiency4 < 1.5 grams/kWh NOx

Advanced Turbines
20104 Small (< 10 MWe) Gas Turbine
Efficiency > 40% LHV
20004 Maximum Small (< 10 MWe)
Gas Turbine Efficiency at 33% LHV

Microturbines
20004 17-30% Efficiency (LHV)4 Double digit ppm NOx
20074 40% Efficiency (LHV)4 Single digit ppm NOx

Fuel Cells for Buildings
20004 $4500/kW
20104 $1500/kW
IFC – Phosphoric Acid
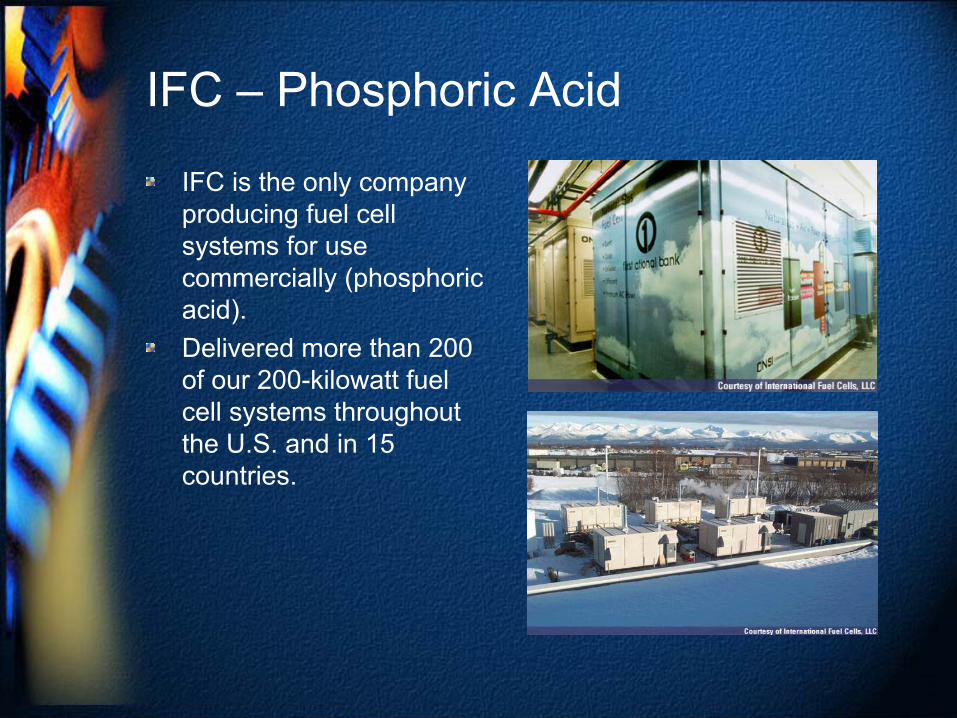
IFC is the only company producing fuel cell systems for use commercially (phosphoric acid). Delivered more than 200 of our 200-kilowatt fuel cell systems throughout the U.S. and in 15 countries.

GE/Plug Power PEMImagine your own reliable supply of electricity in a compact, quiet, self-contained package - a fuel cell called the HomeGen. This new energy system now under development, will generate electricity at your home. Because it HomeGen is fueled by natural gas or LPG -- it will be both efficient and environmentally friendly . Installed in your back yard, the HomeGen fuel cell is being designed to provide 100% of your home's energy needs.

Fuel Cell Energy – Molten Carbonate
FuelCell Energy is developing its Direct FuelCell® (DFC®) for use in stationary applications. Our three main products—a 300 kW, a 1.5 MW and a 3 MW—are designed to meet a variety of applications. For example, the 300 kW single stack DFC power plant is a skid-mounted, compact unit, which can be used to add incremental capacity or to gain operational familiarity with DFC power plants. Ideal customers include light industrial, small buildings and other applications requiring 250 kW to 1 MW of power.
Siemens Solid Oxide
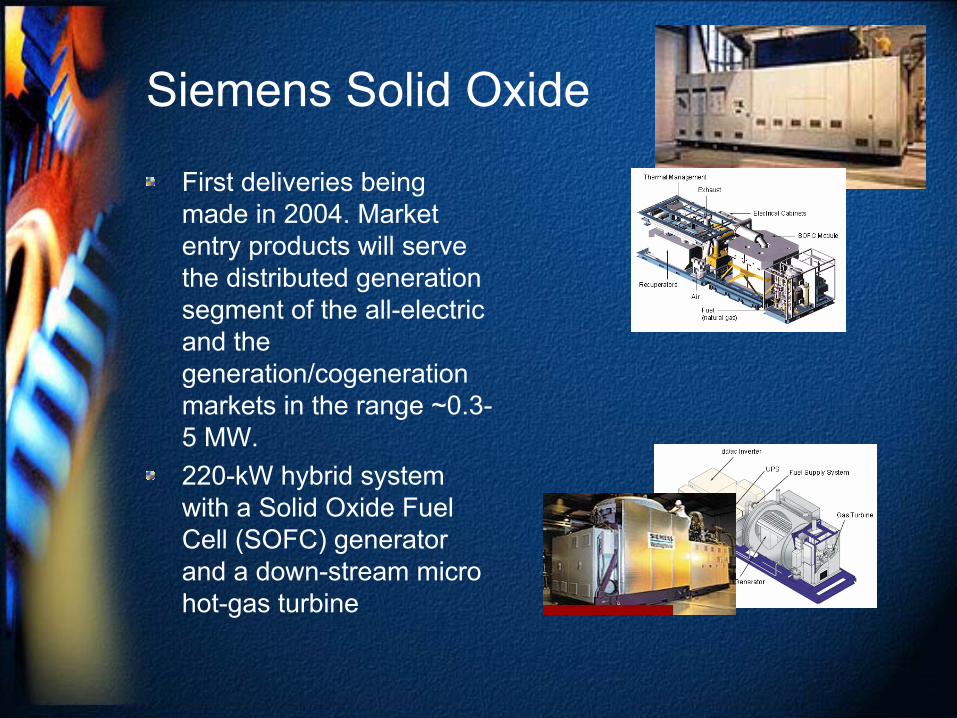
First deliveries being made in 2004. Market entry products will serve the distributed generation segment of the all-electric and the generation/cogeneration markets in the range ~0.3-5 MW. 220-kW hybrid system with a Solid Oxide Fuel Cell (SOFC) generator and a down-stream micro hot-gas turbine

The Future of CHP Packaged and Modular Systems
Capstone~ $3 million
United Technologies ~ $ 2.8 million
NiSource~ $0.8 million
GTI, Waukesha, Trane ~ 2.5 million
Honeywell~ $4.3 million
Burns & McDonald, Solar & Broad USA
$3 million
Ingersoll-Rand~2.3 million

Energy Pricing Overview

0
4
8
12
16
20
24
28
32
Trill
ian
Cubi
c Fe
et
1970 1975 1980 1985 1990 1995 2000 2005 2010 2015 2020
Year
Other
Residential
Commercial
Industrial
Power Gen
Natural Gas Consumption (TCF)
Added 15 TCF – InterstateTippled Storage
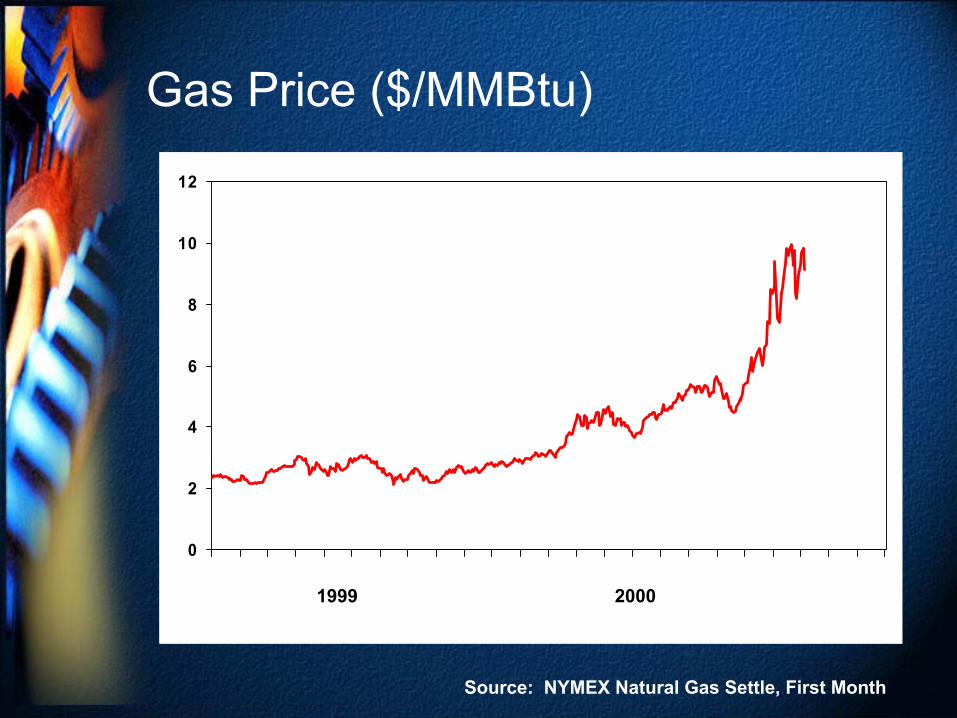
Gas Price ($/MMBtu)
0
2
4
6
8
10
12
1999 2000
Source: NYMEX Natural Gas Settle, First Month
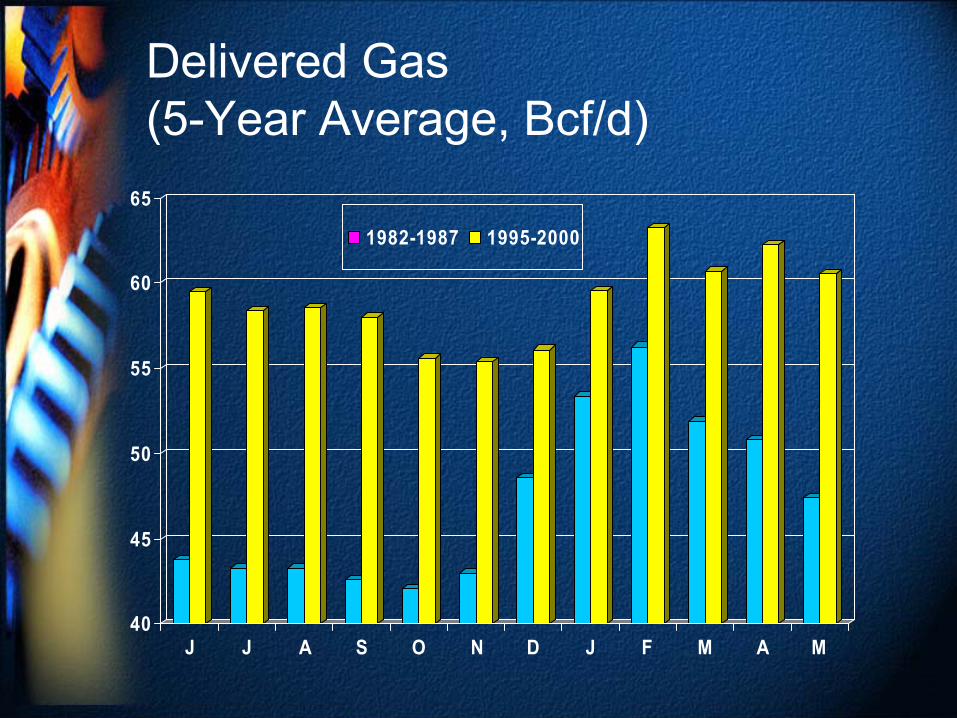
Delivered Gas (5-Year Average, Bcf/d)
40
45
50
55
60
65
J J A S O N D J F M A M
1982-1987 1995-2000
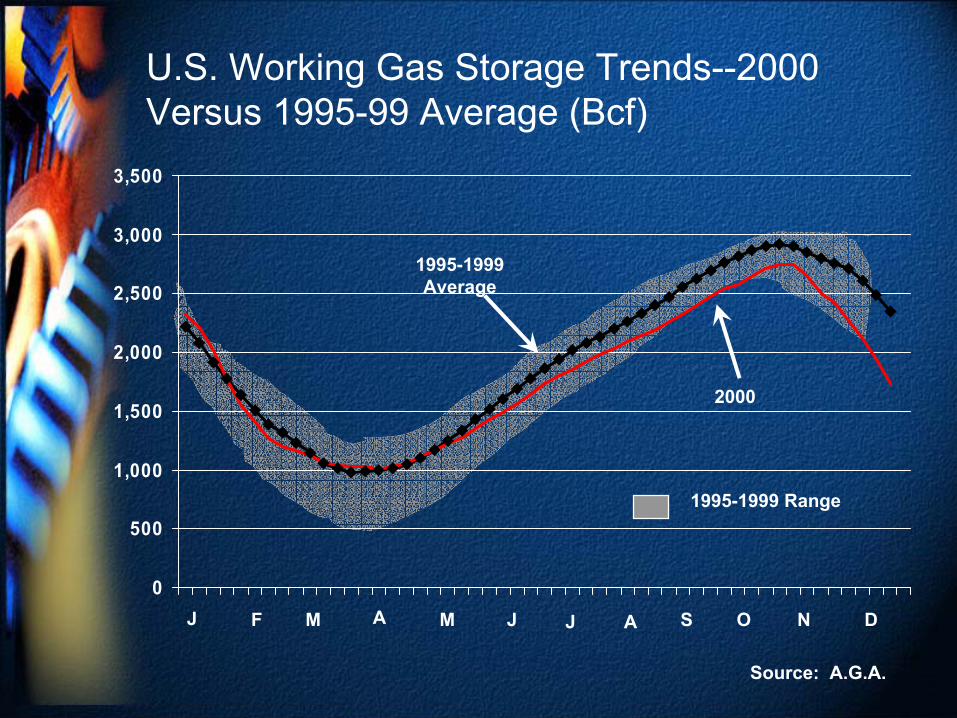
U.S. Working Gas Storage Trends--2000 Versus 1995-99 Average (Bcf)
0
500
1,000
1,500
2,000
2,500
3,000
3,500
1995-1999 Average
1995-1999 Range
2000
J F M A M JJ A S O N D
Source: A.G.A.
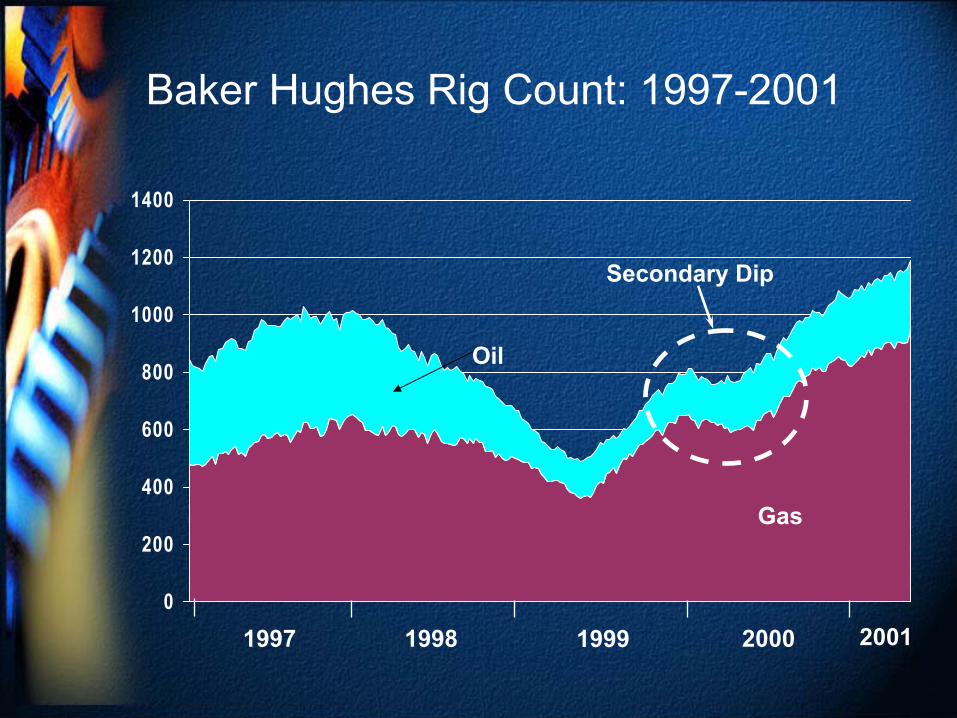
Baker Hughes Rig Count: 1997-2001
0
200
400
600
800
1000
1200
1400
Gas
Oil
1997 1998 1999 2000
Secondary Dip
2001

Lower-48 Gas Deliverability & Production (Bcf/d)
38
42
46
50
54
58
62
'91 '92 '93 '94 '95 '96 '97 '98 '99 '00 '01 '02 '03 '04 '05
Deliverability Production
History

GRI Baseline Report
0
200
400
600
800
1000
1200
1400
1600
1800
1990
1993
1996
1999
2005
2008
2013
2020
natural gas
Additions of Interstate Natural Gas Pipeline Capacity (billion cubic feet)
15 TCF AddedYet use remains at 1972 levels22 TCF 1999

WORKING GAS
BASE GAS
0
1000
2000
3000
4000
50006000
7000
8000
9000
10000
1930
1938
1945
1955
1960
1963
1975
1983
1993
1995
2005
2015
YEAR
BIL
LIO
N C
UB
IC F
EET
1970 – 4 TCF
2000 – 8 TCF
GRI Baseline Report
Underground Natural Gas Storage Capacity
5
32
14
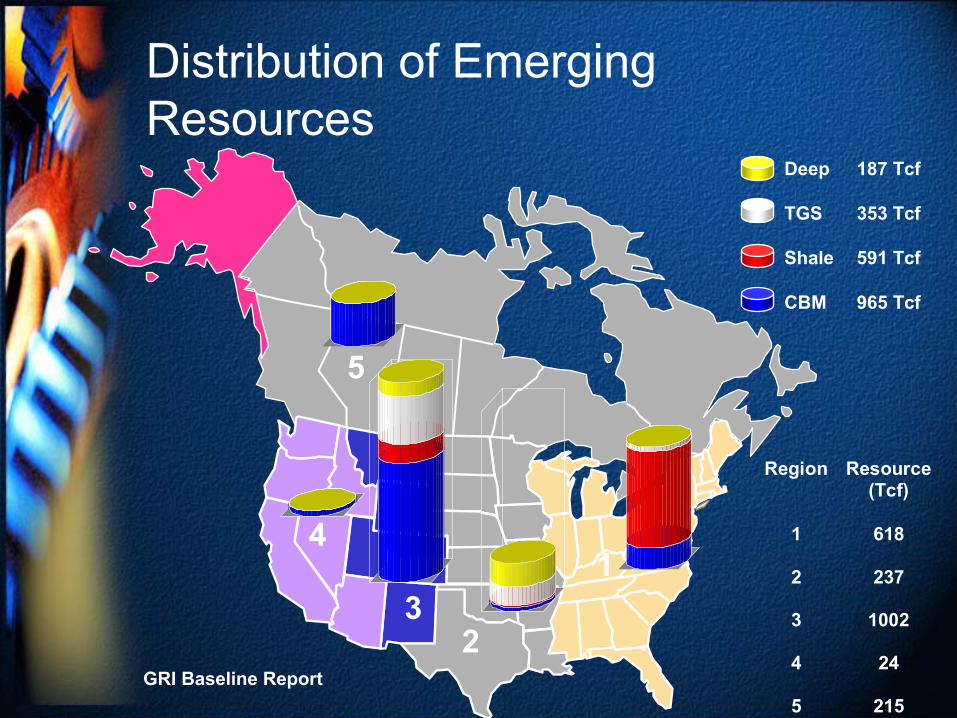
Distribution of Emerging Resources
Region Resource (Tcf)
1 618
2 237
3 1002
4 24
5 215
Deep 187 Tcf
TGS 353 Tcf
Shale 591 Tcf
CBM 965 Tcf
GRI Baseline Report

U.S. Working Gas Storage Trends (Bcf)
0
500
1,000
1,500
2,000
2,500
3,000
3,500
2000
1995-1999 Range
2001 (Act.)
J F M A M JJ A S O N D
Source: A.G.A.

Current Supply Situation
Production Situation ImprovingLower-48 Stakes Running At Over 98 Percent Of Deliverability In 2000Storage Situation Has Improved Rapidly Relative To Earlier Expectations
Milder Weather In Early 2001Slowdown In Economic Activity

Current Demand Situation
Mild Or “Normal” Winter Weather In January, February, And March And Slowdown In Economic Activity Moderated Demand In Early 2001Growing Gas Demand For Power Generation Still Driver Of Market, But Growing Interest In CoalClear Evidence Of Growing Summer Demand could Hold-Up PricesEconomic Weakness Will Help Industry Adjust In Near Term

WELLHEAD GAS PRICE SCENARIOS ($/MMBtu)
1
2
3
4
5
6
7
8
9
10
J M M J S N J M M J S N J M M J S N J M M J S N J
2000 2001
Base Case: $4.80
Cold Winter: $5.75
2002
Base Case: $4.50
Cold Winter: $5.25
Recession: $3.95
2003
Recession: $3.30
Base Case: $4.90

dgencost.pre
0.1 0.2 0.3 0.4 0.5 0.60
2
4
6
8
10
12
Efficiency of Electricity Generator
.10
.20
.30
.40
.50Gas Cost, $/therm
¢/ kWh
Cost of Gas Driven Distributed Generation

0200400600800
1,0001,2001,4001,6001,800
1970 1975 1980 1985 1990 1995 2000 2005 2010 2015 2020
Residential Commercial Industrial
DOE Projects 390 gigawatts needed
Total US Capacity is 740 gigawatts
Annual Electricity Sales by Sector(billion kilowatthours)

EnergyCrisis
VAV
1950 1960 1970 1980 1990
Ventilation
Rates
(cfm/person)
TightBuildings
ASHRAE Stds 62-73 62-81 62-89 62-??
SickBuildings
IAQ Concerns Lead to Increased Energy Costs

Pricing Overview
Service Generation
Fuel Emissions Market Power
Deregulated
T&D Regulated Ancillary Costs Regulated Taxes/Programs Regulated Stranded/ Deregulation Costs
Regulated

T&D, DOE Projections
2005 Projections2
cents/kw-hr Service CA NY IL TX
Electricity Generation 3.1 3.8 2.9 2.7 T&D 3.6 4.4 2.3 1.7 Taxes, Public Programs
0.2 0.8 0.5 0.2
Total 6.9 9.0 5.7 4.6 % Generation 44% 42% 48% 59%
Average Electricity Prices

T&D, Illinois
Service Charge Basic Service Charge 0.5 Delivery and Ancillary 4.3 Generation 3.2 Total 8.0
In Illinois only ~ 40% of the cost of electricity is attributed to generation
Commercial

25 MW
20 MW
10
10
15
5
25Cumulative Capacity Dispatched
Second-lowest
price unit
Lowest-cost, (Base Load) plant
Base load
Peaker
Cen
ts/k
Wh
MW
2
4
6
8
10
Nuclear
Coal and Gas
Gas and Oil
Time of Day Pool Pricing
0
5
10
15
20
25
30
35
40
45
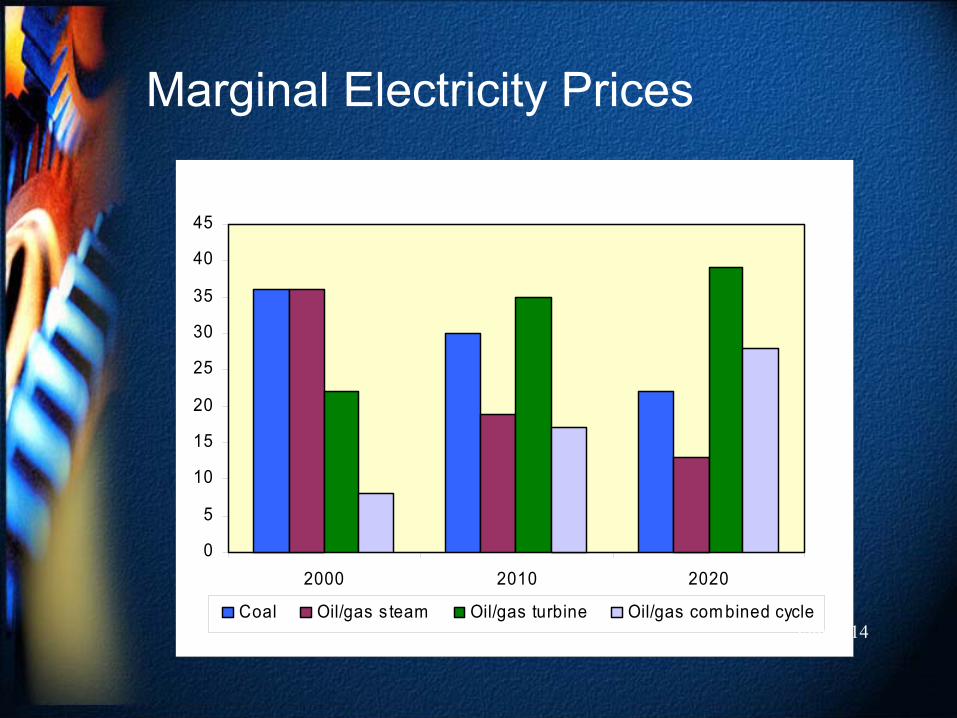
2000 2010 2020
Coal Oil/gas s team Oil/gas turbine Oil/gas com bined cycleFigure 14
Marginal Electricity Prices

Supply vs. Demand?
Projected 390 gigawatts of new capacityOnly added 70 over past 10 years
Projected retirements could widen the gapEmissions restrictions could retire 50% of coal generationUsage Rising at 500+ billion killowatthours per decade
Electricity usage doubled over past 30 and growth is accelerating
As seen in CA shortages in supply impact prices

Market Power?
Restricted AccessPower PreferencesWithholding Power - In UK generators withheld power to raise pricesDistribution Constraints
Market Power is a phenomena where a seller/state is able to influence prices
After 10 years England still struggling with issue

Illinois
Transmission Lines
345 KV735-765 KV
Ozone Non-attainment
Entire County
40 miles:
78 sites, 5.8 GWe
60 miles:
94 sites, 8.2 GWe
Chicago
Part of County
Note impact on Emissions

Coal Emissions Reduction Costs?
SO2 allowances to rise from $90 to $300 per ton (<.1 cents/kW-hr)Coal contributes 90% of CO emissions from electricity generation
CO emissions credits $67 to $350 per ton (2 to 9 cents/kW-hr)
NOx allowances expected to cost approximately 0.2 cents/kWUS EPA expected to regulate particulate emissions

Conclusion – Grid Price Generation
Demand is likely to outstrip supplySystem constraints and permitting slow additions
Marginal Price is lowest priceElectricity cannot be storedCommercial daytime users will pay higher prices
T&D and ancillary costs key in many regionsUp to 20 cents/kW-hr in high cost areasSignificant Upgrades Underway
Natural gas will set the marginal price in many regionsMarket power will effect pricesEmissions control on CO unlikely
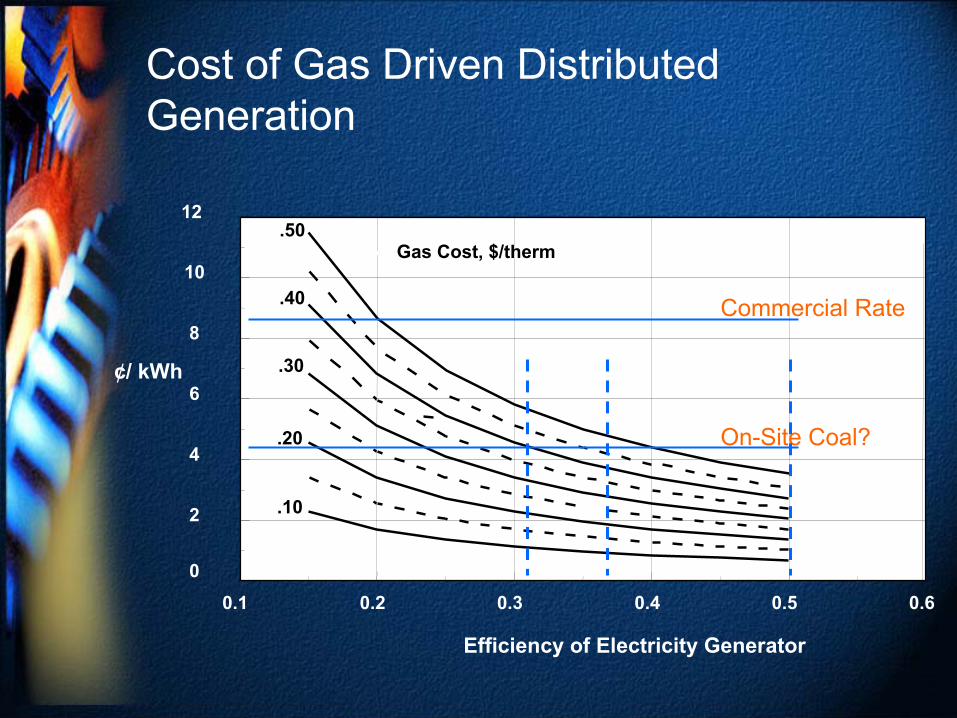
0.1 0.2 0.3 0.4 0.5 0.60
2
4
6
8
10
12
Efficiency of Electricity Generator
.10
.20
.30
.40
.50Gas Cost, $/therm
¢/ kWh
Cost of Gas Driven Distributed Generation
Commercial Rate
On-Site Coal?

DOE Midwest Region Application Center

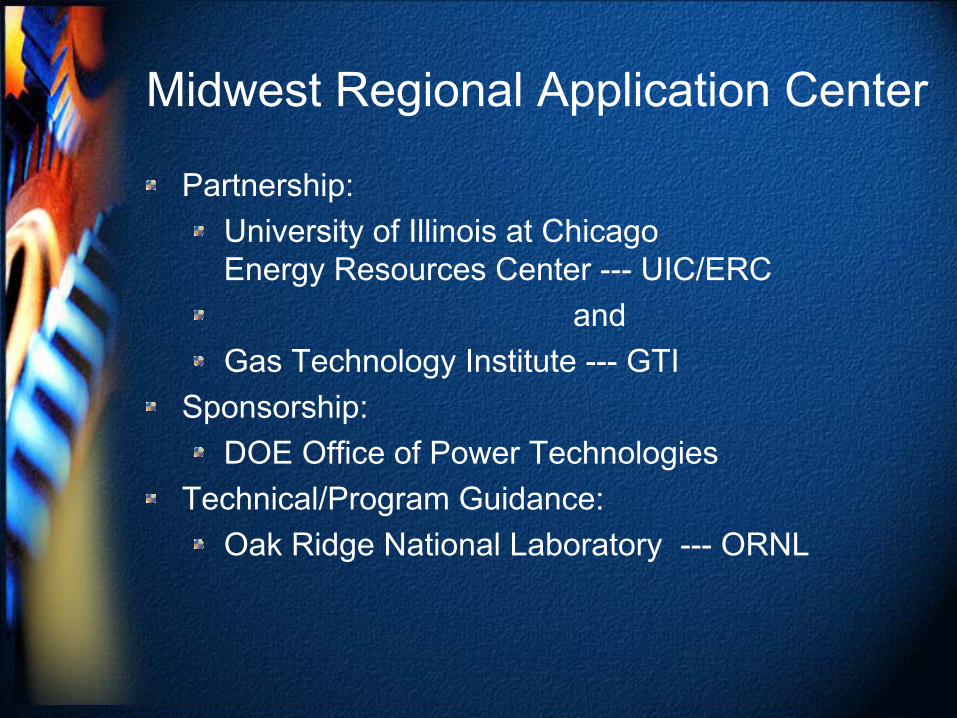
Midwest Regional Application Center
Mission:Develop Technology Application Knowledge and the Educational Infrastructure Necessary to:
Reduce Perceived RisksFoster CHP for Buildings as a Viable:
Technical and Financial OptionEnergy and Environmental Option
Focus: (Foster Project Identification)EducationInformationProject Assistance
Midwest Regional Application Center
Partnership:University of Illinois at ChicagoEnergy Resources Center --- UIC/ERC
andGas Technology Institute --- GTI
Sponsorship:DOE Office of Power Technologies
Technical/Program Guidance:Oak Ridge National Laboratory --- ORNL

Midwest Regional Application Center
Leverage:DOE Chicago Regional OfficeIllinois DCCAEPA Region VMidwest CHP InitiativeDelta InstituteEnvironmental Law and Policy CenterBOMAASHRAEEquipment DistributorsMEEAAGCC

Regional Application Centers

Project Elements
Baseline Assessment / CharacterizationCase StudiesInformation RepositoryProject Support

Baseline Assessments (By State)
Document Acceptance / Opposition to BCHPIdentify / Contact Target CustomersIdentify Installations (Operating & Planned)Document Current Policy and Pricing (Electric & Gas)Identify Market Barriers & Market TrendsGuide Application Center Activities to Identify Projects.
Case Studies
Develop the Analysis Framework & ProtocolsCollect Information from Existing and New SitesDevelop a Database of Case StudiesDevelop Two-Dimensional Market Identification Matrices

Information Repository
Website --- Linked to Appropriate SitesDatabases --- Expandable for Other CentersCHP Literature/Reports/Presentations

Project Support
Standard OutreachWebsiteTool Kit
Case StudiesScreening SoftwareBaseline InformationContinuing Education CreditsGeneral Information
High ImpactStandard OutreachSWAT Team
High Impact Projects
Application --- Repeatable / Large Market ImpactEconomic --- Now / FutureSize --- Significant Impact

SWAT Teams
Mission:Apply “Expert” Talent to High Impact Projects to:
Provide Assistance to “Remove Perceived Risk”
Provide Assistance to Identify Technical Solutions”

SWAT Team Concept
On CallFocusedExpert
On CallFocusedExpert
On CallFocusedExpert
On CallFocusedExpert
Center TrainedBCHP SWAT Team
Leader
Center TrainedBCHP SWAT Team
Leader
Center TrainedBCHP SWAT Team
Leader
LocalProject
ChampionThe
Customer
Architects/EngineersSpecifiers
Building OwnersESCos
SWAT Team
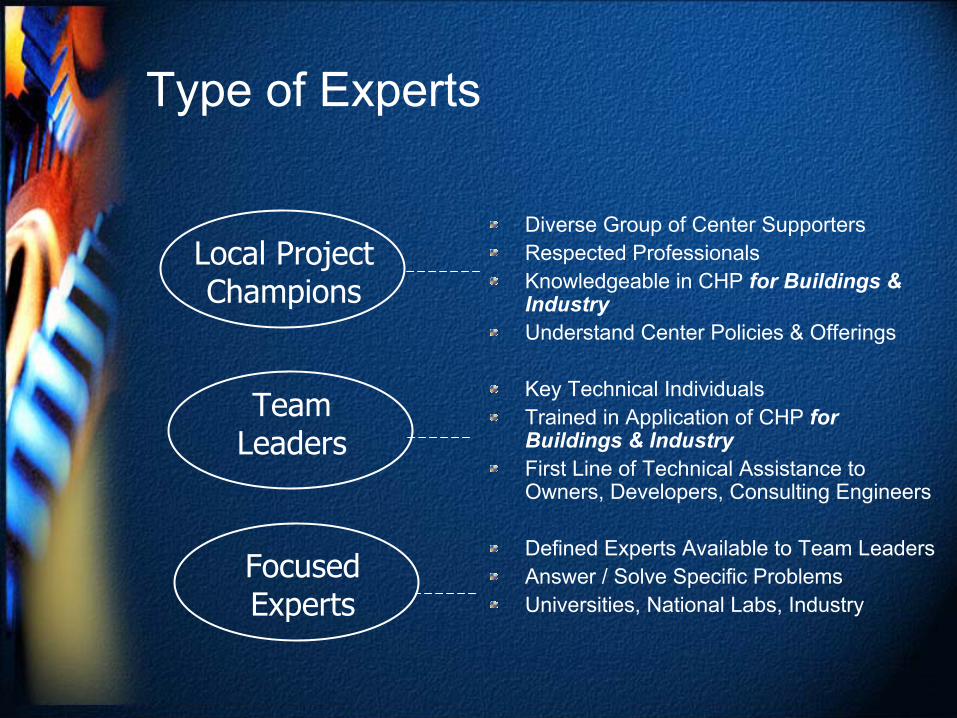
Type of Experts
Diverse Group of Center SupportersRespected ProfessionalsKnowledgeable in CHP for Buildings & IndustryUnderstand Center Policies & Offerings
Key Technical IndividualsTrained in Application of CHP for Buildings & IndustryFirst Line of Technical Assistance to Owners, Developers, Consulting Engineers
Defined Experts Available to Team LeadersAnswer / Solve Specific ProblemsUniversities, National Labs, Industry
Local Project Champions
Team Leaders
Focused Experts

Application Center Support Options

Support Options
Revise SurveyDevelop process for CHP AssessmentsVendor QualificationEconomic Assessment Tools

Support Example
Museum of Science and IndustryMajor Renovation Project (HVAC and Electrical)Excellent Load Profile (Flat from 9:00 am to 10:00 pm)`Concept Definition and Economic Assessment1,250 kWe and DesiccantsTie into existing hot water loopHeating, kitchen, and AC reheat $200,000 in annual savingsFirst Cost of $1,000,000

Support Example, Barriers
Electrical Distribution SystemInterconnect
Utility StudyStandby Charges

Questions“Every morning in Africa, a gazelle wakes up. It knows it must run faster than the fastest lion or it will be killed. Every morning a lion wakes up. It knows it must outrun the slowest gazelle or it will starve to death. It doesn’t matter whether you are a lion or a gazelle: When the sun comes up you’d better be running.”