chowilla anabranch system surface water information …
TRANSCRIPT

Chowilla Anabranch System Surface Water Information Summary
Peter Stace and Ashley Greenwood
Knowledge and Information Division Department of Water, Land and Biodiversity Conservation
June 2004
Report DWLBC 2004/06

Knowledge and Information Division Department of Water, Land and Biodiversity Conservation Level 1, 25 Grenfell Street, Adelaide GPO Box 2834, Adelaide SA 5001 Telephone UNationalU U(08) 8463 6978 International +61 8 8463 6978 Fax UNationalU U(08) 8463 6999U
International +61 8 8463 6999 Website www.dwlbc.sa.gov.au
Disclaimer
Department of Water, Land and Biodiversity Conservation and its employees do not warrant or make any representation regarding the use, or results of the use, of the information contained herein as regards to its correctness, accuracy, reliability, currency or otherwise. The Department of Water, Land and Biodiversity Conservation and its employees expressly disclaims all liability or responsibility to any person using the information or advice. © Department of Water, Land and Biodiversity Conservation 2004
This work is copyright. Apart from any use as permitted under the Copyright Act 1968 (Cwlth), no part may be reproduced by any process without prior written permission from the Department of Water, Land and Biodiversity Conservation. Requests and inquiries concerning reproduction and rights should be addressed to the Director, Knowledge and Information Division, Department of Water, Land and Biodiversity Conservation, GPO Box 2834, Adelaide SA 5001.
ISBN 0-9757438-1-3
Stace, P M and Greenwood A J, 2004. Chowilla Anabranch System Surface Water Information Summary. South Australia. Department of Water, Land and Biodiversity Conservation. Report, DWLBC 2004/06 Cover Photographs H. J. Johnstone, Australia 1835-1907, Evening shadows, backwater of the Murray, South Australia, 1880, London or Paris, oil on canvas, 120.6 x 184.1 cm; Gift of Henry Yorke Sparkes. Art Gallery of South Australia, Adelaide (with permission June 2004). Ian Overton, A backwater on Monoman Island, Chowilla Floodplain, March 2003, (© CSIRO, with permission June 2004).

Chowilla Anabranch System Report DWLBC 2004 / 06 Surface Water Information Summary
i
FOREWORD
South Australia’s water resources are fundamental to the economic and social wellbeing of the State. Water resources are an integral part of our natural resources. In pristine or undeveloped situations, the condition of water resources reflects the equilibrium between rainfall, vegetation and other physical parameters. Development of surface and groundwater resources changes the natural balance and causes degradation. If degradation is small, and the resource retains its utility, the community may assess these changes as being acceptable. However, significant stress will impact on the ability of a resource to continue to meet the needs of users and the environment. Degradation may also be very gradual and take some years to become apparent, imparting a false sense of security.
Management of water resources requires a sound understanding of key factors such as physical extent (quantity), quality, availability and constraints to development. The role of the Knowledge and Information Division of the Department of Water, Land and Biodiversity Conservation is to maintain an effective knowledge base on the State’s water resources, including environmental and other factors likely to influence sustainable use and development, and to provide timely and relevant management advice.
Bryan Harris Director, Knowledge and Information Division
Department of Water, Land and Biodiversity Conservation

Contents
Chowilla Anabranch System Report DWLBC 2004 / 06 Surface Water Information Summary
ii
CONTENTS
FOREWORD ........................................................................................................................ I
CONTENTS......................................................................................................................... II
SUMMARY OF RECOMMENDATIONS..............................................................................1
Flow .................................................................................................................................1 RIVER MURRAY ....................................................................................................................... 1 CHOWILLA FLOW TO RIVER MURRAY.................................................................................. 1 ANABRANCH SUBSYSTEM FLOWS....................................................................................... 1
Salinity and salt loads ......................................................................................................1 RIVER MURRAY ....................................................................................................................... 1 LINDSAY RIVER ANABRANCH................................................................................................ 1 CHOWILLA ANABRANCH SUBSYSTEM................................................................................. 2
Elevations, water levels, bathymetry ...............................................................................2
1 INTRODUCTION .........................................................................................................3
2 AIM ..............................................................................................................................5
3 METHODOLOGY.........................................................................................................6
4 HISTORICAL DATA AND REPORTS..........................................................................7
4.1 Information summary report .................................................................................7 4.1.1 HYDSTUDY SPREADSHEET ...................................................................................... 7
4.2 Additional reports .................................................................................................7 4.3 Digital datasets ....................................................................................................8
4.3.1 HYDSTRA TIME SERIES............................................................................................. 8 4.3.2 RIVERLAND REGIONAL FILES .................................................................................. 8
5 TOTAL SALT LOAD TO RIVER MURRAY..................................................................9
5.1 Calculation of total salt load using daily read EC data.........................................9 5.1.1 DATA USED — DAILY EC READINGS ..................................................................... 10 5.1.2 DATA USED — DAILY FLOW CALCULATION ......................................................... 10 5.1.3 SALT LOAD CALCULATION...................................................................................... 13 5.1.4 SALT LOAD RECESSION.......................................................................................... 16
5.2 Calculation of total salt load using continuous EC data .....................................18 5.2.1 CONTINUOUSLY RECORDED EC DATA................................................................. 18 5.2.2 CONTINUOUS RECORDED EC COMPARED TO DAILY READ EC ....................... 19
5.3 Preliminary uncertainty analysis in daily EC data ..............................................20 5.3.1 PROCEDURE............................................................................................................. 20 5.3.2 RESULTS AND DISCUSSION ................................................................................... 22 5.3.3 CONCLUSIONS AND RECOMMENDATIONS .......................................................... 27
6 CHOWILLA CREEK FLOW .......................................................................................28
6.1 Calculated flow...................................................................................................28

Contents
Chowilla Anabranch System Report DWLBC 2004 / 06 Surface Water Information Summary
iii
6.2 Measured flow....................................................................................................31
7 EVAPORATION LOSSES..........................................................................................33
7.1 Surface water area.............................................................................................33 7.1.1 CHOWILLA ANABRANCH ......................................................................................... 33 7.1.2 RIVER MURRAY — MAIN STREAM ......................................................................... 33
7.2 Calculation of evaporation loss ..........................................................................34 7.2.1 CHOWILLA ANABRANCH ......................................................................................... 34 7.2.2 RIVER MURRAY MAIN STREAM.............................................................................. 34
8 FLOW AND SALINITY STUDIES ..............................................................................35
8.1 Detailed dataset .................................................................................................35 8.1.1 DATA SOURCES ....................................................................................................... 35
8.2 Total Chowilla Anabranch salt load increase .....................................................36 8.3 Chowilla Anabranch components ......................................................................36
8.3.1 CHOWILLA ANABRANCH COMPONENT FLOWS................................................... 37 8.3.2 CHOWILLA ANABRANCH COMPONENT SALT LOADS ......................................... 39
8.4 Salinity hot spots................................................................................................40 8.4.1 TAREENA BONG, SALT CK SOUTHERN ANABRANCH, PUNKAH CK.................. 41 8.4.2 SLANEYS SOUTHERN ANABRANCH ...................................................................... 41 8.4.3 MONOMAN CREEK ................................................................................................... 42
8.5 Elevations, water levels, bathymetry..................................................................44 8.5.1 SURFACE WATER LEVELS...................................................................................... 44 8.5.2 BATHYMETRY ........................................................................................................... 44
9 CONCLUSIONS AND RECOMMENDATIONS..........................................................46
9.1 Flow ...................................................................................................................46 9.1.1 RIVER MURRAY ........................................................................................................ 46 9.1.2 CHOWILLA FLOW TO RIVER MURRAY................................................................... 48 9.1.3 ANABRANCH SUBSYSTEM FLOWS........................................................................ 49
9.2 Salinity and salt loads ........................................................................................50 9.2.1 RIVER MURRAY ........................................................................................................ 50 9.2.2 LINDSAY RIVER ANABRANCH................................................................................. 50 9.2.3 CHOWILLA CREEK.................................................................................................... 51 9.2.4 CHOWILLA ANABRANCH SUBSYSTEM.................................................................. 51
9.3 Elevations, water levels, bathymetry..................................................................53
GLOSSARY.......................................................................................................................54
REFERENCES ..................................................................................................................58
APPENDIX A ADDITIONAL DWLBC INTERNAL REPORTS.......................................60
APPENDIX B ADDITIONAL CSIRO REPORTS...........................................................61
APPENDIX C CHOWILLA REFERENCE LIST.............................................................63
APPENDIX D RIVERLAND REGION DIGITAL FILE SET............................................73

Contents
Chowilla Anabranch System Report DWLBC 2004 / 06 Surface Water Information Summary
iv
APPENDIX E MONTHLY MEAN EC AT DAILY READ AND CONTINUOUSLY RECORDED SITES...........................................................................................................76
APPENDIX F CHOWILLA ANABRANCH SCHEMATIC...............................................77
APPENDIX G FLOW AND SALINITY STUDY TOTAL SALT LOAD INCREASE IN CHOWILLA ANABRANCH ................................................................................................78
APPENDIX H ANABRANCH BANK AND INLET LEVELS............................................80
Contents
Chowilla Anabranch System Report DWLBC 2004 / 06 Surface Water Information Summary
v
Tables Table 1 Salt load increase summary stats — December 1973 to December 2002 .....15 Table 2 Uncertainty estimates of Lock 6 U/S and Templeton EC data ........................24 Table 3 Uncertainty estimates of flow data ..................................................................24 Table 4 Comparison of measured flows and daily calculated flows.............................32 Table 5 River Murray surface areas.............................................................................33 Table 6 Subsystem salt load increase summary..........................................................40 Table 7 Hot spot salinities following October 1984 high flow .......................................41 Table 8 Slaneys Southern Anabranch hot spot salinities 1975–76..............................42 Table 9 Summary of difference in top and bottom EC readings ..................................44 Table 10 Anabranch continuous EC recording sites ......................................................52 Table 11 Continuous water level recording sites ...........................................................53
Figures Figure 1 Location of the Chowilla Anabranch (after Sharley and Huggan 1995). ...........3 Figure 2 Salt load monitoring — Daily readings ..............................................................9 Figure 3 Schematic diagram of Flow to SA components ..............................................13 Figure 4 Lock 5 (AW426512) daily EC vs Templeton (AW426632) daily EC................14 Figure 5 True monthly mean .........................................................................................15 Figure 6 Chowilla salt load increase and River Murray flow Dec 1973–Dec 2002........16 Figure 8 Salt load recession curve ................................................................................17 Figure 9 Salt load monitoring — Continuous EC recorders ..........................................18 Figure 10 A4261022 continuous EC recorder pontoon ...................................................19 Figure 11 Binned Chi-Squared EC frequency data .........................................................22 Figure 12 Cumulative K-S EC frequency data ................................................................23 Figure 13 River Murray streamflow and Lock 6 & Templeton EC for two flood events ...25 Figure 14 River Murray D/S Rufus River streamflow frequency 1975–1996.............Error!
Bookmark not defined. Figure 15 River Murray flow through Chowilla Anabranch ..............................................28 Figure 16 Percentage of River Murray flow through Chowilla (based on daily data) ......29 Figure 17 Percentage of R Murray flow through Chowilla – based on flow gaugings .....30 Figure 18 Flow gaugings and daily read flows, 14 January 2004 ...................................31 Figure 19 Percentage of anabranch flow through Outer Creek system ..........................38 Figure 20 Percentage of anabranch flow through Inner Creek system ...........................38 Figure 21 Percentage of anabranch flow through Lower Creek system .........................39 Figure 22 Chowilla and Monoman Creek salinities, 1984–1991 .....................................43 Figure 23 Monoman Creek top and bottom salinities during no flow ..............................43 Figure 24 Inlet Bank Levels.............................................................................................45 Figure 25 Flow monitoring options ..................................................................................48 Figure 26 Victorian operated Lindsay–Mullaroo sites .....................................................51

Contents
Chowilla Anabranch System Report DWLBC 2004 / 06 Surface Water Information Summary
vi
Computer Files ChowillaSurfaceWaterInfoReport5.doc Banklevl.xls Chowilla Anabranch System.ppt Chowilla_Flow_&_Studies_Data.xls Chowilla_Monthly_EC_Flow_Saltload.xls Chowilla_Monthly_Saltload_Recession.xls Chowmon.xls Chowilla Reference List - March 04.doc Chowilla_Surface_Areas.xls EC_Uncertainty.xls

Chowilla Anabranch System Report DWLBC 2004 / 06 Surface Water Information Summary
1
SUMMARY OF RECOMMENDATIONS
Flow
RIVER MURRAY
All salt load data using River Murray EC differences be based on flows at AW426200 (River Murray, D/S Rufus River) until such time as a more appropriate flow measurement is available.
The methods and techniques used to calculate flows at Lock 6 be reviewed with the aim of developing revised practices to increase the reliability and accuracy of flow data.
CHOWILLA FLOW TO RIVER MURRAY
An investigation take place to establish a suitable site and method for continuously measuring and recording flow in the lower reach of Chowilla Creek.
ANABRANCH SUBSYSTEM FLOWS
Flow gaugings continue to be made over a range of flow conditions at key sites including site numbers 2, 1D, 7B, 10, 18, 21, 26, 30, plus the lower reach of Chowilla Creek at Sites 31 and 36 combined or at Site 40 (see Appendix F for site locations).
Flows from salt load hot spots be measured under suitable conditions.
Wherever possible flow gaugings be taken at ‘standard’ locations.
All previous gaugings taken in the anabranch area be entered into Hydstra TS against appropriate Hydstra site identifiers and all new gaugings be entered against the appropriate site ID as standard practice.
The option of deploying continuous acoustic Doppler equipment at key anabranch sites be investigated.
Salinity and salt loads
RIVER MURRAY
EC profiles be taken at AW426704 and AW426705 at a range of flow conditions to confirm the salinity characteristics of the stream cross-section.
Daily EC readings at Lock 6 continue and DWLBC technical personnel provide support to SA Water personnel to ensure appropriate quality assurance.
EC profiles be undertaken at Lock 6 over a range of flow conditions.
LINDSAY RIVER ANABRANCH
Flow, salinity, salt load and level data for Victorian sites in the Lindsay–Mullaroo Anabranch system be sought from the appropriate authority on an ongoing basis.
Chowilla Anabranch System Report DWLBC 2004 / 06 Surface Water Information Summary
2
CHOWILLA ANABRANCH SUBSYSTEM
Continuous salinity and flow recording equipment be installed at key anabranch sites including Site 20 on Punkah Creek and Site 21 on Slaneys Creek.
Continuous salinity and flow recording equipment be installed at Site 1C at the mouth of Salt Creek at Bank K.
EC profiles be undertaken at all continuously monitored EC sites over a range of conditions.
During flow and salinity studies, multiple depth EC samples be taken at all key salinity monitoring sites.
Elevations, water levels, bathymetry A review be undertaken to determine the best level datum for the anabranch area, all historical level data be adjusted where necessary to conform to the adopted level system, and all existing gauge boards and water level recorders be adjusted to this same datum as necessary.
All available level data for anabranch inlet systems be collated and if necessary a new survey conducted to obtain up to date detailed data.

Chowilla Anabranch System Report DWLBC 2004 / 06 Surface Water Information Summary
3
1 INTRODUCTION The Chowilla Anabranch is one of the most important floodplain–wetland systems in Australia. The area, on the South Australia–New South Wales border and mostly to the north of the main River Murray channel (Figure 1), forms part of South Australia’s Riverland Wetland of International Importance declared under the 1971 Ramsar Convention. It is one of six significant ecological assets under the Murray-Darling Basin Commission’s Living Murray Initiative.
The 17,700 ha area is a unique remnant of lower Murray floodplain. It has not been intensively developed and it retains much of its distinctive natural character of high biodiversity value wetlands in a semi-arid environment.
The area has been the subject of numerous scientific studies and investigations since the mid-1960s when pastoral leases were acquired by the South Australian Government in preparation for constructing Chowilla Dam. The dam was never constructed but significant engineering, geological and soils studies formed part of the preliminary dam-site investigations.
These investigations led, in part, to the recognition of high levels of salinity emanating from Chowilla Creek into the River Murray following large flooding events. By the early 1970s surface water flow and salinity studies through the anabranch system were aiming to quantify salt loads and reveal the salinity processes within the floodplain area.
In November 1991 the Murray-Darling Basin Commission considered recommendations of the Chowilla Working Group for implementing an integrated management plan for the area (Sharley and Huggan 1995).
Figure 1 Location of the Chowilla Anabranch (after Sharley and Huggan 1995).

Chowilla Anabranch System Report DWLBC 2004 / 06 Surface Water Information Summary
4
Since that time a wide range of scientific investigations and studies throughout the area has extended the understanding of its complex processes.
Together with the results of groundwater and other natural resource investigations, the surface water information compiled in this report will form the basis of planning for a range of environmental flow initiatives and salt interception scenarios that will help restore environmental values of the anabranch and manage salinity in the River Murray.
Chowilla Anabranch System Report DWLBC 2004 / 06 Surface Water Information Summary
5
2 AIM This report reviews surface water flow and salinity related investigations, studies and projects undertaken in the Chowilla Creek Anabranch from the early 1970s to present.
The revised results from this project are intended be used, in conjunction with groundwater information, to identify potential saline groundwater recharge areas and sources of surface salinity following floodplain inundation. This information will assist in the development of salt interception scheme designs.
Specific requirements of this project were to:
collate historical data and reports
identify major data gaps
identify indicative salt load ranges
identify indicative sources of these salt loads (recharge areas)
make recommendations for addressing major data gaps.
Chowilla Anabranch System Report DWLBC 2004 / 06 Surface Water Information Summary
6
3 METHODOLOGY This report summarises previously collected surface water data and information, which were held in a variety of formats and systems. Most this material was collected by the Department of Water, Land and Biodiversity Conservation (DWLBC) River Murray Hydrometric Services Unit and stored in the Riverland office at Berri.
The initial task was to source and collate all available original data and other reference material. Some summary information had been entered into digital files but almost no detailed data was in digital format.
The data had to be stored digitally within a structure that would provide a mechanism to calculate salt loads and other required information. A spreadsheet was thus created to contain all available detailed flow, salinity and water level data. Almost all detailed data had to be entered from original hard copy field sheets. Once data was in the digital spreadsheet, it was checked and validated against original field sheets and other independent data sources where available.
All available data and data processing methods were reviewed and, where necessary, revised to ensure that all resulting information was produced using appropriate uniform methods.
Data in the spreadsheet was arranged to allow calculations of salt load for standard subsystems within the anabranch as well as the overall total anabranch. The spreadsheet was designed to produce the greatest number of component results from the available data while applying uniform processes.
The flow, salinity and salt load results produced are summarised in this report. They may differ from previously published results that had not undergone as rigorous a data validation process and may have been produced at different times using different data processing methods.

Historical Data and Reports
Chowilla Anabranch System Report DWLBC 2004 / 06 Surface Water Information Summary
7
4 HISTORICAL DATA AND REPORTS
4.1 Information summary report Smith (2003) compiled an up-to-date catalogue of published reports and datasets associated with surface water investigations in the Chowilla Anabranch area. The catalogue forms a precursor to this more detailed information of this project which includes a review and revision of the data.
4.1.1 HYDSTUDY SPREADSHEET
A major source of information is the spreadsheet file Hydstudy.xls (Smith 2003) produced by DWLBC River Murray Hydrometric Services around 1994 to summarise flow and salinity studies in the Chowilla system since 1972. This spreadsheet was also used to calculate total anabranch salt loads and anabranch segment salt loads for each study. The original detailed sources of this data include SA Water and DWLBC hard copy operational files, dockets, plans and photos most of which are located in the DWLBC Riverland office at Berri. The results produced with this spreadsheet formed the basis of previously published Chowilla Anabranch hydrology information (Sharley and Huggan 1995).
Hydstudy.xls summarised 37 studies undertaken between June 1972 and February 1991. A number of flow and salinity studies have been completed since then and a number of previously unrecorded early studies have also been identified.
Appendix A of Smith (2003) included detailed readings at individual monitoring sites from 1986 to 1991, information previously held only in hard copy format in project files at Berri. A digital copy of this appendix was combined with the original Hydstudy.xls file to form the basis of a single spreadsheet, Chowilla_Flow_&_Salinity_Studies_Data.xls, containing all available detailed data for all flow and salinity studies to date (see Section 8.1 Detailed Dataset).
4.2 Additional reports In the process of collating the available Chowilla Anabranch surface water information a number of additional reports not listed in Smith (2003) were located. These reports have been registered in the Surface Water Library (Appendix A).
CSIRO Land and Water (previously Division of Water Resources), located at the Waite Campus, The University of Adelaide, has also been involved in ongoing studies in the Chowilla Anabranch since the early 1990s. Of the numerous reports and journal articles published by CSIRO, a number related to surface water processes in the Chowilla area have been obtained and registered in the Surface Water Library (Appendix B).
For completeness a ‘reference list’ of Chowilla related publications produced by DWLBC, CSIRO and other sources as prepared by Stokes (2004) is included as Appendix C.
Historical Data and Reports
Chowilla Anabranch System Report DWLBC 2004 / 06 Surface Water Information Summary
8
4.3 Digital datasets
4.3.1 HYDSTRA TIME SERIES
Hydstra Time Series (Hydstra TS) data management software is a technical data storage, processing and reporting system used by DWLBC to manage time series surface water data. It also holds detailed information about the monitoring sites at which time series data is collected and a range of other data and information associated with a site. Daily readings of water level and salinity and results of daily calculated flows made by SA Water operational personnel along the River Murray are stored in Hydstra TS as time series records. River Murray and Chowilla Anabranch flow gaugings made by DWLBC River Murray Hydrometric Unit personnel are also held in this system.
4.3.2 RIVERLAND REGIONAL FILES
Various other digital files containing Chowilla Anabranch flow, salinity, water level and other associated data are held on the Riverland Region, Berri office computer network (see Appendix D for a summary by subject).

Total Salt Load to River Murray
Chowilla Anabranch System Report DWLBC 2004 / 06 Surface Water Information Summary
9
5 TOTAL SALT LOAD TO RIVER MURRAY One of the primary objectives of surface water investigations has been to quantify the total salt load emanating from the Chowilla Anabranch and entering the River Murray.
5.1 Calculation of total salt load using daily read EC data Previously published salt load information (Sharley and Huggan 1995) was based on the difference between the electrical conductivity (EC; a measure of salinity levels) at Templeton, downstream (D/S) of Chowilla Creek, and the EC at Lock 6, upstream (U/S) of Chowilla Creek together with derived flow at gauging station AW426200, River Murray D/S Rufus River (see Figure 2).
Monthly average salinity and flow figures have been used to produce monthly average salt load rates representing the total contribution of the Chowilla Anabranch System. Salinity daily reading site Flow daily reading site Figure 2 Salt load monitoring — Daily readings
A number of assumptions are implicit in the calculation of salt load using this data:
Lock 6 U/S and Templeton daily EC reading must be a reasonable representation of the mean EC in the river cross-sections at those locations.
Flow data derived at the gauging station AW426200 must be a reasonable representation of the total flow in the River Murray downstream of the confluence with Chowilla Creek.
There is no additional salt load contributed by the Lock 6 to Templeton reach that is not emanating from Chowilla Creek.
Rufus River
River Murray
Chowilla Creek
AW426200 Templeton Lock 6
Lock 7
Chowilla
Anabranch System
Lake Victoria Storage
Mullaroo / Lindsay Anabranch System

Total Salt Load to River Murray
Chowilla Anabranch System Report DWLBC 2004 / 06 Surface Water Information Summary
10
5.1.1 DATA USED — DAILY EC READINGS
5.1.1.1 Templeton — AW426632 (602.9 km)
Daily read EC data is available in Hydstra TS from the start of monitoring on 5 November 1973 to the close of this site on 8 January 2003.
EC readings were generally made three times per week (Monday, Wednesday and Friday) by SA Water Lock 6 personnel or by DWLBC hydrographic personnel from Berri. The sampling point was located on the left (southern) bank of the River Murray downstream of Dix Cutting which tended to direct most flow towards the left bank providing good mixing.
EC profiles at this site show that the sampling location provided a good representation of average stream salinity at low to medium flows but was less representative at high flows (B Porter 2004, pers comm).
Routine daily EC readings stopped when a continuous EC probe at AW426704 D/S Chowilla Creek was established. Recent run-of-river surveys suggest that salt loads of 5–10 tonnes per day (t/d) were beginning to emerge from the southern side of the river between Lock 6 and Templeton (B Porter 2004, pers comm). Measuring downstream salinity of the Chowilla system at Templeton would thus overestimate the salt load contribution of the system.
5.1.1.2 Lock 6 Upstream — AW426510 (619.8 km)
Daily EC data is available in Hydstra TS from the start of routine EC readings by SA Water personnel on 2 November 1973 to the present.
Lock 6 personnel take an EC reading at this site seven days per week. Up to 5 February 1991 samples had sometimes been taken from the right bank (northern side) just upstream of the lock chamber; at other times they had been taken from a more central point on the weir. Samples from the bank are not considered representative of the whole cross-section of the stream as this is an area of non-flowing water, trapped upstream of the lock chamber gates. In addition saline groundwater discharge from the adjacent bank would be expected to increase salinity in the zone immediately next to the bank. No EC profile has been done at this site.
5.1.2 DATA USED — DAILY FLOW CALCULATION
5.1.2.1 River Murray D/S Rufus River — AW426200 (696.0 km)
Daily derived flow data is available in Hydstra TS from 5 April 1968, when the site began, to the present. Before this site was installed, flow figures were reported for ‘Downstream of Rufus River’ which was the sum of Lake Victoria outlet flow (through Rufus River) and Lock 9 (68 km U/S river distance) flow. This data, available in hard copy format in imperial units, is considered to be a poor representation of flow at this site due to the distance from the actual measurement locations and the associated travel time and flow attenuation.
AW426200 is operated by a contractor for a Victorian government agency on behalf of the MDBC. Flows derived from this site form the basis of the calculation of ‘Flow to SA’ (see

Total Salt Load to River Murray
Chowilla Anabranch System Report DWLBC 2004 / 06 Surface Water Information Summary
11
Section 5.1.2.2), the measure of River Murray flow into South Australia and the defined measurement of South Australia’s entitlement under the Murray-Darling Basin Agreement (Murray-Darling Basin Commission 1992). SA Water Lock 7 personnel also take daily staff gauge readings from which the flow is derived using a stage–discharge relationship (see below) table provided by the D/S Rufus River site operator.
Previously published Chowilla Anabranch salt load data used the flow at gauging station AW426200 (Sharley and Huggan 1995) but it could be confused with the Flow to SA figure which is also derived daily. Flows calculated at AW426200 are only those of the main stream of the River Murray downstream of Rufus River. Another significant component of River Murray streamflow into South Australia is through the Lindsay–Mullaroo Creek Anabranch system, bypassing AW426200 and rejoining the River Murray just downstream of Salt Creek, the uppermost inlet to the Chowilla Anabranch (see Figure 3).
The actual volume of water entering South Australia (Flow to SA) across the South Australian–Victorian border is not directly measured but calculated daily using the flow at AW426200 plus the flow through the Lindsay–Mullaroo Anabranch together with an allowance made for losses and extractions in this anabranch (Section 5.1.2.2).
Streamflow
Flow data at this site is based on a stage–discharge relationship (or rating curve) derived from a series of flow gauging measurements (discharge) taken regularly at a variety of levels (stages) since the gauging station was established. The rating is generally considered to be reliable at low to medium flows but less reliable in high flows that extend beyond the main river channel which forms the stage–discharge control at this site.
Low flows at this site are affected by changing stream channel conditions, particularly stream bed sand movement; the relationship between stage and stream discharge also varies. A ‘family’ of stage–discharge relationships has been established for these changing conditions and frequent flow gaugings are required to check and adjust the stage–discharge relationship.
Flows at this site are also affected by discharge from Lake Victoria via Rufus River which enters the River Murray immediately opposite this site. High flows from Rufus River elevate water levels at the gauging station creating an inconsistency with the developed stage–discharge relationship.
Travel time to SA from Rufus River
AW426200 is 84 km upstream of the confluence with Chowilla Creek and yet when salt returns from the Chowilla Anabranch to the River Murray are cited, no allowance is made for flow travel times over this reach. The effect of not applying a correction for travel time would be most significant at times of rapidly changing flows, particularly immediately after a high flow event when flows drop very rapidly. This is unfortunately coincidental with periods of the highest salt load being emitted from the floodplain systems. Even using monthly mean intervals of data the salt load results can be compromised by the lag effect of the travel time.
No reliable travel time information is available for this reach but in entitlement (low) flows a rate of 1 km/day (d) would be expected for the lower reach adjacent to the Chowilla Anabranch and 3–4 km/d for the reach U/S of Chowilla (B Porter 2004, pers comm). This

Total Salt Load to River Murray
Chowilla Anabranch System Report DWLBC 2004 / 06 Surface Water Information Summary
12
would mean that flow from the gauging station to the Chowilla reach could take approximately 20 days.
Evaporative losses
When used as the basis for calculating Chowilla Anabranch salt load increase to the River Murray no allowance is made for evaporation or other losses from the main stream of the River Murray between gauging station AW426200 and the Chowilla Creek confluence.
5.1.2.2 Flow to SA calculation
When the flow in the River Murray at AW426200 is less than 26,800 megalitres (ML)/d the flow in the Mullaroo Creek at gauging station AW414211 (see Figure 3) is added to the AW426200 flow and a volume of 250 ML/d for estimated losses and diversions in the Lindsay–Mullaroo Anabranch system is subtracted.
The Mullaroo Creek gauging station is located just upstream of Lock 7. Mullaroo Creek flows into the Lindsay River Anabranch system that rejoins the River Murray just upstream of the South Australian–Victorian border and downstream of Salt Creek the most upstream of the Chowilla Anabranch inlets (see Figure 3).
Flow data at Mullaroo Creek, AW414211, as used in the current Flow to SA calculation, began on 12 February 1977 and is derived from a stage–discharge relationship established over many years of flow gaugings. The rating is generally considered reliable at low to medium flow while it is contained within the stone embankment that forms the control at this site. This station is currently operated and maintained by a contractor for the Victorian Government. No continuous recorder is located at this site. A staff gauge is used to measure water level that is converted to a flow using the established stage–discharge relationship. SA Water Lock 7 personnel take daily gauge board readings used for the calculation of daily flows.
When flow in the River Murray at AW426200 is greater than 26,800 ML/d the flows for AW426200 are used and Mullaroo Creek flows are ignored.
Figure 3 provides a schematic diagram of the River Murray system and the components used to derive the Flow to SA volumes.
The daily flow formulas are:
Low flows (flow at AW426200 < 26,800 ML/d):
Flow to SA = flow @ AW426200 + flow @ GS414211 – 250 (ML/d)
High flows (flow at AW426200 > 26,800 ML/d):
Flow to SA = flow @ AW426200 (ML/d)

Total Salt Load to River Murray
Chowilla Anabranch System Report DWLBC 2004 / 06 Surface Water Information Summary
13
Frenchman Ck Mullaroo Ck AW414211 Lock 7
Rufus R. AW426200 River Salt Ck Murray
NSW Lindsay R VICTORIA SOUTH AUSTRALIA Lock 6 Figure 3 Schematic diagram of Flow to SA components
T5.1.2.3 River Murray @ calculated flow to SA — A4261001 T (virtual site at SA border)
Daily derived flow data is available in Hydstra TS from 12 February 1977 to present.
Before 12 February 1977 flow to South Australia was calculated by adding Lock 9 flow to Lake Victoria outlet flow.
5.1.3 SALT LOAD CALCULATION
Templeton and Lock 6 U/S daily EC data provides the best available historical data for calculating salt loads for the Chowilla system before February 2001 when continuous EC recorders were established (see Section 5.2.1).
However the selection of the most appropriate flow figure to be used with the daily read salinity data requires some further consideration. While the Flow to SA figure includes (at low ranges) an allowance for the Lindsay–Mullaroo Anabranch system it is based on the flow at gauging station AW426200 and thus includes within it all the poor characteristics of that location. Salt load figures derived from Flow to SA (A4261001) flow data, instead of gauging station AW426200 flow, were analysed as part of this project and it was found that their use increased the calculated salt load by +5% on average.
Before this project, the River Murray Hydrometric Services Unit calculated monthly mean salt load increase by using an Excel spreadsheet ‘CHOWSALT.xls’ based on average monthly EC readings at Templeton and Lock 6 U/S, and flow at AW426200 extracted from Hydstra TS.
Lake Victoria In low flows assume 250 ML/d use and losses
Chowilla
Anabranch
Total Salt Load to River Murray
Chowilla Anabranch System Report DWLBC 2004 / 06 Surface Water Information Summary
14
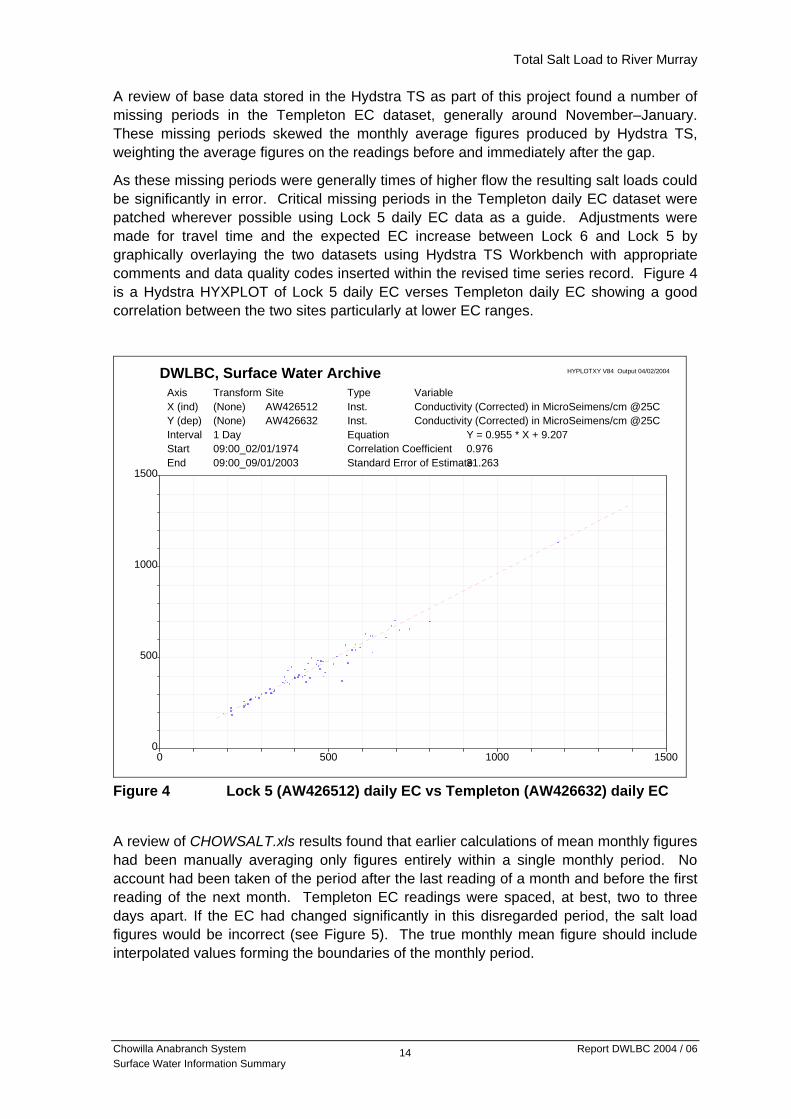
A review of base data stored in the Hydstra TS as part of this project found a number of missing periods in the Templeton EC dataset, generally around November–January. These missing periods skewed the monthly average figures produced by Hydstra TS, weighting the average figures on the readings before and immediately after the gap.
As these missing periods were generally times of higher flow the resulting salt loads could be significantly in error. Critical missing periods in the Templeton daily EC dataset were patched wherever possible using Lock 5 daily EC data as a guide. Adjustments were made for travel time and the expected EC increase between Lock 6 and Lock 5 by graphically overlaying the two datasets using Hydstra TS Workbench with appropriate comments and data quality codes inserted within the revised time series record. Figure 4 is a Hydstra HYXPLOT of Lock 5 daily EC verses Templeton daily EC showing a good correlation between the two sites particularly at lower EC ranges.
0 500 1000 1500
DWLBC, Surface Water Archive HYPLOTXY V84 Output 04/02/2004
Axis Transform Site Type Variable X (ind) (None) AW426512 Inst. Conductivity (Corrected) in MicroSeimens/cm @25C Y (dep) (None) AW426632 Inst. Conductivity (Corrected) in MicroSeimens/cm @25C Interval 1 Day Equation Y = 0.955 * X + 9.207 Start 09:00_02/01/1974 Correlation Coefficient 0.976 End 09:00_09/01/2003 Standard Error of Estimate31.263
0
500
1000
1500
Figure 4 Lock 5 (AW426512) daily EC vs Templeton (AW426632) daily EC
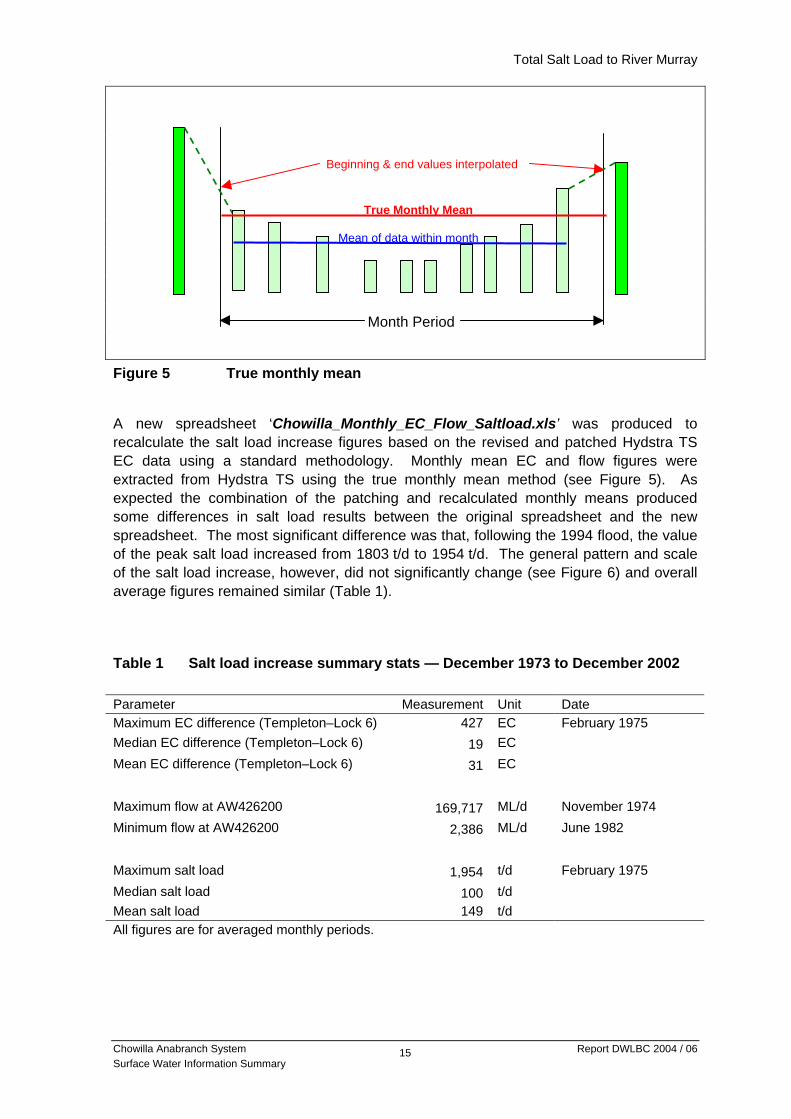
A review of CHOWSALT.xls results found that earlier calculations of mean monthly figures had been manually averaging only figures entirely within a single monthly period. No account had been taken of the period after the last reading of a month and before the first reading of the next month. Templeton EC readings were spaced, at best, two to three days apart. If the EC had changed significantly in this disregarded period, the salt load figures would be incorrect (see Figure 5). The true monthly mean figure should include interpolated values forming the boundaries of the monthly period.
Total Salt Load to River Murray
Chowilla Anabranch System Report DWLBC 2004 / 06 Surface Water Information Summary
15
Month Period
Figure 5 True monthly mean
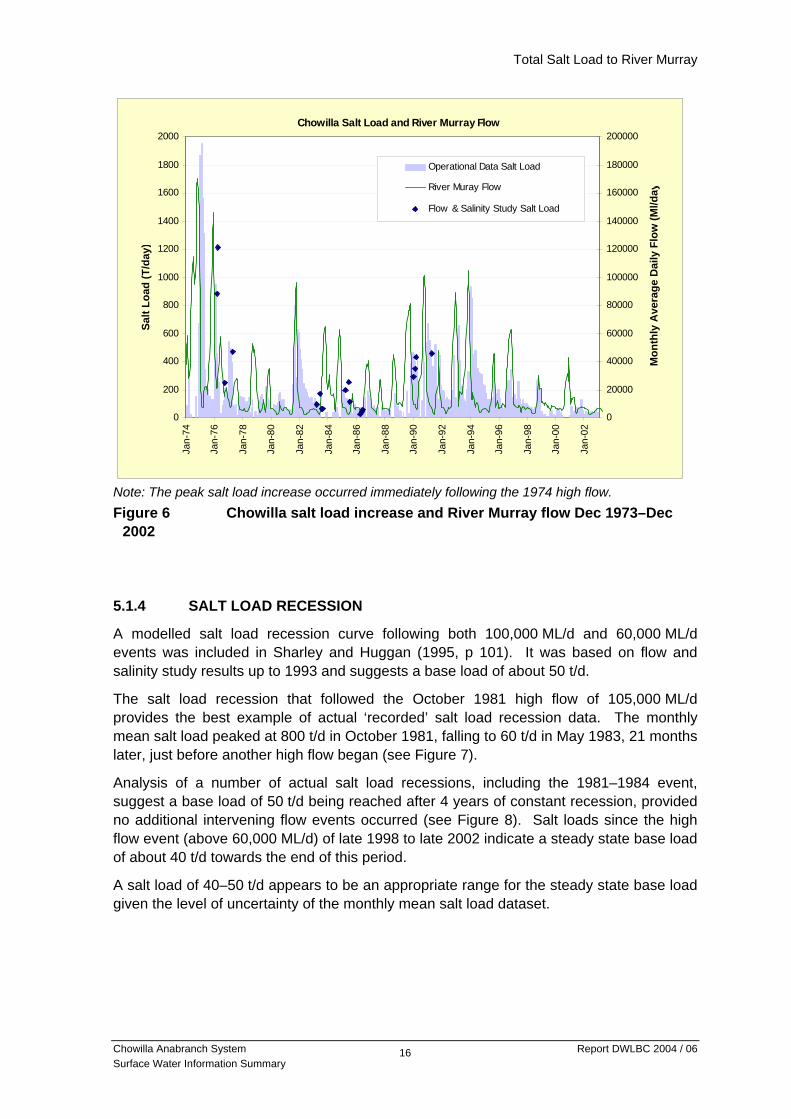
A new spreadsheet ‘Chowilla_Monthly_EC_Flow_Saltload.xls’ was produced to recalculate the salt load increase figures based on the revised and patched Hydstra TS EC data using a standard methodology. Monthly mean EC and flow figures were extracted from Hydstra TS using the true monthly mean method (see Figure 5). As expected the combination of the patching and recalculated monthly means produced some differences in salt load results between the original spreadsheet and the new spreadsheet. The most significant difference was that, following the 1994 flood, the value of the peak salt load increased from 1803 t/d to 1954 t/d. The general pattern and scale of the salt load increase, however, did not significantly change (see Figure 6) and overall average figures remained similar (Table 1).
Table 1 Salt load increase summary stats — December 1973 to December 2002 Parameter Measurement Unit Date Maximum EC difference (Templeton–Lock 6) 427 EC February 1975 Median EC difference (Templeton–Lock 6) 19 EC Mean EC difference (Templeton–Lock 6) 31 EC Maximum flow at AW426200 169,717 ML/d November 1974 Minimum flow at AW426200 2,386 ML/d June 1982 Maximum salt load 1,954 t/d February 1975 Median salt load 100 t/d Mean salt load 149 t/d All figures are for averaged monthly periods.
Mean of data within month
True Monthly Mean
Beginning & end values interpolated
Total Salt Load to River Murray
Chowilla Anabranch System Report DWLBC 2004 / 06 Surface Water Information Summary
16
Note: The peak salt load increase occurred immediately following the 1974 high flow. Figure 6 Chowilla salt load increase and River Murray flow Dec 1973–Dec
2002
5.1.4 SALT LOAD RECESSION
A modelled salt load recession curve following both 100,000 ML/d and 60,000 ML/d events was included in Sharley and Huggan (1995, p 101). It was based on flow and salinity study results up to 1993 and suggests a base load of about 50 t/d.
The salt load recession that followed the October 1981 high flow of 105,000 ML/d provides the best example of actual ‘recorded’ salt load recession data. The monthly mean salt load peaked at 800 t/d in October 1981, falling to 60 t/d in May 1983, 21 months later, just before another high flow began (see Figure 7).
Analysis of a number of actual salt load recessions, including the 1981–1984 event, suggest a base load of 50 t/d being reached after 4 years of constant recession, provided no additional intervening flow events occurred (see Figure 8). Salt loads since the high flow event (above 60,000 ML/d) of late 1998 to late 2002 indicate a steady state base load of about 40 t/d towards the end of this period.
A salt load of 40–50 t/d appears to be an appropriate range for the steady state base load given the level of uncertainty of the monthly mean salt load dataset.
Chowilla Salt Load and River Murray Flow
0
200
400
600
800
1000
1200
1400
1600
1800
2000
Jan-
74
Jan-
76
Jan-
78
Jan-
80
Jan-
82
Jan-
84
Jan-
86
Jan-
88
Jan-
90
Jan-
92
Jan-
94
Jan-
96
Jan-
98
Jan-
00
Jan-
02
Salt
Load
(T/d
ay)
0
20000
40000
60000
80000
100000
120000
140000
160000
180000
200000
Mon
thly
Ave
rage
Dai
ly F
low
(Ml/d
ay
Operational Data Salt Load
River Muray Flow
Flow & Salinity Study Salt Load

Total Salt Load to River Murray
Chowilla Anabranch System Report DWLBC 2004 / 06 Surface Water Information Summary
17
Figure 7 Salt load recession 1981–82
Figure 8 Salt load recession curve
Chowilla Salt Load and Flow RecessionDerived from Daily Read Data ~ January 1981 to January 1984
0
100
200
300
400
500
600
700
800
900
1000
Jan-
81
Mar
-81
May
-81
Jul-8
1
Sep
-81
Nov
-81
Jan-
82
Mar
-82
May
-82
Jul-8
2
Sep
-82
Nov
-82
Jan-
83
Mar
-83
May
-83
Jul-8
3
Sep
-83
Nov
-83
Jan-
84
Mon
thly
Ave
rage
Dai
ly S
alt L
oad
(T/d
)
0
10000
20000
30000
40000
50000
60000
70000
80000
90000
100000
Mon
thly
Ave
rage
Dai
ly F
low
(Ml/d
)
Salt Load
River Muray Flow
Chowilla Anabranch Salt Load Recession
y = 1011.7x-0.7701
0
100
200
300
400
500
600
700
800
900
1000
1100
0 5 10 15 20 25 30 35 40Months
Mea
n M
onth
ly S
alt L
oad
(T/d
)

Total Salt Load to River Murray
Chowilla Anabranch System Report DWLBC 2004 / 06 Surface Water Information Summary
18
5.2 Calculation of total salt load using continuous EC data
5.2.1 CONTINUOUSLY RECORDED EC DATA
In February 2001 two new continuously recording salinity monitoring sites were established specifically for the purpose of monitoring the increase in EC in the River Murray resulting from the Chowilla Anabranch. The sites are located in the River Murray 0.3 km upstream (AW426705) and 4.0 km downstream (AW426704) of the confluence of Chowilla Creek and the River Murray (see Figure 9).
These sites consist of an EC sensor and data logger mounted on a floating pontoon positioned midstream (see Figure 10). Before the sites were established, EC profiles were used to determine their suitability for representing the whole stream cross-section.
River Murray D/S Chowilla Creek — AW426704 (609.0 km)
Continuously recorded EC data is available in Hydstra TS from 15 February 2001 to present.
River Murray U/S Chowilla Creek — AW426705 (612.3 km)
Continuously recorded EC data is available in Hydstra TS from 15 February 2001 to present. Salinity Continuous Recording Site Flow Daily Reading Site Figure 9 Salt load monitoring — Continuous EC recorders
A4261022 AW426705
Rufus River
River Murray
Chowilla Creek
GS426200 AW426704
Lock 6Lock 7
Chowilla
Anabranch System
Lake Victoria Storage
Mullaroo / Lindsay Anabranch System

Total Salt Load to River Murray
Chowilla Anabranch System Report DWLBC 2004 / 06 Surface Water Information Summary
19
Figure 10 A4261022 continuous EC recorder pontoon
An EC recording pontoon was also established in the River Murray just downstream of the SA–Victoria border (AW4261022) in August 2002 (see Figures 9, 10). This site was positioned principally to monitor the salinity of water crossing the border into SA. Being close to the upper end of the Chowilla reach, it also provides an indication of the salinity of water entering Salt Creek and Hyperna Creek from the River Murray. It is, however, downstream of Lindsay River and will therefore include any salt load, and associated EC increase, originating from the Lindsay–Mullaroo Anabranch (see Figure 9).
Murray R U/S Old Customs House — A4261022 (637.1 km)
Continuously recorded EC data is available in Hydstra TS from 8 August 2002 to present.
5.2.2 CONTINUOUS RECORDED EC COMPARED TO DAILY READ EC
Monthly mean EC measured at the pre-existing daily EC reading site was compared with the new continuous recording locations in the Chowilla_Monthly_EC_Flow_Saltload.xls spreadsheet (see Appendix E for a summary).

Total Salt Load to River Murray
Chowilla Anabranch System Report DWLBC 2004 / 06 Surface Water Information Summary
20
A review of data from these sites shows the following:
The new continuous recorder site downstream of Chowilla Creek varies from the Templeton daily read site, 6.1 km downstream, by +7 to –18 EC averaging –1 EC. The large EC differences in October–November 2001 are due to poor or missing data at Templeton.
The new continuous recorder site upstream of Chowilla varies from the Lock 6 U/S daily read site, 7.5 km upstream, by +24 to +1 EC averaging +11 EC. The rise in EC between these two locations is supported by run-of-river studies (B Porter 2004, pers comm). Salinity can be expected to rise immediately downstream of a weir because the head of groundwater it creates induces saline seepage immediately downstream of the weir.
The new continuous recorder site U/S of the Old Customs House (at the SA–Vic border) varies from the Lock 6 U/S daily read site, 17.3 km downstream, by +20 to –10 EC averaging +7 EC. Some increase can be expected over this distance but the period of mutual data is currently too short to draw any specific conclusions.
The effect of using monthly mean EC data based on the continuous recorders in place of the daily read sites is a decrease in salt load ranging from –4 t/d to –94 t/d averaging –30 t/d (–61%) for the period of mutually available data.
This difference is mainly due to the increase in EC between Lock 6 and the new U/S Chowilla continuous recorder site. Using the continuous recording sites excludes the reach immediately downstream of Lock 6 and the associated salt load. However, the period of mutual record is only 22 months from March 2001, a period of continuous low flows (average 6100 ML/d), and low salt load increase (average 19 t/d) and a longer period of more variable conditions is required to make any meaningful comparisons.
The site at Templeton was abandoned in January 2003 but daily readings have continued at Lock 6 U/S. A longer period of comparing the new continuous recorder U/S Chowilla and Lock 6 U/S daily EC data is needed so that historical salt load data based on daily EC readings can be adjusted to supplement the new continuously recorded EC dataset.
5.3 Preliminary uncertainty analysis in daily EC data Anecdotal evidence suggested that historical daily data used to calculate salt loads generated by the Chowilla Anabranch was prone to large uncertainties and may not be appropriate for estimating salt returning to the River Murray for modern assessment and reporting purposes (P Stace 2004, pers comm).
A preliminary analysis of two key daily datasets, Lock 6 U/S and Templeton, attempted to quantify the uncertainty associated with daily salinity data and to provide a clearer perspective on the wider historic and modern River Murray hydrometric dataset collected by operational (SA Water) personnel.
5.3.1 PROCEDURE
The two datasets (only 1975–1996 available in Hydstra TS) were first tested to reveal if they were statistically different. If the data proved statistically indistinguishable then they could not be used to confidently estimate salt tonnage from Chowilla. Uncertainties in the data were quantified using advice from an appropriately experienced field technician and

Total Salt Load to River Murray
Chowilla Anabranch System Report DWLBC 2004 / 06 Surface Water Information Summary
21
compound uncertainties were derived using standard techniques. Flow from D/S Rufus River was then analysed to investigate possible associations between frequency of flow events and EC uncertainty. All data and analyses are contained in the attached computer file EC_Uncertainty.xls.
5.3.1.1 Statistical analysis
The Lock 6 and Templeton EC datasets were tested for similarity using Chi-Squared and Kolmogorov-Smirnov tests as described in Press et al (1999).
5.3.1.2 Uncertainty in EC estimates
Estimates of the uncertainties associated with the most significant aspects of salinity data collection at Templeton and Lock 6 U/S were quantified by Mr Peter Stace, a qualified hydrographer with 30 years experience, 10 years supervising River Murray hydrographic operations (see Table 2).
Estimations were made of the systematic errors associated with how closely the EC value recorded at the monitoring site represented the average EC across the river cross-section, and the random errors inherent in instrument specifications and operator error (Quality Assurance).
Uncertainty in River Murray streamflow at D/S Rufus River was also estimated (Table 3) but project time constraints did not allow further analysis. The data is only presented here to highlight issues and the need for similar work elsewhere along the River Murray.
5.3.1.3 Combination of EC errors
Random and systematic error estimates were combined into an overall uncertainty estimate using a root sum of squares procedure as described in Australian Standard AS 3778.4.6–1991 (Standards Australia 1991, section 10.6) and Bos (1989). Total uncertainty was equated to the square root of the combined squares of all random and systematic errors (see below).
XBECSystematicB = ± (XBProfilePB
2P + XBInstSpecsPB
2P) P
½P
XBECRandomB = ± (XBQAPB
2P) P
½P
The single random error (Quality Assurance) makes combination of errors straightforward.
XBECTotal B = ± (XBSystematicPB
2P + XBRandomPB
2P) P
½P
= ± (XBProfilePB
2P + XBInstSpecsPB
2P + XBQAPB
2P) P
½P
XBECRandomB = Total random errors identified in Table 2.
XBSystematiclB = Total systematic errors identified in Table 2.
XBECTotal B = Total uncertainty in EC measurement.
5.3.1.4 Flow frequency
Salt returns from Chowilla are a function of River Murray streamflow (Sharley and Huggan 1995; Section 8 this report). At normal flows the difference between EC data at Lock 6

Total Salt Load to River Murray
Chowilla Anabranch System Report DWLBC 2004 / 06 Surface Water Information Summary
22
and Templeton tends to be small and any uncertainties are likely to be relatively large. Variations in EC uncertainty were reviewed with different flows events by completing a standard frequency analysis of D/S Rufus River streamflow data (see Section 2, Pilgram 1998).
5.3.2 RESULTS AND DISCUSSION
5.3.2.1 Statistical analysis
Plots of the Chi-Squared and Kolmogorov-Smirnov tests are shown in Figures 11 and 12 respectively.
Frequency Distribution of Binned EC Data
0
200
400
600
800
1000
1200
50 100 150 200 250 300 350 400 450 500 550 600 650 700 750 800 850 900
EC Bins
Freq
uenc
y
AW426632 Templeton
AW426510 Lock 6 U/S
Figure 11 Binned Chi-Squared EC frequency data
Lock 6 (6365 points) and Templeton (3122 points) datasets had sufficiently large numbers of points to produce robust Kolmogorov-Smirnov frequency distributions, while the Chi-Squared test was configured for datasets with different sample size (Press et al 1999).
Both the statistical tests indicated that as complete datasets both represented different distributions at a high level of significance (α < 0.01). This would suggest that the historic datasets were sufficiently different in character to be used in estimating salt returns.

Total Salt Load to River Murray
Chowilla Anabranch System Report DWLBC 2004 / 06 Surface Water Information Summary
23
Kolmogorov-Smirnov Cumulative Distributions
0.0
0.1
0.2
0.3
0.4
0.5
0.6
0.7
0.8
0.9
1.0
100 200 300 400 500 600 700 800 900 1000
EC
Cum
ulat
ive
Dis
trib
utio
n Fu
nctio
ns
AW426510 Lock 6 U/S
AW426632 Templeton
Maximum difference betw een tw ocumulative distributions of 0.178 at 500 EC
Figure 12 Cumulative K-S EC frequency data
5.3.2.2 Uncertainty estimates
Estimates of the uncertainties associated with the most significant aspects of salinity data collection at Lock 6 and Templeton are shown in Table 2. The size of the error estimates is considered conservative.
Lock 6 data is expected to contain a significant systematic uncertainty to 1991 when many readings were made adjacent to the river bank, a site that could reasonably be expected to vary from the average EC across the river by at least 15% (P Stace 2004, pers comm). After 1991 a more suitable site was chosen in the middle of the river that would not be expected to vary from the average river EC by more than 5%.
Instrument errors are simply a historical reality associated with technical developments over the years. Before about 1985, a Kent Bridge meter could be expected to deliver an estimate of the sample EC to within 10%; modern instruments are much more precise (within 1%).
Random errors arise when poorly trained officers take measurements. With more training in quality managed hydrographic methods, operational technicians can improve the quality of the data collected. Without it, great variations in data are possible as are poorly calibrated or maintained instruments, and inappropriate operation or techniques. All the data analysed was collected by operational personnel with limited hydrographic training with a conservative uncertainty of 5%. In practice this figure may range up to 20%.
Chowilla Creek Flow
Chowilla Anabranch System Report DWLBC 2004 / 06 Surface Water Information Summary
24
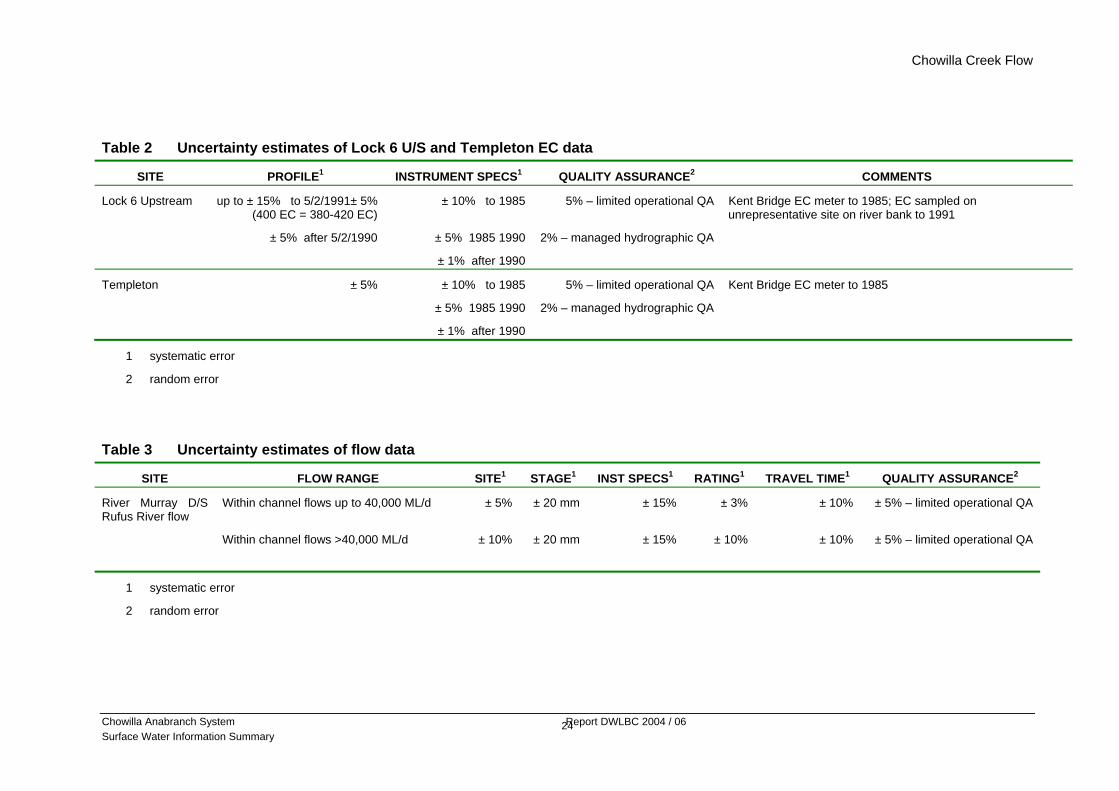
Table 2 Uncertainty estimates of Lock 6 U/S and Templeton EC data
SITE PROFILEP
1P INSTRUMENT SPECSP
1P QUALITY ASSURANCE P
2P COMMENTS
Lock 6 Upstream up to ± 15% to 5/2/1991± 5% (400 EC = 380-420 EC)
± 10% to 1985 5% – limited operational QA Kent Bridge EC meter to 1985; EC sampled on unrepresentative site on river bank to 1991
± 5% after 5/2/1990 ± 5% 1985 1990 2% – managed hydrographic QA
± 1% after 1990
Templeton ± 5% ± 10% to 1985 5% – limited operational QA Kent Bridge EC meter to 1985
± 5% 1985 1990 2% – managed hydrographic QA
± 1% after 1990
1 systematic error
2 random error
Table 3 Uncertainty estimates of flow data
SITE FLOW RANGE SITEP
1P STAGEP
1P INST SPECSP
1P RATING P
1P TRAVEL TIMEP
1P QUALITY ASSURANCE P
2P
River Murray D/S Rufus River flow
Within channel flows up to 40,000 ML/d ± 5% ± 20 mm ± 15% ± 3% ± 10% ± 5% – limited operational QA
Within channel flows >40,000 ML/d ± 10% ± 20 mm ± 15% ± 10% ± 10% ± 5% – limited operational QA
1 systematic error
2 random error

Chowilla Creek Flow
Chowilla Anabranch System Report DWLBC 2004 / 06 Surface Water Information Summary
25
Templeton and Lock 6 U/S Corrected EC Data; 1981 Event
-
200
400
600
800
1,000
1,200
24/04/1981 02/08/1981 10/11/1981 18/02/1982 29/05/1982 06/09/1982 15/12/1982
Date
Cor
rect
ed E
C a
t 25C
-
20,000
40,000
60,000
80,000
100,000
120,000
Dis
char
ge (M
L/da
y)
AW426632 Templeton EC
+ limit
- limit
AW426510 Lock 6 U/S EC
+ limit
- limit
AW426200 D/S Rufus River Flow
Templeton and Lock 6 U/S Corrected EC Data; 1993 Event
-
200
400
600
800
1,000
1,200
31/01/1993
22/03/1993
11/05/1993
30/06/1993
19/08/1993
08/10/1993
27/11/1993
16/01/1994
07/03/1994
26/04/1994
15/06/1994
Date
Cor
rect
ed E
C a
t 25C
-
20,000
40,000
60,000
80,000
100,000
120,000
Dis
char
ge (M
L/da
y)
AW426632 Templeton EC+ limit- limitAW426510 Lock 6 U/S EC+ limit- limitAW426200 D/S Rufus River Flow
Figure 13 River Murray streamflow and Lock 6 & Templeton EC for two flood
events
Chowilla Creek Flow
Chowilla Anabranch System Report DWLBC 2004 / 06 Surface Water Information Summary
26
The plot of the flow from D/S Rufus River and EC with uncertainty error bars (Figure 13) in 1981 and 1993 shows the reduction in the uncertainty range with improved monitoring over time. However, despite statistically significant differences between the Lock 6 and Templeton datasets as a whole (see above), they only show resolution beyond a common uncertainty range and into distinct datasets following River Murray streamflow events of at least 30,000–40,000 ML/d (Figure 13).
This would suggest that difficulties may be expected when using daily data to estimate salt loads from Chowilla, under in-channel flow conditions, typically less than approximately 35,000 ML/day (Sharley and Huggan 1995, pp 92–94). This reinforces the comments made in Section 5.1 on the data quality of the two EC datasets, River Murray streamflow D/S of Rufus River (see also Table 3) and issues with base salt load estimation using daily data.
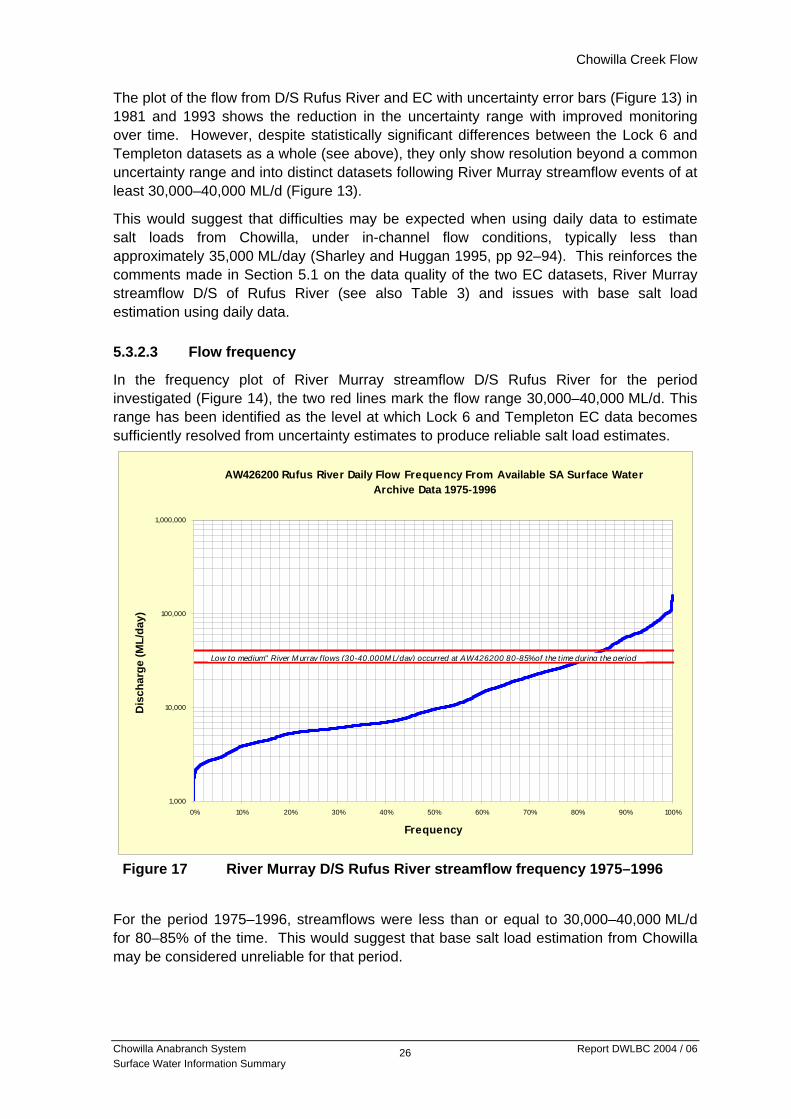
5.3.2.3 Flow frequency
In the frequency plot of River Murray streamflow D/S Rufus River for the period investigated (Figure 14), the two red lines mark the flow range 30,000–40,000 ML/d. This range has been identified as the level at which Lock 6 and Templeton EC data becomes sufficiently resolved from uncertainty estimates to produce reliable salt load estimates.
AW426200 Rufus River Daily Flow Frequency From Available SA Surface Water Archive Data 1975-1996
1,000
10,000
100,000
1,000,000
0% 10% 20% 30% 40% 50% 60% 70% 80% 90% 100%
Frequency
Dis
char
ge (M
L/da
y)
Low to medium" River M urray f lows (30-40,000M L/day) occurred at AW426200 80-85% of the t ime during the period
Figure 17 River Murray D/S Rufus River streamflow frequency 1975–1996
For the period 1975–1996, streamflows were less than or equal to 30,000–40,000 ML/d for 80–85% of the time. This would suggest that base salt load estimation from Chowilla may be considered unreliable for that period.

Chowilla Creek Flow
Chowilla Anabranch System Report DWLBC 2004 / 06 Surface Water Information Summary
27
5.3.3 CONCLUSIONS AND RECOMMENDATIONS
Daily EC data at Lock 6 and Templeton is least affected by uncertainties in monitoring techniques following flood events of greater than 40,000 ML/day, which generate salinities greater than 500 EC for recession periods of up to a year.
While the Chi-Squared and Kolmogorov–Smirnov tests indicated that as entire datasets Lock 6 and Templeton are sufficiently distinct to make meaningful salt load estimates from Chowilla, compounded uncertainty in daily EC monitoring techniques suggest that these estimates may be unreliable for 80% of the period between 1975–1996.
The uncertainty could easily be greater considering the data quality issues presented in Section 5.1, including misaligned EC data collection at Lock 6 and Templeton, and inherent problems in River Murray flow estimation.
It is recommended that all hydrological analysis, especially those using daily data, routinely include a similar analysis to that described here.
5.3.3.1 Recommended improvements to the method Expand the statistical analysis for difference on the paired EC datasets into different
flow regimes. Analyse the EC data associated with both in-channel and over-bank flows (above and below approximately 35,000 ML/d) with particular regard for the periods before and after floods.
Quantify uncertainty in River Murray flows at Chowilla and combine it with EC errors to produce a direct estimate of uncertainty in salt loads.
Complete a similar analysis of uncertainty for continuously collected data, with appropriate consideration for the different nature of the data.
Measure hydrological parameters directly and continuously wherever possible to minimise uncertainty. Select appropriate equipment prudently and deploy it carefully in full consideration of the characteristics of available sites. Operate and maintain equipment systematically, preferably according to quality assurance principles, to ensure maximum possible reliability in the data.

Chowilla Creek Flow
Chowilla Anabranch System Report DWLBC 2004 / 06 Surface Water Information Summary
28
6 CHOWILLA CREEK FLOW
6.1 Calculated flow Determining the total volume of River Murray flow passing through the Chowilla Anabranch under varying river conditions is critical to understanding the characteristics of the floodplain systems. Previous published material (Sharley and Huggan 1995) attempted to quantify the volume of flow through Chowilla by subtracting the monthly mean of daily calculated flow at Lock 6 from monthly mean of daily calculated flow at gauging station AW426200 (D/S Rufus River). Figure 15 shows the estimated flow and percentage of River Murray flow passing through the Chowilla Anabranch compared to River Murray flow at AW426200 and Lock 6 from January 1995 to July 2003. During high flow periods when the weir is removed, flow data for Lock 6 is not available and flow through the Chowilla Anabranch cannot be calculated.
Figure 15 River Murray flow through Chowilla Anabranch
Comparing the calculated percentage of River Murray monthly mean flow passing through Chowilla against the total monthly mean flow in the river (Figure 16) shows that, at low flows, most water flows into the anabranch, bypassing Lock 6. Up to 90% of total River Murray flow can pass into the anabranch in very low river flow conditions (< 2500 ML/d). By contrast only 10% of the total river flow bypasses through the anabranch in higher river flows (> 25,000 ML/d).
Chowilla Anabranch FlowsBased on AW426200-Lock 6 Daily Flow Calculations
0
10000
20000
30000
40000
50000
60000
70000
Jan-
95
Jul-9
5
Jan-
96
Jul-9
6
Jan-
97
Jul-9
7
Jan-
98
Jul-9
8
Jan-
99
Jul-9
9
Jan-
00
Jul-0
0
Jan-
01
Jul-0
1
Jan-
02
Jul-0
2
Jan-
03
Jul-0
3
Flow
(Mon
thly
Ave
rage
Ml/d
ay)
0%
10%
20%
30%
40%
50%
60%
70%
80%
90%
100%
% o
f Mur
ray
flow
Thr
ough
Cho
will
a
% of River
GS426200
Lock 6
Chow illa

Chowilla Creek Flow
Chowilla Anabranch System Report DWLBC 2004 / 06 Surface Water Information Summary
29
Figure 16 Percentage of River Murray flow through Chowilla (based on daily data)
Using mean monthly flow figures tends to absorb some of the effect of travel time between AW426200 and Lock 6 but this method can only provide an approximation of flow through the system on a monthly interval.
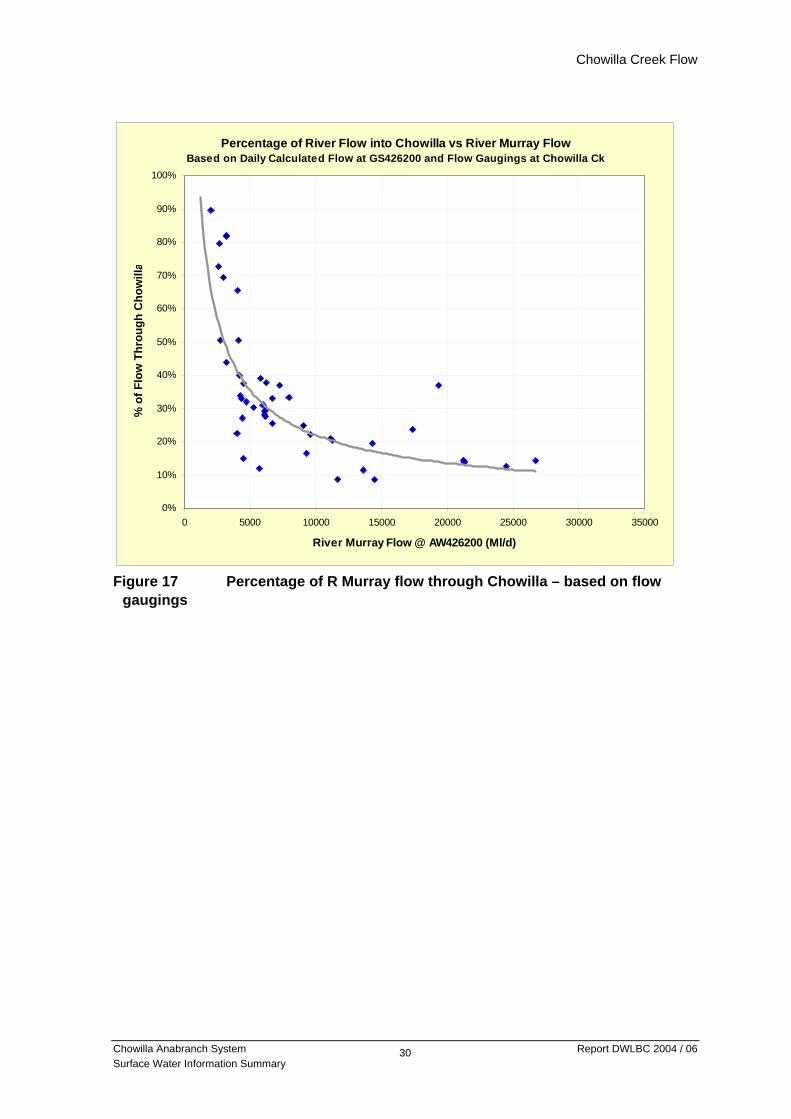
Direct measurements of flow in the lower reach of Chowilla Creek provide actual flow values at a specific time on a particular day. Over 40 flow gaugings have been made in the lower reach of Chowilla Creek as part of individual flow and salinity studies. A comparison of Chowilla Creek measured flow with Lock 6 daily calculated flow for the same day, produces a similar result to using mean monthly daily calculated flow data but is not affected by travel time and monthly averaging (see Figure 17).
Flow gauging results in the lower reach of Chowilla Creek can be relied upon to provide an accurate measure of flow from the Chowilla Anabranch. The daily calculated flow figure for Lock 6, however, is based on water level observations and measurements or estimations of the crest level of the weir stop logs and boule panels. These values are entered into a SA Water weir flow calculation program (Lockflow), which has not been calibrated for the Lock 6 structure. The nature of the structures, the methods used to collect the data and the difficulty in accounting for leakage through the weir, also combine to create a significant range of uncertainty in the results.
Percentage of River Flow into Chowilla vs River Murray FlowBased on GS426200-Lock 6 Daily Flow Calculations
0%
10%
20%
30%
40%
50%
60%
70%
80%
90%
100%
0 5000 10000 15000 20000 25000 30000 35000
Monthly Average River Murray Flow @ AW426200 (Ml/d)
% o
f Flo
w T
hrou
gh C
how
illa
Chowilla Creek Flow
Chowilla Anabranch System Report DWLBC 2004 / 06 Surface Water Information Summary
30
Figure 17 Percentage of R Murray flow through Chowilla – based on flow gaugings
Percentage of River Flow into Chowilla vs River Murray FlowBased on Daily Calculated Flow at GS426200 and Flow Gaugings at Chowilla Ck
0%
10%
20%
30%
40%
50%
60%
70%
80%
90%
100%
0 5000 10000 15000 20000 25000 30000 35000
River Murray Flow @ AW426200 (Ml/d)
% o
f Flo
w T
hrou
gh C
how
illa

Chowilla Creek Flow
Chowilla Anabranch System Report DWLBC 2004 / 06 Surface Water Information Summary
31
6.2 Measured flow Flow gauging measurements were made on 14 January 2004 at the River Murray U/S Wompinni Station (U/S Salt Creek and Chowilla Anabranch), Lindsay River U/S of River Murray, Chowilla Creek at the bridge, and River Murray U/S Chowilla Creek (Figure 18). Even during this period of steady low flow when minimal travel time effects would occur, there were discrepancies with the calculated flow figures, some quite large (Table 4).
Of particular note is the difference in Chowilla Creek between measured flow (2,186 ML/d) and calculated flow (based on the calculated Flow to SA minus the flow at Lock 6). The daily calculated flow overestimates Chowilla Creek flows by 46% (Table 4). This is in part due to the daily flow for Lock 6, which underestimates flow by 27% (Table 4). The remaining portion of overestimation of Chowilla Creek flow is likely to be due to the effect of travel time from D/S Rufus River to Lock 6.
This is the only set of flow measurements taken that provide this level of comparison. However, the results do support some long-term concerns about the accuracy of results from the Lockflow program and the suitability of using flows from AW426200 for the Chowilla reach (see Section 9).
Flow gauging Flow daily reading site All flow figures in ML/d Figure 18 Flow gaugings and daily read flows, 14 January 2004
7560 Flow to SA 831
Lin R
6404360
Rufus R
River Murray
Chowilla Creek
7170 AW426200
Lock 6 Lock 7
Chowilla
Anabranch System
Lake Victoria Storage
2186 Bridge
Monoman Ck
Mullaroo / Lindsay Anabranch System
5939 U/S Ch Ck
Wom St
6924

Chowilla Creek Flow
Chowilla Anabranch System Report DWLBC 2004 / 06 Surface Water Information Summary
32
Table 4 Comparison of measured flows and daily calculated flows
Measurement or calculation localities Measured (ML/d)
Calculated (ML/d)
Diff (ML/d)
Diff (%)
River Murray D/S Rufus River flow
R Murray U/S Wompinni Station – gauging 6924
Daily calculated flow at AW426200 7170 246 (3.6)
Flow to SA
R Murray U/S Wompinni Station – gauging 6924
Lindsay River U/S R Murray – gauging 831
Flow to SA 7755 7560 195 (2.5)
River Murray Lock 6 flow
R. Murray U/S Chowilla Ck – gauging 5939
Daily calculated flow at Lock 6 4360 1579 (27)
Chowilla Anabranch flow
Chowilla Creek at bridgeP
1P – gauging 2186
Daily calculated Flow to SA 7560
Daily calculated flow at Lock 6 4360
Daily calculated flow Chowilla Anabranch 3200 1014 (46)
1 Negligible flow in Monoman Creek

Evaporation Losses
Chowilla Anabranch System Report DWLBC 2004 / 06 Surface Water Information Summary
33
7 EVAPORATION LOSSES Water losses from the system need to be considered when quantifying surface water flow through the Chowilla Anabranch. Current land use includes some grazing but extractions for stock use are assumed to be very small and do not need to be further considered within the context of overall surface water flows. Evaporation losses in the anabranch and in the main River Murray between gauging station AW426200 and the confluence with Chowilla Creek have a much larger impact but they have not previously been reported.
This section provides a basic estimate of evaporation losses that influence the calculation of flow through the anabranch, beginning with estimates of water surface area.
7.1 Surface water area
7.1.1 CHOWILLA ANABRANCH
At normal ‘pool’ level and low River Murray flow of 3,100 ML/d, the area of backwaters and creek systems in South Australian portion of anabranch totals 192 ha (E&WS Water Resources Branch 1974).
An additional estimated 15% of the floodplain extends into NSW.
Total anabranch surface water area (SA and NSW) at ‘normal pool level’ ≅ 220 ha.
Inundation areas derived from satellite photography for River Murray flow conditions of 35,000 ML/d to 300,000 ML/d are provided in Sharley and Huggan (1995, pp 95–98).
7.1.2 RIVER MURRAY — MAIN STREAM
At normal ‘pool’ level and low River Murray flow of 3,100 ML/d the areas of the main river channel from the SA–Victoria border to Lock 4 are provided in Table 5 (reproduced from E&WS Water Resources Branch 1974).
Table 5 River Murray surface areas
Reach Length
(km)
Area
(ha)
Area/km
SA–Vic border to Lock 6 17.7 228 12.9
Lock 6 to Lock 5 57.4 836 14.6
Lock 5 to Lock 4 46.4 715 15.4
The estimate of the area of the main stream upstream of the SA–Victoria border to gauging station AW426200 is based on the same area/km factor as that for the reach from the border to Lock 6.
Surface area SA–Vic border to AW426200 = Reach length (696.0 – 637.5) ∗ 12.9 = 755 ha
Total area for AW426200 to Lock 6 reach estimated as 228 + 755 = 983 ha (round up to 1,000 ha)
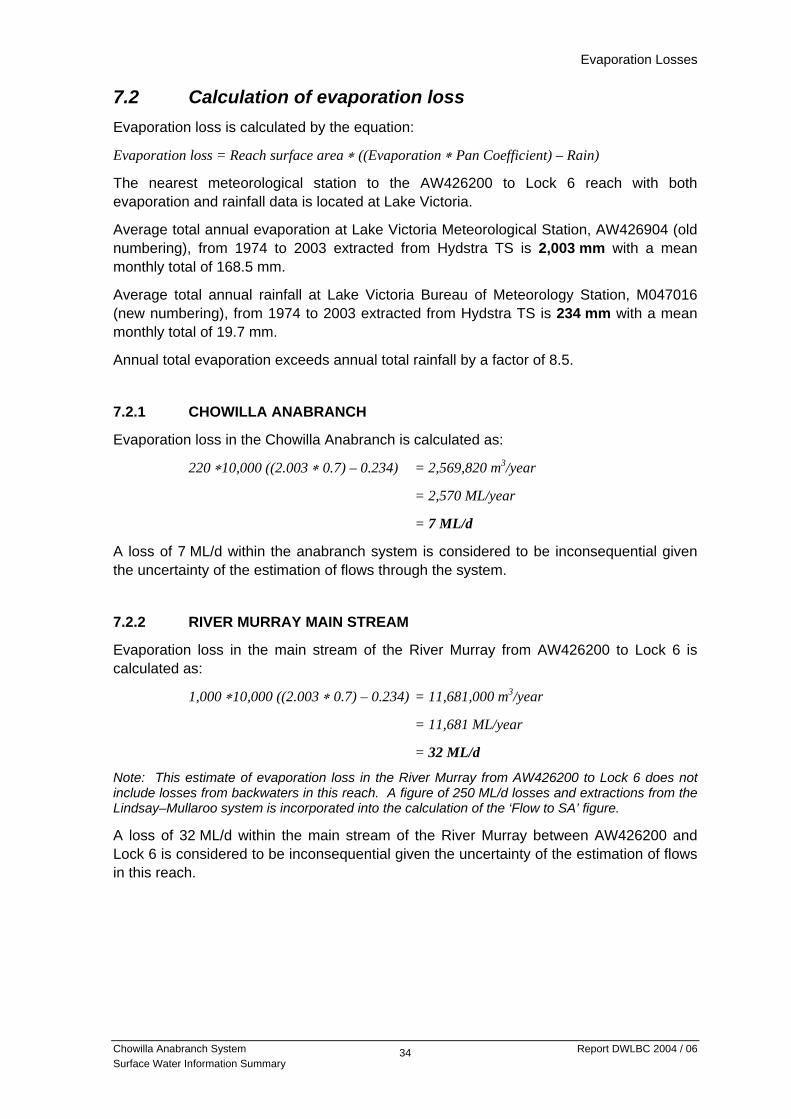
Evaporation Losses
Chowilla Anabranch System Report DWLBC 2004 / 06 Surface Water Information Summary
34
7.2 Calculation of evaporation loss Evaporation loss is calculated by the equation:
Evaporation loss = Reach surface area ∗ ((Evaporation ∗ Pan Coefficient) – Rain)
The nearest meteorological station to the AW426200 to Lock 6 reach with both evaporation and rainfall data is located at Lake Victoria.
Average total annual evaporation at Lake Victoria Meteorological Station, AW426904 (old numbering), from 1974 to 2003 extracted from Hydstra TS is 2,003 mm with a mean monthly total of 168.5 mm.
Average total annual rainfall at Lake Victoria Bureau of Meteorology Station, M047016 (new numbering), from 1974 to 2003 extracted from Hydstra TS is 234 mm with a mean monthly total of 19.7 mm.
Annual total evaporation exceeds annual total rainfall by a factor of 8.5.
7.2.1 CHOWILLA ANABRANCH
Evaporation loss in the Chowilla Anabranch is calculated as:
220 ∗10,000 ((2.003 ∗ 0.7) – 0.234) = 2,569,820 m P
3P/year
= 2,570 ML/year
= 7 ML/d
A loss of 7 ML/d within the anabranch system is considered to be inconsequential given the uncertainty of the estimation of flows through the system.
7.2.2 RIVER MURRAY MAIN STREAM
Evaporation loss in the main stream of the River Murray from AW426200 to Lock 6 is calculated as:
1,000 ∗10,000 ((2.003 ∗ 0.7) – 0.234) = 11,681,000 m P
3P/year
= 11,681 ML/year
= 32 ML/d
Note: This estimate of evaporation loss in the River Murray from AW426200 to Lock 6 does not include losses from backwaters in this reach. A figure of 250 ML/d losses and extractions from the Lindsay–Mullaroo system is incorporated into the calculation of the ‘Flow to SA’ figure.
A loss of 32 ML/d within the main stream of the River Murray between AW426200 and Lock 6 is considered to be inconsequential given the uncertainty of the estimation of flows in this reach.
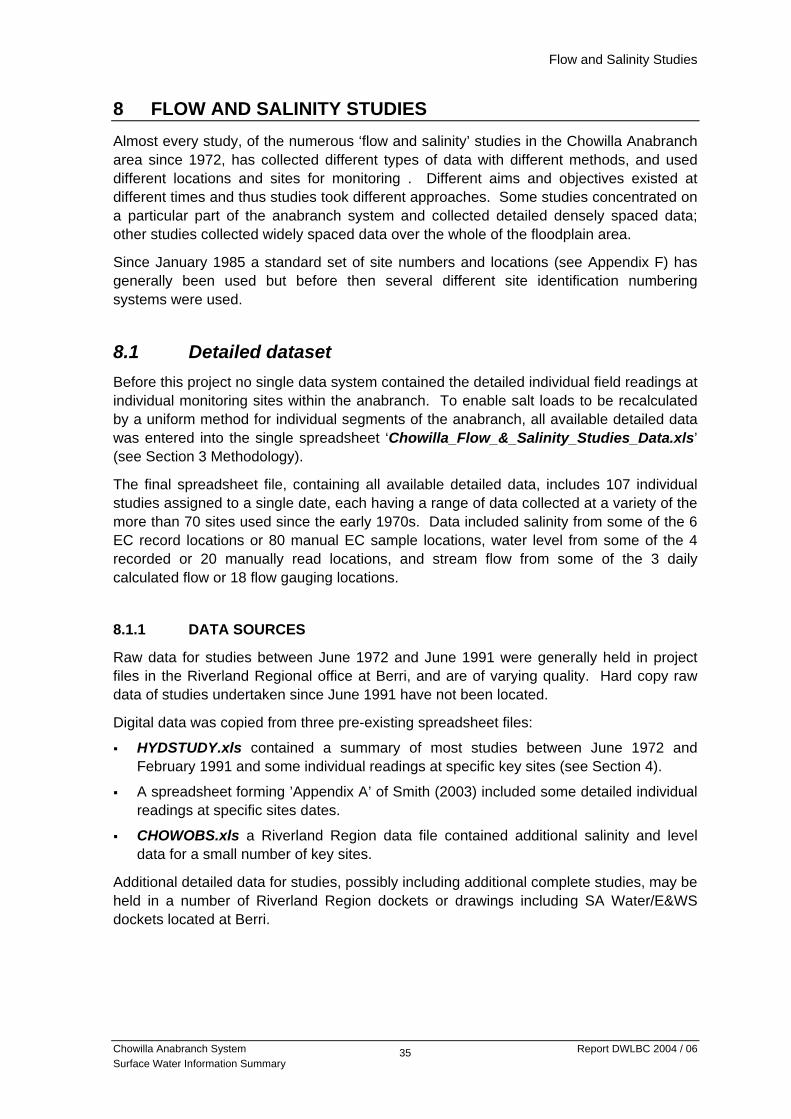
Flow and Salinity Studies
Chowilla Anabranch System Report DWLBC 2004 / 06 Surface Water Information Summary
35
8 FLOW AND SALINITY STUDIES Almost every study, of the numerous ‘flow and salinity’ studies in the Chowilla Anabranch area since 1972, has collected different types of data with different methods, and used different locations and sites for monitoring . Different aims and objectives existed at different times and thus studies took different approaches. Some studies concentrated on a particular part of the anabranch system and collected detailed densely spaced data; other studies collected widely spaced data over the whole of the floodplain area.
Since January 1985 a standard set of site numbers and locations (see Appendix F) has generally been used but before then several different site identification numbering systems were used.
8.1 Detailed dataset Before this project no single data system contained the detailed individual field readings at individual monitoring sites within the anabranch. To enable salt loads to be recalculated by a uniform method for individual segments of the anabranch, all available detailed data was entered into the single spreadsheet ‘Chowilla_Flow_&_Salinity_Studies_Data.xls’ (see Section 3 Methodology).
The final spreadsheet file, containing all available detailed data, includes 107 individual studies assigned to a single date, each having a range of data collected at a variety of the more than 70 sites used since the early 1970s. Data included salinity from some of the 6 EC record locations or 80 manual EC sample locations, water level from some of the 4 recorded or 20 manually read locations, and stream flow from some of the 3 daily calculated flow or 18 flow gauging locations.
8.1.1 DATA SOURCES
Raw data for studies between June 1972 and June 1991 were generally held in project files in the Riverland Regional office at Berri, and are of varying quality. Hard copy raw data of studies undertaken since June 1991 have not been located.
Digital data was copied from three pre-existing spreadsheet files:
HYDSTUDY.xls contained a summary of most studies between June 1972 and February 1991 and some individual readings at specific key sites (see Section 4).
A spreadsheet forming ’Appendix A’ of Smith (2003) included some detailed individual readings at specific sites dates.
CHOWOBS.xls a Riverland Region data file contained additional salinity and level data for a small number of key sites.
Additional detailed data for studies, possibly including additional complete studies, may be held in a number of Riverland Region dockets or drawings including SA Water/E&WS dockets located at Berri.

Flow and Salinity Studies
Chowilla Anabranch System Report DWLBC 2004 / 06 Surface Water Information Summary
36
Dockets and plan references cited in various flow and salinity study project files include:
EWS 1711 / 83
EWS 730 TC3 / 84
EWS 6503 / 71
RR 453 / 75
LD 453 / 75
Plan UMR 75-13
Of the 107 sets of data identified 56 have been validated against hard copy data. No hard copy data has been found for the remaining 51 studies, which were generally limited studies including routine salinity and level readings at a few specific sites. Since no flow gaugings were undertaken salt loads cannot be calculated for these studies. They have been included in this spreadsheet for completeness of the overall dataset and for water level and salinity figures that are of use in their own right.
8.2 Total Chowilla Anabranch salt load increase Data collected as part of some flow and salinity studies enables the total salt load increase emanating from Chowilla Anabranch to be calculated. This calculation requires: the flow and salinity of water leaving the anabranch (Chowilla Creek D/S of Monoman Creek, Site 40; see Appendix F) and salinity entering the anabranch (River Murray U/S of Salt Creek M Bank, Site 1; see Appendix F).
Appendix G summarises salt load results from all flow and salinity studies with appropriate data. These results have also been included on Figure 6 to enable a comparison of Chowilla Anabranch salt load increase, derived from flow and salinity study data, with monthly mean salt load increase in the River Murray between Lock 6 and Templeton, derived from monthly mean operational data. The flow and salinity study results are based on measurements made on an individual day and are in effect an instantaneous direct measurement of salt load increase. The operational data provides a monthly mean calculation of salt load increase in a reach of the River Murray which includes the Chowilla area.
8.3 Chowilla Anabranch components The Chowilla Anabranch can be subdivided into three components with different characteristics (Sharley and Huggan 1995, p 87). The schematic in Appendix F shows the systems and the bank locations.
Outer Creek system – Salt Creek from Banks K, L and M, including the Salt Creek Anabranch, Tareena Bong and Anderson Creek, and Punkah Creek including Lake Littra and Gum Flat. This system forms the outer ring on the eastern and north-eastern extremity of the floodplain with generally slow flowing streams. Total stream length is approximately 46 km.

Flow and Salinity Studies
Chowilla Anabranch System Report DWLBC 2004 / 06 Surface Water Information Summary
37
Inner Creek system – Hyperna Creek from Bank J, I Bank Creek joining Salt Creek from the Salt Creek Anabranch past Horseshoe Lagoon joining Slaneys Creek from Bank G weir and Slaneys Southern Anabranch terminating at the confluence with Punkah Creek to form Chowilla Creek. This system forms the inner segment of creeks with generally faster flowing streams with relatively short flow distances from the main river. Total stream length is approximately 28 km.
Lower Creek system – Chowilla Creek from the confluence with Punkah Creek and Slaneys Creek then joined by Pipeclay Creek form Bank D weir, and Boat Creek from Bank C then flowing to the confluence with the River Murray downstream of Lock 6. Also included in this component is Monoman Creek which forms a loop with Chowilla Creek and the Coombool, Werta Wert and Lake Limbra swamp systems. This part of the anabranch includes both short faster flowing creeks from the main river and slower moving bypass creeks and swamp system. Total stream length is approximately 36 km.
8.3.1 CHOWILLA ANABRANCH COMPONENT FLOWS
The volume of flow passing through each component of the system during River Murray flows below 25,000 ML/d is relatively constant with, on average, the Outer Creek system carrying 17% of the total anabranch flow, the Inner Creek system 32% and the Lower Creek system contributing a further 51%. Figures 19, 20 and 21 show the percentage of flow contributed by each system based on flow gaugings taken during flow and salinity studies compared to River Murray daily derived flow at the gauging station AW426200.
With increased River Murray flow, the Outer Creek system increases slightly, the Inner Creek system remains relatively unchanged and the Lower Creek system reduces its contribution. The percentage of overall River Murray flow through the anabranch was presented in Section 6.1, Figures 15–17.

Flow and Salinity Studies
Chowilla Anabranch System Report DWLBC 2004 / 06 Surface Water Information Summary
38
Figure 19 Percentage of anabranch flow through Outer Creek system
Figure 20 Percentage of anabranch flow through Inner Creek system
Percentage of Chowilla System Flow Through Outer Creek System vs River Murray Flow
Based on Daily Calculated Flow at GS426200 and Flow Gaugings
0%
10%
20%
30%
40%
50%
60%
70%
80%
90%
100%
0 5000 10000 15000 20000 25000 30000 35000
River Murray Flow @ GS426200 (Ml/d)
% o
f Flo
w T
hrou
gh O
uter
Cre
ek S
yste
m
Percentage of Chowilla System Flow Through Inner Creek System vs River Murray Flow
Based on Daily Calculated Flow at GS426200 and Flow Gaugings
0%
10%
20%
30%
40%
50%
60%
70%
80%
90%
100%
0 5000 10000 15000 20000 25000 30000 35000
River Murray Flow @ AW426200 (Ml/d)
% o
f Flo
w T
hrou
gh In
ner C
reek
Sys
tem

Flow and Salinity Studies
Chowilla Anabranch System Report DWLBC 2004 / 06 Surface Water Information Summary
39
Figure 21 Percentage of anabranch flow through Lower Creek system
8.3.2 CHOWILLA ANABRANCH COMPONENT SALT LOADS
During flow and salinity studies since 1972 about 40 different surface water monitoring sites within the anabranch have been used for collecting water level, flow or salinity readings. Various piezometers and bores were also commonly visited and groundwater level observations made.
The range of sites visited during an individual study varied depending on requirements at that time. To enable salt loads within any reach to be calculated the average salinity at the top and bottom of the reach and the average flow within the reach are required. Some studies provide salt load figures not only for the whole anabranch system and the three main subsystems but also enable salt loads to be calculated for specific reaches of streams within the subsystems. Some studies did not include any flow gaugings at the subsystem level and no salt loads can be derived.
All available flow and salinity study subsystem salt load figures have been recalculated using the spreadsheet Chowilla_Flow_&_Salinity_Studies_Data.xls and are summarised in Table 6. Where available the total of the individual subsystem figures can be compared to ‘Anabranch salt load increase (Site 1–40)’ calculated from the difference in salinity upstream of the anabranch and the salinity in the lower reach of Chowilla Creek and the measured flow in Chowilla Creek. ‘River Murray salt load increase’, calculated from the salinity difference in the River Murray upstream and downstream of Chowilla Creek and the flow in the River Murray at gauging station AW426200, is also provided.
Percentage of Chow illa System Flow Through Low er Creek System vs R iver Murray Flow
Based on Daily Calculated Flow at GS426200 and Flow Gaugings
0%
10%
20%
30%
40%
50%
60%
70%
80%
90%
100%
0 5000 10000 15000 20000 25000 30000 35000
Riv e r M urray F low @ AW426200 (M l/d)
% o
f Flo
w T
hrou
gh L
ower
Sys
tem

Flow and Salinity Studies
Chowilla Anabranch System Report DWLBC 2004 / 06 Surface Water Information Summary
40
Table 6 Subsystem salt load increase summary
Stream system Units No. of obs
Mean Median Max Min
River Murray flow @ D/S Rufus River (AW426200) ML/d 38 8152 6055 24500 3220
Previous peak flow (>60,000 ML/d) ML/d 183,00
0 68300
Days since last peak days 850 34
Salt Creek (Site 1–5) salt load increase t/d 15 24 10 99 7Punkah Creek (Site 5–18) salt load increase t/d 14 37 15 125 10
Punkah Creek (Site 18–20) salt load increase t/d 18 7 2.5 35 0
Punkah Creek (Site 5–20) salt load increase t/d 14 45 17 155 11OUTER Creek system salt load increase t/d 24 153 30 1262 19
Hyperna Creek (Site 1–7A) salt load increase t/d 12 11 3 54 2
Salt Creek (Site 5–8A) salt load increase t/d 3 8 5 18 0
I Bank Creek (Site 1–7B) salt load increase t/d 12 0 0 1 0
Salt Creek (Site 10–11) salt load increase t/d 5 18 2 81 0
Slaneys Ck (Site 12–21) salt load increase t/d 12 9 1 76 0INNER Creek system salt load increase t/d 25 83 15 468 2
Pipeclay Creek salt load increase t/d 26 9 6 31 0Boat Creek salt load increase t/d 21 2 1 10 0
Monoman Creek salt load increase t/d 24 19 2 155 0
Chowilla Creek (Site 20A–33) salt load increase t/d 11 164 32 1044 2LOWER Creek system salt load increase t/d 16 366 86 2052 12
% total system salt load in Outer Creek system % 37% 33% 58% 9%
% total system salt load in Inner Creek system % 14% 14% 27% 3%
% total system salt load in Lower Creek system % 49% 52% 79% 19%
TOTAL Chowilla subsystems salt load increase t/d 669 260 3782 38
Chowilla Anabranch salt load increase (Site 1–40) t/d 27 420 79 3770 26River Murray salt load increase (AW426200 flow) t/d 34 312 105 1939 7
Note: The sum of individual components within a subsystem may not equal the total of the whole subsystem as not all components may have been measured. All subsystem total figures are calculated directly from salinity increase and flow figures for the whole subsystem.
8.4 Salinity hot spots During various flow and salinity studies a number of very high surface water salinities have been recorded at specific locations including:
Tareena Bong (Sites 47, 48)
Salt Creek Southern Anabranch (Site 6)
Punkah Creek Anabranch U/S Slaneys Creek (Site 19)
Slaneys Southern Anabranch
Monoman Creek (Sites 34, 36, 39).

Flow and Salinity Studies
Chowilla Anabranch System Report DWLBC 2004 / 06 Surface Water Information Summary
41
8.4.1 TAREENA BONG, SALT CK SOUTHERN ANABRANCH, PUNKAH CK
Following a high flow of 68,300 ML/d on 15 October 1984, which would have inundated just over one-third of the floodplain, surface water salinity readings of up to 63,000 EC were measured at a number of sites (Table 7). At all of these sites water was flowing from floodplain areas that would have been inundated by the previous high flow event. Some floodplain areas become separated from the creek system as water levels drop but these ‘hot spots’ continue for an extended period to drain concentrated saline water into the anabranch system.
Table 7 Hot spot salinities following October 1984 high flow
1984 1985 Location description Units
20 Nov 04 Dec 15 Jan 17 Apr 07 May 08 May
River Murray flow at AW426200 ML/d 60,300 17,400 7,960 4,080 3,210 3,220
Flow: rising/falling/steady R/F/S S F S S S S
Days since last peak days 36 50 92 184 204 205
Tareena Bong near outlet (Site 47) EC 245 391 1,464 22,600 55,000
Salt Ck South Anabranch (Site 6) EC 56,300 63,000
Punkah Ck Anabranch (Site 19) EC 362 11,500
8.4.2 SLANEYS SOUTHERN ANABRANCH
The Slaneys Southern Anabranch runs parallel to Slaneys Creek and is fed from Bank E and Bank F. A number of measurements taken following a River Murray high flow of 163,000 ML/d on 14 December 1975, which would have inundated virtually all of the floodplain area, showed an increase in salinity to over 4,300 EC over 400 days later, when the stream had all but ceased to flow. Table 8 shows flow and salinity readings and calculated salt loads for Slaneys Southern Anabranch and Slaneys Creek at Site 21 and River Murray flow and salinity data. The anabranch consistently produces higher salinities than Slaneys Creek but the small flow of about 100 ML/d only produces relatively small salt loads. As River Murray flows subside the anabranch is reduced to a trickle of high salinity water. It is an example of a stream that eventually stops flowing after a floodplain inundation event and then stores salt within its channel until the next flushing flow.

Flow and Salinity Studies
Chowilla Anabranch System Report DWLBC 2004 / 06 Surface Water Information Summary
42
Table 8 Slaneys Southern Anabranch hot spot salinities 1975–76
1976 1977 Location description Units
29 Jan 10 Feb 09 Aug 28 Feb
River Murray flow at GS426200 ML/d 21,300 21,300 21,200 9,330Days since peak flow of 163,000 ML/d days 46 58 239 442Inflow salinity EC 343 424 450 633
Slaneys Ck U/S Chowilla Ck (Site 21) ML/d 1,000 1,000 1,100 240Slaneys Ck U/S Chowilla Ck (Site 21) EC 780 910 544 805Slaneys Ck salt load increase (Site 21) t/d 240 267 57 23
Slaneys Anabranch U/S Chowilla Ck ML/d 100 100 110 trickleSlaneys Anabranch U/S Chowilla Ck EC 900 1,090 580 4,310Slaneys Anabranch salt load increase t/d 31 37 8 4
8.4.3 MONOMAN CREEK
Monoman Creek is a location at which very high salinities have been recorded at times of low River Murray and Chowilla Anabranch flow . During low flow conditions segments of many of the streams exhibit significant variation in salinity through their profile; surface salinities may be relatively low, but samples taken near the stream bed can show significantly higher salinity.
Sampling by SA Water Lock 6 personnel at Monoman and Chowilla bridges from December 1984 to February 1991 illustrates salinity stratification. Top (just below surface) and bottom (just above stream bed) EC readings were taken at both sites three times per week. Data from this study is stored in the spreadsheet CHOWMON.xls.
Figure 22 shows the upper EC readings at both Chowilla Creek and Monoman Creek bridges from December 1984 to February 1991 together with the water level at Chowilla Creek bridge. Monoman Creek is consistently higher in salinity than Chowilla Creek and increases more significantly in times of low flow.
Figure 23 shows in more detail the period of December 1988 to June 1991 when Monoman Creek ceased flowing for several months. Monoman Creek upper and lower readings are plotted along with water level at the Chowilla Creek bridge. During times of little or no flow, stream bed EC rises very significantly; once water levels rise and flows recommence, almost no difference evident between the upper and lower readings as the accumulated salinity is flushed downstream to the River Murray.
Salinities in Chowilla Creek varied by up to 199 EC between top to bottom locations; salinities in Monoman Creek varied by as much as 21,107 EC between top to bottom locations (see Table 9).

Flow and Salinity Studies
Chowilla Anabranch System Report DWLBC 2004 / 06 Surface Water Information Summary
43
Chowilla Creek & Monoman Creek Salinities Dec 1984 to Feb 1991
0
500
1000
1500
2000
2500
3000
Dec-84 Dec-85 Dec-86 Dec-87 Dec-88 Dec-89 Dec-90
Salin
ity (E
C)
16
17
18
19
20
Wat
er L
evel
(AH
D)
Chowilla Water Level Chowilla Top EC Monoman Top EC
Figure 22 Chowilla and Monoman Creek salinities, 1984–1991
Monoman Creek at Bridge - Top and Bottom EC
0
5000
10000
15000
20000
25000
Dec-88 Jun-89 Dec-89 Jun-90 Dec-90
EC
16
17
18
19
20
Wat
er L
evel
Top EC Bottom EC Chowilla W L
Figure 23 Monoman Creek top and bottom salinities during no flow
Flow and Salinity Studies
Chowilla Anabranch System Report DWLBC 2004 / 06 Surface Water Information Summary
44
Table 9 Summary of difference in top and bottom EC readings
Chowilla Creek EC difference
Monoman Creek EC difference
Maximum 199 21,107 Mean 11 2,251
8.5 Elevations, water levels, bathymetry The long history of problems with survey levels in the Chowilla area are due in part to the relative remoteness of the area. Survey marks are few and far between, and an early level survey error of two feet (0.61 m) at survey marks along the NSW–SA border has combined with unstable soils throughout the floodplain to make accurate level fixing of local reference points used for measurement of both surface water and groundwater levels unreliable.
8.5.1 SURFACE WATER LEVELS
Many level surveys have been conducted in the floodplain area to establish more reliable level controls. Most of this work has been undertaken the SA Water, Riverland Region. It is understood that a reliable set of levels is now available but historical surface water data have not yet been adjusted.
Whilst all available water level readings have been included in the ‘Chowilla_Flow_&_Salinity_Studies_Data.xls’ spreadsheet file all of this data is ‘as read’ on the day of the study and this data may require adjustment.
DWLBC Berri ‘Chowilla’ files ‘gauge board levels punkah.xls’ and ‘Chowilla Gauge Board Adjustments.doc’ provide a summary of levels taken in mid-2003 to gaugeboards at Monoman Creek, Chowilla Creek and Punkah Creek (see Appendix D).
8.5.2 BATHYMETRY
In addition to surface and groundwater level readings taken throughout the anabranch system, a number of sets of streambed level data have also been collected (see files designated ‘BATH’ in Appendix D). More recent bathymetric work has also been undertaken in Chowilla Creek and lower Punkah Creek reach as part of groundwater investigations. Pre-weir construction ground surface and streambed levels across the floodplain area are found in the 1909–1914 map sets (Engineer-in-Chief’s Department 1914).
Levels at the inverts of the inlets to streams entering the floodplain are important in understanding the dynamics of flow within the system. BANKLEVL.xls holds details of natural bank levels prior to construction of Lock 6, design level of banks constructed together with Lock 6, and stream invert levels (lowest point in bank) measured in September 1993. Water levels corresponding to River Murray flows of 3,000 ML/d and 35,000 ML/d are also included.

Flow and Salinity Studies
Chowilla Anabranch System Report DWLBC 2004 / 06 Surface Water Information Summary
45
The summary of bank and inlet levels in Appendix H is shown as a graph in Figure 24. Had the banks been constructed and maintained at the original design levels, there would be no flow into the anabranch system at river flows of 3,000 ML/d. At 35,000 ML/d there would be flow through all banks; currently banks B, F, H, J and M have no or little flow through them at this level.
Photos of banks and weir taken on 28 March 2003 when River Murray flow was 6,000 ML/d are contained in the file ‘Chowilla Banks & Weirs.doc’. Photos of stream monitoring sites, banks and weirs at a River Murray flow of 35,000 ML/d taken in July 1988 are included in ‘Levelling Chowilla Creeks 35000ML-D.doc’
Chowilla Anabranch Creek System Inlet Bank Levels
KL
JF MHIGD
ECBA
Lock 6
13.00
14.00
15.00
16.00
17.00
18.00
19.00
20.00
21.00
22.00
615.0 620.0 625.0 630.0 635.0 640.0 645.0 650.0 655.0 660.0
River Distance (AMTD kms)
Leve
l (m
AH
D)
Pre-L6
Design
3000 Ml
35000 Ml
Figure 24 Inlet Bank Levels

Conclusions & Recommendations
Chowilla Anabranch System Report DWLBC 2004 / 06 Surface Water Information Summary
46
9 CONCLUSIONS AND RECOMMENDATIONS
9.1 Flow
9.1.1 RIVER MURRAY
Currently the best available method to produce ongoing time related salt loads representing the contribution of the whole Chowilla Anabranch System to the River Murray is to use the mean monthly flows for the River Murray at gauging station AW425200 (D/S Rufus River) and the difference in salinity continuously measured by the EC pontoons located in the River Murray upstream and downstream of Chowilla Creek. This method will need to continue until such time as a more accurate continuous measurement of flow representing the River Murray downstream of Chowilla Creek is available.
To maintain a standard approach and consistency of long-term information it is recommended that all salt load data using River Murray EC differences be based on flows at AW426200 (River Murray, D/S Rufus River) until such time as a more appropriate flow measurement is available.
In the longer term it is recommended that the calculation of total Chowilla Anabranch salt loads be based on River Murray flow from a location that is more representative of the flow in the Chowilla reach. The options that would provide more reliable flow data for River Murray salt load calculations, in addition to calculation of flow volume through the Chowilla Anabranch System (see Figure 25), are discussed below.
Option 1 — River Murray downstream of Chowilla Creek confluence
Measuring the flow in the River Murray downstream of its confluence with Chowilla Creek (Location A, Figure 25) and using the current EC recorders located in the River Murray upstream and downstream of Chowilla Creek would provide a direct measurement of salt load increase contributed by the Chowilla Anabranch. The installation to measure flow would need to be located within a short distance of the mouth of Chowilla Creek as the first offtake to the Ral Ral Creek Anabranch system begins just 4 km downstream. The site would also need to measure flow in what is a typical segment of the lower River Murray with wide shallow cross-sections and slow water velocity. Stage/discharge relationships are not possible in these conditions and stream flow would have to be measured by some form of velocity measurement together with a stage/cross-sectional area relationship. Ultrasonic velocity measuring equipment has been used in similar situations in the River Murray but the equipment is significantly more expensive than that for stage/discharge methods, is more difficult to install and maintain, and still requires ongoing flow gaugings for calibration of the site. Experience so far within DWLBC and other agencies of this type of equipment over cross-sections of this size have been mixed and it would seem to need further development before it could be accepted as a serious option in this circumstance.
An alternate option is to measure flow at Lock 6 (Location B, Figure 25) and the lower reach of Chowilla Creek (Location C CC, Figure 25). These measuring points could complement Option 1, providing check measurements, or be used to replace Option 1.

Conclusions & Recommendations
Chowilla Anabranch System Report DWLBC 2004 / 06 Surface Water Information Summary
47
Option 2 — Lock 6
SA Water currently calculates flow over Lock 6 weir daily using the Lockflow program based on observed gauge board readings of water level upstream and downstream of the weir and detailed measurement that defines the level of the top crest of the stop log and boule panel sections of the weir. Flow figures derived from this process have been shown to include significant errors (see Section 6.2).
Flow measurement at Lock 6 could be made more reliable and accurate by:
continuously recording upstream and downstream water levels to better define weir head changes within a daily period
measuring stop log and boule panel crests before and after every change
accounting for weir leakage more accurately
determining weir coefficients specifically applicable to Lock 6 with a series of flow gaugings.
Revising the Lockflow program to accommodate these changes and store the detailed weir crest data in a more robust and modern package would also be of benefit.
It is recommended that the methods and techniques used to calculate flows at Lock 6 be reviewed with the aim of developing revised practices to increase the reliability and accuracy of flow data.
Option 2 — Chowilla Creek
In addition to knowing the flow at Lock 6 a flow measurement in Chowilla Creek upstream of the confluence with the River Murray (Location C, Figure 25) would be required. Measuring flow in the lower reach of Chowilla Creek would also provide a direct measure total outflow from the Chowilla Anabranch System. This option is discussed in more detail in Section 9.1.2.
Option 3 — River Murray upstream of Salt Creek
Establishing a continuous flow monitoring site just upstream of Salt Creek (Location D, Figure 25) would provide total River Murray flow data before any flow enters Chowilla Anabranch. Flow measurement at this location would face the same problems as Option 1 and would probably be a difficult and relatively expensive option.
It would also be necessary to measure flow in the Lindsay River (Location D1, Figure 25) before it joins the River Murray. A Victorian monitoring site already exists in this reach (see Figure 26) but details of flow derivation are unknown.
Flow at Lock 6 (Location B, Figure 25) would also be required to calculate the volume of flow through the Chowilla Anabranch.

Conclusions & Recommendations
Chowilla Anabranch System Report DWLBC 2004 / 06 Surface Water Information Summary
48
Possible flow monitoring location Location letter Current daily calculated flow site Figure 25 Flow monitoring options
9.1.2 CHOWILLA FLOW TO RIVER MURRAY
Flow gaugings in the lower reach of Chowilla Creek have been taken from time to time as part of flow and salinity studies. These measurements only provide an instantaneous measurement of flow, and thus salt load, at that time. Continuous recording of flow and EC in the lower reach of Chowilla Creek would provide the most direct continuous measurement of salt load for the whole Chowilla Anabranch and a greater level of understanding of this dynamic system.
Continuous recording of flow in lower Chowilla Creek would require continuous velocity measurement technology; a stage–discharge relationship would not be possible without a very costly large weir or flume structure. Continuous measurement and recording of velocity using either horizontal path time-of-travel or vertical Doppler acoustic devices would be more economical if there was a suitable stream cross-section. There are two possible locations for a flow measurement site in Chowilla Creek downstream of Monoman Creek (Location C, Figure 25); or at Chowilla Creek bridge (Location C1, Figure 25) together with additional flow monitoring in Monoman Creek at the bridge (Location C2, Figure 25) or further upstream at the stone crossing where the stream cross-section is smaller.
It is recommended that an investigation take place to establish a suitable site and method for continuously measuring and recording flow in the lower reach of Chowilla Creek.
If the flow at Lock 6 can be estimated more accurately and reliably (see Section 9.1.1) and flow can be accurately measured in lower Chowilla Creek, then the combination of the two flows would provide an estimate of River Murray flow entering South Australia, and a useful comparison with flow derived from gauging station AW426200 (D/S of Rufus River).
Salt CkChowilla Ck
C
D1D
Chowilla
Anabranch System
A
Rufus River
River Murray
Lock 6 Lock 7
Lake Victoria Storage
Mullaroo / Lindsay Anabranch System
Monoman Ck
B
B
Ral Ral Creek
System
C1
C2
Conclusions & Recommendations
Chowilla Anabranch System Report DWLBC 2004 / 06 Surface Water Information Summary
49
9.1.3 ANABRANCH SUBSYSTEM FLOWS
Flows within the anabranch system have been measured from time to time using flow gauging techniques during surface water studies. Key sites, such as those representing subsystem components, need to be measured over a variety of conditions whenever possible to increase the understanding of subsystem flow dynamics.
It is recommended that flow gaugings continue to be made over a range of flow conditions at key sites including site numbers 2, 1D, 7B, 10, 18, 21, 26, 30, plus the lower reach of Chowilla Creek at Sites 31 and 36 combined or at Site 40 (see Appendix F for site locations).
It is also recommended that flows from salt load hot spots be measured under suitable conditions.
Wherever possible flow gaugings should be taken at ‘standard’ locations.
Results of all flow gaugings should be entered into Hydstra TS as the final archive of this data. Not all previous gaugings at sites within the anabranch have been entered into Hydstra TS; some sites do not have a parent site record in Hydstra to which gauging results can be attached. In addition, in some cases, gaugings for a number of separate sites have been entered under a single Hydstra site record creating multiple, very different, flow results for a single day.
It is recommended that all previous gaugings taken in the anabranch area be entered into Hydstra TS against appropriate Hydstra site identifiers. Some new Hydstra sites will need to be created. All new gaugings should be entered against the appropriate site ID as standard practice.
As part of this project all available original hard copy discharge measurement field sheets were organised into individual site ID folders; errors and omissions in the Hydstra TS gaugings table were identified in preparation for the River Murray Hydrometric Unit to make the required corrections.
Flow gaugings will continue to be required within the anabranch system as part of flow and salinity studies, but they only represent flow at a single point in time. Equipment for continuous measurement and recording of flow using ultrasonic, acoustic Doppler technology is now available at relatively low cost. However, the limitations of this equipment may make it unsuitable for the conditions in the streams of Chowilla Anabranch and, as with all such devices, it needs to be calibrated to the individual site. Calibration generally uses flow gaugings over a range of flow conditions to establish a relationship between the recorded velocity and actual mean cross-sectional velocity and cross-sectional area. Provided it functions adequately, and suitable cross-sections can be found at required sites, this type of equipment in conjunction with continuous EC recorder would provide continuous total salt loads at selected key sites.
It is recommended that the option of deploying continuous acoustic Doppler equipment at key anabranch sites including Site 20 on Punkah Creek and Site 21 on Slaneys Creek be investigated.
Conclusions & Recommendations
Chowilla Anabranch System Report DWLBC 2004 / 06 Surface Water Information Summary
50
9.2 Salinity and salt loads
9.2.1 RIVER MURRAY
For the time being continuous monitoring of EC in the River Murray upstream and downstream of Chowilla Creek confluence (AW426574 and AW426575), using the pontoon located mid-stream, should continue to be used with the flow measured at gauging station AW426200 to calculate River Murray salt load increase. Once a more direct continuous measurement of Chowilla Creek salt load is available (see Section 9.2.3) the use of the two EC recorders upstream and downstream of the Chowilla Creek confluence should be reviewed. In the interim, additional cross-section salinity profiles should be taken at both EC recording pontoons during a variety of flow conditions to ensure that the recorded data is representative of the whole stream.
It is recommended that EC profiles be taken at AW426704 and AW426705 at a range of flow conditions to confirm the salinity characteristics of the stream cross-section.
Daily operational EC readings by SA Water at Lock 6 should continue in order to establish a better comparison with historical data. In addition this data will provide a basis for determining any salt load increase in the reach downstream of Lock 6 to the Chowilla Creek confluence. EC profiles need to be undertaken at a range of flows at Lock 6. Current methods used by SA Water operational personnel in collecting water samples and measuring the EC, including instrument calibration, should be reviewed and appropriate standard quality controls applied. This could be achieved through an ongoing program of technical support to SA Water operational personnel from DWLBC technical personnel.
It is recommended that daily EC readings at Lock 6 continue and that DWLBC technical personnel provide support to SA Water personnel to ensure that appropriate quality assurance is maintained.
EC profiles need to be undertaken at Lock 6 over a range of flow conditions.
9.2.2 LINDSAY RIVER ANABRANCH
Quantifying the salt load entering the River Murray from the Lindsay River Anabranch would assist in the understanding of salt load dynamics in the Chowilla Anabranch and in the River Murray upstream of Lock 6. A number of monitoring sites (see Figure 26) have been established in the Lindsay–Mullaroo Anabranch system (Department of Sustainability and Environment 2004) but no data has been sought and precise details of the available parameters is not known.
It is recommended that flow, salinity, salt load and level data for Victorian sites in the Lindsay–Mullaroo Anabranch system be sought from the appropriate authority on an ongoing basis.
Having flow and salinity data for the Lindsay System available would also assist in assessing salinity data recorded at Site A4261022 (River Murray U/S of Old Customs House) EC recording site.

Conclusions & Recommendations
Chowilla Anabranch System Report DWLBC 2004 / 06 Surface Water Information Summary
51
Figure 26 Victorian operated Lindsay–Mullaroo sites
9.2.3 CHOWILLA CREEK
Provided that flow can be continuously recorded in the lower reach of Chowilla Creek (see Section 9.1.2), continuous measurement and recording of EC at this location would provide a direct measure of total salt load emerging from the Chowilla Anabranch system. In addition, if continuous salinity of water entering the system was available the salt load increase for the whole anabranch system could be reliably determined. The existing EC recording pontoon A4261022 (Murray R U/S Old Customs House) measures the salinity of the River Murray downstream of the Lindsay River system and together with Lock 6 daily EC could be used to represent the salinity of water entering the Chowilla system via Banks A to I. Banks J to M are upstream of the Lindsay River confluence and river salinity could be significantly different from readings downstream of Lindsay River. An additional salinity recorder may be required to represent the salinity of flow into the outer Chowilla Creek system. This additional EC recorder could be located in Salt Creek near Bank K through which most flow occurs (see Section 9.2.4).
9.2.4 CHOWILLA ANABRANCH SUBSYSTEM
Continuous EC is currently being recorded at three sites within the anabranch system (see Table 10).

Conclusions & Recommendations
Chowilla Anabranch System Report DWLBC 2004 / 06 Surface Water Information Summary
52
Table 10 Anabranch continuous EC recording sites
Flow & salinity study site no.
Hydstra site ID Location
5 A4261027 Salt Ck SA–NSW border
18 AW426580 Punkah Ck @ sheep bridge
31 AW426535 Chowilla Ck @ bridge
Additional EC recorders at Site 20, Punkah Creek U/S Slaneys Creek and Site 21, Slaneys Creek U/S Chowilla Creek, would provide an overall picture of salinity increases within each of the subsystem components. With the addition of continuous flow measurements at Site 20 and 21, using ultrasonic methods (e.g. Mindata Starflow logger), continuous salt loads within the subsystems could be estimated.
It is recommended that continuous salinity and flow recording equipment be installed at key anabranch sites including Site 20 on Punkah Creek and Site 21 on Slaneys Creek.
To enable salt load increases for the whole Chowilla Anabranch or segments of the system to be calculated, the salinity of water entering the system needs to be known. As discussed in Section 9.2.3, the existing EC recorder A4261022 in the River Murray U/S Old Customs House and Lock 6 daily EC reading can be used to represent the salinity of inflows through Banks A to I but not for the Banks J to M upstream of A42610022 and the confluence of Lindsay River. A continuous salinity recorder located in Salt Creek Bank K near the mouth with the River Murray would provide a salinity that would represent the inflow upstream of the Lindsay River confluence. The addition of continuous flow recording would provide a direct measure of salt load entering through Bank K to the outer creek system.
It is recommended that continuous salinity and flow recording equipment be installed at Site 1C at the mouth of Salt Creek at Bank K.
A range of equipment is now available for more accurately measuring and recording EC in the field. However, the information gained is only worthwhile if it represents the whole stream, and a single point salinity reading within the cross-section may not be representative. Many of the streams in the anabranch are slow moving and poorly mixed, with denser, higher salinity water tending to congregate at the bottom of the stream profile. Selecting a sampling point, or points, that identify and quantify salinity stratification is essential for determining accurate salt loads and defining localised salinity processes. Therefore salinity cross-section profiles must be undertaken at all salinity recording sites at a range of conditions and that multiple depth EC samples be taken during any studies particularly in low flow conditions.
It is recommended that EC profiles be undertaken at all continuously monitored EC sites over a range of conditions.
During flow and salinity studies multiple depth EC samples should be taken at all key salinity monitoring sites.
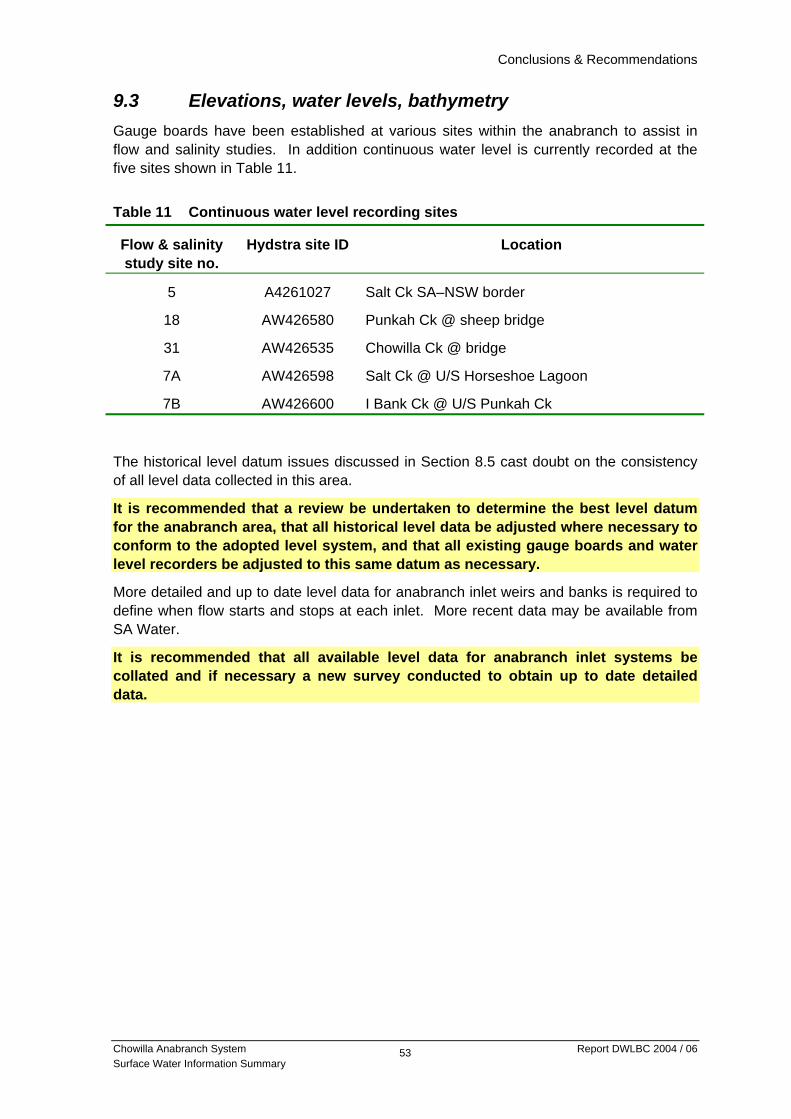
Conclusions & Recommendations
Chowilla Anabranch System Report DWLBC 2004 / 06 Surface Water Information Summary
53
9.3 Elevations, water levels, bathymetry Gauge boards have been established at various sites within the anabranch to assist in flow and salinity studies. In addition continuous water level is currently recorded at the five sites shown in Table 11.
Table 11 Continuous water level recording sites
Flow & salinity study site no.
Hydstra site ID Location
5 A4261027 Salt Ck SA–NSW border
18 AW426580 Punkah Ck @ sheep bridge
31 AW426535 Chowilla Ck @ bridge
7A AW426598 Salt Ck @ U/S Horseshoe Lagoon
7B AW426600 I Bank Ck @ U/S Punkah Ck
The historical level datum issues discussed in Section 8.5 cast doubt on the consistency of all level data collected in this area.
It is recommended that a review be undertaken to determine the best level datum for the anabranch area, that all historical level data be adjusted where necessary to conform to the adopted level system, and that all existing gauge boards and water level recorders be adjusted to this same datum as necessary.
More detailed and up to date level data for anabranch inlet weirs and banks is required to define when flow starts and stops at each inlet. More recent data may be available from SA Water.
It is recommended that all available level data for anabranch inlet systems be collated and if necessary a new survey conducted to obtain up to date detailed data.

Glossary
Chowilla Anabranch System Report DWLBC 2004 / 06 Surface Water Information Summary
54
GLOSSARY acoustic Doppler current profiler (ADCP)
Equipment that can be used for measuring the flow in a stream using ultrasonic technology. It can be operated from a boat moving slowly across the stream and provides detailed data of water velocity through the stream profile in addition to stream bed definition.
anabranch A secondary river channel, often running parallel to the main channel that rejoins the main channel further downstream.
confluence The location where two streams join to form a single channel containing the combined flow of both streams.
control The T Tfeature within a river reach that regulates flow for any given water level. Along any reach, the controlling feature may vary with changes in water level. Specially designed weirs and other structures are frequently used to create a controlling section at stream monitoring sites.
Section control: When the controlling feature causes a transition from subcritical to supercritical flow, immediately upstream of the transition is a section where water level is uniquely related to flow – an ideal situation for establishing a stage–discharge relationship, because for any water level there is only one corresponding rate of flow.
Channel control: When the controlling feature does not cause a transition from subcritical to supercritical flow, upstream or downstream conditions influence the hydraulic gradient resulting in varying rates of flow for any given water level.
discharge measurement See flow gauging.
electrical conductivity (EC) Water's ability to conduct electric current is directly related to the total dissolved solids (TDS) present in the water. Electrical conductivity (EC) is widely used as an indicator of water salinity and is reported in micro-Siemens per centimetre (µS/cm). EC is temperature sensitive and increases with increasing temperature. Conductivity values are usually adjusted (or compensated) to the value that would occur if the water temperature was 25°C as a standard temperature thus allowing comparisons between EC readings.
1 EC unit = 1 µS/cm measured at 25°C.
EC profile A series of EC measurements taken at varying depths and distances across a stream cross-section to show the distribution of salinity through the cross-section

Glossary
Chowilla Anabranch System Report DWLBC 2004 / 06 Surface Water Information Summary
55
and identify salinity stratification. EC profiles are used to identify the most suitable locations for salinity monitoring sites and to develop more detailed understanding of localised salinity and stream mixing processes.
flow gauging A measurement of flow at a particular stage (water level) for purposes of establishing the relationship between water level and flow in a particular river reach. Also called discharge measurement.
gauging station A gauging station is a specific type of monitoring site where stream flow is measured and a variety of other environmental parameters may also be measured. The data collected may be individual readings at varying intervals or continuously recorded using a variety of instrumentation. Typically, a stage–discharge relationship would be developed based on flow control at the site by taking flow gaugings over a range of flow conditions. In some cases a station may include water velocity measuring instruments, which together with stream cross-sectional area measure water flow.
Hydstra TS Hydstra TS is a software product widely used to store, analyse and present time series environmental monitoring data.
monitoring site A location at which one or many environmental parameters are measured by individual readings taken at varying intervals or continuous recording using a variety of instrumentation.
Ramsar The Convention on Wetlands, signed in Ramsar, Iran, in 1971, is an intergovernmental treaty that provides the framework for national action and international cooperation for the conservation and wise use of wetlands and their resources. There are presently 138 Contracting Parties to the Convention, with 1,369 wetland sites, totalling 119.6 million hectares, designated for inclusion in the Ramsar List of Wetlands of International Importance (Ramsar Convention Secretariat 2004).
rating See stage–discharge relationship.
reach A relatively short section of a river usually having some related characteristic such as between two weirs or the same flow regime.
run-of-river survey A technique used to help identify areas of high salt load increase within a stream reach. EC readings are made at a frequent rate along the reach, sometimes continuously, and define salinity levels along the reach. The series of readings is repeated several times over a period of time, usually one series per day for four or five days. Using a knowledge of flow velocity, usually obtained from flow gaugings,
Glossary
Chowilla Anabranch System Report DWLBC 2004 / 06 Surface Water Information Summary
56
the movement of water and any subsequent increase in salinity can be determined by overlaying the results of each data series with an offset for the appropriate travel times. The results show salinity increase for each set distance point, typically each kilometre, within the reach and identify specific segments with higher salinity increases. Matched with hydrological data and other information this technique is used to identify salinity sources and monitor salinity reduction programs.
stratification TA situation where less dense water overlies denser water. In extreme cases distinct layers can form within the stream profile with little or no mixing or interaction between the layers. In slow flowing or stationary water more saline water, which is denser, can accumulate in the bottom of a stream. Often it has seeped into the stream through the bed and banks from the surrounding groundwater.T
time series A series of variable values recorded against time; in the context of water resource monitoring, records of water-related environmental variables, such as water level or water salinity, against the time the readings were taken.
The time interval between recording can be seconds, hours, days or longer, provided that the recorded values give a reliable representation of the actual changes in the variable at the required level of accuracy: if the variable does not change rapidly a time-series can be made up of manual observations such as a manual reading of groundwater levels; if the variable changes rapidly very frequent readings are required and continuously recording devices are used.
A wide range of variables can be recorded as a time-series including any level or counter type data that varies with time. Examples include water level, flow rate, velocity, salinity, turbidity, temperature, wind speed, rainfall, wind direction, flow volume, battery voltage, gate opening, pump status.
total dissolved solids (TDS)
The quantity (by mass per unit volume) of residue left by evaporation, giving one of the best indications of the salinity of the water.
salt load A rate at which salt (dissolved solids) passes a point on a river reach. TSalt loadT is usually expressed in units of mass per unit time, such as tonnes per day (t/d).
stage The water level measured as a height above an arbitrary datum.
stage–discharge relationship Associates water level (stage) with flow (discharge) for a specific reach of river where a control feature is present. The relationship is often established over time by making flow HTgaugingsTH at all ranges of water level when they occur. The relationship can also be based on adopted hydraulic principals when a pre-calibrated gauging weir is used as the controlling feature. Also known as a rating curve.

Glossary
Chowilla Anabranch System Report DWLBC 2004 / 06 Surface Water Information Summary
57
SI units
Name of unit Symbol Definition in metric units millimetre mm 10 P
-3P m length
metre m length kilometre km 10 P
3P m length
hectare ha 10 P
4 PmP
2P area
microlitre μL 10 P
-9P mP
3P volume
millilitre mL 10 P
-6P mP
3P volume
litre L 10 P
-3 PmP
3P volume
kilolitre kL 1 mP
3P volume
megalitre ML 10 P
3P mP
3P volume
gigalitre GL 10 P
6P mP
3P volume
microgram μg 10 P
-6P g mass
milligram mg 10 P
-3P g mass
gram g mass kilogram kg 10 P
3P g Mass
Abbreviations
Abbreviation Name Units of measure
ADCP acoustic Doppler current profiles D/S downstream DWLBC Department of Water, Land and Biodiversity
Conservation
E&WS Engineering and Water Supply Department EC temperature adjusted electrical conductivity
(microSiemens per centimetre at 25 degrees Centigrade)
µS/cm @ 25 P
cPC
GPS global positioning system MDBC Murray-Darling Basin Commission t/d tonnes per day; a measure of the mass of salt
passing a point on a stream in one day tonnes/day
U/S upstream

Chowilla Anabranch System Report DWLBC 2004 / 06 Surface Water Information Summary
58
REFERENCES Bos MG (ed). 1989. Discharge Measurement Structures. 3rd revised edition. International Institute for Land Reclamation and Improvement, Wageningen, The Netherlands.
Department of Primary Industries, Sustainability & Environment. 2004. The Victorian Water Resources Data Warehouse, viewed 15 March 2004, www.vicwaterdata.net/vicwaterdata/home.aspx
E&WS Water Resources Branch, Data Section. 1974. River Murray Surface Areas. Engineering and Water Supply Department, Adelaide.
Engineer-in-Chief’s Department. 1914. River Murray Survey 1909-1914, Chowilla Dam to Wentworth. South Australian Government, Adelaide.
Government of South Australia, GSA. 1965. Chowilla Dam. A Regulating Storage on the River Murray. Government Printer, Adelaide.
Murray-Darling Basin Commission. 2004. The Murray-Darling Basin Agreement. Viewed 24 March 2004, www.mdbc.gov.au/index.html
Pilgram DH. 1998. Australian Rainfall and Runoff, Volume 1, Book Four: Estimation of Design Peak Discharges. The Institution of Engineers Australia, Barton, ACT.
Press WH, Teukolsky SA, Vetterling WT and Flannery BP. 1999. Numerical Recipes in Fortran 77: The Art of Scientific Computing, Second Edition, Volume 1 of Fortran Numerical Recipes. Cambridge University Press, Cambridge UK.
The Ramsar Convention Secretariat. 2004. The Ramsar Convention on Wetlands, viewed 24 March 2004, www.ramsar.org/
Sharley T and Huggan C (eds). 1995. Chowilla Resource Management Plan. Murray-Darling Basin Commission, Canberra.
Smith K. 2003. Assessment and Documentation of Previous Hydrological Work undertaken at Chowilla. Ken Smith Technical Services, Berri, South Australia.
Standards Australia. 1991. Australian Standard AS 3778.4.6-1991: Measurement of water flow in open channels. Part 4: Measurement using flow gauging structures Method 4.6: Flat-V weirs. Standards Australia, Homebush, NSW.
Stanger G. 1994. Dictionary of Hydrology and Water Resources. Lochan Centre for Groundwater Studies, Adelaide.
Stokes A. 2004. Endnote [computer program]
Chowilla Anabranch System 59 Report DWLBC 2004 / 06 Surface Water Information Summary
APPENDICES

Chowilla Anabranch System 60 Report DWLBC 2004 / 06 Surface Water Information Summary
APPENDIX A ADDITIONAL DWLBC INTERNAL REPORTS DWLBC Riverland Region. April 2003. Chowilla Monitoring. Six page report describing installation of new water level EC recording instruments within anabranch. Copy held: DWLBC Adelaide, SW Library. SA Water Riverland Region. March 2003. Chowilla Banks & Weirs. Seven page report providing photos and brief descriptions of banks and weirs U/S Lock 6 which control flow into Chowilla Anabranch. Copy held: DWLBC Adelaide, SW Library. Sinclair Knight Merz. January 1999. Chowilla Groundwater Control Scheme. Supplementary Investigations. Murray-Darling Association. Photocopy of 140 page report. Chapter 3, Hydrogeological Review, summarises previous published work. Includes comprehensive reference section. Copy held: DWLBC Adelaide (M-D Division) Engineer-in Chief’s Department. 1965. Chowilla Dam. A Regulating Storage on the River Murray. Government of South Australia. General information about proposed water storage dam. Copy held: DWLBC Adelaide, SW Library.

Chowilla Anabranch System 61 Report DWLBC 2004 / 06 Surface Water Information Summary
APPENDIX B ADDITIONAL CSIRO REPORTS
Reports
McEwan KL et al. 1991. Compilation of soil water and chloride profiles from the Chowilla Anabranch region, South Australia. Technical Memorandum 91/17. CSIRO Division of Water Resources, Canberra.
Jolly ID et al. 1992. Compilation of groundwater data from Chowilla Anabranch region, South Australia. CSIRO. Technical Memorandum 92/9. CSIRO Division of Water Resources, Canberra.
Narayan K, Jolly ID and Walker GR. 1993. Predicting Flood-Driven Water Table Fluctuations in a Semi-Arid Floodplain of the River Murray Using a Simple Analytical Model. Divisional Report 93/2. CSIRO Divison of Water Resources, Canberra.
McEwan K, Jolly ID and Holub AN. 1994. Effects of Flooding on Water use of Eucalyptus largiforans, Compilation of Results from the 1992/93 Flood. Technical Memorandum 94/5. CSIRO Division of Water Resources: Canberra.
Charlesworth A, Narayan K and Simmons C. 1994. Seeking Solutions - Modelling Salt Accession within the Chowilla Anabranch and Possible Mitigation Schemes. Divisional Report 94/7. CSIRO Division of Water Resources, Canberra.
McEwan KL, Richter M and Jolly ID. 1995. Compilation of Soils, Groundwater and Transpiration Measurements of Eucalyptus largiflorens on the Chowilla Floodplain around the 1993/94 Flood. Technical Memorandum 95/11. CSIRO Division of Water Resources, Canberra. .
Jolly ID and Walker GR. 1995. A sketch of Salt and Water Movement in the Chowilla Floodplain. Water Resources Series No. 15. CSIRO Division of Water Resources: Glen Osmond, South Australia.
Walker GR et al. 1998. Historical Stream Salinity Trends and Catchment Salt Balances in the Murray-Darling Basin. Final Report – NRMS D5035. Technical Report 33/98. CSIRO Division of Water Resources, Glen Osmond, South Australia.
Articles
Mensforth LJ et al. 1994. Sources of water used by riparian Eucalyptus camaldulensis overlying highly saline groundwater. Oecologia, 100: 21–28.
Jolly ID and Walker GR. 1996. Is the field water use of Eucalyptus largiflorens F. Muell. affected by short-term flooding? Australian Journal of Ecology, 21: 173-83.
Akeroyd MD et al. 1998. Impact of flooding on the water use of semi-arid riparian eucalypts. Journal of Hydrology, 206: 104-17.
Jolly ID et al. 1998. The impact of flooding on modelling salt transport processes to streams. Elsevier – Environmental Modelling & Software, 1998: 87-104.
Slavich PG, Walker GR and Jolly ID. 1999. A flood history weighted index of average root-zone salinity for assessing flood impacts on health of vegetation on a saline floodplain. Agricultural Water Management, 39: 135-51.

Chowilla Anabranch System 62 Report DWLBC 2004 / 06 Surface Water Information Summary
Slavich PG et al. 1999. Dynamics of Eucalyptus largiflorens growth and water use in response to modified watertable and flooding regimes on a saline floodplain. Elsevier – Agricultural Water Management, 39: 245-64.
Bramley H. 2000. Infiltration of water on Chowilla floodplain and the effects on Eucalyptus largiflorens, in School of Biological Sciences, 2001. Flinders University of South Australia: Adelaide.

APPENDIX C Chowilla Reference List
Chowilla Anabranch System 63 Report DWLBC 2004 / 06 Surface Water Information Summary
APPENDIX C CHOWILLA REFERENCE LIST
Last Updated March 2004
1. Akeroyd MD et al. 1998. Impact of flooding on the water use of semi-arid riparian eucalypts. Journal of Hydrology, 206: 104-17.
3. Chowilla Floodplain Study – Results of Phase 1 & 2 Computer Modelling. 1991.
6. Barratt RR and Choate JH. 1983. Rangeland Assessment Manual: Chowilla Station, July to September. Department of Lands, Adelaide.
7. Beaney HL. 1964. A Proposed Hydro-electrical Installation at Chowilla. Engineering and Water Supply Department, Adelaide.
8. Bignall J. 2001. Habitat use and movements of Dasyurid Marsupials, Planigale gilesi (Paucident Planigale) and Sminthopis crassicaudata (Fat-tailed Dunnart). University of Adelaide, Waite Campus, Adelaide.
9. Bramley H. 2000. Infiltration of water on Chowilla floodplain and the effects on Eucalyptus largiflorens, in School of Biological Sciences, 2001. The Flinders University of South Australia, Adelaide
10. Charlesworth A, Narayan K and Simmons C. 1994. Seeking Solutions – Modelling Salt Accession within the Chowilla Anabranch and possible Mitigation Schemes. CSIRO Division of Water Resources, Canberra.
11. Chowilla Working Group and Chowilla Reference Group. 1992. Chowilla Draft Resource Management Plan – Progress Report. Murray-Darling Basin Commission.
12. Clark P and Lowe E. 1990. Chowilla Salt Water Interception Scheme options for Future Management of Crown Land in the NSW Component of the Chowilla Anabranch System. Western Lands Commission of New South Wales.
13. Coffey, PIPL. 1991. Chowilla Draft Resource Management Plan: Hydrogeologic Studies: Technical Support Consultancy: Groundwater Modelling. E&WS, South Australia.
14. Coffey, PIPL. 1991. Chowilla Draft Resource Management Plan: Hydrogeologic Studies: Numerical Groundwater Analysis. E&WS, South Australia.
15. Cole D and Lee G. 1989. Chowilla Recreation Study. Social & Ecological Assessment and Pak-Poy & Kneebone, Adelaide.
16. Collingham EB. 1989. Chowilla Proposed Hydrogeological Investigation Program. Report for the MDBC.
17. Collingham EB. 1990. Chowilla: Hydrogeological Studies by the E&WS Department – Technical Discussion Papers. 1. The Basic Hydrogeology of the Chowilla Area. 2 The Influence of Hydrogeologic Processes on Soil Salinity in the Chowilla Anabranch. 3 The Influence of Hydrogeologic Processes on Fish Habitat in the Chowilla Anabranch Floodplain. Technical discussion paper. E&WS, Adelaide.
18. Collingham EB. 1990. Chowilla Salinity Investigations - Project 7551 Proposal for Hydrogeological Investigations. E&WS, South Australia.

APPENDIX C Chowilla Reference List
Chowilla Anabranch System 64 Report DWLBC 2004 / 06 Surface Water Information Summary
19. Collingham EB. 1990. Chowilla: Murray-Darling Basin Commission Salinity Mitigation Studies in South Australia. Chowilla Salinity Investigations – Project 7551: Proposal for Hydrogeological Investigations. E&WS, Adelaide.
20. Dawes WR et al. 1998. Modelling Water and Salt Movement on the Chowilla Floodplain. In: Zhang, L. and Dawes, W.R. (eds), WAVES: An Integrated Energy and Water Balance Model. CSIRO Land and Water, Canberra.
21. Delforce RJ. 1993. Environmental Economic Analysis of Broad Options for Managing Chowilla Salinisation Problems. SA Department of Environment and Land Management, Adelaide.
22. Dent KM. 1990. Coupling of ground based and aircraft data. In School of Earth Sciences. The Flinders University of South Australia, Adelaide.
23. Department for Environment and Heritage. 2003. A Review of Chowilla Regional Reserve 1993-2003. DEH, Adelaide.
24. Department of Water, Land and Biodiversity Conservation. 2003. Pump Testing on the Chowilla Floodplain at Gum Flat in South Australia and Tareena Bong in New South Wales. DWLBC, Adelaide.
25. Department of Environment and Natural Resources. 1993. Chowilla Regional Reserve and Chowilla Game Reserve Management Plan. DENR, Adelaide.
26. Department of Lands. 1982. Rangeland Assessment Manual: Chowilla Station. Division of Outback Management Regional Office, Berri.
27. Dominelli ST. 1996. Hydrological manipulations on Lake Littra: Baseline water quality and biotic parameters from September 1995 to April 1996. Internal report. Bookmark Biosphere Trust.
28. Eldridge SR. 1991. The role of salinisation in the dieback of black box (Eucalyptus largiflorens F. Muell.) on the floodplain of the River Murray, South Australia, In Departments of Botany and Zoology. University of Adelaide, Adelaide.
29. Eldridge SR et al. 1993. Health and Structure of Eucalyptus Communities on Chowilla and Monoman Islands of the River Murray. CSIRO, Division of Water Resources, Canberra.
30. Engineering & Water Supply Department. 1968. A Discussion of the Early Computer Runs for the Control of Salinity of the Chowilla Reservoir. E&WS, Adelaide.
31. River Murray Control Committee. 1972. Report on Salinity Control Measures in the Lake Victoria and Chowilla Lock 6 Areas. E&WS, Adelaide.
32. I.W.G.o. Geomorphologists. 1973. Chowilla area: Progress report on Hydrogeological and Geomorphological Investigations. E&WS, Adelaide.
33. Design Services Branch, Engineering & Water Supply Department. 1985. Chowilla Area Investigations: Location Plan and Bore Logs for Piezometers H1 to H8. E&WS, Adelaide.
34. Engineering & Water Supply Department. 1985. River Murray Water Resources Planning Study Phase II Chowilla Area. E&WS, Adelaide.
35. Engineering & Water Supply Department. 1986. Chowilla Salinity Mitigation Feasibility Investigation. E&WS, Adelaide.

APPENDIX C Chowilla Reference List
Chowilla Anabranch System 65 Report DWLBC 2004 / 06 Surface Water Information Summary
36. Engineering & Water Supply Department. 1987. Brief for employment of a consultant to undertake an environmental impact statement in relation to the proposed Chowilla salinity mitigation scheme. South Australian Government.
37. Engineering & Water Supply Department. 1989. Chowilla Salinity Mitigation Scheme Draft Environmental Impact Statement Response to Public Submissions. E&WS, Adelaide.
38. Engineering & Water Supply Department. 1989. Report on Hydrogeological Investigations at Chowilla: A Summary. E&WS, Adelaide.
39. Engineering & Water Supply Department.1991. Chowilla Creek Salt Loads – Draft. E&WS, Adelaide.
40. Engineering & Water Supply Department. Undated. Chowilla Creek salt loads. E&WS, Adelaide.
41. Environment Protection Agency. 1998. Chowilla Region Surface and Groundwater Data Update, Water Resources Report, 6/98. EPA, Adelaide.
42. Falkenberg I, Fielke H and Fitzpatrick L. 1998. Chowilla Floodplain Resource Management Project Final Report. Department for Environment, Heritage & Aboriginal Affairs, Adelaide.
43. Gallasch S. 1998. Physiological Aspects of Salt Tolerance in Floodplain Eucalypts With Respect to Soil and Groundwater, In School of Biological Sciences. The Flinders University of South Australia, Adelaide.
44. Gerny JS. 1966. Navigation and Control Requirements for Chowilla. E&WS, Adelaide.
45. Gerny JS. 1966. The Disposal of Seepage Water from Chowilla Dam. E&WS, Adelaide.
46. Gerny JS. 1967. The Effect of Chowilla Reservoir Upon the Salinity of the River Murray in SA. E&WS, Adelaide.
47. Gerny JS. 1968. A South Australian Appraisal of the Dartmouth and Chowilla Schemes. E&WS, Adelaide.
48. Hawes WL. 1985. Chowilla Dam – A Regulating Storage on the River Murray. River Murray Commission, Adelaide.
49. Helliwell PR. 1962. An Estimate of the Power Potential of Chowilla Dam. E&WS, Adelaide.
50. Helliwell PR. 1963. River Murray Storage Behavior: Chowilla Investigation: Effect of a System of Target Storage. E&WS, Adelaide.
51. Hodgson GA. 1993. Predicting the Health of Eucalyptus largiflorens in the Chowilla Anabranch Region of the River Murray Using GIS and Remote Sensing. Australian National University, Canberra.
52. Hollingsworth ID. 1989. A Reconnaissance Soil Survey of the Chowilla Anabranch System of the River Murray in SA & NSW. Report for the MDBC. Department of Agriculture, South Australia.
APPENDIX C Chowilla Reference List
Chowilla Anabranch System 66 Report DWLBC 2004 / 06 Surface Water Information Summary
53. Hollingsworth ID, Meissner AP and Davies G. 1990. A Reconnaissance Soil Survey of the Chowilla Anabranch System of the River Murray in SA and NSW. Prepared for the MDBC. SA Department of Agriculture, Adelaide.
54. Jensen A et al. 1998. Chowilla Ecological Assessment. Wetland Care Australia Report.
55. Jolly ID. 1996. The Effects of River Management on the Hydrology and Hydroecology of Arid and Semi-Arid Floodplains, In MG Anderson, DE Walling and PD Bates (eds) Floodplain Processes, pp. 577-609. John Wiley, Chichester, NY.
56. Jolly ID et al. 2002. Managing Groundwater & Surface Water for Native Terrestrial Vegetation Health in Saline Areas. CSIRO Land & Water.
57. Jolly ID et al. 1992. Compilation of groundwater data from Chowilla Anabranch Region, South Australia. CSIRO.
58. Jolly ID et al. 1998. The Impact of Flooding on Modelling Salt Transport Processes to Streams. Elsevier – Environmental Modelling & Software, 87–104.
59. Jolly ID et al. 1992. Chowilla – Outcomes of Recent Research, Investigations and Planning. CSIRO Water Resources Division, Adelaide.
60. Jolly ID and Walker GR. 1995. A Sketch of Salt and Water Movement in the Chowilla Floodplain. CSIRO Division of Water Resources, Glen Osmond, SA
61. Jolly ID and Walker GR. 1995. Floodplain salinisation in the Chowilla Anabranch and its implications on river salinity and native riparian forests. Murray-Darling Basin Workshop, Wagga Wagga, NSW.
62. Jolly ID and Walker GR. 1996. Is the field water use of Eucalyptus largiflorens F. Muell. affected by short-term flooding? Australian Journal of Ecology, 21: 173-83.
63. Jolly ID et al. 1994. Salt and water balance of the River Murray and its floodplain. In Water Down Under 1994 – International Groundwater and Hydrology Conference. The Institution of Engineers, Australian National Conference, Adelaide.
64. Jolly ID et al. 1991. The role of floodplain vegetation in salt accession to the River Murray in South Australia. In Hydrology and Water Resources Symposium, The Institution of Engineers, Australia, National Conference, Perth.
65. Jolly ID, Walker GR and Narayan KA. 1993. Floodwater/aquifer interaction in an arid floodplain and its implications for River Murray salinity. In Hydrology and Water Resources Symposium. Newcastle.
66. Jolly ID, Walker GR and Narayan KA. 1994. Floodwater recharge processes in the Chowilla Anabranch System, South Australia, A.J.o.S. Research, Editor. CSIRO Centre for Groundwater Studies.
67. Jolly ID, Walker GR and Thorburn PJ. 1993. Salt Accumulation in Semi-arid Floodplain soils with implications for Forest Health.
68. Jolly ID et al. 1992. The cause of blackbox decline in the Chowilla anabranch region, South Australia, and possible ameliorative approaches. In Catchments of Green, National Conference on Vegetation and Water Management. Greening Australia, Adelaide.

APPENDIX C Chowilla Reference List
Chowilla Anabranch System 67 Report DWLBC 2004 / 06 Surface Water Information Summary
69. Killick JC. 1972. Report on the consultants' investigations of the Lake Victoria and Chowilla-Lock 6 areas. E&WS, Adelaide.
70. Kinhill Stearns. 1986. Chowilla Anabranch Study.
71. Kuchel R. 1967. Vegetation of the Chowilla Area. In Select papers from the spring school held at Chowilla station on the River Murray. Dept. of Adult Education, University of Adelaide, Adelaide.
72. Loveys B. 1994. A comparison of the hydraulic architecture of two eucalypt species. In Biological Sciences. Flinders University of S. Aust: Adelaide.
73. Ludbrook NH. 1960. Chowilla Dam Site River Murray. Stratigraphy and Micropalaeontology. South Australian Department of Mines, Adelaide.
74. Margules and Partners, P Smith and J Smith. 1990. River Murray Riparian Vegetation Study. Department of Conservation, Forests and Lands, Canberra.
75. McEwan K, Jolly ID and Holub AN. 1994. Effects of Flooding on Water use of Eucalyptus largiforens, Compilation of Results from the 1992/93 Flood. CSIRO, Division of Water Resources, Canberra.
76. McEwan KL et al. 1991. Compilation of Soil Water and Chloride Profiles from the Chowilla Anabranch Region, South Australia. CSIRO, Institute of Natural Resources and Environment, Division of Water Resources, Canberra.
77. McEwan KL, Richter M and Jolly ID. 1995. Compilation of Soils, Groundwater and Transpiration Measurements of Eucalyptus largiflorens on the Chowilla floodplain around the 1993/94 flood. CSIRO Division of Water Resources.
78. Mensforth LJ et al. 1994. Sources of water used by riparian Eucalyptus camaldulensis overlying highly saline groundwater. Oecologia, 100: 21–28.
79. Miller AC. 2002. The distribution of box mistletoe (Amyema miquelii) in a semi-arid woodland in relation to host water status, In Department of Environmental Biology. University of Adelaide.
80. Morris JD. 1991. Redgum condition in the Chowilla anabranch system and impacts of changing surface flow on redgums adjacent to creeks. Report to the Chowilla Working Group, MDBC. Department of Conservation and Environment, Victoria.
81. Murray-Darling Basin Commission. 1991. Chowilla Inspection tour 9-11-91. MDBC.
82. Murray-Darling Basin Commission. 1991. Chowilla – integrated management. Presentation by Working Group Chairman.
83. Murray-Darling Basin Commission. 1991. Chowilla resource management plan – Community Consultation Program. MDBC.
84. Murray-Darling Basin Commission. 1992. Chowilla Resource Management Plan – Progress Report. MDBC.
85. Murray-Darling Basin Commission. 2003. The Living Murray Initiative – The Chowilla Floodplain Demonstration (draft, 9 October 2003).
86. Murray-Darling Basin Commission. 2004. The Living Murray Initiative – Foundation Report on the Significant Ecological Assets Targeted in the First Step (In Prep.).
APPENDIX C Chowilla Reference List
Chowilla Anabranch System 68 Report DWLBC 2004 / 06 Surface Water Information Summary
87. Murray-Darling Basin Commission. Undated. Chowilla resource management plan: a summary. MDBC.
88. Naracoorte College of TAFE. 1981. Flora of Danggali and Chowilla. Naracoorte College of TAFE, Naracoorte.
89. Narayan K, Jolly ID and Walker GR. 1993. Predicting Flood-Driven Water Table Fluctuations in a Semi-Arid Floodplain of the River Murray Using a Simple Analytical Model. CSIRO Divison of Water Resources.
90. National Environmental Consultancy. 1988. Chowilla Salinity Mitigation Scheme Draft Environmental Impact Statement. E&WS, South Australia.
91. Nicholson K and Noyce T. 1994. Using GIS to determine the relationship between groundwater depth and vegetation health of the Chowilla floodplain. In River Murray Mapping Conference, Albury. Murray-Darling Basin Commission, Canberra.
92. Noyce T and Nicolson K. 1993. Chowilla Flood and Groundwater, Analysis. SA Office of Planning and Urban Development, Adelaide.
93. O'Malley C and Sheldon F (eds). 1990. Chowilla Floodplain Biological Study. Nature Conservation Society of South Australia, Adelaide.
94. Overton IC et al. 1994. Developing a GIS for determining flow management to conserve vegetation on the Chowilla floodplain, South Australia. In Resource Technology 1994, Proceedings of the National Conference. University of Melbourne.
95. Overton IC and Jolly ID. 2003. Investigation of Floodplain and Groundwater Interactions at Chowilla. CSIRO and Department for Water Land and Biodiversity Conservation.
96. Overton IC et al. 1994. Minimum spatial data requirements for the determination of flow management to alleviate salt stressed vegetation in the Lower Murray floodplains. In River Murray Mapping Conference, Albury. Murray-Darling Basin Commission, Canberra.
97. Overton IC et al. 1997. Modelling soil salinisation and vegetation health of a River Murray floodplain over time. in MODSIM '97: International Congress on Modelling and Simulation. Hobart.
98. Overton IC, Lewis MM and Walker GR. 1994. Vegetation mapping of the Chowilla anabranch region using Landsat TM and digital orthophotography. In River Murray Mapping Conference, Albury.
99. Overton IC, Lewis MM and Walker GR. 1996. Detecting vegetation change on a semi-arid floodplain using Landsat TM, Chowilla South Australia. In 8th Australian Remote Sensing Conference, Canberra.
100. Overton IC et al. 1994. The evaluation of Geographical Information System for assessing the health of vegetation on a River Murray floodplain. In Water Down Under '94. Adelaide: The Institution of Engineers, Australia.
101. Overton IC, Walker GR and Jolly ID. 1995. Modelling Soil Salinisation Risk on a River Murray Floodplain Using a Geographical Information System – Chowilla, South Australia. AURISA 95, Melbourne.

APPENDIX C Chowilla Reference List
Chowilla Anabranch System 69 Report DWLBC 2004 / 06 Surface Water Information Summary
102. Palmer AC and Roberts J. 1996. Black Box (Eucalyptus largiflorens) on the Chowilla Floodplain. CSIRO Division of Water Resources, Griffith.
103. Phillips B and Sharley T. 1993. The Chowilla Resource Management Plan, Australia. In Towards the Wise Use of Wetlands, Report of the Ramsar Convention-Wise Use Project, T.J. Davis (ed). Ramsar Convention Bureau.
104. Pierce BE. 1990. Chowilla fisheries Investigations. Report to Murray-Darling Basin Commission. Summary. SA Department of Fisheries.
105. Richards JA. 1997. An investigation into the comparative level of salt tolerance of three flood plain eucalyptus and their suitability for revegetation.
106. Richter M. 1994. Water use response of Eucalyptus largiflorens (F. Muell) to flooding on the Chowilla Floodplain, the River Murray, South Australia. In Biological Sciences. The Flinders University of South Australia, Adelaide.
107. Roberts J and Ludwig JA. 1990. Riparian Habitats on the Chowilla Floodplain of the River Murray, South Australia. In Wetlands Australia, pp 13-19.
108. Sharley T and Huggan C. 1995. Chowilla Resource Management Plan – Final Report. Murray-Darling Basin Commission.
109. Shepherd KJ. 1967. Report on disposal of Salt Water from Chowilla Dam at Tilmy Flat. SA Government.
110. Sinclair Knight Merz. 1998. Chowilla Groundwater Control Scheme: Supplementary Investigations, Draft B. Armadale.
111. Sinclair Knight Merz. 1999. Chowilla Groundwater Control Scheme - Supplementary Investigations Final. Armadale Vic.
112. Slavich PG. 1997. Modelling Groundwater Use, Salt Accumulation and Vegetation Growth in Areas with Shallow Saline Watertables. Flinders University of South Australia, Adelaide.
113. Slavich PG, Walker GR and Jolly ID. 1996. Vegetation response to modified flooding regimes and groundwater depth on a saline floodplain. In Proceedings of Hydrology and Water Resources Symposium. Hobart: The Institution of Engineers, Australian National Conference.
114. Slavich PG, Walker GR and Jolly ID. 1999. A flood history weighted index of average root-zone salinity for assessing flood impacts on health of vegetation on a saline floodplain. Agricultural Water Management, 39, 135-51.
115. Slavich PG et al. 1999. Dynamics of Eucalyptus largiflorens growth and water use in response to modified watertable and flooding regimes on a saline floodplain. Elsevier – Agricultural Water Management, 39: p. 245-64.
116. Smith K. 2003. Assessment and documentation of previous hydrological work undertaken at Chowilla. Department for Water Land and Biodiversity Conservation.
117. Smith M. 1989. Environmental Management Issues in the Chowilla Region. In Third Fenner Conference on the Environment, Conservation in Management of the River Murray System – Making Conservation Count. Canberra.
118. Smith MRL. 1988. Photographic record of the Chowilla anabranch water levels corresponding to a river murray flow of 35,000 ML/Day. E&WS, Adelaide.

APPENDIX C Chowilla Reference List
Chowilla Anabranch System 70 Report DWLBC 2004 / 06 Surface Water Information Summary
119. Social & Ecological Assessment Pty Ltd. 1989. Chowilla Recreation Study. Report for the MDBC. SA Department of Environment and Planning, Adelaide.
120. South Australian Department of Environment and Planning. 1987. Guidelines for an environmental impact statement: Chowilla salinity mitigation scheme: for use by the Engineering and Water Supply Department and associated consultants. 1987, South Australian Department of Environment and Planning, Adelaide.
121. Streeter T. 1993. Water use strategies of Eucalyptus largiflorens (F. Muell.) at different groundwater salinities on a floodplain of the River Murray, South Australia. in Department of Biology. Flinders University of South Australia, Adelaide.
122. Taylor PJ. 1993. An Assessment of the Applicability of an Existing G.I.S. and Aerial Photography for Predicting the Health of Black Box (Eucalyptus largiflorens F. Muell) on the Chowilla floodplain in Environmental Sciences and Rangeland Management.
123. Taylor PJ et al. 1996. Testing of a GIS Model of Eucalyptus largiflorens health on a semi-arid, saline floodplain. Environmental Management, 20: 553-64.
124. Taylor RRJ. 1973. The role of the experts and the failure of Parliament: the Chowilla Dam issue in South Australian politics. Dept. of Politics, University of Adelaide, Adelaide.
125. The South Australian Government. 1965. Chowilla Dam, A Regulating Storage on the River Murray. 1965, The South Australian Government: Adelaide.
126. Thorburn PJ. 1993. Groundwater Uptake by Eucalyptus Forests on the Chowilla Floodplain, South Australia: Implications for Groundwater Hydrology and Forest Ecology and Health. Flinders University of South Australia: Adelaide.
127. Thorburn PJ, Hatton TJ and Walker GR. 1993. Combining measurements of transpiration and stable isotopes of water to determine groundwater discharge from forests. Journal of Hydrology, 563-587.
128. Thorburn PJ, Mensforth LJ and Walker GR. 1994. Uptake of groundwater by creek-side river red gums. In Water Down Under 1994-International Groundwater and Hydrology Conference. The Institution of Engineers, Australia National Conference, Adelaide.
129. Thorburn PJ and Walker GR. 1993. The source of water transpired by Eucalyptus camaldulensis: Soil, groundwater or streams? In JR Ehleringer, AE Hall and GD Farquar (eds), Stable Isotopes of Plant Carbon/Water Relations, pp 511–27. Academic Press, San Diego.
130. Thorburn PJ and Walker GR. 1994. Variations in stream water uptake by Eucalyptus camaldulensis with differing access to stream water. Oecologia, 100: 293-301.
131. Thorburn PJ and Walker GR. 1994. Reliance of creek-side river red gums on creek water. Aust. J. Mar. Freshwater Res, 45: 1439-43.
132. Thorburn PJ, Walker GR and Hatton TJ. 1992. Transpiration of saline groundwater by Eucalyptus camaldulensis on a floodplain of the River Murray, South Australia. In Perspective of Plant Carbon and Water Relations from Stable Isotopes. Proceedings of the 15th Annual Plant Physiology Symposium. University of California, Riverside.
APPENDIX C Chowilla Reference List
Chowilla Anabranch System 71 Report DWLBC 2004 / 06 Surface Water Information Summary
133. Thorburn PJ, Walker GR and Mensforth LJ. 1992. Use of saline groundwater by eucalypt forests on an arid floodplain in Australia. In Abstracts of the American Society of Agronomy Annual Conference. Minnesota.
134. Thorburn PJ et al. 1992. Are river red gums taking water from soil, groundwater or streams? In Proceedings of National Conference on Vegetation and Water Management, Adelaide. Greening Australia, Canberra.
135. University of South Australia. 1994. Habitat assessment and monitoring of Danggali Conservation Park, Chowilla Regional Reserve and Calperum Regional Reserve. Centre for Environmental and Recreation Management, University of South Australia, Adelaide.
136. Vader L, Jolly ID and Walker GR. 1994. Hydrochemistry and Stable Isotopes as Indicators of Groundwater Mixing and Discharge to Streams in the Chowilla Region, South-Eastern Australia. CSIRO Division of Water Resources, Canberra.
137. Walker GR, Jolly ID and Jarwal SD. 1995. Salt and Water Movement in the Chowilla Floodplain. CSIRO Division of Water Resources, Canberra.
138. Ward M. 1995. Guidelines for the Development of Interpretive Activity Booklets for Children visiting the Chowilla Floodplain Area: A report prepared for the Bookmark Biosphere Reserve. University of South Australia, Adelaide.
139. Waterhouse J. 1989. The Hydrogeology of the Chowilla floodplain: Status Report, Prepared for the MDBC.
140. Watkins N. 1992. Chowilla Resource Management Plan – Hydrogeological Data Report 1, Drilling and Laboratory Soil Testing. E&WS, Adelaide.
141. Watkins N. 1992. Chowilla resource Management Plan – Hydrogeological Data Report 2, Aquifer Pump Testing and Groundwater Chemistry. E&WS, Adelaide.
142. Watkins N. 1992. Chowilla Resource Management Plan – Hydrogeological Data Report 3, Interpretation of Aquifer Pump Testing. E&WS, Adelaide.
143. West SM. 1993. Design review of salinity mitigation proposal: Chowilla / SM West Australian Salinity & Catchment Management. Hawthorn.
144. Williams, SL. 1996. Monitoring the effectiveness of the Chowilla Revegetation Program. Internal report. Chicago Zoological Society and SA Department of Environment and Natural Resources, Murraylands Region.
145. Williams SL and Dominelli S. 1995. Surveys for monitoring long term changes in flora (and subsequently fauna) on Bookmark Biosphere Reserve, including Calperum Station. Internal report. Australian Nature Conservation Agency and SA Department of Environment and Natural Resources, Murraylands Region.
146. Wood S. 1990. Soils and Vegetation of the Chowilla Anabranch System. SA Dept of Agriculture.
147. Woodward-Clyde. 2000. Integrated Flow Management Strategy.
148. Zubrinich TM. 1996. An investigation of the ecophysiological, morphological and genetic characteristics of Eucalyptus largiflorens F. Muell and Eucalyptus gracilis F. Muell: in relation to soil salinity and groundwater conditions throughout the Chowilla Anabranch.

APPENDIX C Chowilla Reference List
Chowilla Anabranch System 72 Report DWLBC 2004 / 06 Surface Water Information Summary
149. Zubrinich TM et al. 2000. Tree physiology. In Tolerance of salinised floodplain conditions in a naturally occurring Eucalyptus hybrid related to lowered plant water potential, p. 953–63.

APPENDIX D Riverland Region Digital File Set
Chowilla Anabranch System 73 Report DWLBC 2004 / 06 Surface Water Information Summary
APPENDIX D RIVERLAND REGION DIGITAL FILE SET
Category description Code
River Murray flow, salinity, water levels, salt load data and calculations RM Chowilla Anabranch flow, salinity, water levels, salt load data and calculations CA Flow gauging data at individual sites FG GPS waypoint data, location data GPS Bathymetry, stream bed levels, echo soundings, bank levels BATH Ground water data, pump test results GW Special projects – not surface water or groundwater studies SP Photos and images PI
File name File type Contents description Code
BANKLEVL.XLS Excel Chowilla Creek Banks and Creek Inlet Invert Level BATH chowbottom depth.xls Excel Chowilla Creek bed depth sounding survey,
9/09/2003. BATH
Chowilla Banks & Weirs.doc
Word Chowilla Banks & Weirs 28/03/2003. River Flow into SA 6000 ML/d. Photos and comments.
BATH
Chowtop depth.xls Excel Chowilla Ck bed depth sounding survey, 29/04/2003. BATH Chowtop depths.xls Excel Chowilla Ck bed depth sounding survey, 29/04/2003.
Sounding data. BATH
ECHOSOUN.XLS Excel Echo Sounder Digitised Data for Salt/Punkah Ck. Original data was in file CHOWCK1.WQ1. File used to 'digitise data into Hydstra Time Series format.
BATH
Chow Rof R EC 280403.xls
Excel Run of River survey Chowilla Creek 29/4/2003, 6/5/2003, 7/5/2003 – EC data.
CA
Chow RR May2003.xls Excel Run of River survey Chowilla Creek May 2003 - Salt load Calculations.
CA
Chow Survey May 2003.xls
Excel Run of River survey Chowilla Creek May 2003 - blank field sheet.
CA
Chowilla Gauge Board Adjustments.doc
Word New levels and Gauge Board adjustments 2003. (also see: gauge board levels punkah.xls)
CA
CHOWMON.XLS Excel Top and Bottom EC readings and Water Level data from Chowilla Creek and Monoman Creek bridges. Data collected by Lock 6 personnel December 1984 to February 1991.
CA
CHOWOBS.XLS Excel Water Level and Salinity data from Chowilla Ck, Monoman Ck, Salt Ck, Punkha Ck. Feb 1986 to Jan 1989. Chowilla Ck gaugings Jan 1995 to Jan 1998.
CA
CHOWREP.DOC Word MDBC Chowilla Resource Management Plan 1995. CA
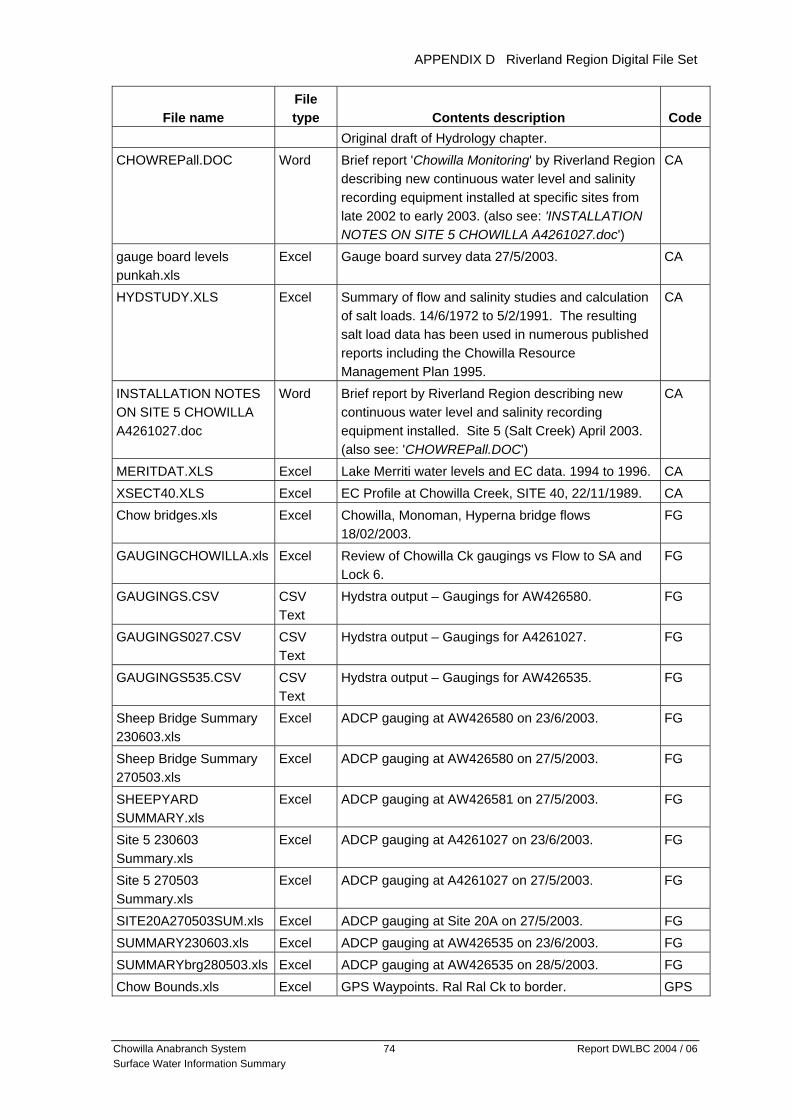
APPENDIX D Riverland Region Digital File Set
Chowilla Anabranch System 74 Report DWLBC 2004 / 06 Surface Water Information Summary
File name File type Contents description Code
Original draft of Hydrology chapter. CHOWREPall.DOC Word Brief report 'Chowilla Monitoring' by Riverland Region
describing new continuous water level and salinity recording equipment installed at specific sites from late 2002 to early 2003. (also see: 'INSTALLATION NOTES ON SITE 5 CHOWILLA A4261027.doc')
CA
gauge board levels punkah.xls
Excel Gauge board survey data 27/5/2003. CA
HYDSTUDY.XLS Excel Summary of flow and salinity studies and calculation of salt loads. 14/6/1972 to 5/2/1991. The resulting salt load data has been used in numerous published reports including the Chowilla Resource Management Plan 1995.
CA
INSTALLATION NOTES ON SITE 5 CHOWILLA A4261027.doc
Word Brief report by Riverland Region describing new continuous water level and salinity recording equipment installed. Site 5 (Salt Creek) April 2003. (also see: 'CHOWREPall.DOC')
CA
MERITDAT.XLS Excel Lake Merriti water levels and EC data. 1994 to 1996. CA XSECT40.XLS Excel EC Profile at Chowilla Creek, SITE 40, 22/11/1989. CA Chow bridges.xls Excel Chowilla, Monoman, Hyperna bridge flows
18/02/2003. FG
GAUGINGCHOWILLA.xls Excel Review of Chowilla Ck gaugings vs Flow to SA and Lock 6.
FG
GAUGINGS.CSV CSV Text
Hydstra output – Gaugings for AW426580. FG
GAUGINGS027.CSV CSV Text
Hydstra output – Gaugings for A4261027. FG
GAUGINGS535.CSV CSV Text
Hydstra output – Gaugings for AW426535. FG
Sheep Bridge Summary 230603.xls
Excel ADCP gauging at AW426580 on 23/6/2003. FG
Sheep Bridge Summary 270503.xls
Excel ADCP gauging at AW426580 on 27/5/2003. FG
SHEEPYARD SUMMARY.xls
Excel ADCP gauging at AW426581 on 27/5/2003. FG
Site 5 230603 Summary.xls
Excel ADCP gauging at A4261027 on 23/6/2003. FG
Site 5 270503 Summary.xls
Excel ADCP gauging at A4261027 on 27/5/2003. FG
SITE20A270503SUM.xls Excel ADCP gauging at Site 20A on 27/5/2003. FG SUMMARY230603.xls Excel ADCP gauging at AW426535 on 23/6/2003. FG SUMMARYbrg280503.xls Excel ADCP gauging at AW426535 on 28/5/2003. FG Chow Bounds.xls Excel GPS Waypoints. Ral Ral Ck to border. GPS

APPENDIX D Riverland Region Digital File Set
Chowilla Anabranch System 75 Report DWLBC 2004 / 06 Surface Water Information Summary
File name File type Contents description Code
Chow Ext.xls Excel GPS Waypoints Chowilla Area. GPS CHOW92pumpTEST.xls Excel Groundwater pump drawdown test March-April 1992
– Recorded piezometer level data. GW
Chowilla Piezo Details 240103 XL.xls
Excel Chowilla Area piezometers. Location Easting + Northing and ref point levels.
GW
CHOWLEVS.XLS Excel Chowilla piezometers H12, H6 from 26/11/1990 to 25/09/1997.
GW
CHOWMAP.XLS Excel Piezometer locations? GW Proposed Wells (details - Accessability).xls
Excel Proposed Wells for Chowilla SIS Investigations. GW
Pump test calcs.XLS Excel Chowilla, Lake Littra Pump test 1992. Calculation of flow rates of pump test.
GW
Chowilla Schemattic.jpg Image Scanned image of Chowilla Anabranch schematic diagram.
PI
I.O.F. close up.JPG Image Photo of Isle of Man. Date unknown. PI Isle Of Man Landing.JPG Image Photo of Isle of Man. Date unknown. PI Photos Sub-
DirectoryContains various JPG image files – sites in Chowilla. PI
AVGQ2SA.XLS Excel Average Monthly Flows to S.A. for current and natural conditions. Data source MDBC 15/09/1993.
RM
Chow loads.xls Excel Murray River Monthly Salt Load from Chowilla calculation using EC pontoon data. Jan 2001–Oct 2003. (also see: Chow Pontoon SaltLoads.xls)
RM
Chow Pontoon SaltLoads.xls
Excel Murray River monthly salt load from Chowilla calculation using EC pontoon data. Jan 2001–Aug 2003. (also see: Chow Loads.xls)
RM
CHOWSALT.XLS Excel Calculation of monthly salt load increase in River Murray based on daily EC and flow data. The resulting salt load data has been used in numerous published reports including the Chowilla Resource Management Plan 1995.
RM
LOCK6WL.XLS Excel Lock 6 U/S and D/S water levels 1927 to 1936. Published reports including the Chowilla Resource Management Plan 1995.
RM
RECESION.XLS Excel Chowilla Salt Load Recession Curve. Published in the Chowilla Resource Management Plan 1995.
RM
Chow Ntem proposed.doc Word Document containing map of proposed NATREM project sites in Chowilla area.
SP
Chow ntem proposed.jpg Image Map of proposed NATREM project sites in Chowilla area.
SP
CHOWFISH.XLS Excel Results of Chowilla Fish Studies surface water monitoring Lake Littra Oct 1989 to Aug 1991.
SP

APPENDIX E Monthly Mean EC at Daily Read and Continuously Recorded Sites
Chowilla Anabranch System 76 Report DWLBC 2004 / 06 Surface Water Information Summary
APPENDIX E MONTHLY MEAN EC AT DAILY READ AND CONTINUOUSLY RECORDED SITES
Site D/S Rufus Templeton Lock 6 U/S D/S
Chowilla
U/S
Chowilla
U/S Old
Customs
House
D/S
Chowilla–
Templeton
U/S
Chowilla–
Lock 6
U/S Old
Customs
Hs–Lock 6
Distance 696 602.9 619.8 609 612.3 637.1 (6.1 km) (7.5 km) (17.3 km)
Site ID AW426200 AW426632 AW426510 AW426704 AW426705 A4261022
Parameter Flow (ML/d) Daily read
EC
Daily read
EC
Recorded
EC
Recorded
EC
Recorded
EC
EC
Difference
EC
Difference
EC
Difference
Mar-2001 13567 343 340 344 345 1 5
Apr-2001 14900 342 337 342 339 -1 2
May-2001 6583 342 329 344 339 2 10
Jun-2001 3041 395 354 392 375 -3 21
Jul-2001 5998 376 354 371 361 -5 7
Aug-2001 6633 359 346 362 353 4 7
Sep-2001 7160 377 363 377 370 0 7
Oct-2001 8216 397 369 379 372 -18 3
Nov-2001 6984 436 410 420 414 -16 4
Dec-2001 6750 431 418 433 424 1 6
Jan-2002 6657 455 448 459 455 4 6
Feb-2002 6531 481 470 484 475 3 5
Mar-2002 5521 485 476 492 485 7 9
Apr-2002 3885 471 452 469 465 -3 13
May-2002 2470 432 409 434 424 2 16
Jun-2002 2446 412 388 412 409 0 21
Jul-2002 2995 396 371 398 394 1 23
Aug-2002 3584 346 327 349 341 2 15
Sep-2002 4085 359 344 363 358 351 4 14 8
Oct-2002 4974 316 300 314 309 290 -2 9 -10
Nov-2002 5537 227 204 227 218 196 0 14 -8
Dec-2002 6369 181 169 185 179 177 4 10 8
Jan-2003 6235 ceased 174 185 184 185 11 11
Feb-2003 6199 219 238 221 240 1 20
Mar-2003 5605 210 230 224 224 14 14
Apr-2003 4144 252 271 266 254 13 2
May-2003 2637 232 257 257 248 24 16
Jun-2003 2036 288 321 307 293 19 5
Max 7 24 20
Min -18 1 -10
Median 1 10 8
Mean -1 11 7

Chowilla Anabranch System 77 Report DWLBC 2004 / 06 Surface Water Information Summary
APPENDIX F CHOWILLA ANABRANCH SCHEMATIC

APPENDIX G Flow And Salinity Study Total Salt Load Increase In Chowilla Anabranch
Chowilla Anabranch System 78 Report DWLBC 2004 / 06 Surface Water Information Summary
APPENDIX G FLOW AND SALINITY STUDY TOTAL SALT LOAD INCREASE IN CHOWILLA ANABRANCH
Study date R.Murray flow
(ML/day)
Rise, fall,
steady
Previous peak flow
(ML/day)
Previous peak flow
date
Number of days
since peak
Salt load
(t/day)
14-06-1972 11,300 R 77,200 22-11-1970 570 79
01-02-1973 5,680 S 77,200 22-11-1970 802 65
28-02-1973 4,480 S 77,200 22-11-1970 829 66
21-03-1973 4,030 S 77,200 22-11-1970 850 55
24-02-1975 13,600 S 183,000 05-11-1974 111 3770
28-02-1975 11,700 S 183,000 05-11-1974 115 2232
29-01-1976 21,300 F 163,000 14-12-1975 46 881
10-02-1976 21,300 S 163,000 14-12-1975 58 1214
09-08-1976 21,200 F 163,000 14-12-1975 239 246
28-02-1977 9,330 R 163,000 14-12-1975 442 467
25-01-1983 5,300 S 105,000 11-10-1981 471 97
15-04-1983 4,220 S 105,000 11-10-1981 551 212
21-04-1983 4,350 S 105,000 11-10-1981 557 125
31-05-1983 3,170 S 105,000 11-10-1981 597 66
14-06-1983 2,750 S 105,000 11-10-1981 611 95
23-06-1983 4,420 S 105,000 11-10-1981 620 32
15-01-1985 7,960 S 68,300 15-10-1984 92 194
17-04-1985 4,080 S 68,300 15-10-1984 184 252
07-05-1985 3,210 S 68,300 15-10-1984 204 113
08-05-1985 3,220 S 68,300 15-10-1984 205 116
26-02-1986 6,690 S 68,300 15-10-1984 499 26
10-03-1986 6,150 R 68,300 15-10-1984 511 48
11-03-1986 6,170 R 68,300 15-10-1984 512 58
12-03-1986 6,110 R 68,300 15-10-1984 513 43
13-03-1986 6,000 S 68,300 15-10-1984 514 39
14-03-1986 6,130 S 68,300 15-10-1984 515 39

APPENDIX G Flow And Salinity Study Total Salt Load Increase In Chowilla Anabranch
Chowilla Anabranch System 79 Report DWLBC 2004 / 06 Surface Water Information Summary
21-04-1986 4,710 S 68,300 15-10-1984 553 48
22-04-1986 4,510 S 68,300 15-10-1984 554 67
23-04-1986 4,180 S 68,300 15-10-1984 555 63
15-11-1989 24,500 R 85,200 12-10-1989 34 309
22-11-1989 26,730 R 85,200 12-10-1989 41 280
18-12-1989 14,290 F 85,200 12-10-1989 67 348
31-01-1990 9,070 S 85,200 12-10-1989 111 429
05-02-1991 9,620 F 103,510 18-10-1990 110 457
Note: Salt loads are calculated from measured flow in the lower reach of Chowilla Creek and the difference in salinity in the River Murray upstream of the Chowilla Anabranch and the salinity in the lower reach of Chowilla Creek.
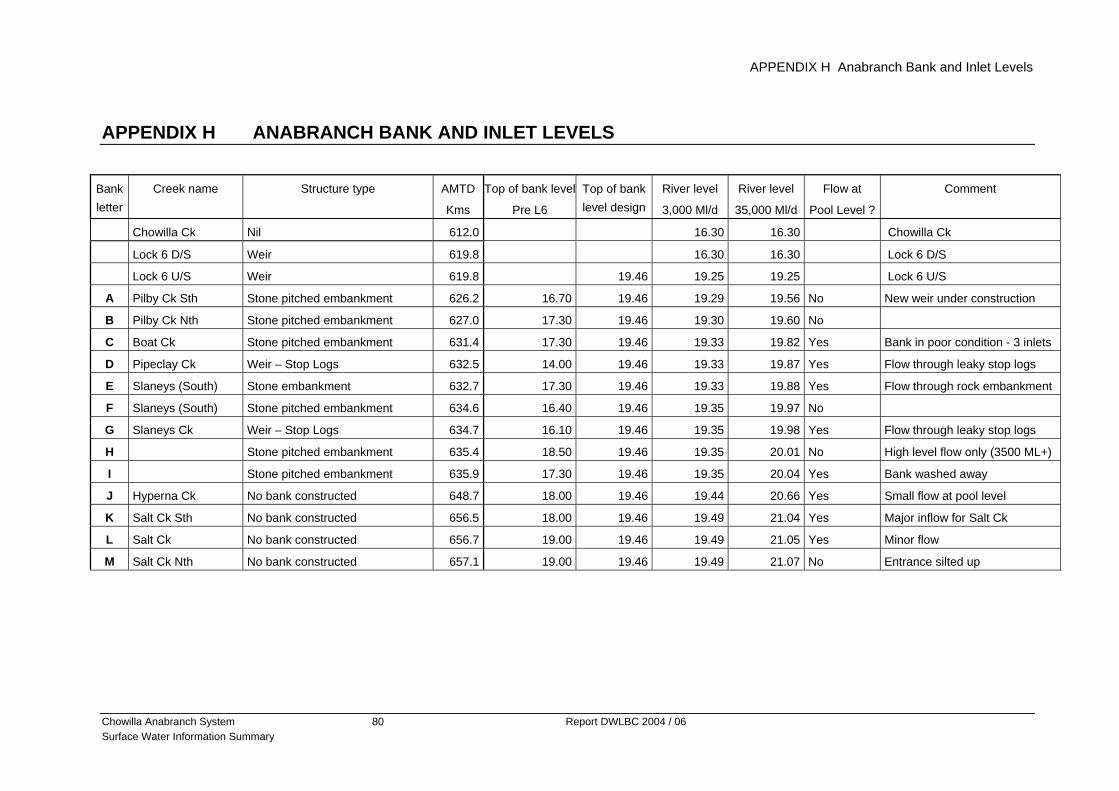
APPENDIX H Anabranch Bank and Inlet Levels
Chowilla Anabranch System 80 Report DWLBC 2004 / 06 Surface Water Information Summary
APPENDIX H ANABRANCH BANK AND INLET LEVELS
Bank letter
Creek name Structure type AMTD
Kms
Top of bank level
Pre L6
Top of bank level design
River level
3,000 Ml/d
River level
35,000 Ml/d
Flow at
Pool Level ?
Comment
Chowilla Ck Nil 612.0 16.30 16.30 Chowilla Ck
Lock 6 D/S Weir 619.8 16.30 16.30 Lock 6 D/S
Lock 6 U/S Weir 619.8 19.46 19.25 19.25 Lock 6 U/S
A Pilby Ck Sth Stone pitched embankment 626.2 16.70 19.46 19.29 19.56 No New weir under construction
B Pilby Ck Nth Stone pitched embankment 627.0 17.30 19.46 19.30 19.60 No
C Boat Ck Stone pitched embankment 631.4 17.30 19.46 19.33 19.82 Yes Bank in poor condition - 3 inlets
D Pipeclay Ck Weir – Stop Logs 632.5 14.00 19.46 19.33 19.87 Yes Flow through leaky stop logs
E Slaneys (South) Stone embankment 632.7 17.30 19.46 19.33 19.88 Yes Flow through rock embankment
F Slaneys (South) Stone pitched embankment 634.6 16.40 19.46 19.35 19.97 No
G Slaneys Ck Weir – Stop Logs 634.7 16.10 19.46 19.35 19.98 Yes Flow through leaky stop logs
H Stone pitched embankment 635.4 18.50 19.46 19.35 20.01 No High level flow only (3500 ML+)
I Stone pitched embankment 635.9 17.30 19.46 19.35 20.04 Yes Bank washed away
J Hyperna Ck No bank constructed 648.7 18.00 19.46 19.44 20.66 Yes Small flow at pool level
K Salt Ck Sth No bank constructed 656.5 18.00 19.46 19.49 21.04 Yes Major inflow for Salt Ck
L Salt Ck No bank constructed 656.7 19.00 19.46 19.49 21.05 Yes Minor flow
M Salt Ck Nth No bank constructed 657.1 19.00 19.46 19.49 21.07 No Entrance silted up

Filename: ChowillaSurfaceWaterInfoReport_FinalDraft.doc Directory: D:\Reports Template: C:\Program Files\Microsoft Office\Office\Normal.dot Title: Assessment of Farm Dams Subject: Author: Peter Stace Keywords: Comments: Creation Date: 1/02/2005 4:00 PM Change Number: 33 Last Saved On: 9/03/2005 9:16 AM Last Saved By: SA Government Total Editing Time: 380 Minutes Last Printed On: 9/03/2005 9:20 AM As of Last Complete Printing Number of Pages: 88 Number of Words: 27,056 (approx.) Number of Characters: 143,401 (approx.)