choosing and using statistics - weebly
TRANSCRIPT

Choosing and Using Statistics
Jinliang liu (刘金亮)Institute of Ecology, College of life science
Zhejiang UniversityE-mail: [email protected]
http://jinliang.weebly.com

What is statistics for?
• To find patterns in your data• To detect difference among groups of data• To detect relations between variables

Eight steps to successful data analysis1. Decide what you are interested in.2. Formulate a hypothesis or hypotheses.3. Design the experiment or sampling routine.4. Collect dummy data. Make up approximate values based on what
you expect.5. Use the statistic methods to decide on the appropriate test or tests.6. Carry out the test using the dummy data.7. If there are problems go back to step 3(or 2), otherwise collect
the real data.8. Carry out the test(s) the real data.

Basics• Observations• Hypothesis testing • P-value• Sampling • Experiments• Statisticsü Descriptive statisticsü Tests of differenceü Tests of relationshipsü Tests for data investigation

• P≤ 0.01 : very strong presumption against null hypothesis• 0.01<P ≤ 0.05 : strong presumption against null hypothesis• 0.05<P≤0.1 : low presumption against null hypothesis• P >0.1: no presumption against the null hypothesis
P-Value

Types of statistics
• Descriptive statistic—mean, median, dispersion…• Parametric statistics—know distributions, e.g. normal• Non-parametric statistics—little or no knowledge distribution

Variable
• Measurement variables--Continuous variables--Discrete variables
• Ranked variables• Attributes• Derived variables (or “computed variables”)
Types of distribution
Discrete distributions1. The Poisson distributionØthe number of times an event occurs in a unit of time or
spaceØTo test for randomness or independence in either space
or timeVariance>mean: more clumped than randomVariance< mean: more ordered (uniform) than random
Types of distribution
Discrete distributions2. The binomial distributionThis is a discrete distribution of number of events3. The negative binomial distributionIt can be used to describe clumped data (i.e. when there are more very crowded and more sparse observations than a Poisson distribution with the same mean)4. The hypergeometric distributionTo describe events where individuals are removed from a population and not replaced
Types of distribution
Continuous distributions1. The rectangular distribution
Describes any distribution where all values are equally likely to occur.

Types of distribution
Continuous distributions2. The normal distribution (Gaussian distribution)
Test: Kolmogorov-Smirnov test, Anderson-Darling test, Shapiro-Wilk test, chi-square goodness of fit
R code: shapiro.test(), qqnorm(),qqline()
Describe: mean, standard deviation, skewness, kurtosis
Transformations: logarithmic, square root, arcsine square root for percentage or proportion data, probits, logits

Types of distribution
Continuous distributions3. The t-distribution
Related to the normal distribution but is flatter with extended tails
Confidence intervals95% confidence intervals (CI) are calculated for samples using t-distributions (mean±S.E.).
Types of distribution
Continuous distributions4. The chi-square distribution It is asymmetric and varies from 0 to positive infinity. The chi-square distribution is related to variance5. The exponential distributionIt occurs when there is a constant probability of birth, death, increase or decrease

Types of distribution
Non-parametric “distributions”Ignore distributions totallyRanking, quartiles and the interquartile rangeBox and whisker plots
Descriptive statistics
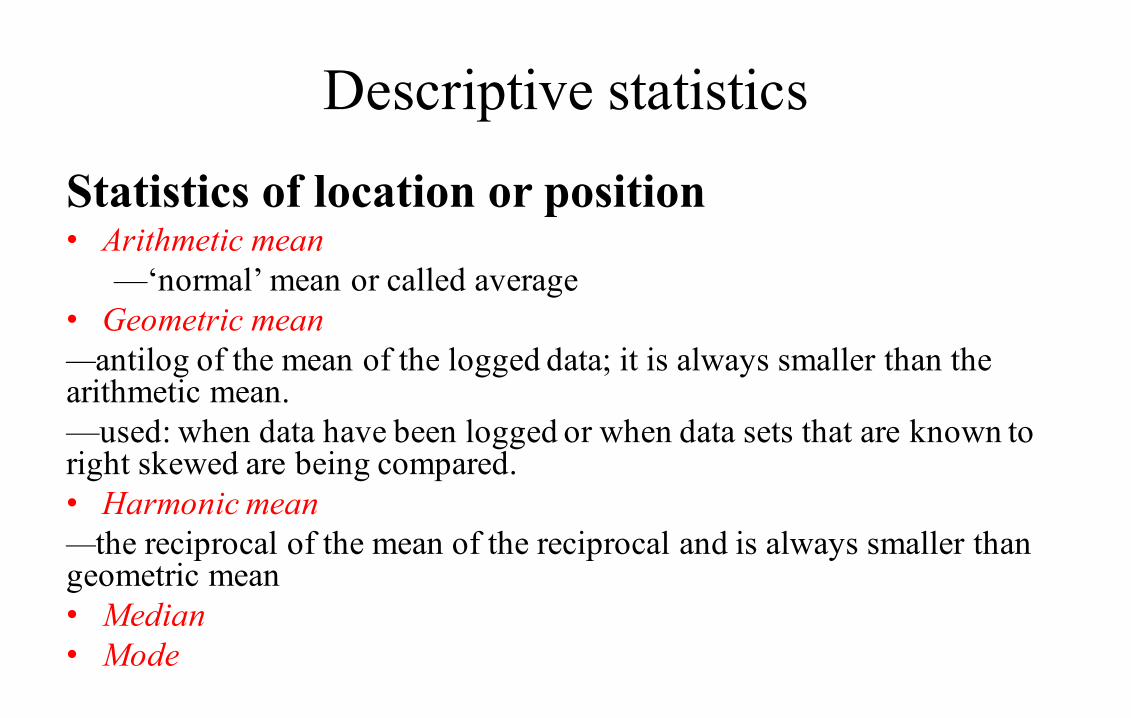
Statistics of location or position• Arithmetic mean
—‘normal’ mean or called average• Geometric mean—antilog of the mean of the logged data; it is always smaller than the arithmetic mean. —used: when data have been logged or when data sets that are known to right skewed are being compared.• Harmonic mean—the reciprocal of the mean of the reciprocal and is always smaller than geometric mean• Median• Mode
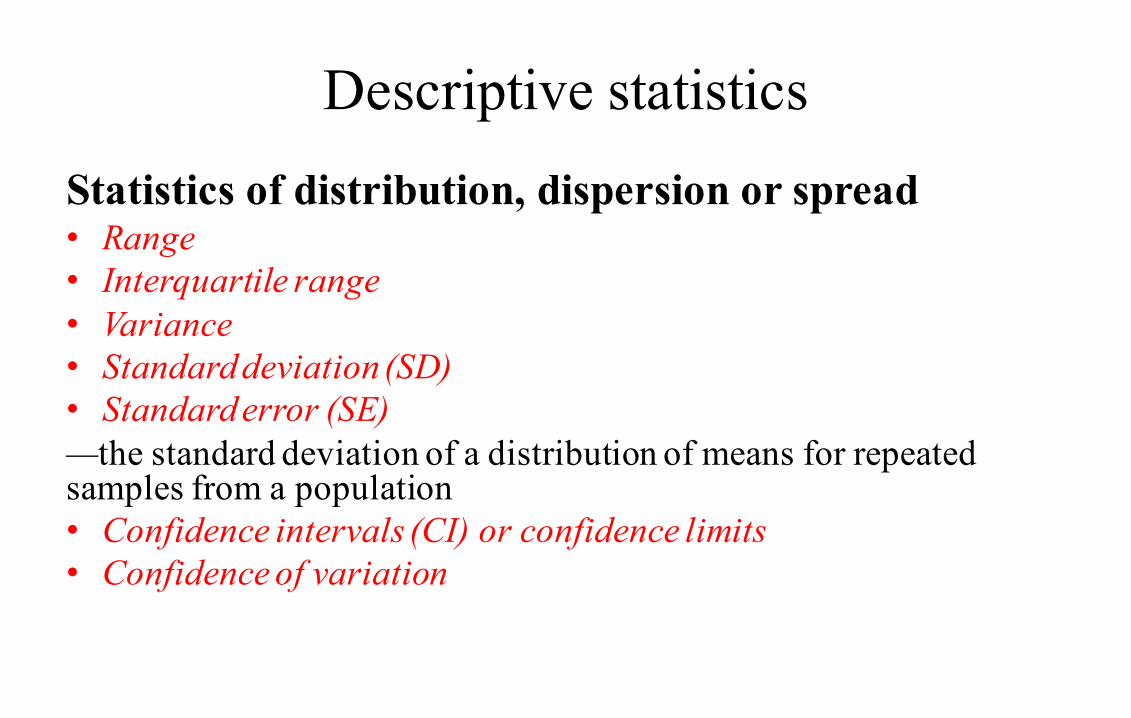
Descriptive statisticsStatistics of distribution, dispersion or spread• Range• Interquartile range• Variance• Standard deviation (SD)• Standard error (SE)—the standard deviation of a distribution of means for repeated samples from a population• Confidence intervals (CI) or confidence limits• Confidence of variation

Displaying data
A single variable• Summarizing—Box and whisker box (box plot)• Showing the distribution—Bar chart: for discrete data—Histogram: for continuous data—Pie char: for categorical data or attribute data

Displaying dataTwo or more variables• Summarizing—Box and whisker plots (box plots)—Error bars and confidence intervals• Comparing two variables—Scatterplots—Multiple scatterplots—Trends, predictions and time series
Lines, fitted lines, confidence intervals
• Comparing more variables—Three-dimensional scatterplots—Multiple fitted lines—surfaces

Tests to look at difference
1 Do frequency distribution differ?1.1 Does one observed set of frequencies differ from another?G-testWhere you have observed frequencies of various categories and expected proportions for those categories that were not derived from the data.
Chi-square goodness of fitWhether the observed and expected frequencies are not different from each other.

Tests to look at difference
1 Do frequency distribution differ?1.2 Do the observed frequencies conform to a standard distribution?Kolmogorov-Smirnov test• Continuous data• To compare two sets of data to determine whether they come from the
same distribution• R code: ks.test()
The k-s test delivers a probability that two distributions are the same while the t-test is is concerned with means and the Mann-Whitney U test with medians. Two distributions may have identical means and medians and yet have differences elsewhere in their distributions.

Tests to look at difference
2. Do the observations from two groups differ?
Data form Distribution Methods Non-or Parameter testPaired data Continuous Normal
Equal var.Paired t-testt.Test(x1,X2, paired=T)
Parameter test
Continuous Unknown Wilcoxon signed ranks testWilcox.test(x1,x2,paired=T)
Non-parameter test
All All Sign testUnpaired data
Continuous Normal Equal var.
t-testt.Test(x1,x2, paired=F)
Parameter test
Continuous NormalEqual var.
One-way ANOVAsummary(aov(x~factor))
Parameter test
Continuous Unknown Mann-Whitney U test(Wilcoxon rank sum test )wilcox.test(x1,x2)
Non-parameter test
Tests to look at difference3. Do the observations from more than two groups differ?
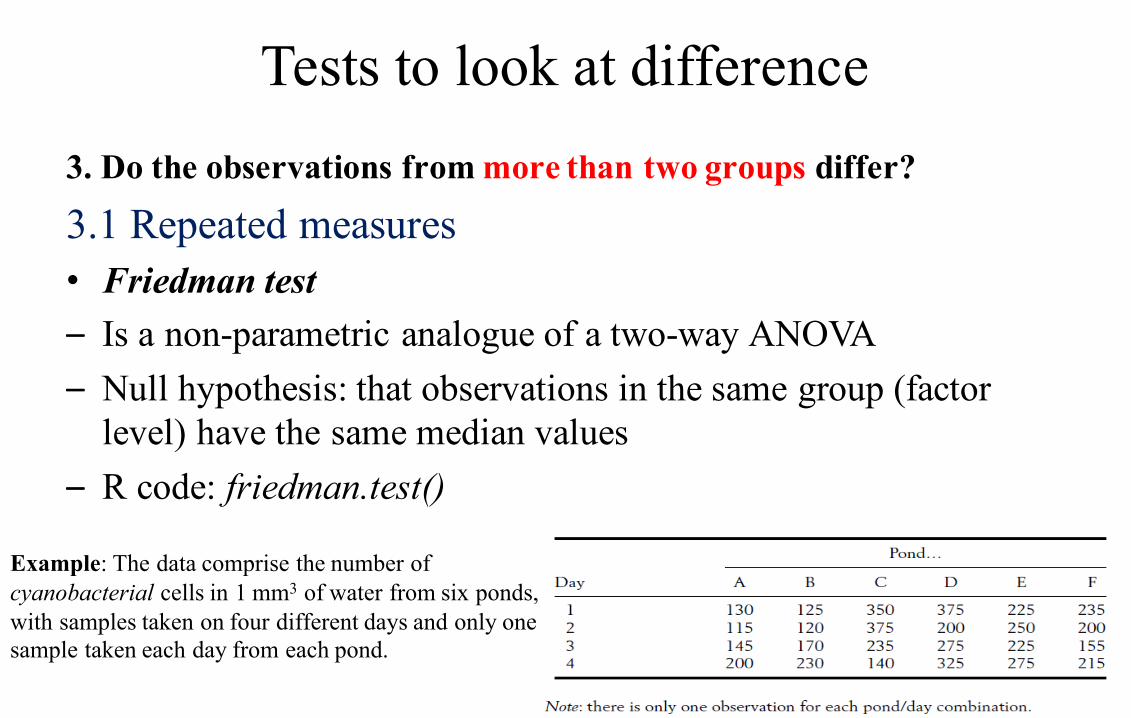
3.1 Repeated measures• Friedman test– Is a non-parametric analogue of a two-way ANOVA– Null hypothesis: that observations in the same group (factor
level) have the same median values– R code: friedman.test()
Example: The data comprise the number of cyanobacterial cells in 1 mm3 of water from six ponds, with samples taken on four different days and only one sample taken each day from each pond.

Tests to look at difference
3. Do the observations from more than two groups differ?
3.1 Repeated measures• Repeated-measure ANOVA– Unlike ANOVA, which makes the assumption that each of the
factor levels is independent of all others– R code: summary(aov(cells~pond*day+Error(cells/(pond*day))))

3 Do the observations from more than two groups differ?3.2 Independent samples• One-way ANOVA– Data: continuous, normally, equal variance– Null hypothesis: same mean– R code
> summary(aov(y~as.factor(x)))
A significant result in the ANOVA will only show that at least one pair of the groups is significantly different.
> TukeyHSD(aov(y~as.factor(x))) #### Post hoc testing
Tests to look at difference

Tests to look at difference3. Do the observations from more than two groups differ?3.2 Independent samples• Kruskal-Wallis test– Data: un-continuous, un-normally, un-equal variance– Non-parametric equivalent of the one-way ANOVA– Null hypothesis: all samples are taken form populations with the same
median– R code
> kruskal.test(y~as.factor(x))
Post hoc testing: This test may be used when there are only two samples, but the Mann-Whitney U test is more powerful for two samples and should be preferred.

Tests to look at difference
4 Two independent ways of classifying the data4.1 One observation for each factor combination (no replication)• Friedman test– non-parametric analogue of a two-way ANOVA– a single observation for each factor combination– null hypotheses: the median values of each factor level are the same
between columns and between rows– R code: friedman.test()

Tests to look at difference
4 Two independent ways of classifying the data4.1 One observation for each factor combination (no replication)• Two-way ANOVA (without replication)
– Data: continuous, approximately normally distributed, same variance in each factor combination
– R code: summary(aov(Yield~Farm*Blend-Farm:Blend) )

Tests to look at difference4 Two independent ways of classifying the data4.2 More than one observation for each factor combination (with replication)• (1) that all levels of the first factor have the same mean;• (2) that all levels of the second factor have the same mean
– one-way ANOVA analyses• (3) that there is no interaction between the two factors
– two-way ANOVA and Scheirer–Ray–Hare test

• Interaction • If the test gives a significant result for the interaction term it shows that the
effects of the two factors in the test are not additive, which means that groups of observations assigned to levels of factor 1 do not respond in the same way to those assigned to factor 2.
• R code: – interaction.plot(Farm,Blend,Yield)– interaction.plot(Blend,Farm,Yield)

Tests to look at difference
• two-way ANOVA
interaction.plot(sex,day,intake)
This means that the two sexes are not responding to day length in the same way.
Tests to look at difference
• Scheirer–Ray–Hare test• non-parametric equivalent of a two-way ANOVA with replication• conservative and has much lower power than the parametric ANOVA• If you do use it you do so with some caution and perhaps consider a
generalized linear model with an error structure that doesn’t require normal errors
Tests to look at difference
5 More than two independent ways of classifying the data• Multifactorial testing• the factors are all fully independent of each other, then
the data are suitable for multifactorial testing

Tests to look at difference
• Three-way ANOVA (without replication)• R code:
summary(aov(intake~sex*day*region-sex:day:region))
• Three-way ANOVA (with replication)
R code:model< (aov(grass~exclosure*distance*site))summary(model)TukeyHSD(model, “exclosure”)
Tests to look at difference
• Multi-way ANOVAIf there are more than three ways of dividing the data into groups and each of the classifications is independent of the others then ANOVA may be carried out.
Not all classifications are independentüNon-independent factorsüNested factorsüRandom or fixed factors
Tests to look at difference
• Nested or hierarchical designsTwo-level nested-design ANOVAR code: summary(aov(cholest~intake/cage)) ####’/’ indicate that a factor is nested in another, ‘aov(data~A/B)’ indicates that factor ‘B’ is nested in factor ‘A’.

Tests to look at relationships
Correlation or association between two variablesAre the observations for two categorical variable associated?• Chi-square test of association• Phi coefficient• Cramer coefficient

Tests to look at relationships
• Chi-square test of associationNull hypothesis: the categories in the two variables are independent• For example: if ‘eye color’ and ‘sex’ are the two variables and individuals are assigned to
either ‘blue’ or ‘brown’ and to either ‘male’ or ‘female’ then the null hypothesis is that there is no association between sex and eye color.
Data: frequencies (number of observations), never be carried out on percentages or data transformed in any way
R code: Stream=matrix(c(10,2,8,6,2,10,7,5),nrow=2)chisq.test(stream)
Categorical variable

Tests to look at relationships
• Cramér coefficient of associationü a test carried out on tables of frequencies in conjunction with a chi-square
test that provides additional information about the strength of the association
ü The statistic X2 is used to determine significance while the Cramércoefficient (C) is a measure from 0 (no association) to 1 (perfect association) that is independent of the sample size
• Phi coefficient of associationü This is a special case of the Cramér coefficient for 2×2 tables (i.e. there
are only two categories for each of the two variables)
Categorical variable

Tests to look at relationships
Observations assigned a value• Pearson’s product-moment correlation• Spearman’s rank-order correlation• Kendall rank-order correlation• Regression
Tests to look at relationshipsPearson’s product-moment correlation• Data: Continuous scale, Normally distributed • R code: cor(); cor.test()Spearman’s rank-order correlationKendall rank-order correlation• Data: non-parametric• R code: cor(, method=“spearman”) ####method=“k”cor.test (, method=“spearman”)

Tests to look at relationships
• Regression
Linear regression, kendall robust line-fit method, logistic regression, model II regression, polynomial regression

Tests to look at relationships
More than two variables• Correlation• Partial correlation• Kendall partial rank-order correlation
• Regression• Analysis of covariance (ANCOVA)Summary(aov(BMP~Species+Temp)) or summary.aov(lm(BMP~Species+Temp))• Multiple regression• Stepwise regression• Path analysis
GLM and GLMM
GLM: Generalized linear modelsGLMM: Generalized linear mixed models• extend the linear-model framework to include dependent variables that are
decidedly non-normal
• Logistic regression: the dependent variable is categorical• Poisson regression: where the dependent variable is a count
variable
Tests for data exploration
• Principle component analysis (PCA) and factor analysis• Canonical variate analysis• Discriminant function analysis• Multivariate analysis of variance (MANOVA)• Multivariate analysis of covariance (MANCOVA)• Cluster analysis• DCA and TWINSPAN

Reference• Dytham C., Choosing and Using Statistics:
A Biologist’s Guide• Gardener M., Community Ecology:
Analytical Methods Using R and Execl• 汤银才, R语言与统计分析