choosing a big data technology stack for digital marketing · choosing a big data technology stack...
TRANSCRIPT

White PaperIBM Software Information Management
Contents
2 Digital marketing, analytics and the big data world
2 The challenge of choosing the right technology stack
5 Challenges of digital analytics
7 Key decision vectors
10 Common digital marketing use cases
14 A decision framework
14 Conclusion
14 For more information
Choosing a big data technology stack for digital marketing
Executive summaryDigital data is one of the paradigm cases of big data. The needs of digital marketing are one of the main drivers of new digital data management platforms at the enterprise level. Digital sources like websites, display data, and mobile applications create very large quantities of data. Some channels, like social media, go one better by churning out large quantities of fundamentally unstructured data.
At the same time, these data sources represent the new gold standard of digital marketing. Nearly all of the pertinent and observable marketing behavior of today’s customers is online. Traditional well-analyzed channels like direct mail and outbound calling are out-of-date. Consumers don’t respond to calls or direct mail at the rates they used to. Instead, they are rapidly transitioning to online communication.
The need to mine and understand digital data is critical and widely accepted among organizations, but it is a difficult process. The reasons for this include challenges around data volumes, integration, extract, transform and load (ETL), analysis and the wide array of possible technology solutions to choose from.

White PaperIBM Software Information Management
2
Objectives of this white paper
1. Look at the reasons why analyzing digital data is challenging.
2. Show why some of the attributes of a new generation of big data systems are responsive to these challenges.
3. Use this to develop a set of key decision vectors for choosing an appropriate digital technology stack for your data.
4. Lay out a series of the most common digital marketing data use cases and highlight the key decision factors for each.
5. Discuss the decision framework as it pertains to big data
The goal of all this is to provide today’s enterprise marketing and IT organizations with a well-defined framework for choosing a marketing digital technology stack.
Digital marketing, analytics and the big data worldThe challenges of digital marketing and the needs of the digital marketer are many and varied. Accurate campaign attribution, meaningful reporting on website performance, and customer personalization and targeting are a few of the most common and pressing measurement challenges. A connection between these challenges is the need for access to digital data at a detailed by-customer level for integration, segmentation, reporting, and analysis.
This common need has fueled a revolution in the digital analytics technology stack. The need for direct access to the data has driven many organizations to digital analytics warehouses. The sheer volume of digital data (and some of its unique characteristics) has driven many organizations from warehouses based on traditional relational database management systems to high-performance alternatives.
The move from cube-based software-as-a-service (SaaS) tools to dedicated high-performance big data platforms that run on-premise or in the cloud demands a whole new level of organizational commitment, expertise, and effort.
Therefore, choosing the right technology stack is critical. And with a whole range of high-performance alternatives to choose from, figuring out the right technology to invest in can be daunting.
The challenge of choosing the right technology stackChoosing the right technology stack for digital marketing is no different than for any other type of application. Find the solution that maps most economically and efficiently to your particular problem set. This means implementing a technology that can solve the core business problems, can be maintained and supported efficiently, and minimizes your total cost of ownership (TCO) and technology risk while maximizing your opportunities for success.
The challenges of digital data are diverse. Some are common to many other types of data processing and data management. Some are fairly unique. The following sections layout the key considerations for determining the right technology stack as it pertains to your digital marketing analysis needs.
Big data—a challenge turned opportunityOne of the biggest challenges to handling digital marketing data is the massive volume of information, or “big data.” Today’s websites routinely spin-off many hundreds of millions of records. The most common data source for web behavioral data is a data feed from a web analytics tool. That data feed typically has between 300-400 fields per record (with each record being equivalent to a page view). Typical row sizes range from a thousand characters to as much as 3-4 thousand characters per row. Multiply by millions of sessions across millions of audience members, and it adds up quickly.
White PaperIBM Software Information Management
3
Sheer size of data isn’t always the only driver of “big data” problems but it’s almost always a contributing factor. A huge number of rows makes every challenge more difficult. IT organizations frequently deal with situations in which it takes more than 24 hours to load a day’s worth of data.
While the sheer size of data as represented by the number of bytes it consumes is definitely a part of the equation, the amount of data is not the only factor included in the concept of big data. For certain types of applications, you can scale very large amounts of data on a traditional relational platform. However, it’s possible to “break” those platforms with relatively small amounts of digital data.
The traditional response to huge quantities of data is straightforward and effective — aggregation. Aggregating data effectively results in the ability to reduce huge tables to very manageable proportions that still represent most of the meaning in the underlying data set. This is a particularly effective technique for reporting. However, some data sets aggregate very well and others don’t. What about digital data?
Cardinality as a key factor in aggregationOne of the key factors controlling the effectiveness of aggregation techniques is cardinality. Cardinality is how many distinct values exist for a variable. Consider a field like “gender.” You might have a billion customer rows, but with only two distinct values, it’s easy to aggregate. This is also the case when you need to cross the field with other values for reporting purposes. Suppose, for example, you wanted to report on gender by age, by customer segment, and by income bracket. You might have two combinations by six combinations by eight combinations by six combinations: fewer than 600 data points to represent a four-way cross-tabulation.
Unfortunately, many of the core fields in web analytics have very high cardinality. Fields such as page name, internal and external search term, and referring site typically have cardinalities in the six or seven figures. When you try to
aggregate data with high-cardinality, it often creates data cubes that are as large (or even larger) than the underlying data. This puts an enormous burden on underlying data platforms in terms of how they process, plan and manage this rapid explosion of data.
Lack of meaning in key metrics and aggregationsProblems in cardinality are not unknown to digital reporting and analysis. There are disciplines with even more challenging types of variables. However, digital data from a marketing perspective does present one fairly unique challenge when it comes to aggregation for reporting: the most simple digital metrics have no meaning.
For example, unlike demographic variables, knowing that a visitor viewed a page, opened a mobile application, or exited a page, is not very informative. Worse, most web metrics don’t aggregate in an interesting fashion. It’s less informative to know that a visitor had five page views than that they viewed a specific page. Standard web metric aggregations of pages, visits, and time capture total behavior but they remove the important details.
For most digital channels, the key to important detail is in the relationship of events: a visitor viewing certain pages or a series of actions performed after viewing a particular site. This type of analysis, looking at a sequence of events in a stream, defeats easy aggregations. It also defeats the very advanced “pathing” visualizations in the most sophisticated web analytics tools.
The fact that meaning in digital resides in “streams” has profound implications for digital big data analysis technology stacks.
Cube-based aggregation is mostly used for reporting, not analysis. So high-cardinality and lack of meaning and aggregation for key metrics in digital marketing can be a challenge when it comes to digital reporting, but do not necessarily impact the problems around customer analytics. Analytics has its own challenges.

White PaperIBM Software Information Management
4
Need for deeper analytics beyond just reportingCube-based data aggregation led to the dramatic growth of traditional business intelligence (BI) tools. These tools provided multi-dimensional cross-tabulation and visualization of data. It was an incredibly effective paradigm for a wide range of problems: from financial analysis to traditional marketing. The dramatic success of BI led to the sense that it could solve any type of problem. It seemed to provide such rich access to the data that any problem could be tackled. Unfortunately, when you cross-tabulate large numbers of variables, you cannot see everything, because at the customer level, cardinality defeats human visualization. When you start with a cross-tabulation of a million customer rows, no matter how simple the second variable is, you have lost the human ability to visualize the data. It is hard enough getting to the second page of Google Search results, much less scrolling through a million rows.
In reporting, this isn’t a problem. You don’t need to see all that detail. But in analytics, it isn’t enough to know how many of your visitors are male or female. You need to know that fact in conjunction with a range of other variables for each specific individual.
So the problem isn’t just one of human visualization. Most analysis techniques for digital marketing turn out to require special, highly customized views of the data that nearly always involve re-aggregating from the detail level in entirely custom ways.
How many customers from two months ago are viewing more web pages this month than they did last month? The answer to this question is surprisingly tricky to capture in an aggregation. Worse, an aggregation is affected when either of the dimensions is shifted. Change the variable “month” to “week,” or “pages” to “content pages,” or “coming from search” and you need a new custom aggregation.
To try to build a regression model of what variables drive increasing or decreasing consumption of a particular type of page, you need to build an aggregation for each customer that captures their individual viewing trend for the specific content along with a range of potentially interesting variables.
For digital marketing, when you start with the customer as your unit of analysis, then every type of analysis you are interested in — from time series to predictive modeling to clustering — will require deep, algorithmic access to the detailed level beneath “customer.”
The difference between an analytics data mart and a reporting data mart is profound. The tools are different, but even more fundamental, is the difference in data access strategies. Analysis resists static aggregations — reporting often demands them.
Flexible access and lack of requirementsThe impact of eliminating static aggregations on the technology stack can hardly be over-estimated. It isn’t just static aggregation that is problematic for analysis; it’s static access paths to data. A huge amount of effort in a traditional relational database is geared toward optimizing common access paths to the data.
In a way, the techniques for optimizing access paths are directly related to techniques for aggregation. The goal of a good database designer is to create aggregations and relationships in the data that optimize common queries or transactions. The effort to create and maintain these optimization paths typically consumes a flat majority of the cycles devoted to a database platform.
In an analytics environment, however, it’s much harder, perhaps impossible, to standardize access paths. This puts a premium on a platform that can access data without pre-optimization.

White PaperIBM Software Information Management
5
Challenges of digital analytics The pressure that analytics environments put on a database platform both in terms of detail level data and flexible access paths is well understood. The next section addresses an issue that is less well known, uniquely characteristic of digital analytics data and is a problem regardless of whether your focus is on analytics or reporting.
Streaming nature of the dataIn the evolution of big data problems, it is clear that one of the important differentiation points has been a movement from aggregations of data to detail level data. You get more data, but you also change many of the ways you integrate, study and report on the data. These changes often have a bigger impact on the technology stack than the simple expansion in the amount of data to process.
One change, in particular, is important to understand because of its profound impact on ETL, joining and reporting. When you move from aggregate data to detail level data, you often move from a world in which each record is a discrete entity to a world in which meaning is only captured by “streams” of data.
Streams are challenging for a host of reasons. Most traditional analysis and ETL tools are heavily geared toward row-based work. For example, a customer record is analyzed against other customer records with all customer details captured in a single row. In ETL processing, adding fields, deleting fields or fixing fields is usually done on a row-by-row basis. When joining data sources, the most common type of join is an equijoin with a record from source X and a matching record from source Y. And as long as there is a key, you can join the two records together to form a new combined row.
None of this is applicable when your data must be analyzed in multi-row sections. Streams change aggregation strategies, ETL strategies and join strategies.
The fact of streams means that almost all analysis requires significant pre-aggregation on individual detail records to work. Traditional statistical analysis tools and techniques work best on row-based data. Today’s data analysts are used to aggregating data for an analysis, but it’s very hard to do simple but effective digital aggregation. Instead, the stream sequence has to be parsed — often with complex pattern-matching or sequencing techniques.
This is critically important when it comes to thinking about the right technology stack for digital marketing.
Difficulties in joining streamsThere is another aspect to streams that has deep implications. Digital marketing analytics enables a complete customer level view across all channels. The basics of achieving this are hard enough — bringing all the various digital channels together and creating join keys between each source is, itself, a large task.
Traditional join strategies used a common key in each data source (such as a Customer ID) to join rows together. The most common join strategy is typically a one-to-one equijoin where data about the customer from one source (such as a household demographic file) with data from another source (such as a customer relationship file).
Cust ID: 123 Gender: M Age: 30-40 Cust ID: 123 Account: Gold
Cust ID: 124 Gender: M Age: 30-40 Cust ID: 124 Account: Silver
Cust ID: 125 Gender: M Age: 30-40
Cust ID: 126 Gender: M Age: 30-40 Cust ID: 126 Account: Gold
Cust ID: 127 Gender: M Age: 30-40
Cust ID: 128 Gender: M Age: 30-40 Cust ID: 128 Account: Core
Figure 1: One-to-one equijoin

White PaperIBM Software Information Management
6
This produces a clean record whereby the Gender, Age and Account are all grouped together for each Customer ID.
Almost as common are joins like the one below where a customer file is joined on zip code to a postal file with geo-demographic data like average household size:
One strategy is to union (interleave) the data by Visitor ID and Time. However, this does not enable joining of records — you are simply combining two different data sets together, sorted by time. Every record will be either a web analytics record or a mobile application record, and all the applicable analysis will still exist at the stream or “chunk” level. And by interleaving two fundamentally different data sources, you’ve made analysis of the total nearly impossible since each will require complex, separate aggregation.
Similar problems plague ETL on digital sources since nearly all the interesting data preparation is at the visit or visitor level — almost never at the page level. Traditional ETL tools are used to process files row by row. But with analytics data, you need to hold tens or hundreds of thousands of rows in memory while you wait for a visit session to end (there is no visit end record — you have to hold every single visit in memory until 30 minutes have elapsed since the last record processed). Then you need to do a set of complex aggregations and calculations to figure out what the most viewed content was, how many milestones were reached, the type of visit that occurred and whether or not it’s a failure. This is not within the realm of traditional ETL.
Another option for ETL is to load all your data and then transform it. ELT strategies are common in digital analytics. Unfortunately, not only does this often place an extraordinary data processing burden on the system, it turns out that traditional relational databases and the SQL programming language does not handle this form of transformation well.
The bottom line is that digital data presents multi-faceted challenges that go beyond the sheer volume of data generated. The ubiquity of stream-based data in digital marketing makes joining separate data sources in the traditional manner useless or impossible. The necessity to create aggregations of the streams using ETL tools or database tools presents similar challenges; challenges that are not well handled in the traditional relational world.
Cust ID: 123 Gender: M Zip: 12345 Zip: 12345 Avg: HH: 3.5
Cust ID: 124 Gender: M Zip: 12345 Zip: 12345 Avg: HH: 3.5
Cust ID: 125 Gender: M Zip: 56789 Zip: 56789 Avg: HH: 2.6
Cust ID: 126 Gender: M Zip: 56789 Zip: 56789 Avg: HH: 2.6
Cust ID: 127 Gender: M Zip: 34567 Zip: 34567 Avg: HH: 2.4
Cust ID: 128 Gender: M Zip: 12345 Zip: 12345 Avg: HH: 3.5
Figure 2: Customer file joined on Zip to Avg. HH
Each census (Zip) record might be matched to many customer records. But the unit of analysis remains the customer record which now has all of the geo-demographic records attached.
However, in digital marketing, joining web analytics and mobile application data might yield the following results:
Visitor: 123 Time: 9:30 Page: X1 Visitor: 123 App Start: 9:50
Visitor: 123 Time: 9:32 Page: Y1 Visitor: 123 App Mile1: 9:59
Visitor: 123 Time: 9:36 Page: X1 Visitor: 123 App Start: 13:50
Visitor: 124 Time: 9:32 Page: Y1 Visitor: 123 App Start: 17:50
Visitor: 124 Time: 9:33 Page: Z2 Visitor: 125 App Start: 9:01
Visitor: 125 Time: 9:35 Page: X1 Visitor: 125 App Start: 9:28
Figure 3: Digital web analytics and mobile application data join

White PaperIBM Software Information Management
7
Key decision vectorsThere are many factors that drive a decision toward the selection of a technology stack. Cost and performance are obvious considerations for digital marketing analytics. The following short sections outline a series of additional factors that are important criteria to consider for digital analytics and measurement.
Handling huge data volumesThe technologies needed to handle digital big data have developed with extraordinary rapidity. The core challenge — data volume — has been attacked from a multitude of directions. The cost of hardware has fallen dramatically, especially commodity hardware. The ability to string together a large number of processors has enabled systems to deliver powerful performance. But to achieve that performance requires that software be able to break up jobs into discrete tasks that can be distributed across the hardware efficiently — a concept known in computer science as “parallel processing.” Not every job can be tackled in this manner.
Dramatic improvements in the ability to scan very large files, along with the many of the unique requirements discussed pertaining to detail data (not just digital data), have led to a convergence on a common solution. That solution is to routinely pass the entire detail file in response to queries. This is the strategy that most relational database systems try to avoid. But in a system optimized for the task, passing the entire detail file solves a number of challenges simultaneously:
• It makes parallelism easy• It removes any need to pre-design access paths or
aggregations• It removes any cardinality issues • It supports both reporting and analytic workloads
Given this, it is logical that systems focusing on this strategy seem ideal candidates for digital big data. When you look at the series of challenges that digital measurement presents, a number of them are directly addressed by a solution that focuses on achieving very fast access to the entire detail file.
Minimize data modelingTraditional database systems relied on careful analysis of common access paths and applications to create structures that maximized data access. Since creating data access paths requires additional data and overhead in the processing of data, there is always a fine balance between how much pre-structure is ideal.
This process of optimizing access paths is time-consuming and expensive. Optimization is only going to work in cases where a relatively small number of access paths are used frequently, which works for many types of business purposes. However, this is not the case for most analytic environments. Analysis problems need data structured differently in almost every single case.
Because of this, the more analytic a task and the less well-defined its scope, the more important it is to minimize the amount of data modeling required to achieve acceptable performance. Ideally, the less structure required in a system, the better it is for the enterprise.
Easy data integrationAlmost every digital application will involve significant integration of data sources. And almost every system will let you store multiple data sources. So when it comes to integration, what are the real differentiating factors?
This is not a simple question to answer, but the following are factors to consider when evaluating solutions from a data integration perspective:
• Query tools or languages (such as SQL) that support natural joins
• Rich support for data transformation within the system• Flexible data model or unstructured access to all data• Support for algorithmic data transformation• Built-in support for common data access mechanisms
(such as ODBC)• Robust programmatic API for both loading and
exporting data • Ability to augment SQL with procedural capabilities to
parse files that contain encoded strings

White PaperIBM Software Information Management
8
With digital integrations, the complexity of stream-based joins for integration should always be kept in mind. Having two data sources on the same platform with a key to join does not necessarily make them integrated.
Support for integrated marketing solutionsOne of the biggest goals driving the adoption of digital analytics warehousing is a desire to utilize the data more effectively. Analysis and reporting may be the starting point for effective use, but applying the data to drive customer conversations requires significant outbound integration. You have to be able to take what you’ve learned about customers and drive that knowledge to your digital marketing systems: from site testing engines to email campaign management systems to CRM and marketing automation systems.
Outbound integration may seem straightforward, but a surprising number of systems turn out to be data sinks. They are effective at taking data in, but rather ineffective at pushing it back out. Most of the requirements listed in the data integration section above apply equally to outbound integration.
Tight integration with your key digital marketing systems is a huge plus.
Support BI toolsBusiness intelligence (BI) tools have evolved into large, complex web-based reporting, data exploration and analysis tools with capabilities that often go well beyond basic dimensional reporting. Not only do these tools often deliver significantly more customization and data analytics capabilities than any of the traditional digital data analytics packages, they also provide much broader data access paths and are designed specifically to work with a very broad range of today’s information sources and data management platforms.
The stream structure of digital data and the lack of standard data management platforms have largely prevented efforts to use BI tools in digital measurement. With proper segmentation and processing, digital data can be effectively aggregated up to levels where traditional BI tools can take very effective advantage of it. If your big data platform supports these tools, you have a range of data surfacing options available to you that are nearly impossible to otherwise duplicate.
Data surfacing is one of the biggest challenges with enterprise big data solutions. They tend to work better for analysts than users. Support for BI tools is one of the strongest paths for solving the data surfacing challenge.
Support for advanced analyticsMost enterprise-class organizations have a significant in-house statistical analysis capability invested in tools like SPSS and SAS. These are powerful tools that provide a host of built-in statistical analysis and modeling capabilities critical for taking full advantage of any complex data set. These tools often provide significant data transformation capabilities as well since nearly all analysis requires significant pre-processing of the data. This is a critically important factor to keep in mind since enterprises must balance the data transformation inside a statistics tool with the capabilities outside the tool.
Digital analytics presents several key challenges to statistical analysis. First, there is the volume of data and the challenges of sampling — particularly in a complex integration environment. Statistical analysis procedures are often very processor intensive and cannot always be parallelized effectively. Native support for complex statistical analysis in the architecture can make a huge difference. Second, because of the nature of digital data, a great deal of analysis will probably involve either algorithmic techniques or complex algorithmic ETL prior to the analysis. This increases the amount of team expertise required as well as the requirements on the technology stack.

White PaperIBM Software Information Management
9
Expertise availableThere are large concentrations of expertise around many key data technologies. SQL happens to be one of the single most widely known and understood programming languages in the world. That’s more important than ever in digital marketing, where algorithmic access to the data is often critical for useful understanding. Some new technologies don’t support SQL or don’t support it very well. For others, it’s the primary access method for all data access.
SQL is not the only factor where existing expertise might be put at risk by choice of technology stack. The platform and the DBA type roles associated with it are other considerations where significant amounts of in-house expertise may or may not be appropriate depending on the technology stack you choose.
Statistical analysis tools and BI tools are also potentially at stake. Some big data platforms are very open and support a wide variety of tools. Others push you into an export model for any type of integration. Still others are limited to vendor-specific tool sets.
Demanding new expertise might not be a gating factor on a big data decision, but it would be a big mistake not to factor it in. For some new big data technologies, finding any expertise is a problem. So technologies or applications that demand new or rare expertise are always riskier and more expensive than technologies where in-house expertise is available or resources are easily obtained.
Support procedural/algorithmic queriesOne of the little understood aspects to digital data is the implication of its stream basis for many types of common data management and statistical analysis tasks. While the demands for procedural language access are hardly unique to digital ETL and analytics, the need for constantly working with streams of data as the unit of analysis makes the demand for complex procedural ETL and algorithmic analytics much higher in digital marketing than in many traditional business disciplines. This presents a challenge to those who are initially trying to work with digital data.
While most data management platforms support some form of procedural language, the nature and degree of that support vary widely. Languages like C++, C#, Ruby, Pig, Python and Java are useful when appropriately applied, but organizations may have strong preferences in terms of culture and expertise that would importantly influence a strategic platform and language decision.
Real-time analysisReal-time analytics and decisioning comprise one of the most challenging requirements for any technology stack. To support real time places strong demands on data collection, integration, analytics and decisioning, and, of course, organizational expertise. However, the appeal of real time is strong and growing stronger. The biggest opportunity you have with customers is while they are in conversation with you; whether online, in an application, or on a call.
To take effective advantage of real time, the following actions are important:
1. Integrate your existing customer data with immediate channel behavior.
2. Decide almost instantaneously how the two fit together. 3. Communicate that decision to the channel content
infrastructure. And ensure the infrastructure can act upon it.
Even real-time reporting, which cuts off several of the above requirements, is challenging (it also offers fewer upside benefits to most organizations).
One of the key points to understand about real time is that it’s not well supported by a technology stack that pushes all analytics down to full passes of the detail data. Nor is it easily parallelized. In fact, real time is closer to a traditional transactional system than it is to big data analytics. The most common technology stack approach to real time has been to move as much as possible of the database and its work in-memory. This enables extremely fast joins of information as well as the use of complex event processing models to work on individual customer data streams.

White PaperIBM Software Information Management
10
Common digital marketing use casesThere is no one “right” solution pertaining to the best technology stack in digital marketing. It depends on the specific applications being used for the data. The following sections cover some of the most common target applications for a digital analytics technology stack and outline the most important factors in the technology stack necessary for their support.
Advanced web analyticsMoving your data into an analytics data mart opens up vast new analytics opportunities. With access to detail and customer level data, you can study attrition and retention, track individual accounts and customers in their velocity of usage and operational performance, create data-driven marketing segmentations to drive outbound and site messaging, and perform full attribution analysis against every trackable touchpoint.
The primary challenges to the technology stack from advanced web analytics include the need to minimize data modeling (nearly all analysis is ad hoc), provide easy integration of data, support statistical analysis tools, and allow for algorithmic access to the data.
Customer personalizationOne of today’s digital key points is the idea of tracking the “full customer journey,” or personalization in messaging. To track and optimize the customer journey inevitably puts a premium on data integration — particularly the integration of streams. It is a problem that begins with the obvious requirement to meld together multiple data sources.
Unlike advanced analytics, however, tracking the full customer journey is not best done at the detail level. With different streams of data from multiple sources, it’s imperative to model the data before trying to analyze it. It is just too hard to formulate analytic queries when you have data from six different sources in six different formats. This also implies that minimizing data modeling, important for most advanced analytics, is not such a big issue when you are forced to integrate multiple data streams. You really have to model your data sources to join and use them effectively.
Minimize administrative overhead and costsIn some ways, this is all about selecting the right technology stack for your specific needs. For example, when you need extreme high-availability, you should expect to live with a higher level of system complexity and overhead. Among the common digital marketing tasks, the most demanding is probably real-time decisioning. But there are often very strong production requirements around automated enterprise reporting as well. On the other hand, analytics uses often require many fewer users, less concern for point-failure, and less need to provide redundant capabilities or fallbacks.
Uptime and load without disruptionIT organization’s struggle with situations where it takes longer than a day to load a day’s worth of data. With digital marketing’s massive data volumes, sheer loading speed is one very important aspect of system performance. Bulk load performance is not the only consideration, however. For many systems, the ability to support robust usage while loading data is critical. For organizations with continuous streams of real-time data, global user-bases, or very large batch loads, load without disruption is a critical capability.
Another aspect to load performance is ETL performance. Many data systems these days are built with extensive ETL in mind — often necessitating separate systems for this function. One huge advantage to this approach is that you no longer have to be concerned about load without disruption. On the other hand, the addition of an ETL layer can add significant latency between collection and availability.
White PaperIBM Software Information Management
11
Advertising analytics and attribution modelingWith the ongoing shift in advertising spending from traditional to digital channels, it has become even more important to measure digital advertising spend and effectiveness with hyper-accurate precision in near real time. Many organizations have already mastered this within each sub-channel. Unfortunately, digital channels turn out to be intertwined. It’s possible for a CMO to see reports indicating that every digital channel improved its effectiveness even as, at the enterprise level, digital marketing spend produced lessened results. The problem is that most campaign analysis occurs at the “last-click” level, effectively measuring only the most recent campaign touch prior to a conversion. This type of measurement tends to grossly overstate the effectiveness of certain channels and hide the success of others.
To combat this problem, organizations have focused on building more sophisticated models of campaign attribution that credit campaigns according to the degree which they appear to have contributed to marketing success. The goal is to ensure that marketing never receives more than 100 percent of the credit and that allocation decisions around sub-channel spend are optimal.
Because of the potentially enormous volumes in display and social sources, attribution analysis can put more data volume pressure on a technology stack than might be assumed. Display or Facebook campaigns may involve an order or two magnitudes of impressions more than website views. Display data also presents some significant integration challenges. Providers of this data are not experts in data integration and often provide poorly documented data streams with limited keys and poor data quality. As with tracking the customer journey, this is another area where integration of streams is critically important.
Email targetingEmail continues to be an important digital out-bound channel. It is inexpensive, customizable, and effective. Email works across a wide variety of applications and uses — from prospect offers to customer communications. One of the advantages to email is that it functions much more like a traditional out-bound marketing channel (particularly direct mail) than any other type of digital channel. Models that are useful in the offline world can often be adapted to drive email targeting. Similar types of creative skills and offer experiences can apply between offline and email. Where does email challenge a technology stack? Probably the most important consideration is model creation. Particularly if you have existing models, it’s important to be able to integrate digital data into those models and re-use elements. This puts demands on both internal integration flexibility and the ability to support common stats tools.
Site personalizationThe future of digital analytics is tightly integrated with personalization. Digital channels provide unique opportunities for personalized marketing. In fact, that potential for personalization may be the most distinctive aspect of the digital channel. Yet few organizations are doing deep work on site personalization, and what is being done is largely confined to either testing solutions served by SaaS vendors or black-box recommendation engines. There are many reasons why this is not ideal. Effective personalization demands the integration of existing customer data with current behavior. SaaS tools for MVT testing are bad at both these tasks. Black-box recommendation engines tend to under-utilize business specific data and over-generalize models. So there’s a lot of room for improvement and development in this area and an analytics data mart is a potential enabler.
On the other hand, site personalization is one of the most demanding applications for your technology stack. In particular, it puts tremendous demands on real-time analysis plus the integration of existing customer data plus advanced modeling. Few technology stacks support all three of these functions very well.
White PaperIBM Software Information Management
12
Loyalty program analyticsLoyalty programs are emerging as one of the most critical aspects of digital marketing. In addition to their many obvious benefits, loyalty programs are a key driver of information gathering on an opt-in basis. They provide the one compelling reason for customers to consistently self-identify. Collection of PII information is essential to a much broader range of analytic problems — from targeting to understanding the influencer effectiveness of a digital channel on store-based shopping. So loyalty programs are a huge analytics enabler. However, loyalty programs have their own specific tracking and analytics requirements. Customer velocity, redemption patterns, retention, and market-basket analysis are all important for supporting loyalty programs.
Loyalty programs stress a technology stack around integration (including integration of streams). This is also an area where both BI tools and statistics tools will likely play a fairly large role. On the other hand, data volumes are not usually excessive and there is no requirement for real-time support.
Merchandising analyticsEcommerce sites have become very complex. Most of the merchandising work is now done on pages with many products presented (search, aisle, and category pages). This creates interactions between merchandising levers that are critical to understand. It’s no longer enough to know that placing a “discount call-out” on a product will improve its click-through. You have to know if it will reduce other product’s click-through and whether there is a point of diminishing returns where each additional call-out reduces overall effectiveness.
To support this, big data analytics systems need to be able to take in very large amounts of product impression data, join this with product meta-data and then perform complex analysis on the impact of merchandising sets. This puts multiple stress points on a technology stack including data volume, algorithmic analysis, and data integration. It may or may not require real time depending on the nature of the decisions being made.
Enterprise dashboardingOne of the most common reasons for creating an enterprise-wide analytics data mart is to support integrated enterprise dashboarding. This is the type of problem that traditional BI systems were developed to solve. But with the explosion in digital inputs to these dashboards come a host of challenging data sources ill-suited to many traditional BI tools. When you need to integrate web, mobile and social data into a dashboard that includes data from a wide range of internal systems, what are your alternatives? Web analytics tools are too siloed and have no ability to integrate back-office data. Your traditional BI systems don’t have reasonable connections into any of the digital data sources and often feel too cumbersome and restrictive to support today’s more aggressive data consumers.
This problem set has led to the growth of solutions that function as easy aggregators of multiple data sources and provide powerful reporting and visualization capabilities. These solutions typically provide some embedded data handling and management capabilities. However, where your data needs are large or require direct access to digital or social streams, these products will still have to sit on a true data management platform. Hence the drive to enterprise-wide analytics data marts that serves as intermediate collectors and aggregators of multiple data sources for use by Internet-based slice-and-dice data visualization and reporting tools.
The challenges to a technology platform presented by enterprise dashboarding are heavily focused on integration and governance.
Social media analyticsSocial media data is the ultimate trial for big data and enterprise warehousing. Unlike web or mobile data, social data is unstructured at the detail level. Its raw, text-based data must be extensively processed using completely new technologies before it can be effectively used in any traditional systems. The analysis of social media data also requires the handling of massive data volumes, and in some cases, the need for real time.
White PaperIBM Software Information Management
13
It is unclear whether or not text analytics on social data is static enough to support data modeling and fixed categorizations or whether constant re-access to the detail level data is required. The number of enterprises doing text-mining on social data is too small to provide any reliable evidence of the best path to maturity. It is clear that without dedicated text analysis software, no analyst is likely to make productive use of this data. This puts a tremendous premium on the ability of your platform to support such software.
Call avoidance and operationsCall centers are fundamental for almost every customer or client supporting enterprise. Expensive, sometimes frustrating, but filling a role in both support and conversion that simply cannot be replicated in any other channel, the call center is one of the biggest opportunities for analytic returns.
In particular, the integration of call center data with web data presents significant opportunities for improvement in both channels. Finding places where calls spill unnecessarily from the web is one of the most powerful, potentially impactful, and profitable, analysis opportunities in digital marketing. But call redirection or avoidance is not the whole story. Getting the right customers and right problems into the call center is a function of online and call center working well together and takes deep integration of the two data streams at the detail level to handle.
For the technology stack, the implications of how you tackle big data are enormous. If you go the digitalization route, then text analytics becomes the primary focus of the measurement system (via social media analytics mentioned above). If not, call center becomes a fairly straightforward row-based data source to be integrated with the digital stream.
Use cases
Advanced web analytics
Customer personalization
Advanced analytics modeling
Email targeting
Site personalization
Loyalty program analytics
Merchandising analytics
Enterprise dashboarding
Social media analytics
Call avoidance and operations
Handling huge vo
lume
Factors
Minim
ize data m
odeling
Easy data in
tegratio
n
Support BI to
ols
Support sta
ts to
ols
Real-tim
e support
Experti
se ava
ilable
Support algorit
hmic queries
Minim
ize administ
ratio
n
Uptime/lo
ad with
out disr
uption
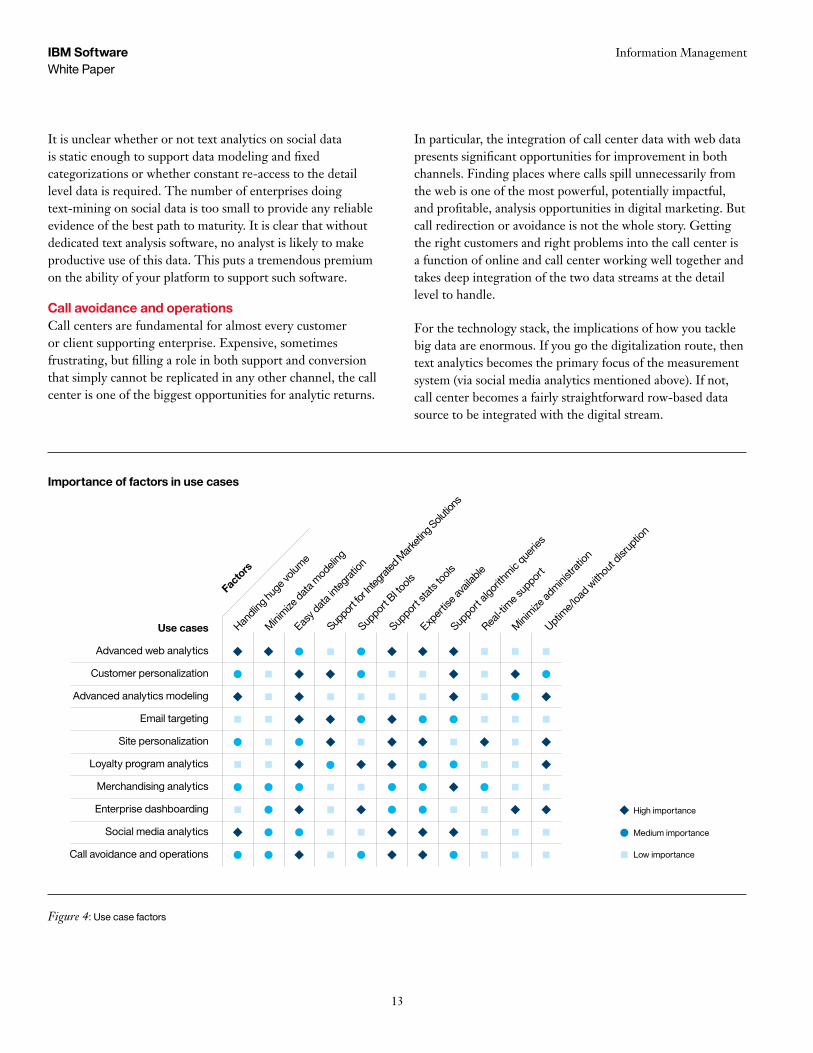
Importance of factors in use cases
Medium importance
Figure 4: Use case factors
Support for In
tegrated M
arketin
g Solutions
High importance
Low importance
White PaperIBM Software Information Management
14
A decision frameworkA decision around an appropriate big data technology stack should begin with a careful consideration of your business requirements. Even a cursory look at Figure 4 reveals how very different the demands on the technology stack are depending on the target applications. Most big data systems are designed to handle more than one type of application or opportunity. Nevertheless, the optimal technology stack for digital media analytics is highly unlikely to be the best stack for enterprise dashboarding.
By matching your requirements against the table and use cases, you should be able to get a good sense of whether you’re asking too much of a single technology stack and which types of applications fit most cleanly together. This is also a way to force an organizational prioritization of function.
ConclusionDigital marketing involves very large volumes of data, high cardinality in key variables, an increasing focus on open-ended analytics, data that is semi-structured but stream- based and, in some cases, truly unstructured streams of text data. It also involves complex joins of streams of data at the customer level.
These are serious challenges for any organization and any technology stack to address. But they are also challenges for which there are an increasing number of interesting and applicable technologies that provide the real potential for a long term solution. Finding the right solution involves more than a simple evaluation of price/performance — and not just because measuring performance is inherently ambiguous. It involves the usual work of matching business requirements to the comparative advantages of each possible solution.
To do that matching, you need to understand in some detail the actual applications and use cases within digital marketing that are at the top of your priority list. From enterprise dashboarding to site personalization to call center optimization, the challenges to the technology stack and the decision factors are very different.
Matching the key decision factors for each type of digital marketing use case to the technology solutions you’re considering, should make it easier to understand the appropriate big data technologies for your enterprise. This process should also help you understand the appropriate mix of those technologies. In addition, the mapping of application factors to technology solutions should help highlight areas where the platform is likely to struggle or presents particular risks.
For more informationTo learn more about the IBM big data platform, Netezza, Enterprise Marketing Management solutions or Semphonic, please contact your IBM representative or IBM Business Partner, or visit the following websites:
www.ibmbigdatahub.com
ibm.com/software/data/bigdata/enterprise.html
www.semphonic.com
ibm.com/software/data/netezza/overview.html
ibm.com/software/products/us/en/category/SWX00
ibm.com/marketing-solutions
Additionally, IBM Global Financing can help you acquire the software capabilities that your business needs in the most cost-effective and strategic way possible. We’ll partner with credit-qualified clients to customize a financing solution to suit your business and development goals, enable effective cash management, and improve your total cost of ownership. Fund your critical IT investment and propel your business forward with IBM Global Financing. For more information, visit ibm.com/financing.

White PaperIBM Software Information Management
15
About SemphonicSemphonic is the leading independent Web analytics and Digital Measurement consultancy in the United States. A pioneer in many of the techniques currently used in classic Web analytics,
Semphonic is also the leader in the growing practice of moving online Web analytics data into advanced data warehousing solutions. Semphonic has developed unique IP around digital data models, digital segmentation, and digital targeting that helps companies weld together the best of traditional direct response and targeted marketing disciplines with the latest digital channels. Our client-base includes an extraordinary range of Fortune 1000 companies across nearly every major vertical. Companies like American Express, Charles Schwab, The Economist, Genentech, GlaxoSmithKline, Intuit, Hearst, JPMorgan Chase, Marriott, Nike, The New York Times and Walmart rely on Semphonic for advance digital measurement and analysis.
About IBM Netezza data warehouse appliances IBM Netezza data warehouse appliances revolutionized data warehousing and advanced analytics by integrating database, server and storage into a single, easy-to-manage appliance that requires minimal set-up and ongoing administration while producing faster and more consistent analytic performance. The IBM Netezza data warehouse appliance family simplifies business analytics dramatically by consolidating all analytic activity in the appliance, right where the data resides, for industry-leading performance.
Visit www.ibmbigdatahub.com to see how our family of data warehouse appliances eliminates complexity at every step and helps you drive true business value for your organization. For the latest data warehouse and advanced analytics blogs, videos and more, please visit thinking.netezza.com.
About IBM Data Warehousing and Analytics SolutionsIBM provides the broadest and most comprehensive portfolio of data warehousing, information management and business analytic software, hardware and solutions to help customers maximize the value of their information assets and discover new insights to make better and faster decisions and optimize their business outcomes.
About the authorGary Angel, President and CTO Gary Angel is President and CTO at Semphonic. He co-founded Semphonic and under his leadership, Semphonic has become the leading independent digital measurement consultancy. Gary’s ground-breaking work in hands-on web analytics includes the development of Functionalism (Semphonic’s public-domain methodology for tactical web analysis), pioneering work in the creation of SEM analytics as a discipline, and numerous methodological improvements to the field of web analytics and the study of online behavior. Gary is the recipient of the Digital Analytics Association’s Award for Excellence as The Most Influential Industry Contributor.
About IBM Enterprise Marketing Management Integrating and streamlining all aspects of marketing, IBM’s EMM Suite empowers organizations and individuals to turn their passion for marketing into valuable customer relationships and more profitable, efficient, timely, and measurable business outcomes. The IBM EMM Suite of software solutions gives marketers the tools and insight they need to create individual customer value at every touch. To learn more about IBM Enterprise Marketing Management visit ibm.com/software/marketing-solutions.

IMW14642-USEN-00
Please Recycle
© Copyright IBM Corporation 2012
IBM Corporation Software Group Route 100 Somers, NY 10589
Produced in the United States of America September 2012
IBM, the IBM logo, ibm.com, and InfoSphere are trademarks of International Business Machines Corp., registered in many jurisdictions worldwide. Other product and service names might be trademarks of IBM or other companies. A current list of IBM trademarks is available on the web at “Copyright and trademark information” at www.ibm.com/legal/copytrade.shtml.
Netezza is a registered trademark of IBM International Group B.V., an IBM Company.
Java and all Java-based trademarks and logos are trademarks or registered trademarks of Oracle and/or its affiliates.
This document is current as of the initial date of publication and may be changed by IBM at any time. Not all offerings are available in every country in which IBM operates.
The performance data and client examples cited are presented for illustrative purposes only. Actual performance results may vary depending on specific configurations and operating conditions.
It is the user’s responsibility to evaluate and verify the operation of any other products or programs with IBM products and programs.
THE INFORMATION IN THIS DOCUMENT IS PROVIDED “AS IS” WITHOUT ANY WARRANTY, EXPRESS OR IMPLIED, INCLUDING WITHOUT ANY WARRANTIES OF MERCHANTABILITY, FITNESS FOR A PARTICULAR PURPOSE AND ANY WARRANTY OR CONDITION OF NON-INFRINGEMENT. IBM products are warranted according to the terms and conditions of the agreements under which they are provided. Semphonic web analytics and digital measurement is not an IBM product or offering. Semphonic web analytics and digital measurement is sold or licensed, as the case may be, to users under Semphonic’s terms and conditions, which are provided with the product or offering. Availability, and any and all warranties, services and support for Semphonic web analytics and digital measurement is the direct responsibility of, and is provided directly to users by Semphonics.
The client is responsible for ensuring compliance with laws and regulations applicable to it. IBM does not provide legal advice or represent or warrant that its services or products will ensure that the client is in compliance with any law or regulation.