choline requirement, distribution and concentration in
TRANSCRIPT

Louisiana State UniversityLSU Digital Commons
LSU Historical Dissertations and Theses Graduate School
1968
Choline Requirement, Distribution andConcentration in Laying Hens.James Sidney CrawfordLouisiana State University and Agricultural & Mechanical College
Follow this and additional works at: https://digitalcommons.lsu.edu/gradschool_disstheses
This Dissertation is brought to you for free and open access by the Graduate School at LSU Digital Commons. It has been accepted for inclusion inLSU Historical Dissertations and Theses by an authorized administrator of LSU Digital Commons. For more information, please [email protected].
Recommended CitationCrawford, James Sidney, "Choline Requirement, Distribution and Concentration in Laying Hens." (1968). LSU Historical Dissertationsand Theses. 1478.https://digitalcommons.lsu.edu/gradschool_disstheses/1478

This dissertation has been microfilmed exactly as received 69-4461
CRAWFORD, Jam es Sidney, 1941- CHOHNE REQUIREMENT, DISTRIBUTION AND CONCENTRATION IN LAYING HENS.
Louisiana State University and Agricultural and Mechanical College, Ph.D., 1968 Biochem istry
University Microfilms, Inc., Ann Arbor, Michigan

CHOLINE REQUIREMENT, DISTRIBUTION AND CONCENTRATION IN IAYING HENS
A Dissertation
Submitted to the Graduate Faculty o£ the Louisiana State University and
Agricultural and Mechanical College in partial fulfillment of the requirement for the degree of
Doctor of Philosophy in
The Department of Poultry Science
byJames Sidney Crawford
B.S., Northwestern State College, 1963 M.S., Louisiana State university, 1967
August, 1963

ACKNOWLEDGMENTS
The author takes this opportunity to express his sincere appreciation to Dr. A. B. Watts for making graduate work possible and for his frequent advice and counsel
The author wishes to thank Dr. R. A. Teekell for his technical advice and the giving of his time in supervising the research and in the composition of the manuscript.
He is indebted to Dr. M. Griffith for his assistance and guidance in conducting certain phases of the research and the composition of the manuscript.
He expresses his thanks to Dr. W. A. Johnson for assistance in the analysis of the data and for checking the manuscript. He is grateful to Dr. Jordan G. Lee, Department of Biochemistry, for counsel and guidance of the research.
The author wishes to express his inscere appreciation to his wife, Patricia, for her patience, encouragement and tireless effort which enabled him to continue and complete his training.
He extends his sincere thanks to C . P. Breidenstein for his assistance in the analysis of the data, to A. J. Olinde and w . F. McKnight for their farm assistance, and to the Faculty, staff, Graduate and Undergraduate Students of the Poultry Science Department he expresses his thanks.
. ii

TABLE OF CONTENTS• Page
ACKNOWLEDGMENTS........................... . ............. iiLIST OF T A B L E S ............................. vA B S T R A C T .................................................viiINTRODUCTION............................. 1LITERATURE REVIEW...................................... 3MATERIALS AND METHODS.....................................20
Choline determinations . . ■......................... 22Egg choline.......................................23Choline in e x c r e t a ..............................24Carcass choline.................................. 24Liver choline.....................................25Liver lipid....................................... 25
RESULTS AND DISCUSSION - TRIAL I . . .. .............. 33Egg production....................................... 33Feed consumption .................................. 37Liver lipid. .................. 40Egg yolk c h o l i n e ........... 43Liver choline......................................... 47Carcass choline.......................................49TRIAL II (PART I).................. ' .................51Egg production................................■ . . 52Feed consumption.....................................55Liver lipid........................ 57TRIAL II ( PART II).................................. 62e 9 9 yolk c h o l i n e ..................................6 2Liver choline...................... . ................6 5Carcass choline.......................................65Excreta choline in Trials I and I I ................ 68Total choline (mgs/hen/day) in Trials I and II . 69TRIAL III............................................. 72Whole blood activ i t y .................. 73
iii

PagePlasma choline activity...................... 00Liver choline activity ........... . . . . . . . 84Kidney choline activity.............................83Muscle choline activity.............................91Activity in liver free amino acids ............... 91
SUMMARY.......................... 94TRIAL I (PART 1 ) ............... . . . . ............94TRIAL I (PART 2 ) .................................... 97TRIAL II (PART 1)....................................99TRIAL II (Part 2)...................................101TRIAL III........................................ 103
CONCLUSIONS............................. 108SELECTED REFERENCES................. IllAUTOBIOGRAPHY............................................ 117
iv

LIST OP TABLESTABLE PAGE
L. Growing and Laying Rations for CholineStudy................................................21
2. Egg Production as Affected by DietaryCholine intake - Trial I ......................... 34
3. Analysis of Variance of Egg Production'and Feed Consumption - Trial I ...................35
4. Feed Consumption as Influenced by VaryingLevels of Dietary Choline - Trial I. . . . . . 38
5. Liver Lipid as Influenced by Varying Levelsof Choline - Trial I ..............................41
6. Analysis of Variance of Liver Lipid DataObtained in Trial 1 ................................ 42
7. Choline in Egg Yolk as Influenced by varyingCholine Levels - Trial I ............... 44
8. Analysis of Variance of Choline Content inYolk, Liver and Carcass - Trial 1 ................ 45
9. Liver Choline as influenced by VaryingCholine Levels - Trial I ......................... 45
10. Carcass Choline as influenced by Varying Choline Levels - Trial I ......................... 50
11. Egg Production as Influenced by VaryingCholine Levels - Trial II....................... 53
12. Analysis of Variance of Egg Production andFeed Consumption Data - Trial I I ................ 54
13. Feed Consumption as Influenced by Varying Choline Levels - Trial II...................... 56
14. Liver Lipid as influenced by VaryingCholine Levels - Trial II.................... . 58
v

TABLE PAGE15. Analysis of Variance of Liver Lipid Data -
Trial I I ....................................6016. Choline in Egg Yolk as influenced by
Varying Choline Levels - Trial II........ 6317. Analysis of Variance of Choline Content
in Yolk, Liver and Carcass - Trial II....6418. Liver Choline as influenced by Varying
Choline Levels - Trial II................. 6619. .Carcass Choline as Influenced by varying
Choline Levels - Trial II................. . 6720. Total Choline Balance per Hen Per 28 day
Period - Trials I and I I .................. 7021. Blood Choline Activity Due to Retention of
Two Isotopes of Choline - Trial III.......7422. Tissue Analysis of Variance of Labeled
Choline - Trial III............... 7523. Whole Blood Activity Due to a Time by
Diet Interaction - Trial I I I ............. 7724. Plasma Choline Activity Due to Retention
of Two isotopes of Choline - Trial III . . . . 8125. Liver Choline Activity Due to Retention
of Two isotopes of Choline - Trial III . . . . 8526. Kidney Choline Activity Due to Retention
of Two isotopes of Choline - Trial III . . . . 9027. Muscle Choline Activity Due to Retention
of Two Isotopes of Choline - Trial III . . . . 92
vi

ABSTRACT
- Experiments were conducted to study the choline requirement of White Leghorn hens as measured by egg production, feed consumption and liver lipid content.The choline content of eggs, liver, carcass and excreta from hens receiving varying dietary choline levels was determined. Choline, labeled with carbon-14 in either positions 1, 2 (chain label) as well as in the methyl position was utilized in an attempt to study the distribution of the respective parts of the choline molecule.
Dietary levels of choline from 595 to 5729 mg/kg of diet did not affect egg production nor did switching from a high level to a low level of choline and visa- versa at the onset of lay. Feed consumption per bird tended to be higher at the highest level of choline in the diet (5729 mg/kg) and also when the hens,were switched from the low choline diet to the high diet at the onset o f lay.
Choline levels in the diet did not affect choline concentrations in the egg yolk, livers or carcasses of the hens on their respective diets. It was deduced that a dietary intake of 595 mg/kg was sufficient to obtain
vii

maximum production from laying hens under the conditions of these experiments.
Increasing amounts of carbon-14 from both the chain and methyl positions were found in whole blood, plasma, and liver tissue as dietary levels of choline increased. The data indicated that the choline chain may be incorporated into body nutrients as such while methyl1 groups might be recycled through metabolic pathways and reabsorbed into the blood.
viii

INTRODUCTION
In 1862, strecker isolated a compound from hog bile to which he gave the name "choline". The importance of dietary choline has now been recognized for many years for its vital role in nutrition. Choline is considered by some authors as one of the B-complex vitamins belonging to the lipotropic factor group in biological systems although some authors do not regard it as a vitamin. It is interrelated with several other vitamins and amino acids which are involved in methylation and demythylation reactions. Some vitamins with which it is related are biotin, B^2 » anc ̂folic acid. The amino acids methionine, homocysteine and glycine are also interrelated with choline.
Although choline serves functions of growth promotion and antiperotic activities in chicks, it is also
I;
involved in the lipotropic production of lecithin in the liver of chicksand laying hens. However, both methionine and betaine may serve functions similar to that of choline. Some workers feel that choline is necessary for growth while methionine and betaine act as methyl donors in choline synthesis. The elimination of any one of these three nutrients from the diet is detrimental to the organism

although betaine is not required in the diet if all others are adequate.
To date, no quantitative requirement for choline has been established for laying hens. Therefore, one purpose of these trials was to study choline requirement in laying hens for maximum egg production. Other objectives were to study choline content in liver, egg yolk, carcass and excreta as influenced by dietary choline intake. In addition to studying the requirement, it was desired to investigate the apparent distribution of choline in laying hens fed diets high and low in choline utilizing two labeled isotopes of choline (1,2-c^ and CHg-C^) . It was felt that information obtained from an isotope study would lend credence to data obtained from the first portion of this study and also establish some modes of choline metabolism in various tissues of laying hens.
LITERATURE REVIEW
Choline is considered one of the B-complex vitamins belonging to the lipotropic factor groups in biological systems. it is an essential factor for proper growth and body functioning in animals (Ewing 1963, White et al.1964)!
As reported by the National Research Council (1966), retarded growth and perosis suggest a lack of choline in the diet of young chibks and turkeys. In mature birds, choline deficiency resulted in increased mortality and lower egg production, with an increased reabsorption of egg yolks from the ovary. The Council suggests that choline may be synthesized in sufficient quantities by the laying hen to maintain adequate egg production. No requirements have been established by the Council for maintenance, egg production or breeding in mature birds. However, the British Agricultural Research Council has a recommendation of 1100 mg/kg for breeders (1967).
Choline requirements can be divided into two categories, perosis prevention and a methyl source for the formation of methionine, creatine and other methylated metabolites (Leach et al. 1966). Choline is combined with, and is present as lecithin in egg yolk of hens.

Possibly, the hen can synthesize substantial amounts of choline provided there are sufficient methyl groups present in the diet. Most responses to dietary choline have been achieved with marginal methionine levels. The formation of methyl groups appears to limit the hens' ability to synthesize choline. There is reason to believe that young chicks cannot methylate ethanolamine to produce choline. Therefore, choline in high levels needs to be added to their diet.
When hens were fed on a diet containing 0.03% choline, egg production was lower than that of hens receiving a similar diet containing 0.21% choline according to Lucas et al. (1946a, 1946b). It appeared that the hen under these experimental conditions synthesized substantial amounts of choline.
Ringrose and Davis (1946) postulated synthesis by mature birds but also indicated an apparent need for methionine.
Gillis and Norris (1949) found the choline requirement for chicks fed a purified diet was approximately 1000 mg per kilogram (kg) of diet. The need for supplemental methylating compounds was directly influenced by the animal protein factor (Vitamin B^2)• A diet complete in all known vitamins and composed of mixed cereals, plant protein and supplemental mineral and vitamins was improved

by the addition of betaine or choline. Since betaine was as. effective as choline, it is probable that the effect was due to the increase in methyl groups.
Holmes and Kramer (1965) fed choline levels of 986 or 1606 mg/kg ahd found significantly increased average hen-day production was noted using the 986 mg level supplemented with B ^ * While increasing choline without increasing methionine resulted in a decreased egg production, increasing methionine to 0.36 per cent (%) with Vitamin at 616micrograms (ug) improved egg production. Increasing methionine to 0.31% and B-^ to 17.6 ug improved egg production, but more feed was required to produce one dozen eggs. Increasing choline without increasing methionine increased the feed to egg ratio. Low mortality but no significant change in body weight resulted from increasing choline without increased methionine. Best feed efficiency and e99 production was obtained on the 986 mg choline, 616 ug B -̂ 2 anc ̂0.31% level of methionine.
In a study of the effect of fat on choline requirement, blended vegetable oil was added at zero, five and 10% to a laying diet containing 17% protein level, (Saloma et al., 1965). These diets were supplemented with zero,660 or 1320 mg choline chloride/kg of diet. Ten per cent
i
fat decreased egg production possibly because of sub-normal protein intake and a wide calorie/protein ratio. Five per

cent added fat improved feed conversion and egg weight but had no effect on egg production. The addition of 1320 mg choline increased egg production when diets contained zero and 5% fat. Choline at 1320 mg and 10% fat Improved feed conversion.
Gillis and Norris (1951) showed the choline requirement for chicks receiving high percentages of fat was decreased by feeding supplemental B 12• Additions of betaine or choline to a practical ration based on cereals and vegetable protein r<iSuited in significant improvement of rations as measured by chick growth. Chicks low in Bj_2 utilized betaine better than choline.
Data in the literature indicate the choline requirement is not always raised by increasing dietary fat. March and Biely (1956) showed that a diet containing 600 milligrams (mg) of choline per pound of feed from natural ingredients supplied sufficient choline for growth if the diet was adequate in methionine. Choline requirement increased when high levels of fat were fed in diets low in methionine but this increase appeared to be secondary to the need-for methionine.
One of the probable acceptors of the methyl group of methionine for choline synthesis is ethanolamine or its dimethyl derivatives (Sterkol et al. 1953). These workers used folic acid and Vitamin B 12 deficient rats to investigate

the extent of incorporation of methyl groups of methionine, betaine and choline into tissue choline and creatine. Injection of methionine produced an activity forcholine of approximately 38%.
To study metabolism of choline and its precursors and the in̂ vivo relationship of choline to folic acid in chicks, Young et al. (1955) demonstrated that in the absence of choline, the chicks* requirement for supplemental folic acid was not more than 80 ug/100 gms of diet. If 0.05% choline were added to the diet, only 30 ug of folic acid were required to satisfy the chick' requirement.
Alexander and Sauberlish (1957) showed a decreased anemia and edema in rats when folacin, an<3 homocystinewere added to choline deficient diets containing 7% oxidized
" s '
casein a s ^ h e protein source.&Precursors of tissue lecithin appeared to arise
from dietary components other than choline when rats were fed a purified diet according to Minon and Lucas (1961). Supplementation of choline did not increase the amount of this base moiety, but dietary supplements of methionine and Bj_2 3id increase the total choline content of rat carcass.
Using B ]_2 deficient Ochromonas malhemensis, Lust and Daniel (1964) studied the biosynthesis of methyl groups of choline. Formate-C^ and formaldehyde-C-^ Incorporation

into phospholipid choline was greatly stimulated by the addition of 20 ug of Bx2* Vitamin B]_2 had no effect on the incorporation of 1-methionine-C-*-4 into choline. However, since increased C14 incorporation into choline occurred when homocysteine was included, this would indicate methionine synthesis occurred first. They concluded that B^2 acts in methionine biosynthesis and is thus only indirectly involved in choline biosynthesis.
In experiments conducted with turkeys, Langer and Kratzer (1964) fed diets deficient in labile methyl groups and B-̂ 2 * They showed that those birds fed the methyl groups and B]_2 grew only 54% as rapidly as those fed b 12' choline and methionine. Also, adding B^2 to control diets increased growth to 65% of the controls. Methionine, choline or betaine additions caused maximum growth, but responses were not altered by the presence of dietary Bi2*
The addition of various levels of supplemental riboflavin, pantothenic acid, niacin and choline to a simplified laying ration resulted in a highly significant increase in egg production and in egg size of White Leghorn hens (Day and Dilworth, 1966).
Dietary interrelations between methionine, glycine, choline, protein level and energy content of the chick diet indicate glycine feeding is conditioned by the addition of choline into the diet (Featherson and

Stephenson, I960).*Wise and Elwyn (1963) concluded the conversion
to ethanolamine and choline is quantitatively a minor fate of serine in the rat. The rate of synthesis of choline from methionine in liver was 0.006 millimoles (mM.) per gram per minute and choline turnover was 0.14 mM/gm/minute.
Rogene et al. (1966) stated that increasingmethionine in the chick diet did decrease formate-C^uptake into liver choline. It was concluded that chicksdid not transfer methyl groups from methionine to choline.Formate-C1"4 uptake into choline in the chick liver wasdependent upon the presence of adequate dietary suppliesof both methionine and B ^ * Wells and Ramsy (1961) feelthat methionine may not be an intermediate in the
14incorporation of betaine-c into choline.Fatty liver degeneration which occurs in diabetic
dogs kept on a lean meat-sugar diet could be alleviated by the administration of lecithin, a phospholipid that contains choline, as demonstrated by Best et al. (1932a). The deposition of large amounts of fat in the liver could be completely prevented by the oral administration of large or moderate amounts of crude or purified lecithin from egg yolk or beef liver. Choline-fed animals did not develop fatty liver conditions.

10In a similar study Best et al. (1932b) showed
that injecting fatty acids in rats fed saturated fatty acids or lecithin, whether crude or purified from egg yolk or beef liver, did not increase liver fat. These workers felt the active component of lecithin was choline.
Best and Ridout (1939b) demonstrated that purified lecithin was lipotropically active and choline was the active' component. Choline inhibited the accumulation of neutral fat and cholesterol esters and accelerated their disappearance from the liver. However, choline did not favor fat accumulation into the depot fat. Choline and thiamine exerted complementary effects on increased weight in young rats.
The term fatty liver refers in every case to enlarged livers containing from 8-12 times the normal weight of chloroform-soluble substances according to Griffith and Wade (1939). Rats showed hemorrhagic kidneys as well as fatty livers after ten days on a choline deficient diet. Enlarged spleen and glomerula and tubular degeneration were evident. The kidney effect was prevented when rats were fed 2 mg choline per day, but this did not effect the fatty liver condition. Ten mg were required to prevent the fatty liver syndrome.
Dogs fed insulin over long periods were found to develop fatty livers which could be prevented by feeding

11raw beef pancreas. The addition of lecithin prevented excessive accumulation of fat in the liver and choline addition prevented this occurrence (Harper, 1958).
In discussing the role of choline in the hepatic oxidation of fat, Artom (1958) demonstrated that the administration of choline to animals fed low-protein diets increased fatty acid oxidation i£ vitro. However, fatty acid oxidation has also been stimulated by supplementing low-protein diets with cysteine, alphatocopherol or by raising the dietary protein level without increasing the supply of methionine and cysteine.
It was shown by Olson et al. (1958) that choline- deficient rats had liver lipid contents which averaged approximately 33%. Rats fed diets containing ,0.3% choline had a liver lipid content of approximately 6%. Hypoeho- lesterolemia and hypolipemia developed when rats were fed low methionine and choline diets. While 0.3% choline prevented, casein partially prevented these conditions.The casein effect may be due to its high methionine content.
The lack of choline, oxygen and other factors which interfere with the synthesis of phospholipids were potent causes of fatty deposition according to experiments by Dixon (1958). A lack of choline in the diet resulted in chronic liver injury in rats. Injury varied from fatty liver to cirrhosis (Winswer et al*, 1965).
12Fatty liver may result in choline deficiency from
increased fat synthesis, decreased fat oxidation in the liver, increased mobilization from the fat depots to the liver or a decreased mobilization from the liver to other tissues according to Artom (1960). Labeling studies have indicated that the fat accumulation in the liver is due to synthesis in that tissue and not from movement from fat depots outside of liver tissue in choline deficiencies. Since fatty acids added to liver tissue slices tended to inhibit oxidation reactions within the tissues, the lipotropic action of choline could not be explained only by increased oxidation of fatty acids in the liver. Therefore, the hypothesis that choline stimulated the mobilization of fatty acids from the liver is still possible._
Choline deficiency included an increased fat synthesis in the liver (Yoshida and Harper, 1960) but not in the carcass of rats, and some evidence of impaired transport of fat from the liver was present. If the diet were supplemented with threonine, fatty liver decreased. Accompanying the fatty liver were decreased liver phospho- lipid, endogenous respiration and pyridinonucleotide content. These workers stated that fatty infiltration of the liver was attributed to an increased fat synthesis in liver, decreased fat oxidation in the liver, increased

13fat transfer from the body to the liver and decreased transfer of fat from liver to the body. Fat synthesis was stimulated in rats fed low-protein diets deficient in threonine because the amounts of C^ from injected acetate-l-C1,4 was incorporated into body fat and liver neutral fat was significantly greater in rats fed threonine deficient diets. This condition was not present in those rats fed threonine supplemented diets.
When fed choline deficient diets, rats developed fatty livers (Banson et al., 1961). With 1% choline, no proteinuria developed, but the reverse was true in rats fed deficient diets. Results therefore indicated the possibility that loss of methionine-containing proteins in the urine under conditions of the experiment may have increased the oral lipotropic requirement as indicated by fatty liver production.
Daghir and Balloun (1961) conducted experiments to determine the effect on weight gain, feed efficiency liver lipids, and liver and serum cholesterol of growing chicks fed tv© fat types and three choline levels. Diets containing animal fat or soybean fat with choline levels of 526, 820 or 1404 mg choline/pound of diet were used.No effect was noted on weight gain to seven weeks of age. No effects on liver lipids or liver cholesterol were present. Added choline in the animal fat diet improved

14 'feed efficiency/ but this did not occur on the choline- soybean oil diets.
Booth et al. (1961) conducted experiments to determine if fatty livers could be produced in rats deficient in choline by adding gallic acid and pyrogallol to a diet containing marginal amounts of choline and methionine. Increasing choline or methionine prevented fatty livers. Rats on low methionine, low choline diets containing one percent gallic acid developed fatty livers. Pyrogallol did not cause fatty liver; therefore, gallic acid was believed to be methylated in the animal's body.
The composition of fat rather than the amount was the major factor influencing the accumulation of liver lipids in rats fed diets deficient in choline. The accumulation of liver lipid was inversely related to the degree of unsaturation of the dietary fat (Iwamoto et al., 1963).
It is stated by Sinclair (1964)that liver accounts for one-half of the fatty acid oxidation by the body.Fatty livers can occur from protein deficiency, pyridoxine deficiency, poisoning with cholesterol, alcohol, ethionine, cysteine, chloroform or phosphorus. Choline is also effective here. The most probable cause of fatty liver is the failure to form low density lipoproteins. This can occur if there is insufficient protein, cholesterol,

15phospholipid or a failure of the mechanisms that join these with tri-glycerides and releases the lipoproteins so formed into plasma.
Fatty acid composition of whole liver tri-glycerides, di-glycerides, total phospholipids and lecithin was determined by Eric et al. (1965) in rats which had developed fatty livers due to low protein and choline deficient diets. Results showed no differences in fatty acid patterns of liver lipids in choline deficient animals when compared to choline supplemented animals. The type of fat and carbohydrate accounted for the fatty acid changes in both the deficient and supplemental choline diets according to the authors. They concluded that the occurrence of liver neutral lipid during choline deficiency was not accompanied by changes in fatty acid patterns of liver neutral lipids or by changes in liver phospholipids which could be ascribed directly to lack of choline.
Research by Stetten and Salceda (1945) showed the amount of fat accumulated in liver increased as chain length of fatty acids decreased from stearic to myristic. Recent work reprinted in Nutrition Reviews (1965) indicated that rats fed choline deficient diets high in saturated fats caused greater liver fat accumulation than diets high in unsaturated fats. Liver lipid storage was inversely related to fatty acid chain length. Short chain

16dietary fatty acids induced greater lipid accumulation in choline deficient rats than did the long chain fatty acids. It appears that choline did not have control of the type of fat accumulated under the condition of choline deficiency.
In a study involving turnover rates of liver phospholipids, Campbell et al. (1949) showed that when rats were fed choline deficient diets containing high lev&ls of saturated fatty acids, a greater accumulation of liver fat occurred than when rats were fed diets rich in unsaturated fatty acids.
Rikans et al. (1965) attempted to determine the extent to which choline metabolism was involved in the production of fatty livers in rats fed diets high (40%) in fat and 0.1% niacin- Patty livers were produced in rats fed excesses of naicin and a non-protective choline level could be reversed by the addition of choline to the diet. The appearance of fatty livers in animals fed excess niacin resulted from an induced choline deficiency.
Couch (1966) believes that fatty liver conditions are due to diseases in chicks. He notes that livers may contain from 15-70% fat with the normal content being 12-25%. Prior to 1960, antimicrobial agents such as Aureomycin were used. Couch also contends that fatty
■ 's
liver is a disease linked character and that a low disease

level may stress the birds and trigger the actual occurrence of the syndrome.
Nesheim et al. (1967) showed that choline deficiency during the rearing of pullets seemingly affected responses to choline supplements when pullets came into production. Hens fed a choline-free diet through the first 12 weeks of lay were comparable in egg production and liver lipid levels to hens fed supplemental choline throughout the rearing and laying period. Those pullets fed choline supplemented diets to 16 or 22 weeks of age and then switched to choline-free diets showed a marked decrease in egg production.
It has been reported by many workers that precursors of choline are present in simplified diets in which methionine and betaine prevent perosis. Simple precursors of choline might exist in natural foods. While Lucas et al. (1946b) indicated that mono and diethylaminoethanol functioned in the chick as a choline precursor, vohra et al. (1960) more recently showed that monoethalaminoethanol replaced choline in perosis prevention but was less of a growth promoter than choline. However, both had anti- perotic and growth promoting activities.
Further, Branchi and Azzone (1964) while studying choline oxidation in rat liver mitochondria, showed choline oxidation occurred in two steps, choline to betaine aldehyde

18by the enzyme flavin adenine dinucleotide dehydrogenase, and betaine aldehyde to betaine by betaine aldehyde dehydrogenase and di phosphopuridino nucleotide.
Choline in urine and blood plasma of dogs is in the free state (Norrisand Heuser, 1945). Choline prevented perosis and increased growth while betaine and methionine in the presence of an unidentified factor enabled dogs to synthesize choline. Choline poisoning symptoms were changes in respiration, trembling, convulsive movements, salivation, hemorrhages around the eges, cyanosis, respiratory paralysis and finally death. Fatal deficiencies have been reported due to one or more of the above in less than three hours in dogs according to the authors. These deficiency symptoms were characterized by severe fatty infiltration of the liver, a rise in blood plasma phosphatase, impairment in bromsulfalein elimination, a fall in blood plasma cholesterol and an increased prothrombin time.
Rennick (1958) recognized that the two naturally occurring quaternary ammonium compounds choline and thiamine were excreted by the renal tubules of the hen.The techniques used showed a selective tubular transport and thiamine inhibition of choline transport suggesting competitive inhibition was occurring.
Leach et al. (1962) while investigating bone formation
19demonstrated diethylstilbestrol fed to choline deficientchicks increased chick growth rate accompanied by reductionsin the incidence and severity of bone abnormalities.
Calcium strongly stimulated the incorporation oflabeled choline into phospholipids of rat liver micro-somes in research reported by Dils and Hubscher (1961).Other divalent ions did not show this. Maxium incorporation
-3of choline occurred at 1.6-3.13 X 10 concentration of calcium ion and, at a pH of 9, d and 1 serine competitively inhibited this reaction. The de nova synthesis of choline was dependent on co-enzyme A, adenosine triphosphate, cytidine nucleotide and magnesium ion.
While studying skeletal muscles, Srivastava and Sardas (1965) showed rabbits developed weakness in these muscles, loss of body weight and excretion of more creatine and less creatinine in the urine when the diet was deficient in choline. A threefold increase ribonucleic acid was present. Adenosinetriphosphate and creatine were reduced considerably in the affected muscles.

MATERIALS AND METHODS
Two trials were conducted to study choline requirement and concentration in laying hens. Criteria were egg production, feed consumption, total liver lipids and choline content of egg yolk, liver carcass and excreta.
In the first experiment, analyzed dietary choline levels of 595, 955, 1910, 3819 and 5727 mg/kg of finished ration were fed (Tahle I). The diet contained 17.8% protein and had a metabolizable energy value of 3133 (growing) and 2702 (laying) cal/kg. Each diet was fed to six replications of 30 caged White Leghorn hens. Each group was composed of 15 cages containing two birds per cage and each was randomly placed within the laying house.
Individual hen weights were recorded at the beginning and at the conclusion_of the experiment. The experiment was begun when the hens were 21 weeks of age and continued until they were 54 weeks of age. Egg production records were maintained on a hen day basis.
In the second trial, two groups of 416 White Leghorn pullets each were housed in floor pens and received rations containing a choline level of either 595 or 1910 mg/kg of ration (Table I) from 10 to 21 weeks of age. At the onset of lay (21 weeks), each group was moved to laying
20

TABLE IGROWING AND LAYING RATIONS FOR CHOLINE STUDY
Ingredient Growing % Laying %
Corn Starch 54.07 50.07Soybean Meal (50%) 11.00 11.00Corn Gluten (60%) 1 0 . 0 0 1 0 . 0 0Fish Meal (60%) 4.00 4.00Meat Meal (45%) 7. 30 7.30Alfalfa (20%) 3.00 3.00Fat 5.00 4.00Dicalcium Phosphate 0.60 0.60Oyster Shell Flour — 5.00Salt 0.25 0.25Vitamin Mixa 4. 71 4.71Mineral Mix 0.07 0.07
Total 1 0 0 . 0 0 1 0 0 . 0 0
aAdds per kilogram of diet: 10.1 mg vitamin A (250,000USP/gm); 6.6 mg vitamin D, (200,000 ICU/gm); 400.4 mg vitamin E (20,000 IU/gm); 6.6 mg vitamin B,p (132 mg/kg);154 mg riboflavin (44,000 mg/kg); 44 mg niacin; 2.2 mg thiamin; 1.1 mg folic; 8 . 8 mg calcium pantothenate; 4.4 mg pyridoxin; 1.1 mg menadione; 704 mg methionine; 132 mg santoquin (6 6 %). Protein content - 17.8%, M.E. Values - 3185 and 2993 Cal/kg respectively.
Choline chloride (70%) was added to the diets in levels analyzed to equal 595, 955, 1910, 3819 and 5729 mg/kg of ration. Additional soybean meal brings choline chloride and other vitamin additions to 4.71% of the diet.bAdds per kilogram of diet: 200.2 mg CuSO„; 200.2 mg ZnC00;250.8 mg MnS0 4 . _ - 4 3
21

cages and sub-divided into two sub-groups containing 208 birds per sub-group resulting in a total of 4 treatments.In this trial, treatments consisted of four replications containing 26 cages with two birds per cage, one sub-group from each initial treatment continued to receive the 595 or 1910 mg diets respectively, while the other sub-group from each treatment was switched to the other level of choline. Egg production, feed consumption and liver fat analysis were begun at 21 weeks of age and carried out until the conclusion of the trial at 44 weeks of age. The object of this trial was to determine if egg production, feed consumption and/or liver lipid would be altered during the laying period if young pullets were fed high or low choline levels during rearing.
Choline determinations: Each month the three cages oflayers (6 hens) within each treatment whose egg production fell closest to the treatment median were sacrificed.
The concentration of choline in egg yolk, carcass, liver and excreta was determined by the method of Lim and Schall (1964), utilizing additional techniques of Frits (1965), Ackerman and chow (1960) and Ackerman and Salmon (1960). All choline determinations were based on dry weights of the tissues mentioned above. Samples were taken and dried in a forced draft oven at 104° for 24 hours before choline content was measured. The analyses

23were carried out as follows:
Egg choline; Eggs were collected from the six hens which were to be sacrificed each month during the last three consecutive days before sacrifice. Collected eggs were marked and refrigerated until ready for analysis.
Two eggs collected from each of the three hens pertreatment were analyzed. These eggs were broken out and yolks separated, weighed, broken into procelain dishes and then dried at 104°C for 24 hours in a forced draft oven. The dried yolks were then blended in a Serval- Omni Mixer for 30 seconds.
Two yolk samples of approximately 5 grams werewrapped in tared #1 Whatman filter paper, accuratelyweighed and extracted in a Soxhlet apparatus using a mixture of 60 ml methanol and 10 gms barium hydroxide.After a five hour extraction, the solution containing choline was cooled and filtered into 100 ml volumetric flasks. The extraction flask was washed with three 10 ml portions of methanol: glacial acetic acid (1 0 :1 ) whichwere added to the volumetric flask and it was then brought to volume with methanol. An aliquot containing 5-50 mg of choline was placed on an 18 cm X 7.5 mm Florisil column, prepared by mixing 4 gms florisil in enough methanol to obtain a -slurry. The column was successively eluted with 15 ml methanol, 10 ml of 10%

24methano1-acetone, 5 ml reinecke solution (3-4 gms reinecke salt + 100 ml distilled 1^0), 15 ml glacial acetic acid methanol (1 0 :1 ) to remove the excess reinecke solution and finally 10 ml acetone to elute the pink choline-reinecke precipitate. The dissolved precipitate was collected in a 10 ml volumetric flask, diluted to volume with acetone and read at an absorbancy of 526 mu using a Beckman DU spectrophotometer to determine choline concentration.
Choline in excreta: Excreta collections were madefrom the selected birds previously mentioned during the egg collection period. Excreta was dried in a forced draft oven at 104°C for 24 hours to obtain total dry matter. The dried excreta was then blended in a Serval- Omni Mixer. Two 10 gm samples were taken for choline determination.
Carcass choline: At the conclusion of each 28 dayperiod, the selected birds were sacrificed and livers removed for choline and fat analysis. The two hens within each pen, after liver removal, were chopped together in a Koch Manurhin cutter. A carcass sample (250 gms) was taken and dried in a forced draft oven for 24 hours. The dried sample was mixed with equal amounts of dry ice and ground in a Wiley-Mill. Samples were placed into the forced draft oven to drive off the carbon dioxide. Two 10 gm samples of the dried carcass sample were taken for choline

25analysis. The procedure was the same as that used in egg yolk and excreta determinations.
Moisture determinations were made on two five gram samples (forced draft oven at 104°C for 24 hours).
Liver choline; Livers were weighed together after removal, immediately frozen and subsequently homogenized in a Serval-Omni Mixer containing 15 ml of water. Moisture determinations were made in a forced draft oven at 104°c for 24 hours. The dried liver horaogenate was reground in the Omni Mixer to obtain small particles suitable for choline extraction procedures.
Two liver samples of approximately five grams each were taken for choline analysis. Choline determinations were similar to those previously described.
Liver lipid; Liver lipid was determined by extracting a 4 gram sample in a Soxhlet with diethyl ether for a twelve- hour period.
Choline Distribution In The Body of Laying Hens
An experiment was conducted to study cholinedistribution in the body of laying hens. Isotopicallylabeled choline 1,2-C^ and CH3- C ^ choline were used in
14this experiment. Criteria were the amount of carbon (C^) activity of liver, muscle, kidney, whole blood, plasma and free amino acids of liver. Two laying hens from each

26of three choline diets (595, 1910, 5729 mg choline/kg diet. Table 1) were selected for this study. Hens remained on feed until taken for analysis.
Hens were prepared by flushing the cloaca with distilled water and immediately plugging it with absorbent cotton in order to block fecal and urinary passages leading into the cloaca. This was a measure utilized to eliminate loss of isotopes by these urinary ahd fecal passages and as a safety measure to decrease contamination of the working area.
A 20 gauge needle attached to a two and one-half ml syringe was inserted onto the heart to insure complete dose injection into the hen. The needle was left in the heart, the syringe removed, and a disposable plastic syringe containing 50 microcuries of labeled choline was attached to the needle and slowly injected into the heart. As the last of the dose was injected, time was recorded. Birds were then sacrificed after five or 17 minutes. In this way, not only was distribution measured, but also rates of incorporation of the two isotopes were measured.
At the end of each time interval 30 ml of blood were drawn by heart puncture from the dosed hens. This blood was placed into previously heparlnized screw cap tubes. Hens were sacrificed using two mis Sodium penta- barbital injected directly into the heart. Whole liver,

27kidney and a portion of the right pectoris muscle were removed. These tissues were placed in individually tared specimen bottles, weighed, homogenized and frozen.
Two one-tenth ml aliquots of blood from each hen were dried at 104^ in small pyrex tubes. The remaining blood was centrifuged at 3000 revolutions per minute (rpm) in an International Centrifuge Size 1, Type 5B, for 15 minutes. The plasma was siphoned off and two one-tenth ml aliquots placed in small pyrex tubes and dried.
Thawed liver, kidney, blood and plasma tissue samples were weighed in duplicates into pyrex tubes to exactly one-tenth gram of tissue per tube. These duplicate samples were then dried over night at 104°C.
Two and one-half grams of liver homogenate were taken for measures of incorporation of choline or its degraded components into various free amino acids (Stein and Moore, 1954), The liver sample was homogenized in a 10-fold volume of one percent picric acid in a Waring blender for 30 seconds. The picric acid precipitate was promptly removed by centrifugation on a Servall RC2-B Centrifuge at 6000 rpm for 15 minutes.
A Dowex 2 x 8 resin in the chloride form was prepared by mixing a 1:2 water slurry of the resin. The resin was poured into a two and one-half by 22 cm chromatograph tube whose outlet was plugged with filtering fiber.

28The resin was allowed to settle to a height of approximately 18 cm. The resin bed was then washed with 60 ml of 1 Normal (N) HCl, followed by the addition of water until the effluent was neutral.
The supernatant liquid obtained from the picric acid centrifugation step was passed through the prepared resin bed. The walls of the resin bed were washed with 60 mis of 0.02N HCl. Effluent and washings were concentrated on a rotary evaporator to a volume of about one ml. With water the concentrate was transferred to a small screw cap glass vial and stored over night in a freezer. After thawing, the concentrate solution was brought up to pH 7-7.5 by the dropwise addition of 1 N NaOH. Two-tenths mis of freshly prepared 0.5 Molar solution of sodium sulfite was then added to the solution. The sample was allowed to stand at room temperature for four hours.
Following the four hours, the solution was adjusted to pH 2-2.2 with 1 N HCl. The solution was transferred to a 10 ml volumetric and brought to volume (one ml now represents 0.25 gms of tissue homogenate).
In order to separate the free neutral and acidic and free basic amino acids, a Beckman Model 120C Amino Acid Analyzer was used (Spinco Division, Beckman instruments inc., 1966).
To separate the free basic amino acids, a column

2923 x 0.9 cm containing a Beckman resin type PA-35 hydrogen exchange ion with 7.5% crosslinkage was used. Circulating water in a water jacket around the resin was maintained at a temperature of 50°C.
One ml of the prepared free amino acid sample, representing 0.25 grams of tissue, was placed on the column and forced into the resin bed under an argon gas pressure of 20 pounds per square inch (psi). One ml of a pH 5.28 sodium citrate buffer was placed on the resin bed to wash the walls of the column. A pH 5.28 sodium citrate buffer was then passed through the resin to separate the basic amino acids. As each amino acid was eluted from the column, it was mixed with a ninhydrin reagent. The mixture flowed in a Tygon tubing through a reaction bath which facilitated Ninhydrin-amine reactions, thereby developing a color which was read by a Beckman photometer. The free amino acid- ninhydrin mixture was then collected in 3 ml aliquots on a fraction collector. As determined by a Beckman recorder, all tubes containing the same amino acid were combined and a 3 ml aliquot obtained. This aliquot was placed in a small pyrex glass tube and evaporated to dryness at 104° C.
The free neutral and acetic amino acids were separated on a column 69 X 0.9 cm containing a Beckman AA-15 hydrogen ion exchange resin with 8% crosslinkage. A circulating water temperature of 30° c was maintained at

30this point. Again, a 1 ml aliquot of the prepared sample was placed on the resin bed, but this time, a sodium citrate buffer of pH 3.28 was utilized to wash down the resin walls. The free amino acids were eluted with a pH 3.25 sodium citrate buffer at 30° C for 100 minutes.At this time, the temperature was raised to 50^ C to facilitate elution of the less acidic amino acids. After 150 minutes the buffer was switched to a pH 4.26N sodium citrate buffer enabling elution of the remaining neutral amino acids. The remainder of this procedure was identical to that of the basic amino acid determination.
At this point all dried tissue and amino acid samples were ready to combust. The combustion consisted of essentially freeing the labeled isotope of choline as C ^ C >2 and counting this isotope in a scintillation counter as outlined by Smith et al., 1961. The procedure is described in detail in the following paragraphs.
Each prepared sample was placed in a combustion flash containing approximately 2 gms dry digestion reagent prepared by grinding a 2:1 ratio of potassium iodate ( K I O 3 ) and potassium dichromate (l^C^Oy) .
Each flask was attached to a separatory funnel containing 10-15 ml of liquid digestion reagent (2000 ml of 20% fuming sulfuric acid, 1000 ml 85% phosphoric acid plus 30 gms potassium iodate (K1 0 3)-heat solution to

approximately 190°C until all KIO3 has dissolved). An Erlenmeyer flask containing a 10 ml ethanolaroine solution (mix 7 volumes of methyl cellosolve with 3 volumes of reagent grade ethanolamine solution) was set in an ice bath and placed on a magnetic stirrer. The side arm of the Erlenmeyer flask was attached to a stannous chloride trap (traps SO3 and iodine liberated during combustion and acts to prevent combustion liquid from entering the absorption unit) which was in turn connected to a tube leading to the combustion flask.
After all connections were lubricated/ a vacuum was applied to the entire system. Liquid digestion reagent was then slowly allowed to flow into the combustion flask containing prepared sample and dry digestion reagent. The flask was then heated with an acetylene torch until vigorous boiling occurred and all of the sample was digested. The solution was allowed to cool for 15 minutes at which time the apparatus was dismantled. The solution in the Erlenmeyer flask now contained the labeled C^c^.Ten mis of methyl cellosolve were added to the flask. From this flask, 5 mis of solution were pipetted and mixed in a scintillation vial containing 10 mis toluene scintillation solution (dissolve 8.25 gms of 2.5 diphenyloxazole (PPQ) in 1 liter of reagent grade toluene + 50 mg PoPop)' was then placed in a scintillation counter preset to count at 10

minute intervals.Counts were adjusted for the time interval,
dilution factors, percent protein of whole carcass, liver and kidney weights, percent whole blood in carcass and percent plasma in whole blood.

RESULTS AND DISCUSSION TRIAL I (Part I)
The purpose of Trial I was to study the choline requirement of the hen and the effects of various levels of choline on egg production, feed consumption and liver lipid in White Leghorn hens. Hens were placed on experiment at 21 weeks of age and were fed diets containing choline levels of 595, 955, 1910, 3819 or 5729 mg/kg.Also, choline levels in egg yolk, liver, carcass tissue and excreta were studied.
Egg production; An analysis of variance was made on the egg production data found in Table 2 and is shown in Table 3. Over eight 28-day periods, the average egg production {Table 2) was 55.6% reaching a peak at approximately 37 weeks of age and then declining gradually. Analysis of period means revealed significant differences (P« 0.05). With the use of a Duncans multiple range test, differences between the first period and all other periods were noted. ' Hens had the lowest production during, period 1. An increased trend was noted through the next three periods, the significance being only in the latter period where production was highest (72.3%).This is characteristics of hens during the first few months
33

TABLE 2
EGG PRODUCTION AS AFFECTED BY DIETARY CHOLINE INTAKE - TRIAL I
Period'1' 5952Choline (rag/kg diet) 9552 19102 38192 57292
Period2Mean
Percent Egg Production {hen/day basis )1 10 8 9 10 8 8 .8a2 62 56 60 59 61 49. 8bc3 64 67 63 77 74 64.7de4 60 73 76 77 75 82.3f5 71 68 54 66 70 65.7e6 67 64 59 63 66 63.8de7 58 63 55 58 56 58.2C8 50 55 55 50 49 51.7b
Mean 55.4 56.8 53.9 56.1 56.1 55.6
1 Period refers to successive 28-day periods beginning at 21 weeks of age
2 Dietary level of choline (mg/kg) analyzed3 Values having different superscripts are significantly
different (P< .05)
34

\
TABLE 3
ANALYSIS OF VARIANCE OF EGG PRODUCTION AND FEED CONSUMPTION - TRIAL I
Variable D.F. EggM.S.
FeedM.S.
Total 239 - -
Periods (p) 7 11,819.92** 2,106.05**Treatments (T) 4 54.03 224.54*Replications 5 1,682.54** 237.01*P x T 28 101.78** 148.79**Residual 195 45.63 80.04
♦Significant at the 0.05 level of probability**Significant at the 0.01 level of probability
35

of lay and might be expected. Since these three periods occurred during the months of February - April, it would also seem reasonable to expect an increased egg production during this time. Although periods 2, 3, 5, 6 and 7 were not statistically different from one another, a decreased trend was noted during periods 5-7. Period eight was different from all other periods, egg producting during this period being 51.7%. Again, according to the well established egg production curve, a decline would be expected during these latter periods.
There were no differences between treatments receiving different dietary choline levels. These findings do not agree with those of Holmes and Kramer (1965) who showed decreased egg production as dietary choline levels were increased. However, it should be noted that these workers were supplementing rations with excessive amounts of other vitamins and amino acids which may have influenced egg production data.
A highly significant interaction between periods and treatments was obtained in Trial I. The peak production period in most cases was during period four. However, hens fed the lowest dietary choline level peaked one period later than those hens fed higher levels. This may well have resulted in the period by treatment interaction. It was concluded that a choline level of no more than 595

mg/kg of diet, the minimum level fed, was sufficient to maintain egg production under the conditions of this trial.
Feed consumption; Overall feed consumption was approximately 73 gm/hen/day, which was somewhat lower than the normal consumption of about 90-100 gm/hen/day. This low consumption may be explained by the fact that the diet was semi-purified and was rather high in energy.
Feed consumption data are presented in Table 4.Feed consumption was measured as grams of feed consumed per hen per day. In order to determine the effects of choline on feed consumption, an analysis of variance, represented in Table 3, was made. A period effect was noted when feed consumption data was analyzed statistically. A multiple range test indicated the differences to be due to periods four and five, it was during these two periods that feed consumption was highest, these figures averaging 85.4 gm/hen/day. It was previously noted that egg production was also highest during these same two periods. it seemed reasonable to assume that in producing more eggs, the hens' feed intake would increase and this can be seen in Table 4. it also stands to reason that as the hens consumed more feed, the dietary choline intake would also increase. Since, treatments did not

TABLE 4
FEED CONSUMPTION AS INFLUENCED BY VARYING LEVELS OF DIETARY CHOLINE - TRIAL I
Period5' 5952Choline9552
(mg/kg diet) 19102 38192 57292
Period^Mean
i
1 68
Feed Consumption 67 69
(gms/hen/day) 67 68 67.4a
•2 64 62 62 67 62 63.la3 73 67 67 71 69 69.2a4 80 89 83 85 92 •
in00
5 85 87 75 90 88 85.0b6 78 63 72 54 75 6 8 .3a7 71 61 71 72 74 70.0a8 67 75 69 69 82 72.2a
3Mean 73. 2° 71. 2b 70.6b 71.9b 76.0a 72.6
Period refers to successive 28-day periods beginning at 21 weeks of age
2 Dietary levels of choline (rag/kg)3 values having different superscripts are significantly
different (P<.05)
38

39affect egg production it may possibly be stated that increased feed consumption during periods four and five was due to increased egg production during those same two periods.
Feed consumption was altered when hens were fed the highest dietary choline level (5729 mg/kg). The resulting consumption (76.0 gm/hen/day) was three grams more per hen/day than highest consumption of the other four treatments. Although an increased consumption was noted at the high choline level, egg production of hens consuming this level was not affected. Since protein and energy levels were identical over the five treatments with only dietary choline levels differing, one might expect an increased or decreased consumption trend over experimental treatments. Since this was not the case, it was believed that possibly bird weights may be effecting feed consumption - the heaviest hens consuming more feed. However, when weights were averaged over treatments, highest weights were obtained among hens fed the lowest choline levels. Considering the above findings, no reasonable explanation for high feed consumption of hens maintained on a 5729 mg choline diet can be advanced.
A period by treatment interaction was. noted when feed consumption data were analyzed. Results were very similar to those obtained from egg production in that

feed consumption peaked during period four in three of the five dietary choline treatments. Similarly, hens on the lowest dietary choline treatment peaked one period later than those on treatments 955, 1910 and 5729 mg diets. Hens on the treatment containing 3819 mg choline also peaked one period later hut no explanation for this observation is advanced.
Liver Lipid: The nutritional significance of fatty liversand the ability of additional dietary choline to decrease liver lipid in some species has been previously discussed. Table 5 represents liver lipid on a dry weight basis.These values were obtained with 12-hour diethyl ether extraction of 4 gm samples of dry liver homogenates. Results of the analysis of variance as shown in Table 6 . Dietary choline levels significantly influenced liver lipids. lowest liver lipid levels were obtained at the two highest (3819 and 5729 mg/kg) dietary choline levels. These levels were not, however, significantly different from the 595 mg treatment. Highest levels of liver lipid were obtained at 955 and 1910 mg/kg of dietary choline (Table 5). These differences also were not significant from the 595 mg treatment but were different from the 3819 mg treatment. This might indicate that two of the lowest dietary choline levels, 955 and 1910 mg/kg, were

TABLE 5
LIVER LIPID AS INFLUENCED BY VARYING LEVELS OF CHOLINE - TRIAL I
Period1 595Choline
2 9552(rag/kg diet)
19102 38192 57292Period
mean
Percent Liver 3Lipid1 24 36 28 30 31 29.72 . 21 25 23 21 18 21.43 18 25 28 16 21 ' 21.8
4 20 33 24 24 22 22.75 23 32 28 18 18 23.96 28 18 44 12 11 22.77 , 28 21 22 15 21 21.38 22 27 18 19 25 22 . 1
4Mean 23 „ab c _ 3 .0 27.1 26.8ab 19.4C to o a 23.2
1 Periods refer to successive 28-day periods beginning at 21 weeks of age
2Dietary levels of choline (rag/kg)3 Liver lipid expressed as percent dry weight4 Values having different superscripts are statistically
different (P<.05) __
41

TABLE 6
ANALYSIS OF VARIANCE OF LIVER LIPID - TRIAL I
-Q
Variable D.F. M.S.
Total 119 -
Periods (p) 7 114.28Treatments (T) 4 250.68*P x T 28 98.10Residual 80 72.18
* Significant at the 0.05 level of probability
42

43not adequate in supplying sufficient choline to the hen thereby resulting in decreased movement of lipid from the liver. The low liver lipid content obtained in hens fed 595 mg/kg cannot be explained at this time. Conversely, the two highest dietary choline levels (3819 and 5829 mg/kg)1 were probably sufficient to adequately increase lipid movement from this organ.
Choline Determination (Part II) - Trial I
Another phase of Trial I involved determination of choline levels in carcass, liver, egg yolk and excreta from hens receiving different dietary choline levels.
Egg yolk choline; Values for egg yolk choline are shown in Table 7. Eggs are considered to be one of the richest sources of choline, having an average content of from 175 to 250 mg of choline per yolk.
Analysis of variance of yolk choline data demonstrated significant differences among experimental periods (Table 8). Choline content was high during the early spring periods (3-5) while periods 1-2 had very low yolk choline contents.
According to Duncans multiple range test, highest yolk choline appeared to be present during periods 3-7 while lowest content (21.3 mg/gm) in period eight differed
-*
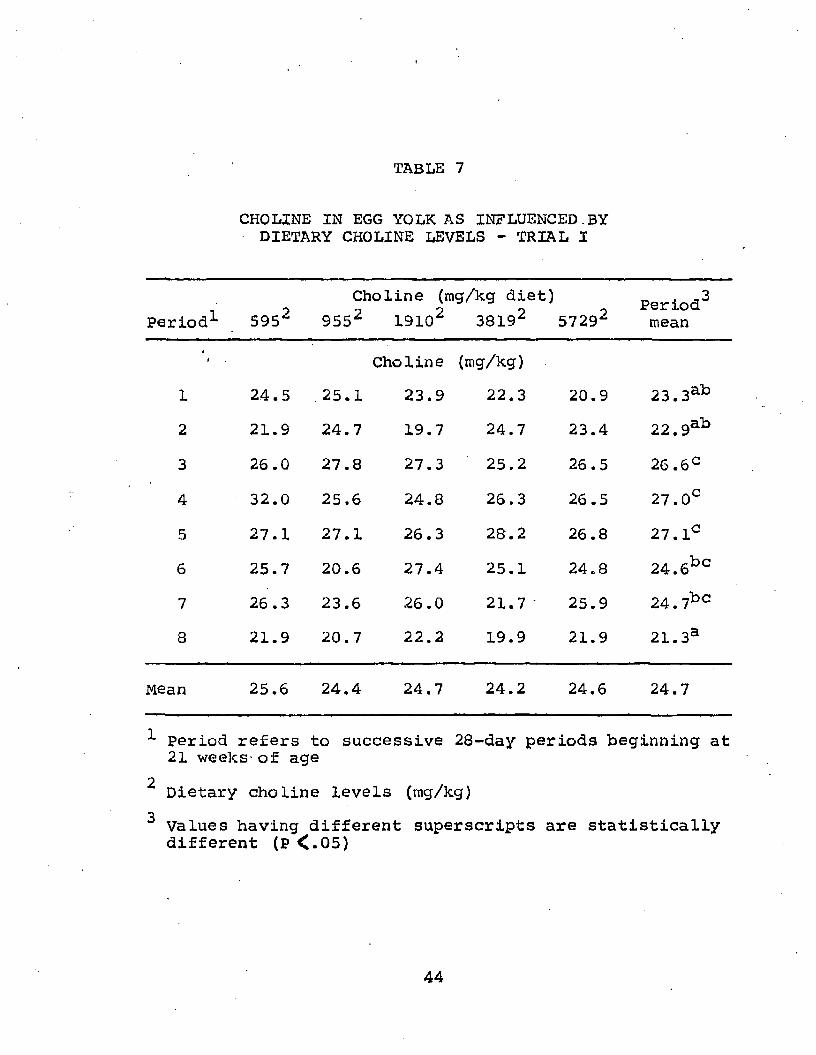
TABLE 7
CHOLINE IN EGG YOLK AS INFLUENCED.BYDIETARY CHOLINE LEVELS - TRIAL I
Period1- 5952Choline (mg/kg diet)
9552 19102 38192 57292Period2mean
i Choline (mg/kg)1 24.5 ,25.1 23.9 22.3 20.9 23.3ab2 21.9 24.7 19.7 24.7 23.4 22.9ab3 26 .0 27.8 27.3 25.2 26.5 26.6C4 32.0 25.6 24.8 26.3 26.5 27.0C5 27.1 27.1 26.3 28.2 26.8 27. lc6 25.7 20.6 27.4 25.1 24.8 24.6bc7 26.3 23.6 26.0 21.7 ’ 25.9 24.7bc8 21.9 20.7 22.2 19.9 21.9 21.3a
Mean 25.6 24.4 24.7 24.2 24.6 24.7
^ period refers to successive 28-day periods beginning at 21 weeks- of age
2 Dietary choline levels (mg/kg)3 Values having different superscripts are statistically
different (P <.05)
44
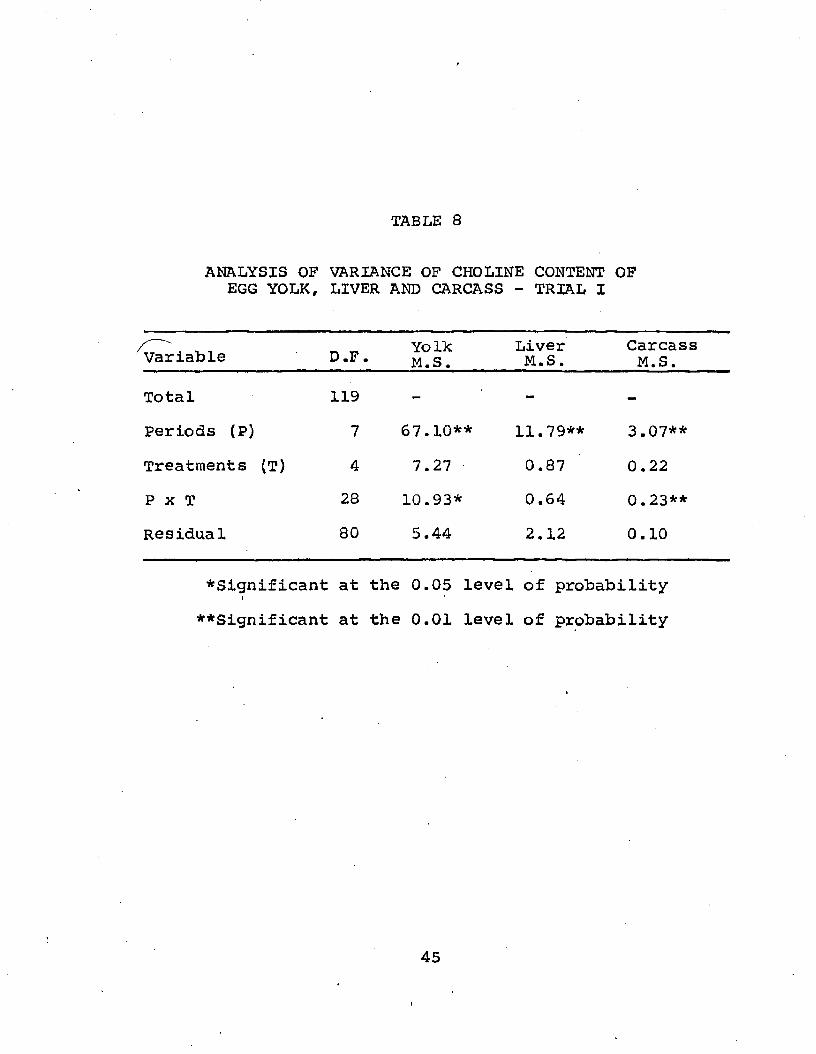
TABLE 8
ANALYSIS OF VARIANCE OF CHOLINE CONTENT OF EGG YOLK, LIVER AND CARCASS - TRIAL I
Variable D.F. YolkM.S.
LiverM.S.CarcassM.S.
Total 119 - - -
Periods (P) 7 67.10** 11.79** 3.07**Treatments (T) 4 7.27 0.87 0.22P x T 28 10.93* 0.64 0.23**Residual 80 5.44 2.12 0.10
^Significant at the 0.05 level of probability**Significant at the 0.01 level of probability
45

from periods 3-7 but not from periods 1-2. Another look at Tables 2 and 4 show that egg production and feed consumption also peaked during these latter two periods. These results might therefore be interpreted to mean that, as feed consumption increased and dietary choline consumption increased, the choline not stored per se in body tissues might possibly be contained in the form of lecithin in the egg yolk. Apparently the lower dietary choline intakes in the early periods were either utilized more efficiently than the choline consumed in later periods or, hens were synthesizing sufficient choline to meet body needs at the low levels. The average choline concentration found in egg yolk was 24.7 mg/gm of dry yolk. Considering an egg yolk as having an average moisture content of 50%f choline concentration on a wet weight basis would be 12.35 mg/gm of wet yolk. Although yolk choline in this trial was somewhat below the average given by Ewing (1963) but higher than that noted by Nesheim et al. (1967), (250 and 175 mg/egg respectively), the factthat the diet was semi-purified may have influenced choline level in yolk.
increasing dietary levels of choline from 595 to 5729 mg/kg had no effect on choline content of yolk.These data suggest that the metabolism of the hen is such to control the deposition of choline in theyolk even

47though rather large amounts may be present in the dietary regimen. Further analysis indicated the presence of a period by treatment interaction. over all treatments, with the exception of the 595 mg treatment, an increased yolk choline content occurred immediately following period four. However, during this same time hens fed the 595 mg diet showed a decrease in yolk choline content. It may also be noted that yolk choline appeared to be highest over all other periods when hens were fed 595 mg/kg dietary choline. These observations appear to be responsible for the interaction effect noted in this analysis.
Liver choline: The choline content of dry liver is shownin Table 9, the average content being 4.6 mg/gm. Assuming a moisture content of approximately 70%, one gram of wet liver would contain about 1.4 mg/gm choline. The only significant differences occurred among periods (P 10.05).
Highest liver choline content occurred during periods four and five (5.6 and 5.9 mg/ gm dry liver respectively). Lowest liver choline content occurred during the first period (3.1 mg/gm dry liver) while periods 2, 3, 6, 7 and 8 remained statistically unchanged. Analysis of Table 2 and 4 (egg production and feed consumption) indicated a statistical increase in these

TABLE 9
LIVER CHOLINE AS INFLUENCED BYDIETARY CHOLINE LEVELS - TRIAL I
Period1 5952Choline (mg/kg diet)
9552 19102 38192 57292Period^mean
1 2.6Liver Choline (mg/gm dry liver)
4.2 2.9 3.4 2.4 3.1a2 4.0 4.4 4.5 3.7 4.3 4.1b3 4.6 4.1 3.5 4.4 4.0 4.1b4 5.6 5.6 5.5 6.1 5.2 5.6d5 6.1 6.6 4.9 5.9 6.1 5.9d6 5.1 4.5 5.2 4.9 3.9 4.7bc7 4.4 4.4 5.2 4.9 4.4 4. 7bc8 4.5 4.5 5.4 5.2 4.9 4. 9C
Mean 4.9 4.8 4.9 4.8 4.4 4.6
1 Period refers to successive 28-day periods beginning at 21 weeks of ageDietary levels of choline (rag/kg)
2 values having different superscripts are statistically different (P <.05)
48 '

49criteria during periods four and five. This observation may well explain the rise in liver choline during the same two periods.
When supplemental choline levels were added to the diet no significant differences occurred in liver choline concentrations. Since liver is thought to be the prime organ of choline synthesis, it was felt that varying the choline content in the diet might alter production of that nutrient in the liver. Perhaps higher or lower choline levels would be required to produce a change in liver choline levels; however, under conditions of this trial, no differences due to diets were obtained.
Carcass choline: Since one of the main objectives ofthe experiment was to determine choline content of carcass and apply this determination to calculate apparent choline synthesis in laying hens, it was therefore of interest to determine if varying levels of dietary choline would affect choline concentration in carcass tissue except for liver (Table 10). Analysis of variance (Table 8) indicated a highly significant difference in choline content of carcass among periods. Carcass choline increased significantly during the spring periods (4-6). This increase appears to coincide with those increases in egg production (Table 2), feed consumption (Table 4) and liver

TABLE 10
CARCASS CHOLINE AS INFLUENCED BYDIETARY CHOLINE LEVELS - TRIAL I
Period'Choline (mg/kg diet)
595' 955“ 1910' 3819 5729'Period*mean
Carcass Choline (mg/gm dry carcass)1 00•r-f 1.8 1.7 1.5 oi•i—i 1.6ab2 1.9 2.2 1.9 2.1 3.3 2.0cd3 2.1 1.8 1.9 2.0 2.1 2.0Cd4 3.1 2.6 3.0 2.1 2.8 2.7e5 2.4 2.4 2.4 2.8 2.6 2. 5de6 ' 2.3 2.5 2.4 2.7 2.3 2. 5de7 1.4 1.6 1.5 1.3 1.4 1.4a8 2.2 2.5 2.4 2.6 1*9 2.3cde
Mean 2.1 2.2 2.2 2.1 2.2 2.2
Period refers to successive 28-day periods beginning at 21 weeks of age
2 Dietary choline levels (mg/kg)J values with different superscripts are statistically
different (P<.05)
50

51choline concentration (Table 9). Average carcass choline content was 0.77 mg/gm wet carcass or 2.2 mg/gm dry weight. Since these increases in carcass choline as well as yolk and liver choline occurred regardless of dietary choline levels and since these increases were present during periods of high feed intake, it was concluded that the hen, and not the amount of dietary choline, was controlling the level of choline deposition in these various areas.This becomes a valid conclusion if one assumes an increased lipid content of carcass tissue during periods of high feed intake. Body weights of birds selected for carcass choline analysis showed an increase of approximately 500-800 gms during periods of high feed consumption.
A significant interaction between periods and treatments was observed in the carcass choline data (Table 8). Three possibilities exist which contribute to the magnitude of this interaction term: a high levelof carcass choline in period four of the 595 mg diet, a high choline content during periods five and six of the 3819 mg diet, or extremely low values obtained for carcass choline concentration during the seventh period. Any one or all of these areas may have affected the interaction obtained in carcass choline concentration.
Trial II (Part I)The objectives of this trial was to study the ability

52of young pullets to adjust to high or low dietary choline levels during the rearing period and to study their ability to adjust to changes in dietary choline levels from high to low and low to high levels after coming into production. Criteria used were egg production, feed consumption and liver lipid content.
Egg production; Mean values for egg production are shown in Table 11. After a sharp increase in egg production following the first period, production became somewhat constant over subsequent periods. Analysis of data are presented in Table 12. Significant differences were obtained among periods with the average egg production being 60.8%. It is quite possible that the very low egg production obtained during the initial period was responsible for differences obtained among periods. These hens had two peak periods of high egg production, period two and period five (March and June). Production was higher in Trial II. Although periods 3, 4, and 6 were similar to each other, they were statistically different from all other periods. The average egg production over these three periods was 66.9%. Since these hens came into production at the beginning of the unusually mild spring season, and hens in Trial I came into production the previous December, then this might explain the more rapid

TABLE 11
EGG PRODUCTION AS INFLUENCED BYDIETARY CHOLINE LEVELS - TRIAL II
- — Choline (rag/kg diet)9 5953 1910* Period4
Period1- 595 1910 1910 595 meanf
percent Egg Production1 18 16 16 16 16.5a2 74 72 72 74 72.9d3 70 67 64 73 68.8C4 67 66 68 66 66.8bc5 75 74 76 75 74.6d6 65 66 64 65 65. lb
Mean 61.5 60.3 59.9 61.4 60.8
1 Period refers to successive 28-day periods beginning at 21 weeks of age
2 Dietary levels of choline (mg/kg)2 The top level was switched to the one beneath at the
onset of lay (21 weeks)4 Values with different superscripts are statistically
different (P<.05)
53
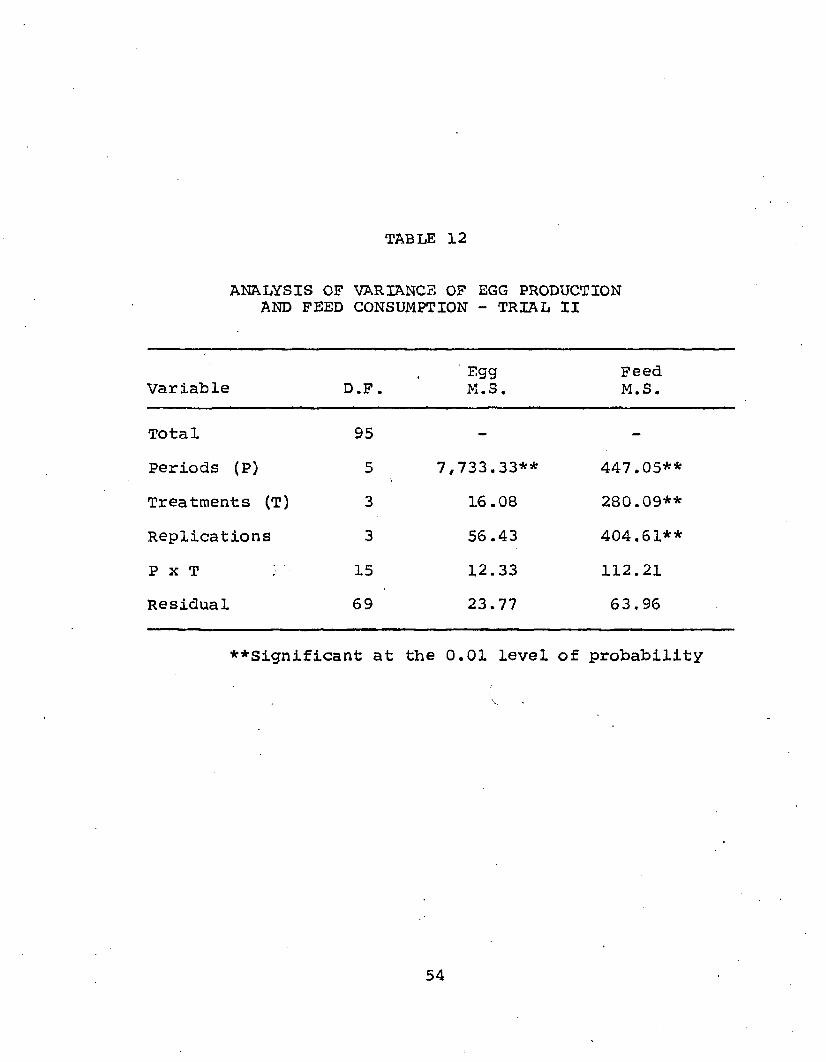
TABLE 12
ANALYSIS OF VARIANCE OF EGG PRODUCTION AND FEED CONSUMPTION - TRIAL II
Variable D.F.' Egg M.S.
FeedM.S.
Total 95 - -
Periods (P) 5 7,733.33^ 447.05**Treatments (T) 3 16.08 280.09^Replications 3 56.43 404.61*^P x T 15 12.33 112.21Residual 69 23.77 63.96
♦♦Significant at the 0.01 level of probability
54

increase in production of hens in Trial II.No treatment effects were noted. Nesheim et al.
(1967) noted decreases in egg production when pullets were fed choline-supplemented purified rations during rearing and then switched to choline free diets at the onset of lay. However, their basal diet was much lower in choline than the one used in this trial.
Feed consumption: Real differences (p^O.05) in feedconsumption existed among periods, treatments and replications when hens were fed varying levels of choline (Table 12). it was of interest to examine differences between treatments. Duncans multiple range test (Table 13) showed that hens switched at the onset of lay from a low (595 mg) to a high (1910 mg) dietary choline level consumed more feed (81.5 mg/hen/day) than those on any of the other three treatments. This change in choline content of feed may well be the factor responsible for increased feed intake. Hens maintained on a 1910 mg diet showed a higher feed intake (76.8 gm/ hen/day) than hens fed a low (595 mg) diet; however, these values were not statistically significant. It was concluded that altering rations from low to high dietary choline levels increased feed consumption under conditions of this trial. Periods were statistically significant and

TABLE 13
FEED CONSUMPTION AS INFLUENCED BYDIETARY CHOLINE LEVELS - TRIAL II
Choline (mg/kg diet)595 1910 4-Period
Period 5952 1910 1910 595 meani
gra Consumed/hen/day1 79 76 68 78 75.4ab2 75 79 77 77 77.2ab
3 68 68 68 68 68.0b4 73 93 85 77 81.8a5 65 86 80 72 76.0ab6 83 87 83 77 •<NCO
Mean^ 73.8b 81. 5a 76.8b 74.9b 76.8
1 period refers to successive 28-day periods beginning at 21 weeks o£ age
2 Dietary level of choline (rag/kg)J The top level was switched to the one beneath at the
onset of lay (21 weeks)4 Values with different superscripts are statistically
different (P<.Q5)
56
57it was interesting to note that during period four feed consumption reached its first peak (81.8 gms/hen/day) while egg production peaked at 74.6%, one period later. During this period of high production, feed consumption again dropped, but this drop was not significant. However, by periods 3-4 weights had become somewhat constant; therefore, weight gain was ruled out as a possible cause for this feed increase. Egg production, although constant during periods 3-4, may have had some effect, but the effect cannot be explained from the data obtained. These observations may effect results of liver lipid data which will be discussed in the following section.
The diet containing the lowest level of dietary choline was consumed at an equal rate in both trials (73.2 and 73.8 gm/hen/day respectively) while hens fed the 1910 mg choline diet appeared to consume approximately six grams more feed per hen per day than those birds on a similar level in Trial I. Feed consumption data for Trial II is shown in Table 13.
Liver lipid; Hens were sacrificed for liver lipid analysis starting approximately 28 days before the onset of lay and each subsequent 28-day period thereafter. Mean values for these determinations are shown in Table 14. These analyses were continued through six 28-day periods after

TABLE 14
LIVER LIPID AS INFLUENCED BYDIETARY CHOLINE LEVELS - TRIAL II
Choline (mg/kg diet)
Period-*- 59525953
1910 1910219103595
Periodmean
4Percent Liver Lipid0 15 26 39 25 26.0ab1 26 ■ ■ • 29 23 27 26. lab2 30 19 23 24 24.lab3 42 24 25 31 32.4ab4 20 17 30 18 21.3a5 34 35 30 41 34.9b6 27 29 36 31 30.7ab
Mean 27.8 26.6 29.3 28.0 27.9
Period refers to successive 28-day periods beginning at 21 weeks of age. To conform to egg production and feed consumption (Tables 11 and 13), the first period was designated as zero.Dietary levels of choline (mg/kg)
3 Thetop level was switched to the one beneath at the onset of lay
^ Percent liver lipid per gm of dry weight ..5 Values with different superscripts are statistically
different (P<.05)
58

birds came into lay. Hens maintained on 595 mg dietary choline in Trial II had a higher liver lipid content (27.8%, Table 14) than those hens on a similar diet in Trial I which had a liver lipid content of 23.1% (Table 15). However, the reverse was true when the 1910 mg diets were compared. Maintaining hens on 595 or 1910 mg/kg of dietary choline did not alter liver lipid in Trial II.While hens fed 595 mg/kg had an average liver lipid content of 27.8%, the percent liver lipid of those fed the 1910 mg/kg level was 29.3%. These differences were not statistically significant (Table 15).
Switching hens at the onset of lay from 595 to 1910 mg/kg or from 1910 to 595 mg/kg of choline did not significantly change the percent liver lipid. Hens switched to the high (1910 mg/kg) level had a mean liver lipid content of 26.6% dry weight while those switched to the low (595 mg/kg) level contained 28.0% liver lipid on a dry weight basis. The only significant difference was obtained among periods (Table 14). These values ranged from a low of 21.3% to a high of 34.9% lipid.The probable cause of significance was the low lipid value obtained during period four (21.3%), with a subsequent increase to a high of 34.9% liver lipid in the fifth period. With a high feed consumption during the fourth period, it would seem likely that a higher egg production

TABLE 15
ANALYSIS OP VARIANCE OF LIVER LIPID - TRIAL II
Variable D.F. M.S.
Total 83 -
Periods (P) 6 282.99**Treatments (T) 3 26.51 •P X T 18 118.45Residual 56 86.20
**Signi£icant at the 0.01 level of probability
60

61along with a lowered fat content would be present. If it was assumed that the probable reason for liver lipid mobilization was due to increased choline content then, during period four when feed intake was high, more choline would be consumed resulting in an increased lipid mobilization from liver tissue. The value of 21.3% liver lipid obtained in period four (Table 14) would only substantiate the above assumption. Whether liver lipids were being incorporated into body tissue or egg yolk is not known. However, immediately following liver lipid mobilization (period five), a significant increase in egg production resulted while feed intake decreased. This may have resulted in the increased liver lipid content during the fifth period. Similar changes in liver lipid between the 595 or 1910 mg treatment of Trial I were not obtained over eight 28-day periods.
A comparison of the 595 and 1910 mg diets of Trials I and II indicated a higher percentage liver lipid present in Trial II (27.8% and 29.3%) as compared to 23.0% and 26.8% of Trial I. Differences within either trial were not statistically significant. No explanation can be advanced for these findings and it is therefore concluded that differences between the two trials were only due to chance.

62
Choline Determination (Part II) - Trial II
In the second phase of this trial, the effects oncholine concentration in egg yolk, liver and carcasstissue, and feeding high or low choline levels werestudied in pullets that were switched or maintained on the corresponding levels at 21 weeks of age.
Egg yolk choline; The average choline content of egg yolk is presented in Table 16. choline levels in the ration of 595 or 1910 mg/kg or switching these two levels at the onset of lay did not produce significant differences in choline concentration of dried egg yolk (Table 17). Average choline content was 25.2 mg/gm of dry yolk or 12.6 mg/gm of wet yolk.
A significant difference in periods was present in this trial. A decline during the latter periods (3-6) occurred but was not statistically significant between these five periods. Highest choline content occurred during periods 1-2 being 27.9 and 28.6 mg/gm of dry yolk respectively. Dietary choline levels of 595 or 1910 mg were similar when Trials I and II were compared. Examination of the data of these two diets (Tables 7 and 16) indicate a higher degree of variation in yolk choline of Trial I as compared to Trial II. Further analysis

TABLE 16
CHOLINE IN EGG YOLK AS INFLUENCED BYDIETARY CHOLINE LEVELS - TRIAL II
Period1- 5952Choline (mg/kg diet)
5953 19103 1910 1910 595
Period4mean
Egg Yolk Choline (mg/gm dry yolk)i
1 28.9 28.7 26.5 27.7 27.9a2 29.7 27.9 27.9 29.1 28.6a3 25.3 25.1 23.3 26.8 25. lb4 21.2 25.0 21.0 25.4 23.0b5 25.3 24.1 25.6 19.8 22.7b6 22.9 22.1 22.3 23.7 22.8b
Mean 25.5 25.4 24.4 25.4 25.2
1 Period refers to successive 28-day periods beginning at 21 weeksof ageDietary choline levels (rag/kg)
3 The top level was switched to the one beneath at the onset of lay (21 weeks)
4 Values having different superscripts are statistically different (P< .06)
63

TABLE 17
ANALYSIS OF VARIANCE OF CHOLINE CONTENT IN EGG YOLK, LIVER AND CARCASS - TRIAL II
Variable D.F.YolkM.S.
LiverM.S.
CarcassM.S.
Total 71 - - -
Period (p) 5 76.93** 5.26** 0.28Treatment 3 4.64 0.50 0.29P x T 15 9.09 0.68 0.08Residual 50 7.02 0.72 0.20
**Signifleant at the 0.01 level of probability
64

65reflected no other effects. Dietary choline levels in either trial exhibited similar concentrations of choline in dry egg yolk which again indicates the hen's metabolic pattern controls deposition of choline.
Liver choline; The overall average concentration (Table 18) of liver choline was 4.9 mg/gm of dry liver. Maintaining hens on diets containing 595 or 1910 mg/kg dietary choline levels did not alter liver choline content in Trial II (Table 17).
There were significant differences between periods of liver choline concentrations in Trial II. Highest liver choline occurred during periods 0, 2, 3 and 4 and was lowest during periods 1, 5 and 6.
Some apparent difference in liver choline content was observed between Trials I and II when dietary choline levels of 595 or 1910 mg/kg were compared. These differences were valid only when periods 2-8 of Trial I (Table 9) were compared with periods 1-6 of Trial II (Table 18).
Carcass choline; Values for carcass choline are shown in Table 19. An analysis of variance (Table 17) was made on carcass choline concentrations. There were no significant differences when dietary choline levels of 595 or 1910 mg

TABLE 18
LIVEK CHOLINE AS INFLUENCED BYDIETARY CHOLINE LEVELS - TRIAL II
Choline (mg/kg diet)
Period1- 59525953
1910 191021910595
Period^mean
r1
Liver Choline (mg/gm)0 6.0 4.6 5.1 4.8 5.1bc1 4.7 3.4 4.3 , 4.3 4.2d2 6.1 6.2 5.4 5.7 5.8a3 4.9 5.7 5.5 4.9 5.2ab4 5.1 5.3 4.5 4.7 4. 9C5 3.7 3.8 4.9 3.8 4.1d6 4.2 4.4 3.8 4.4 4. 2d
Mean 5.0 4.8 4.8 4.6 4.8
period refers to successive 28-day periods beginning at 21 weeks of age. To conform to egg production and feed consumption {Tables 11 and 13), the first period was designated as zero.
2 Dietary choline levels (mg/kg)3 The top level was switched to the one beneath at the
onset of lay (21 weeks)^ values having different superscripts are statistically
different (P<.05)
66
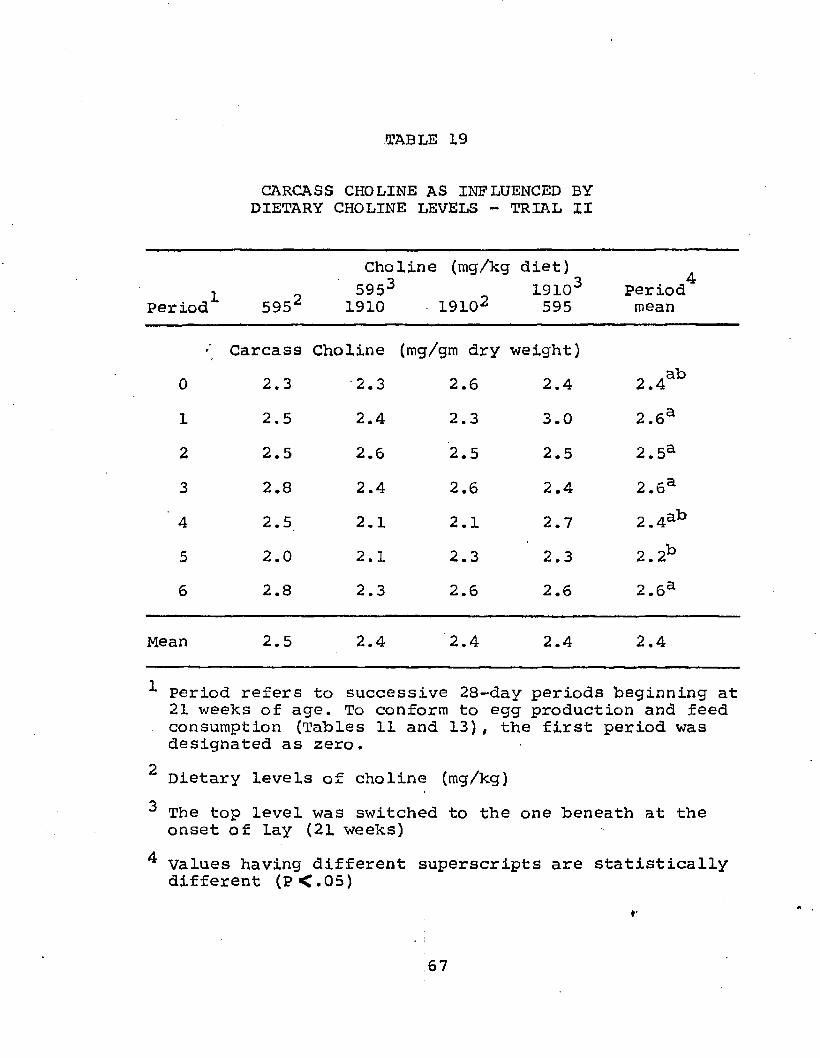
TABLE 19
CARCASS CHOLINE AS INFLUENCED BYDIETARY CHOLINE LEVELS - TRIAL II
Choline (mg/kg diet) 4595 1910 PeriodPeriod 595 1910 19102 595 mean
Carcass Choline (mg/gm dry weight)0 2.3 2.3 2.6 2.4 ab2.41 2.5 2.4 2.3 3.0 2 .6 a2 2.5 2.6 2.5 2.5 2. 5a3 2.8 2.4 2.6 2.4 2 .6 a
’ 4 2.5. 2.1 2 .1 2.7 2.4ab5 2.0 2.1 2.3 2.3 2 .2b6 2.8 2.3 2.6 2.6 2 .6a
Mean 2.5 2.4 2.4 2.4 2.4
Period refers to successive 28-day periods beginning at 21 weeks of age. To conform to egg production and feed consumption (Tables 11 and 13), the first period was designated as zero.
2 Dietary levels of choline (mg/kg)The top level was switched to the one beneath at the onset of lay (21 weeks)
^ Values having different superscripts are statisticallydifferent (P<.05)
67

68were maintained or switched in laying hens. There was little variation in carcass choline concentration among periods or levels of dietary choline in Trial II. The average choline concentration in this trial was 2.4 mg/gm of dry carcass.
Observations of carcass choline content In Trials I and II with regards to the 595 and 1910 mg diets indicated similarities between the two. Although the levels within each trial had nearly identical carcass choline contents, levels in Trial II were approximately 0.3 mg/gm of dry weight more than the choline contents in Trial I. It should again be noted that not all levels of choline in Trial I were represented in Trial II.
Excreta choline in Trials _l and II: It was felt that onepathway of intact choline elimination might be in the excreta of laying hens since it is by this means that the breakdown products (methyl, amine and cahin groupings) are eliminated. Excreta was treated similar to egg yolk, liver and carcass tissues. Repeated choline determinations produced values for total choline that were too small to measure accurately. The absence of measurable amounts of choline in excreta from either trial is not unjustified in view of the apparent synthesis data to be presented, and incorporation of choline into egg yolk and carcass

tissue. Also, the established participation of choline in a number of metabolic pathways might also reduce the excretion of this vitamin in an intact form which would be measurable with the procedures employed in these trials.
Total choline (mgs/hen/day) in Trials jc and II: Cholinecontents in hens fed varying levels of dietary choline were compared to determine an apparent degree of choline synthesis. Subtracted from the total dietary choline intake/day was choline content in dry yolk and change in dry liver and dry carcass homogenates of corresponding days. The results of these comparisons based on total choline in mg/hen/day are shown in tfable 2 0 .
The data regarding apparent synthesis of choline indicated the hens' ability to form or regulate synthesis of this vitamin.
In Trial I ' (Table 20) a negative value represented appearance of choline above dietary choline intake each day. These negative values therefore indicated a net daily synthesis occurred in hens fed either 595, 955 or 1910 mg/kg of dietary choline while hens fed 3819 or 5729 mg/kg were utilizing dietary choline in preference to synthesis. If choline content of the diets had been plotted against choline synthesis or excess, a straight

TABLE 20
TOTAL CHOLINE BALANCE (INTAKE - TISSUE STORAGE PLUS OUTPUT IN EGG YOLK) - TRIAL I
Dietary Choline (rag/kg)Periods-1, 595 955 1910 3819 5729
mg/hen/day1 -21 7 69 198 3462 -118 -99 -29 76 1553 -151 -137 -62 74 1994 -2 0 1 -148 -19 110 2655 -197 -157 -31 99 2596 -172 -134 -77 -28 221
7 -125 -137 -45 120 2348 -137 -111 -46 101 301
Mean -140 -114 -39 94 247
1 Successive 23-day periods
continued
70

TABLE 20 CONT'D.
TOTAL CHOLINE BALANCE (INTAKE - TISSUE STORAGE PLUS OUTPUT IN EGG YOLK) - TRIAL II
1Periods 595
Dietary Choline5952
1910
(mg/kg)
191019102595
mg/hen/day1 -53 -58 -42 -532 -186 -60 -65 -1563 -197 -73 -67 -1814 -168 -16 -33 -1755 -168 -86 -116 . -1636 -169 -28 -59 -193
Mean -157 -34 -64 -153
1 Successive 28-day periods2 Switched to the lower figure at the onset of lay (21 weeks)
71

72line would result. Extrapolation of this line to the x axis would indicate a net choline synthesis of approximately
180 mgs/hen/day. Similarly, if choline consumption/hen/ diet day had heen plotted against choline synthesis or excess, a straight line would also result. Extrapolation of this line back to its X axis would again indicate a net synthesis/hen/day of approximately 180 mgs. The above findings have led to the conclusion that laying hens fed dietary choline levels of from 595-1910 mg/kg have the ability to synthesize approximately 180 mgs of choline/hen/ day.
Although hens in Trial II were maintained on either 595 or 1910 mg/kg dietary choline or switched at the onset of lay to the higher or lower level, a net synthesis similar to that obtained in two corresponding treatments in Trial I was observed. Hens maintained on 595 rog/kg or switched from 1910 to 595 mg/kg of dietary choline had similar choline synthesis values (157 and 153 respectively) . Conclusions were identical to those formulated from the results of Trial I.
Labeled 1,2 and CH3-C-^-choline Trial III
The previous trials had established a substantial degree of apparent choline synthesis in almost all

73instances and some degree of regulation by hens on various dietary choline levels. it was therefore thought desirable to study the carcass, liver and kidney distribution of the labeled choline and breakdown products in order to evaluate the degree of participation of the various organs and tissues in choline metabolism. The use of two labeled sites in the choline molecule also allowed for some speculation as to the reaction pathways of choline as affected by dietary choline levels.
Whole blood activity; Preparation of whole blood and other tissues for activity measure have already been outlined in the Materials and Methods section of this dissertation.
The results obtained with the two isotopes showed significant differences in the levels of the labeled material in whole blood as influenced by diet and time (Table 21). An analysis of variance of the data demonstrated significant interactions between diet and isotope and diet and time (Table 22). It may be assumed that the reactions which would tend to alter the concentrations of the chain labeled material are mainly associated with phospholipid synthesis plus degradation of choline. Those involving the methyl labeled choline are assumed to be primarily demethylation reactions resulting in incorporation
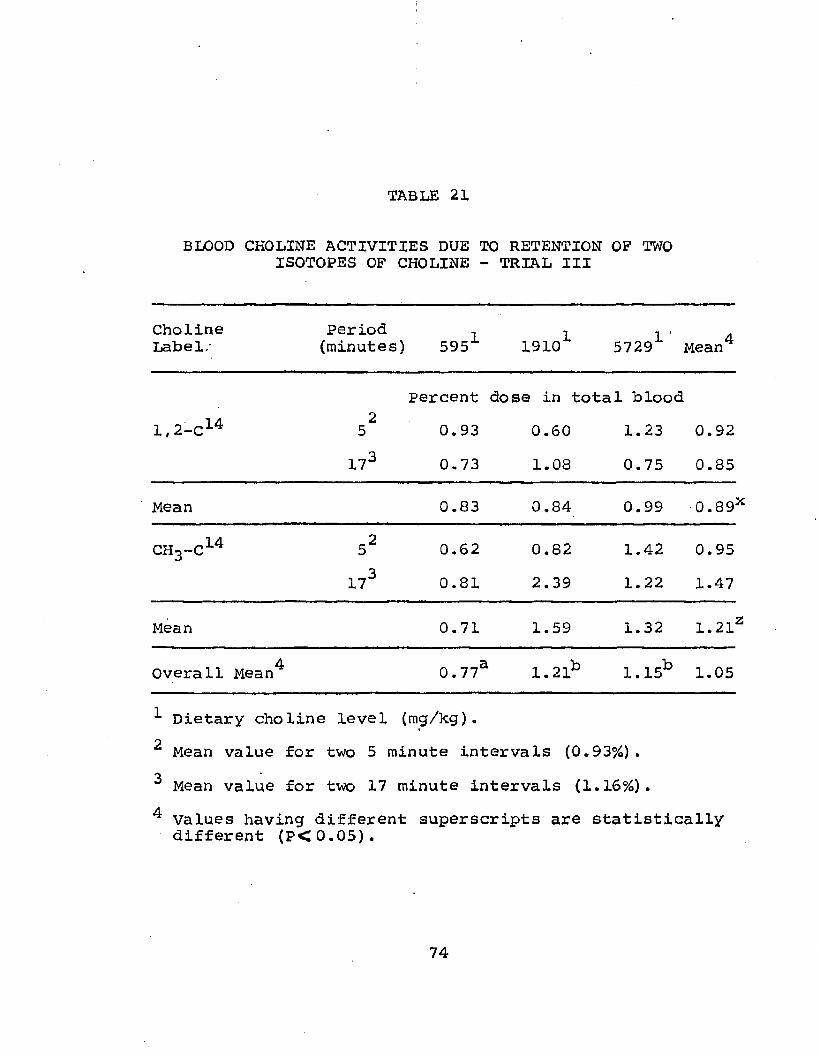
TABLE 21
BLOOD CHOLINE ACTIVITIES DUE TO RETENTION OP TWO ISOTOPES OF CHOLINE - TRIAL III
CholineLabel.-
Period(minutes) 5951 19101 5729^ Mean4
Percent dose in total blood1,2-C14 25 0.93 0.60 1.23 0.92
173 0.73 1.08 0.75 0.85
Mean 0.83 0.84 0.99 0.89:
CH3-C14 52 0.62 0.82 1.42 0.95173 0.81 2.39 1.22 1.47
Mean 0.71 1.59 1.32 1 .21'4Overall Mean 0.77* 1 .21b 1.15b 1.05
1 Dietary choline level (mg/kg).2 Mean value for two 5 minute intervals (0.93%).
Mean value for two 17 minute intervals (1.16%).4 Values having different superscripts are statistically
different (P<0.05).
74

TABLE 22
TISSUE ANALYSES OF VARIANCE OF IABELED CHOLINE IN TRIAL III
Source D.F.BloodM.S.
PlasmaM.S.
LiverM.S.
KidneyM.S.
MuscleM.S.
Total 23Levels of choline (A) 2 0.464* 0 .2 2 2** 25.019** 0.222 0.204Minutes (B) 1 0.297 0.191** 21.603* 0.763 2.300Isotopes (C) 1 0.631* 0.031 1.426 2.747** 4.481AB 2 1.004** 0.018 9.583 0.529 0.001
AC 2 0.378* 0.048* 35.477** 0.535 0.106ABC 2 0.093 0.043* 1.401 0.422 0.014Residual 13 0.092 0.011 4.012 0.182 1.410
♦Significant at the 0.05 level of probability.**Signifleant at the 0.01 level of probability.

76of the methyl group into a large number of other compounds.
The significant isotope by diet interaction (Table 2 1 ) suggests an effect of dietary choline on the utilization of the methyl labeled material in that a lower dietary intake of choline resulted in a lower level of the label in whole blood. However, it should be noted that in all instances but the lowest dietary choline level (595 mg/kg) a higher total percent dosage of the methyl labeled choline was present over that of the chain label although this was not statistically significant, it appears that an increased need by the body for the chain labeled molecule may have occurred possibly due to an increased synthesis of phospholipid by liver tissue.
It was shown that increasing dietary choline increased lipid mobilization from liver tissue (Table 5). if one assumed that part of this lipid was phospholipid, then this may explain the resulting decreased activity of the chain label present in the blood stream.
With respect to the time by diet interaction, there was a less rapid removal of the isotope from the blood after either 5 or 17 minutes (Table 23) when the dietary supply of choline was increased. The apparent synthesis data presented in Table 20 indicated that diets high in choline (3819 and 5729 rag/kg) sufficiently

TABLE 23
WHOLE BLOOD ACTIVITY - TIME BYDIET - TRIAL III
Choline levels (mg/kg) Time (minutes) 595 1910 5729
Percent Total Dosage51 . 77a . 71a 1.32b
171 . 77a 1.72b .98ab
^ Values having different superscripts are statistically different (P<0,05)
77

supplied enough of this vitamin to meet metabolic needs of the hen. Therefore, if this were the case, it would not seem unreasonable to obtain high activity in the blood after 17 minutes. This may result from metabolism and dilution of the labeled isotope which would be placed back into the blood stream for utilization as. the hens body required it. If sufficient quantities of dietary choline were present in the dietary regimen, then labeled material could possibly remain in blood circulation for much longer periods than it might normally.
When hens were fed dietary choline levels of 595, 1910 or 5729 mg/kg, the percent dosage of two labeled isotopes of choline in whole blood were 0.77, 1.21 and 1.15% respectively (Table 21). Analysis showed the differences to lie between the 595 mg diet and the two higher choline levels. Whole blood activity in hens fed the 595 mg diet was almost a third lower than activity in those hens fed dietary choline at the two higher levels. These findings indicated a rapid disappearance of choline from the blood when hens were maintained on low choline diets emphasizing the hens need for choline under possible choline stress conditions. Hens under the conditions of this experiment apparently tended to utilize intact choline in preference to synthesis in order to provide sufficient quantities of choline to

maintain body reserves of this vitamin.Further analysis of whole blood data indicated
a more rapid disappearance of the chain labeled choline. The mean percent value for the chain labeled choline was 0.89% and w as'1.21% for the methyl labeled choline (Table 21). The high activity represented by the methyl labeled choline supports the idea of rapid recycling and transfer of methyl groups from blood to tissue and vice- versa. Those methyl groups which were not immediately utilized appeared to remain in blood circulation until called upon for synthesis of body constituents.
initially, both labels are present in whole blood at similar concentrations. What appears to be happening is that, as each label group is circulated through the liver, it is subjected to metabolic changes. The chain label in all probability remains intact, incorporated into phospholipid and returns to the blood stream. Normally the phospholipid fraction will be transferred to egg yolk or brain tissue, etc. with some remaining in b lood.
The methyl label choline is also circulated to the liver where it is subjected to metabolism. Here it may be demethylated to form methionine, C02 and other metabolic constituents, and thereby become diluted throughout the liver. Another possibility would be the

80Cj_ or formate pool. The metabolic constituents could then be transferred to blood where they may remain as normal blood constituents. if the above assumptions are valid, they would certainly explain the increased whole blood activity of the methyl label after 17 minutes.
The absorption of chain labeled choline from blood to body tissue seemed to be more unidirectional than the methyl group and may have been indirectly incorporated through metabolic pathways relative to choline into known products of choline metabolism.
Plasma choline activity; After obtaining plasma from whole blood by centrifugation, activities of labeled choline in plasma were measured and statistically analyzed. Mean values are represented in Table 24, while the analysis of variance is shown in Table 22.
Activities of isotopically labeled choline in plasma were 0.35, 0.48 and 0.69% of the total injected dose when hens were maintained on either 595, 1910 or 5729 mg/kg of dietary choline respectively (Table 24). Analysis indicated these activity differences to be statistically significant at the 0.05 level of probability. It was determined from a multiple range test that as levels of choline were increased,^the percent activity in plasma also increased. A similar trend was noted in whole blood

TABLE 24
PIASMA CHOLINE ACTIVITY DUE TO RETENTION OP TWO ISOTOPES IN CHOLINE - TRIAL III
CholineLabel
Period(minutes) 5951 19101 57291 4Mean
*Percent dose in total liver
1 ,2-C14 5 2 0.30 0.34 0.89 0.51b17 2 0.40 0.60 0.73 0.58b
Mean 0.35 0.47 0.81 0.55
CH3 -C14 52 0.28 0.34 0.36 0.33a173 0.43 0.66 0.76 0.62b
Mean 0.35 0.50 0.56 0.48
Overall Mean 0.35a 0.48b 0.69b 0.51
*1 Dietary choline level (mg/kg).2 Mean value for two 5 minute intervals (o.38%).3 Mean value for two 17 minute intervals (0.61%).4 Values having different superscripts are statistically
different (P<0.05).
81

82activity with a slight decreased activity at the highest level of choline. These results substantiated conclusions drawn from whole blood analyses, namely, the tissue uptake of choline, other than blood, was apparently facilitated when the dietary regimen was low in choline.
The relative proportions of the labeled isotope found in plasma as compared with erythrocytes was found to be' affected by the 1, 2 and CH3 carbons of choline. (Tables 21 and 24). After five minutes, 55% of the whole blood activity of the chain labeled choline was present in the plasma (45% in RBC) while only 35% of the whole blood activity of the methyl labeled material was in plasma (65% in RBC). These percentages changed after 17 minutes in that 6 8% of the whole blood activity was present in plasma from chain labeled choline (32% in RBC). The plasma methyl label constituted 42% of the whole blood activity after 17 minutes (58% in RBC).
The amounts of each labeled compound in plasma increased with time (5 vs 17 minutes). The percentage of the label in RBC's decreased with time, although the methyl labeled choline was accumulated in RBC's to a greater extent than the chain compound at each time period.
Statistical analyses further demonstrated that the two labeled isotopes of choline were ineffective in

83establishing differences in plasma activities. The mean percent dosage due to the chain labeled choline was 0.55% while that of the methyl labeled choline was 0.48% (Table 24). Although these values indicated some possible incorporation of chain labeled choline into plasma, and, the methyl group appeared to be incorporated readily into whole blood or body tissue, these values were not significant .! At this point, no further explanation can be advanced.
Increasing time intervals from five to 17 minutes significantly affected activity in plasma for the methyl labeled isotope when tested using a multiple range test. The percent dosage at five minutes was 0.33% while that activity at 17 minutes was 0.62%. The chain labeled isotope was unchanged. A similar increase in percent dosage has been noted for the methyl isotope in whole blood.
These values may reflect a difference in tissue reaction rates in that the methyl label was theoretically more rapidly incorporated into metabolic products and passed to the blood for transport than was the chain label as previously discussed for whole blood.
A diet by isotope interaction was evident upon data analysis (Table 24). Indications were that a substantial increase in percent activity of the chain label
occurred over that of the methyl labeled isotope with highest activity (0.81%) occurring in plasma of hens injected with the chain label and maintained on the 5729 mg diet. Activity values were somewhat constant between isotopes of the other two diets (595 and 1910 mg diets).The high activity found at the high dietary level and due to the chain labeled choline is possibly the cause of the significant interaction obtained.
Liver choline activity: The ability of the liver tosynthesize and store choline has been established. It was therefore of interest in this trial to determine the amount of choline and rate of choline incorporation into liver by analyzing liver homogenates obtained from hens fed three levels of dietary choline. Table 22 represents the analysis of variance of labeled choline. Mean values are illustrated in Table 25.
When levels of dietary choline were varied, significant differences in isotope activity of liver homogenates were noted. A Duncans multiple range test showed significant differences between the supplemental diets with 1910 and 5729 mg/kg of choline. Mean values were 6.72, 6.44 and 9.63% of the total activity of injected isotopes (Table 25). A trend, similar to that of whole blood and plasma, indicated highest activity in hens maintained on a

TABLE 25
LIVER CHOLINE ACTIVITY DUE TO RETENTION OF ISOTOPESOF CHOLINE - TRIAL III
Choline Per iod 1Label (minutes) 595 1910 ̂ 5729 MeanPercent dose in total liver
1 ,2-C14 52 6.89 6.50 13.46 8.95a173 2.23 5.21 9.82 5.75b
Mean 4.56 5 .86 11.64 7.09
ch3c L4 52 10.79 6.27 7.35 8.14a173 6.97 7.76 7.89 7.54a
Mean 8 . 8 8 7.02 7.62 7.84
Overall Mean4 6.72a 6 .44a 9.63b 7.47
"*■ Dietary choline level (rag/kg) .2 Mean value for two 5 minute intervals (8.55%).3 Mean value for two 17 minute intervals (6.65%).4 Values having different superscripts are statistically
different (P<0.05).
85

86dietary choline level of 5729 mg/kg. These data indicated that the hen, having a readily available choline source (in the ration) could possibly be storing excess choline in the liver.
Activities of the chain and methyl isotope ranged from 7.09 to 7.84% respectively. These activities were not significantly different. When the data (Table 20) were examined there was seemingly a greater tendency for apparent choline synthesis at the lower dietary choline levels. Apparently, little or no synthesis occurred at the two highest levels of dietary choline. High activities were recorded in whole blood, plasma and liver tissues at highest levels of dietary choline but these activities were not always significant. However, since adequate choline was probably supplied by the ration, it would not seem unreasonable to assume that more of the labeled choline activity, after metabolism and dilution had occurred, would remain either in.circulation or be stored in liver or carcass tissue.
Also, if a dilution effect were considered, it could possibly be stated that a greater dilution of the methyl label occurred with respect to the chain label. This would thereby result in a decreased liver activity due to removal of the chain label group.
Statistical analysis demonstrated no effects due

87to two time intervals with respect to liver activity. A 20 to 68% decrease in the chain label in the liver with time was noted, while only in the lowest dietary choline group was there a substantial decreased activity between 5 and 17 minutes in hens injected with the methyl label, this amounted to a 35% loss in hens fed the 595 mg choline diet. The decreased activity obtained at the 595 mg level is probably responsible for differences noted in both isotopes.
These data may reflect the extent of possible reactions of choline in addition to the above mentioned dilution effects. it would appear that those reactions which result in demethylation tended to cause a retention of the methyl groups within the liver, although this label increased in blood with time. The chain label was decreased with time in each instance and may be the result of the more numerous reactions which may tend to retain the chain intact.
It may be that the products of demethylation which involve the incorporation of the methyl group are readily transferred to blood, and remain as protein; while the chain label participates in additional equilibria in that the blood concentration remains unchanged while the liver level is depleted. This may be visualized as being phospholipids which are accumulated in the ovary

{egg yolk). A definite isotope by diet interaction was present and data are shown in Table 25. The effect appeared to be due to activity trends of the two isotopes. While activities of the chain label isotope increased in liver as dietary choline levels were increased, activities due to the methyl label remained approximately the same. These observations seem to explain the significance obtained from this interaction term. Liver homogenate activity of the chain label appeared to be highest at the highest level of dietary choline fed (5729 mg/kg).
These data appear to support the opening statement of liver choline activity which indicated the liver as a storage organ for choline. Rather than remain in circulation, some of the isotopes may have been filtered and stored in or distributed (diluted) throughout the liver.
Kidney Choline Activity: It was felt that intact cholineor its metabolic constituents in the blood stream, if not absorbed by body tissues and oxidized to produce other constituents (glycine, C0 2 » betaine, etc.), might possibly be filtered into the kidneys and eliminated by the hen.If this were the case, an accumulation of actively labeled choline in kidneys could be created by blockage of urinary

89 1passages leading into the cloaca. Table 26 represents percent activity in kidney homogenates. When these data were analyzed statistically (Table 22), no differences in activity due to dietary choline levels were noted.These results left the possibility of oxidation or the hen was storing excess choline rather than eliminating it from the body.
Differences due to isotopes were present when these data were analyzed statistically (Table 22). A Duncans multiple range test indicated the difference (Table 26) was due to the higher activity (1.48%) of the methyl label found in kidney over that of the chain isotope (0.81%). If one considers the dilution effect of the methyl labeled carbon over that of the chain labeled carbons, and if we also consider the pathway of methyl elimination as being primarily through the kidneys while that major pathway of chain label is through egg as phospholipid or as storage, then, we might expect the higher activity obtained using the methyl labeled carbon of choline. Greater methyl labeled activity was present when whole blood was analyzed. Therefore, since blood is circulated through the kidneys it would not seem unreasonable to expect a greater activity of methyl labeled carbon in the kidney.
When time intervals were either 5 or 17 minutes,

TABLE 26
KIDNEY CHOLINE ACTIVITY DUE TO RETENTION OP TWO ISOTOPES OP CHOLINE - TRIAL III
CholineLabel
Period(minutes) 1595 1910 1 1 5729 Mean4
/ Percent dose in total "kidney1,2-C14 52 0.85 1.07 0.69 0.87
173 0.67 0.99 0.61 0.76
Mean 0.76 1.03 0.65 0.8ia
CH3-C14 52 1.29 0.84 1.09 1.07173 1.05 1.91 2.75 1.90
Mean 1.17 1.37 1.92 1 .43k
Overall Mean 0.97 1.20 1.28 1.14
Dietary choline level (mg/kg).2 Mean value for two 5 minute intervals (0.97%).3 Mean value for two 17 minute intervals (1.28%).4 Values having different superscripts are statistically
different (P<0.05).
90

91no differences in tagged carbon activity was noted. There was an increased activity resulting from the methyl labeled carbon after 17 minutes but this increase was not statistically significant.
Muscle Choline Activity; Analyses were conducted to determine differences in labeled choline incorporation into muscle protein. A portion of the right pectoralis muscle was taken for these analyses. Due to difficulties encountered in dilution of the muscle tissue samples, reproducibility was altered tremendously. Therefore, the values obtained (Table 27) and their subsequent statistical analysis in Table 22 were considered as/representative as to the effects of the labeled choline in carcass levels.
Activity in liver free amino acids: In the Materials andMethods section the free amino acid separation and combustion techniques were discussed. Due to high activityobtained in liver homogenates in Trial III, this author
14was curious as to the incorporation of C of choline14into amino acids, if any, or of C metabolites of choline
in several free amino acids in liver homogenates. However, after separation of the free amino acids and measurement of isotope activity, no activities were obtained. Therefore, further analysis was not pursued. To obtain measurable isotope incorporation of either the chain or methyl labeled

TABLE 27
MUSCLE CHOLINE ACTIVITY DUE TO RETENTION OF TWO ISOTOPES OF CHOLINE - TRIAL III
CholineLabel
Period(minutes) 5951 19101 57291 Mean
Percent dose in total muscle1 ,2-C3-4 5 1.99 1.55 1.39 1.64
17 0.51 0.17 0.06 0.25
Mean 1.25 0.86 0.72 0.94
ch3 -c14 5 0 0 0 0
17 - . 0.27 0 . 1 1 0 . 1 1 0.16
Mean 0.13 0.05 0.05 0.08
Overall Mean 0.69 0.45 0.38 0.51
1 Dietary choline level (mg/kg).
92

93choline into liver free amino acids, it would appear that time intervals somewhat longer than the 17-minute intervals used in Trial III would be required.

SUMMARY
In two trials choline requirements of laying White Leghorn hens as measured by egg production, feed consumption, and liver lipid content were studied. In a third trial, two labeled isotopes of choline (1, 2 - c ^ and CH^-C"^} were used in an attempt to study choline distribution in whole blood, plasma, liver, kidney and muscle tissue and in liver free amino acids.
Trial I (Part 1)In Trial I, total dietary choline levels of 595,
955, 1910, 3819 or 5729 mg/kg of diet were fed to hens from 21 to 53 weeks of age. Dietary choline levels did not alter egg production over the experimental period which led to the conclusion that not more than 595 mg/kg of dietary choline was required by laying hens to maintain production. Analysis of egg production data showed significant differences in egg production between 28-day periods.
A multiple range test revealed that the significant differences between periods was partially due to the very low egg production obtained during the first 28-day period. This is expected in young pullets just coming into production
94

95at 21-22 weeks of age and follows the normal egg production curves. Production reached a peak at approximately 37 weeks and gradually declined. The average egg production for periods was 55.6%.
It was postulated that the interaction between periods and treatments was probably the result of hens fed the lowest dietary choline level peaking one period later than "hens fed higher levels. Also# hens on the two highest treatments (3819 and 5729 mg/kg) peaked essentially two periods earlier than hens fed 595 mg/kg of dietary choline. These factors may have influenced the significant interaction obtained.
A significant difference was noted in feed consumption when various levels of dietary choline were compared. Significant consumption occurred in hens fed 5729 mg/kg of dietary choline. Since no changes in egg production occurred and since weight gain did not appear to be a factor, an explanation for increased consumption at highest dietary choline levels was not advanced. Feed consumption among the other treatments remained unchanged. Since normal feed consumption is approximately 90-100 gm/hen/day it was felt that the low consumption rate obtained in this trial was due to the diet which was semi-purified and high in energy content.
Significant differences in feed consumption during

different periods were evident when these data were statistically -analyzed. Average feed consumption in Trial I was 72.6 gm/hen/day. Data indicated a lower intake of choline during the initial periods as compared to the latter ones. It was during periods 4-5 that highest feed consumption, averaging 85.4 gms/hen/day, was observed. Due to increased egg production during these same .two periods, it was concluded that hens consumed more feed due to increased production. An interaction between periods and treatments in the amount of feed consumed can be explained by the fact that hens fed the 595 mg diet consumed greatest amounts of feed one period later than those fed higher levels of choline.
As dietary choline levels were increased from 595 to 1910 mg/kg, a corresponding increase (from 23.1 to 26.9%) in liver lipid was observed which was not statistically significant. However, at the two highest (3819 and 5729 mg/kg) dietary choline levels, and the 595 mg level, a decrease to 19.3 and 20.8% lipid was noted.These data indicated that two of the lowest dietary choline levels (955 and 1910 mg/kg) were not supplying sufficient choline to permit minimum lipid levels to the hen resulting in a decreased movement of lipid from liver. The two highest levels probably were adequate in choline to permit this lipid movement. No explanation for the low

97liver lipid content of hens fed the 595 mg diet is apparent.
Trial I (Part 2)A second phase of Trial I involved determinations
of choline in carcass, liver, egg yolk and excreta as influenced by dietary choline levels.
The average choline concentration in yolk was 24.7 mg/gm of dry yolk or 12.35 mg/gm of wet yolk. Dietary levels of choline did not affect choline content in egg yolk, indicating the metabolism of the hen is such as to control deposition of choline to the yolk even though large amounts may be present in the dietary regimen.Choline content in egg yolk varied over the eight experimental periods. Highest yolk choline occurred during periods 3-7. Egg production and feed consumption was highest during periods 4-5. The hens apparently eliminated choline by putting it into egg yolk rather than storing it in body tissue. Lower dietary choline intakes were probably utilized more efficiently in early periods than at later periods.
An interaction between periods and treatments was explained on the basis of increased yolk choline over all treatments which occurred after period four. The exception was a decreased content in yolk of hens fed 595 mg/kg of dietary choline.

98Analysis of liver choline concentration showed a
choline content of 4.6 mg/gm of dry weight or 1.4 mg/gm of wet weight. Although varying the dietary choline content of the rations, this did not alter the choline content in liver. There was a real difference among periods, however. Period one had lowest liver choline content while the content peaked during periods 4-5.Similar reults were previously noted in egg production, feed consumption and yolk choline concentration. Since no differences in dietary choline levels were found, it was concluded that higher or lower levels of dietary choline than was tested in these experiments may be required to produce changes in the liver choline concentration.
Carcass choline analyses indicated an increased choline content during periods 4-6 and a decreased content in period seven of Trial I. The increase tends to coincide with the maturation pattern of the hen. Since significant amounts of choline were secreted during periods of efficient choline utilization and deposition in egg yolk, feed intake and choline utilization during these periods may explain the variations in carcass choline content. Increased carcass choline concentration occurred xegard- less of dietary choline intake. Since this increase also occurred during periods of high feed intake, it was concluded

that the metabolism of the hen, and not the dietary intake of choline, was controlling choline deposition in carcass tissue. High levels of carcass choline in period four of the 595 mg diet, high levels of choline during periods 5-6 of the 3819 mg diet or, extremely low values obtained during the seventh period of all treatments may be responsible for the interaction between periods and treatments obtained in Trial I. The average carcass choline content of 2.2 mg/gm of dry weight may overestimate the choline content of carcass tissue, since the entire hen (minus liver), including ovaries and undeveloped eggs was ground and samples taken from this source.
Trial II (Part 1)Trial II was designed to measure effects of high
(1910 mg/kg) or low (595 mg/kg) dietary choline levels fed young pullets before and after the onset of lay. Criteria were egg production, feed consumption and liver lipid content.
There was no significant effects on egg production when pullets were fed high or low choline diets with or without switching at the o c of lay. There were significant differences between 28-day periods* Again, as in Trial I, period differences were due to low egg production during the first period. The two peak egg production

100periods 2 and 7, and the low production during period one were possibly responsible for the significance obtained in egg production. The average egg production was 60.8% which was approximately 5% higher than egg production in Trial I. Since pullets in Trial II came into production at the beginning of the mild spring periods encountered, this may be responsible for the 5% higher egg production of Trial II over that of Trial I.
Significant differences among periods, treatments and replications were noted when feed consumption dafcawere analyzed statistically. Highest feed consumption
)occurred one period before highest egg production was noted. Hens switched from 595 to 1910 mg dietary choline consumed 6 gms more feed than hens on the other treatments. Average feed consumption was 76.8 gms/hen/day. The hens' ability to adjust to switching of diets appeared to be impaired if they had to adjust to a lower dietary choline intake. Hens maintained on diets of 595 or 1910 mg/kg had feed intakes which were not significantly different from one another.
No differences in liver lipid content were noted when pullets were fed two levels of dietary choline. Hens fed 595 or 1910 mg of dietary choline had average liver lipid contents of 27.8 and 27.3% respectively. While hens switched from 595 to 1910 mg of dietary choline contained

a liver lipid percentage of 26.6, hens fed the 1910 rag diet and switched to the 595 rag diet had a liver lipid content of 28%. The only significant differences found in liver lipid analysis were among periods. Lipid contents from periods 0-4 were similar with a sharp increase during the third period and a subsequent non-significant decrease. The significant increase during period five might be one probable cause of significance among periods. Due to increase feed intake, which results in increased choline consumption, during period four, it would seem reasonable to assume a greater mobilization of liver lipid during intervals of high choline intake. Since feed consumption decreased in period five, a movement of liver lipid back into the liver tissue would not seem unreasonable. Liver lipid content among periods was somewhat consistent with choline values found in yolk, liver and carcass tissues.The ability of choline to enhance lipid movement may besuggested by data obtained from liver lipids.- A lower liver lipid content was obtained in two similar treatments in Trial I (595 and 1910 mg/kg).
Trial :ri (Part 2)In the second phase of Trial II choline concentra
tions in egg yolk, liver and carcass tissue were measured to determine the effect of low or high dietary choline
102levels fed to ten-week-old pullets and switching these diets at 21 weeks of age. Switching choline levels from 595 to 1910 mg of dietary choline or from 1910 to 595 mg at the onset of lay did not alter choline concentrations in egg yolk. The average yolk content was 12.6 mg/gm of wet weight. A highly significant difference between periods was observed showing a low in yolk choline content during periods 3-6. Highest yolk choline occurred during periods 1-2. When Trials I and II were compared, yolk choline content of hens fed dietary levels of 595 or 1910 mg/kg were similar. Highest levels were present in either trial during the months of February-March and steadily decreased.
No changes were noted in liver choline content when dietary choline levels were varied. Analysis did indicate a significant reduction in liver choline as periods progressed. This reduction was obvious when periods 4-6 {periods of liver choline reduction) were compared to periods 2-3 (periods of highest liver choline content). The overall choline content in liver was 4.8 mg/gm of dry weight.
When dietary choline levels of 595 or 1910 mg were maintained during the rearing and laying period or switched at the onset of lay, statistical differences in carcass choline concentrations were not obtained.
103Choline content in excreta was too small to be
measured accurately and excretion therefore was not considered as a major pathway for choline elimination.
Data indicated that the laying hen apparently has the ability to synthesize choline in quantities sufficient to meet metabolic needs for this vitamin. At two high levels of dietary choline (3819 and 5729 rag/kg) synthesis was not demonstrated. The conclusion drawn was that dietary choline adequately supplied the nutritional needs for choline at high dietary levels and thereby eliminated the need for apparent synthesis in laying hens. Values for the 595 and 1910 mg diets of Trial I and XI closely approximated one another. Data indicated the ability of the hen to form choline, in that hens fed 595 mg dietary choline synthesized sufficient choline to maintain body needs. It would seem reasonable to assume that sufficient dietary choline was not supplied in relation to synthesis. Hens maintained on two treatments (595 and 1910 mg/kg) demonstrated an'apparent choline synthesis similar to that of corresponding treatments in Trial I. It was determined from the data that hens could synthesize approximately 180 mg choline/hen/day.
Trial IIIAfter choline concentration in liver, egg yolk and

104carcass were established, the distribution of labeled
1 £l 1*4choline (1, 2-c and CH3-C ) in hens fed dietary choline levels of 595, 1910 or 5729 mg/kg was studied. Activities in whole blood, plasma, liver/.kidney and muscle homogenates were the criteria used. Activity in liver free amino acids was also measured.
When hens were fed the above diets, isotope activity in whole blood (expressed as percent of the total dosage) was 0.77, 1.21 and 1.15% respectively. Analysis of the data indicated the effect to lie between the low (595 mg) diet and the two higher diets. Hens maintained on a low choline dietary regimen exhibited an initial rapid disappearance of either labeled isotope from the blood stream. The rate of disappearance of the chain labeled choline from the blood stream appeared to be faster than that of the methyl label. The values were 0.89 and 1.21% of the total injected dosage. A rapid recycling, dilution and transfer of the methyl label isotope to blood was indicated whereas, the chain label was probably incorporated into phospholipid to be deposited in egg yolk or body tissue. When the two time intervals (five or 17 minutes) were compared, the resulting mean values of 0.93 and 1.16% of the total injected dosage proved to be significant.
A higher percent of activity due to the injection

105of methyl choline (1.32%) over that of the injected chain labeled choline (0.99%) was measured in whole blood of hens fed a dietary choline level of 5729 mg/kg diet. Whole blood activity measured after a five minute injection was highest in hens fed the 5729 mg diet, while those hens fed the 1910 mg diet and their blood activity measured had highest activity after a 17 minute injection.Apparently the lower dietary intake of choline resulted in the lower level of the label in whole blood emphasizing the hens need of choline under possible choline stress conditions.
As levels of dietary choline were increased in the diet of laying hens, the percent activity of injected labeled choline in plasma was increased. The percent activity in plasma of hens fed the three diets was as follows: 595 mg (0.35%) , 1910 mg (0.48%) and 5729 mg(0.68%). The hens need for choline was apparently increased when low levels of choline were fed. A difference in time intervals revealed that the activity at 5 minutes was much lower than the activity at 17 minutes of either isotope. These values again indicate the rapid disappearance or reabsorption of the injected isotopes between the circulatory system and body tissues.
In every instance, highest isotope activities were obtained when hens were fed the highest choline level

106(5729 mg). Activity of the chain labeled group did not vary as time intervals increased from 5 to 17 minutes at highest dietary choline levels but, increasing time intervals did affect plasma activity in hens fed 595 mg of dietary choline and injected with methyl labeled choline.
Analysis of labeled choline in liver homogenates indicated differences in liver activity in hens fed the 1910 or the 5729 mg diet with highest activity from hens fed the 5729 mg diet. The data suggested that the hens having readily available choline in the diet could possibly be storing excess choline in the liver. No effect in liver choline activity was recorded due to the two isotopes injected.
Effects from two time intervals were noted in that a 20-68% decrease in the chain label occurred as time was increased. In only one instance (595 mg) did a decrease in the methyl label choline occur. These results may explain the reason for the significance obtained.
Intact choline or its metabolic constituents which may be normally present in the blood stream was thought to be for the most part secreted into the kidneys and finally eliminated from the hen. Differences in activity due to dietary choline levels were not observed. The possibility that hens were storing excess choline rather than

107eliminating it from the body was suggested. A decreased activity of chain labeled choline in kidney of hens fed the 5729 mg diet over that activity of hens fed 1910 mg of dietary choline was present. This decrease was not significant. A significant difference in isotopes indicated by a higher activity (1.48%) of the methyl label as compared to only 0.81% of the total dose of the chain-'label was present in kidney tissue. The dilution of the methyl group in body tissue, and its subsequent passage through the kidney as a metabolic constituent in blood, may explain the difference obtained.
Dilution difficulties encountered in preparationi ' m -of muscle tissue homogenates made it,(possible to draw
conclusive statements concerning the activity of chain or methyl labeled choline in muscle tissue.
Finally, an attempt to measure incorporation of two isotopes into liver free amino acids was made. Time intervals of 17 minutes were not sufficient to measure isotope incorporation into these amino acids. It was suggested that longer intervals be used to obtain data that would be of statistical value.

CONCLUSIONS
The following conclusions seem warranted from these studies:(1) Feeding choline levels of 595, 955, 1910, 3819 or
5729 rag/kg in the dietary regimen of hens throughoutthe laying period did not affect egg production.
(2) A choline level of no more than 595 mg/kg of dietary choline was sufficient to maintain egg production under conditions of these trials.
(3) Hens fed dietary choline levels of 3819 or 5729 mg/kg had the metabolic ability to control the output of choline irrespective of dietary concentrations.Apparent synthesis was observed at lower dietary choline levels.
(4) While liver lipid content in one trial was decreasedwhen choline levels above 3819 mg were fed, increasingdietary choline levels from 595 to 1910 mg/kg indicated ineffectiveness in reducing liver lipid content in another trial.
(5) Choline content in egg yolk, liver or carcass tissue was not altered by different dietary choline levels.The data correlates with maturation processes and appears to be independent of dietary choline within the imposed limits of these experiments.
108

109(6 ) Increasing dietary choline levels in hens from 595 to
5729 mg/kg resulted in an increased activity of 1, 2-c14-choline and CH3-C14-choline in whole blood, plasma and liver tissues. Apparently, the lower dietary intake of choline which resulted.in the lower level of label in blood and plasma might emphasize the hens' need for choline under certain conditions. An initial rapid disappearance of choline labeled in chain or methyl carbons from the tissues studied was shown in hens maintained on a low choline diet. The chain labeled carbons disappeared at a faster rate than the methyl labeled carbons.
(7) Increasing time intervals from five to 17 minutes after isotope injection resulted in an increased methyl isotope activity in plasma after 17 minutes. Erythrocytes may be diffusing the methyl label into the plasma in a different molecular form more readily at the 17- minute interval.
(8 ) As time was increased from five to 17 minutes, chain labeled activities in liver homogenates was decreased. The rapid metabolism in this organ and distributionof the chain group into phospholipids may be responsible for these findings.
(9) Increasing dietary choline did not increase kidney carbon-14 activity which indicates that intact choline

110is not eliminated to any great extent through this route. The chain label was probably stored (as phospholipid) or eliminated by other means (egg yolk, carbon dioxide, etc.) and the methyl group was probably metabolized, becoming a normal constituent of whole blood.
(10) Differences in liver free amino acid activities were not present when isotope activities were measured after five of 17 minutes. it was concluded that a time interval of more than 17 minutes may be required before activity in these constituents could be analyzed.
V.

SELECTED REFERENCES
Ackerman, C. J . , and M. Chow, 1960. A sensitive analytical method for choline. Anal. Biochem. 1:327-336.
Ackerman, C. J., and w. D. Salmon, 1960. A simplified and specific method for the estimation of choline. Anal. Biochem. 1:337-343.
Alexander, R. D. and H. E. Sauberlich, 1957. The influence of lipotropic factors on the prevention of nutritional edema in the rat. J. Nut. 61:329-341.
Anonymous, 1965. Liver lipid fatty acids in choline deficiencies. Nutr. Rev. 23:345-346.
Atrom, C . , 1960. Mechanism of action of choline. Am. J. Clin. Nutr. 8:303-305.
Atrom, C . , 1958. Role of choline in the hepatic oxidation of fat. Am. J. Clin. Nutr. 6:221-234.
Banson, B. B., W. S. Hartroft and L. Recant, 1961. Effectof choline on amino-nucleoside nephrosis in rats: Effect of proteinuria on fatty liver of choline- deficient rats. Fed. Proc. 20:288.
Best, C. H., J. M. Hershey and M. E. Huntsman, 1932a. The control of the deposition of liver fat. Am. J. Physiol. 101:7.
Best, C. H., J. M. Hershey and M. E. Huntsman, 1932b. The effect of lecithin on fat deposition in the livers of normal rats. J. Physiol. 75:56-58.
Best, C. H., and J. H. Ridout, 1939. Choline as a dietary factor, Ann. Rev. Biochem. 8:349-370.
Booth, A. N., D. J. Robbins and F. DeEds, 1961. Effect of dietary gallic acid and pyrogallol on choline requirement of rats. J. Nutr. 75:104-106.
Branchi, G. and G. F. Azzone, 1964. Oxidation of choline., in rat liver mitochondria. J. Biol. Chem. 239:3947- 3955.

112Campbell, I.-, G. J. Olley and M. S. Swett, 1949. The
effect of dietary oleic and palmitic acids on the composition and turnover rates of liver phospholipids. Biochem. J. 45:105-108.
Couch, J. R., 1966. Antimicrobial agents can help intackling the fatty liver problem. Reprint from Feed Management.
Daghir, N. J. and S. L. Balloun, 1961. influence of fats and choline on liver and serum cholesterol in the chick. Poultry Sci. 40:1712-1717.
Day, E. J. and B. C. Dilworth, 1966. Effects of supplementing laying rations with certain B-complex vitamins. Brit. Poult. Sci. 7:99-103.
Dils, R. R. and G. Hubscher, 1961. Metabolism of phospholipids. II. The effect of calcium ion on the incorporation o f •labelled choline into rat liver microsomes. Biochem.et Biophys. Acta. 46:505-513.
Dixon, K. C., 1958. Fatty deposition: A disorder of thecell. Quart. J. Exptl. Physiol. 43:139-159.
Eric, A., E. A. Glende, Jr., and W. E. Cornatzer, 1965. Fatty acid composition of rat liver lipids during choline deficiency. J. Nutr. 86:178-186.
Ewing, R. W., 1963. Poultry Nutrition, The Ray Ewing Co., Pasadena Calif., 5th Ed.
Featherson, W. R. and E. L. Stephenson, 1960. Dietaryinterrelations between methionine, glycine, choline, protein level and energy content of the chick diet. Poultry Sci. 39:1023-1029.
Fritz, J. C., 1965. Determination of total choline in feeds. J. Assc. Off. Agr. Chem. 48:1221-1223.
Gillis, M. B. and L. C. Norris, 1949. Effect of the animal protein factor on the requirement of methylating compounds. J. Biol. Chem. 179:487-488.
Gillis, M. B. and L. C. Norris, 1951. The effect of vitamin B 12 on the response of chicks to betaine and choline.J. Nutr. 43:295-302.

113Griffith, W. H. and,N. J. Wade, 1939. Some effects of low
choline diets.- Proc. Soc. Exp. Biol. Med. 41:188- 190.
Harper, A. E., 1958. Nutritional fatty livers in rats.Am. J. Clin. Nutr. 6:242-253.
Holmes, C. E. and C. Y. Kramer, 1965. Vitamin B]_2 / choline and methionine in laying diets. Poultry Sci. 44:1381.
iwamoto, A., E. E. Hellerstein and D. M. Hegsted, 1963. Composition of dietary fat and the accumulation of liver lipid in the choline-deficient rat. J. Nutr. 79:488-492.
Langer, B. W. Jr., and F. H. Kratzer, 1964. Labile methyl group biosynthesis in the turkey poult. I. Dietary methionine, choline and vitamin B ]_2 anc ̂ their effect on growth and methyl group biosynthesis in. vitro. Poultry Sci. 43:127-135.
Leach, R. M. Jr., E. Ceballos and M. C. Nesheim, 1966.Recent studies on choline requirements of chicks and hens. Proc. 1966 Cornell Nutr. Conf. for Feed Manufacturers, pp. 69-72.
Leach, R. M. Jr., L. C. Norris and M. L. Scott, 1962. The effect of diethylstilbestrol on choline deficiency in the chick. Poultry Sci. 41:1829-1832.
Lim, F. and E. D. Schall, 1964. Determination of choline in feeds. J. Assc. Off. Agr. Chem. 47:501-503.
Lucas, H. L., L. C. Norris and G. F. Heuser, 1946a.Observations on the choline requirements of hens.
1 Poultry Sci. 25:373-375.Lucas, H. L., L. C. Norris and G. F. Heuser, 1946b.
Further evidence for methylatable percursors of choline in natural materials. Proc. Soc. Exp. Biol. Med. 63:32-33.
Lust, G . , and L. J. Daniel, 1964. Function of vitamin B-^ in choline methyl group biosynthesis (Ochremmas Protozoa). Fed. Proc. Abstr. 45:1068.
March, B. and J. Biely, 1956. Fat studies in poultry. 5.The effect of dietary fat level on the choline requirement of the chick. Poultry Sci. 35:545-549.

114Minon, K. K., and C. C. Lucas, 1961. Effects of dietary
methionine and vitamin B-^ on the net synthesis of choline in rats. Can. J. Biochem. Physiol. 39:683- 689.
National Academy of Sciences. National Research Council,1966. Nutrient requirements of poultry. Pub. 1345. Washington, D. C.
Neshei-m, M. C., R. M. Leach, Jr., and M. J. Norvell, 1967.The effect of rearing diet oh choline deficiency in hens. Proc. Cornell Nutr. Conf. for Peed Manufacturers, pp. 57-60.
Nesheim, M. C., E. Ceballos, R. M. Leach and M. J. Norvell,1967. The effect of dietary choline on growth in pullets, and subsequent effects on egg production and liver lipid. Poultry Sci. 46:1299.
Norris, L. C. and G. F. Heuser, 1945. Water-soluble vitamins. Ann. Rev. Biochem. 14:494-497.
Olson, R. E., J. R. JobIonshi and E. Taylor, 1958. The effect of dietary protein, fat and choline upon the serum Lipids and lipo-protein of the rat. Am. J.Clin. Nutr. 6:171-178.
Rennick, B. R., 1958. The renal tubular excretion of choline and thiamine in the chicken. J. Pharm.Exptl. Therap. 122:449-456.
Rikans, L. L., D. Arata and D. C. Cederquiost, 1965.Fatty livers produced in albino rats by excess niacin in high fat diets. II. Effect of choline, supplementation. J. Nutr. 85:107-112.
Ringrose, R. G. and H. A. Davis, 1946. Choline in thenutrition of laying hens. Poultry Sci. '25:646-647..
Rogene, F., and R. F. Henderson and T. R. Henderson, 1966. Vitamin B^2 an(̂ t*16 synthesis of thiamine and choline in the chick. J. Nutr. 88:151-156.
Saloma, A. E., C. R. Cregar and J. R. Couch, 1965. Effect of feeding various levels of fat and choline chloride to laying hens. Poultry Sci. 44:1411.
Sinclair, H. M . , 1964. Nutrition, a comprehensive treatise; Macronutrients and nutrient elements. Academic Press, N.Y. 1:90-91.

115Smith, G. N., P. D. Ludwig and K. C. Wright, 1964. Simple
apparatus for combustion of samples containing labelled pesticides for residue analysis.. The Dow Chemical Co., Midland, Michigan. J. Agr. Food Chem. 12:172-175.
Spinco Division, Beckman Instruments Inc., Stanford Industrial Park, Palo Alto, Calif. April, 1966. Preparation of samples for analysis, Sec. 6 , Model 120C manual.
Srivastava, U. A., and N. K. Sardas, 1965. Biochemical changes in progressive muscular dystrophy. III. Nucleic acids, phosphorus and creatine metabolism -in the muscle, liver and brain of rabbits maintained with a choline deficient diet. J. Nutr. 86:298-302.
Stein, W. H. and S. More, 1954. The free amino acids of human plasma. J. Biol. Chem. 211:915-926.
Sterkol, J. A., S. Weiss, F. Smith and K. Weiss, 1953..The synthesis of choline and creatine in rats under various dietary conditions. J. Biol. Chem. 201: 299-316.
Stetten, D . , Jr., and J. Salceda, Jr., 1945. The effect of chain length of the dietary fatty acids upon the fatty liver of choline deficiency. J. Nutr. 29:167- 170.
Strecker, A., 1862. zinn-athylverbind (Stannous ethyl compounds). Ann. Chem. 123:353-359.
Vohra, P. B., W. Langer Jr., and F. H. Kratzer, 1960.Methyl acceptors for biosynthesis of choline.Poultry Sci. 39:626-630.
Wells, I.e. and C. N. Ramsy, 1961. Biosynthesis of choline in rat liver homogenates. Fed. Proc. Abst. 20:281.
White, A., P. Handler and E. L. Smith, 1964. Principles of Bio chemistry. McGraw and Hill, New York., Third Edition.
Winswer, S. J., S. A. Breitmare, l . S. Cottlieb and N. Zamchick, 1965. The serum and liver amylase and transaminase activities in choline deficiency fatty ,liver and cirrhosis. Gastroenterology 48:216-225.

116Wise, E. M. Jr., and D. H. Elwyn, 1963. Rate of synthesis
of ethanolamine and choline in rat organs. Fed. Proc. 22:22498.
Yoshida, A. and A. E. Harper, 1960. Effect of threonine and choline deficiencies on the metabolism of C 14 labeled acetate and palraitate in the intact rat.J. Biol. Chem. 235:2586-2589.
Young, R. J., £,. C. Norris and G. F. Heuser, 1955. Thecnick's requirement for folic acid in the utilization of choline and its precursors, betaine and methy- laminoethanol. J. Nutr. 55:353-362.

AUTOBIOGRAPHY
I was born March 15/ 1941, in Houma, Louisiana, the son of Glynn Graves and Lillian Lear Crawford, we moved to Belle Chasse, Louisiana, a few years later where I was graduated from Belle Chasse High School in May, 1959. I entered Louisiana State university in September of 1959, and transferred to Northwestern State College, Natchitoches, Louisiana, in September, 1960. I received a Bachelor of Science degree from Northwestern State College with a major in Animal Husbandry in June,1963.
On August 3, 1963, I was married to Patricia Ann Evans, of Montgomery, Louisiana.
In September, 1963, I was admitted to the Graduate School of Louisiana State University and received an assistantship in the Department of Poultry Science. I received the Master of Science degree in Poultry Nutrition in January, 1967. I have pursued a curriculum leading toward a Doctor of Philosophy degree with a major in Poultry Nutrition and a minor in the field of Biological Chemistry.
117

EXAMINATION AND THESIS REPORT
Candidate:
Major Field:
Title of Thesis:
James Sidney Crawford
Poultry Nutrition
Choline Requirement, Distribution and Concentration in Laying Hens
Approved:
Major Professor and Chairman
Dean of the Graduate School
EXAMINING COMMITTEE:
C O - Q - ______
______________
Date of Examination:
J u l y 3 , 1 9 6 8