chlorophyll a fluorescence induction kinetics in leaves predicted from a model describing each
TRANSCRIPT

Chlorophyll a fluorescence induction kinetics in leaves predicted from a model
describing each discrete step of excitation energy and electron transfer associated
with Photosystem II
Xin-Guang Zhu1, Govindjee2, Neil Baker3, Eric de Sturler4, Donald R. Ort5,
Stephen P. Long1
1. Department of Plant Biology and Crop Sciences, University of Illinois at
Urbana Champaign, 379 Madigan Laboratory, 1201 W. Gregory Drive,
Urbana, IL, 61801
2. Department of Plant Biology and Department of Biochemistry, 265 Morrill
Hall, 505 S Goodwin Ave, Urbana, IL 61801 USA
3. Department of Biological Sciences, University of Essex, John Tabor Labs,
Colchester, Essex CO4 3SQ England
4. Department of Computer Science, 4314 Thomas M. Siebel Center for
Computer Science, University of Illinois at Urbana Champaign, IL 61801 USA
5. Department of Plant Biology, University of Illinois at Urbana Champaign,
USDA/ARS, 148 Madigan Laboratory, 1201 W. Gregory Drive, Urbana, IL,
61801
Corresponding Author:
Prof. Stephen P. Long
Tel: 217 333 2487
FAX: 217 244-7563
1

ABSTRACT
Induction of chlorophyll a fluorescence is widely used as a probe for studying
photosynthesis. On illumination, fluorescence emission rises to a maximum through a
series of transients, termed O J I and P fluorescence induction curve (FI). FI kinetics
reflect the overall performance of photosystem II (PSII). Although FI kinetics are
commonly and easily measured, there is a lack of consensus as to what controls the
characteristic series of transients, partially because most of the current models of FI focus
on subsets of reactions of PSII, but not the whole. Here we present a model of
fluorescence induction, which includes all discrete energy and electron transfer steps in
and around photosystem II, avoiding any assumptions about what is critical to obtaining
O J I P kinetics. This model successfully simulates the observed kinetics of fluorescence
induction including O J I P transients. The fluorescence emission in this model was
calculated directly from the amount of excited singlet-state chlorophyll in the core and
peripheral antennae of PSII. Electron and energy transfer were simulated by a series of
linked differential equations. A variable step numerical integration procedure (ode15s)
from MATLAB provided an computationally efficient method of solving these linked
equations. This in silico representation of the complete molecular system provides an
experimental workbench for testing hypotheses as to the underlying mechanism
controlling the O J I P kinetics and fluorescence emission at these points. Simulations
based on this model showed that J corresponded to the peak concentrations of QA-QB
(QA:
the first quinone electron acceptor of photosystem II; QB: the second quinone electron
acceptor of photosystem II) and QA-QB
- and I to the first shoulder in the increase in
concentration of QA-QB
2-. The P peak coincided with maximum concentrations of both
QA-QB
2- and PQH2. In addition, simulations using this model suggest that different ratios
of the peripheral antenna and core antenna lead to differences in fluorescence emission at
O without affecting fluorescence emission at J I and P. Increase inactive PSII center
increase fluorescence emission at O phase and correspondingly decrease Fv/Fm.
2

KEY WORDS: photosynthesis, chlorophyll fluorescence, model, system biology, in
silico
3

INTRODUCTION
When dark-adapted oxygenic photosynthetic cells are illuminated chlorophyll (chl) a
fluorescence shows complex induction kinetics (FI) termed the Kautsky curve, which is
characterized by a series of inflexions in the rate of rise in the fluorescence level (F)
termed the OJIP transients. Each letter denotes a distinct inflexion point; i.e. a point
where dF/dt = 0 in the induction curve. Chl a fluorescence is widely used as a probe for
different aspects of photosynthesis since fluorescence measurements are non-invasive,
highly sensitive, fast and easily conducted (Bolhár-Nordenkampf et al., 1989).
Furthermore, FI may be measured with relatively inexpensive equipment despite the
potential wealth of information generated about the primary events of photosynthesis
(Govindjee, 1995, Krause & Weis, 1991, Lazar, 1999). Since FI varies under different
stress conditions, e.g. high light and low temperatures, FI has been used in studying the
stress physiology of photosynthesis (Baker et al., 1983, Krause & Weis, 1991, Rohacek
& Bartak, 1999, Sayed, 2003).
Fluorescence induction (FI) kinetics reflect the overall performance of photosystem II
(PSII) following dark adaptation. Although FI kinetics are commonly and easily
measured, there is a lack of consensus as to the underlying mechanisms controlling the
characteristic series of transients, perhaps in part because previous models of FI do not
include all of the processes involved in excitation energy transduction and
photochemistry by PSII. For example, several fluorescence models were constructed to
study FI in the presence of 3-(3', 4' - dichlorphenyl) - 1,1 - dimethylurea (DCMU) or for
FI in low light fluxes (Lavergne & Trissl, 1995, Vavilin et al., 1998). These models
predict the performance of photosynthetic electron transfer reactions to the point of QA
reduction. Stirbet et al. (1998) calculated the fluorescence emission based on the
reduction state of QA, not directly from the amount of singlet-excited chlorophylls and
the rate constants for different energy dissipation process from singlet-excited
chlorophyll as in previous models. Strasser and Stirbet (2001) hypothesized that the
accumulation of reduced pheophytin has a key role in FI kinetics. Schreiber and Krieger
(1996) modeled variable fluorescence based on decrease in rate of primary charge
4

separation and increase in rate of charge recombination. This is modulated by changes in
the rate constant of heat dissipation, nonradiative decay to the ground state from
P680+Pheo- and spin dephasing resulting in triplet state of the radical pair. Lebedeva et al.
(2002) developed a model which simulated FI over a range of light fluxes and
incorporated the effect of membrane potentials on the rate constants of various reactions.
These two models (Lebedeva et al., 2002, Schreiber & Krieger, 1996) did not however
include the molecular mechanism of the oxygen evolution complex. A recent model
(Lazar, 2003) provided a detailed description of reactions around PSII to simulate FI.
However, neither of these models (Lazar, 2003, Lebedeva et al., 2002) included the
differentiation of core and peripheral antennas in the light harvesting complex of PSII.
Collectively, these models (Lazar, 2003, Lebedeva et al., 2002, Schreiber & Krieger,
1996, Stirbet & Strasser, 2001) developed explanations of the FI kinetics based on the
assumption that a different single process or subset of processes determines the response.
Here we use an alternative approach, in which all of the discrete steps involved in light
capture, excitation energy transfer and electron transfer associated with PSII at both the
donor side and the acceptor side are included; i.e. no assumptions are made about what
may be excluded for simplification. We then examine how alteration of individual steps
affects the simulated FI curve. In addition to using a complete description of all the
energy and electron transfer reactions, our approach describes individually the different
components associated with PSII activities, rather than representing them together as
intermediate complexes (see Fig. 1). The first objective of this study was to test whether
such a complete model can successfully simulate the FI kinetics under normal
physiological conditions, e.g. without DCMU. Secondly, this in silico representation of
the complete system was used to test hypotheses derived from previous models
underlying mechanisms controlling FI kinetics. Thirdly, the effects of changes in the rate
constants of the excitation energy and electron transfer processes associated with PSII on
FI are examined. Finally, the effects of different proportions of PSII inactive centers on
FI were examined.
5
THE MODEL AND THE ASSUMPTIONS
A schematic representation of the model is shown in Fig. 1. The whole model is
composed of the following major components: peripheral antenna system of PSII, core
antenna system of PSII, oxygen evolving complex, PSII reaction center (P680 which is the
primary electron donor of PSII), pheophytin (Pheo) which is the primary electron
acceptor of PSII, the redox-active Tyrosine of the D1 protein, one tightly bound
plastoquinone QA, and one loosely bound plastoquinone QB. Water molecules donate
electrons to P680+, while the plastoquinol pool is required to exchange with QBH2 and
transfer the reducing equivalent to the cytochrome b6f complex and provide electrons for
subsequent electron acceptors (Fig. 1).
The followings assumptions are used in our model and underlie the series of equations
given in next section :
1) Chl a fluorescence (> 80%) is assumed to be emitted from PSII complexes only.
Although PSI complexes are weakly fluorescent, variable fluorescence is attributed to
PSII only. Antenna chlorophylls however contribute to partitioning of excitation
energy (Krause & Weis, 1991).
2) The light harvesting system consists of two distinct types of pigment-protein
complexes, i.e. the PSII core antenna system and the peripheral antenna (Horton et
al., 1996). In our model, Chl a fluorescence is assumed to be emitted from
chlorophyll molecules in both peripheral and core antenna, and excitation energy in
core antenna of the closed reaction centers can migrate to the core antenna of open
reaction centers with a given probability (Deprez et al., 1990, Krause & Weis, 1991,
Joliot & Joliot, 1964).
3) The process of oxygen evolution is assumed to result from a succession of non-
interacting oxygen-evolving complexes (OEC) with sequential redox states (Forbush
et al., 1971, Kok et al., 1970). These different redox states of OEC are represented as
different S states (Sn) with the subscript indicating the number of accumulated
oxidizing equivalents or positive charges. When four oxidizing equivalents have been
accumulated, an oxygen molecule is evolved, and the S state reset to S0 and another
cycle starts. The transition between each successive state of the oxygen evolulving
6

complex requires absorption of the energy of one photon: S0 S1 S2 S3 (S4)
S0 S1 … … The positive or oxidizing equivalent is obtained from P680+ via the
tyrosine Z (Yz) of the D1 protein. This model assumes the rate constants of electron
transfer reactions from OEC to Yz+ are the same for each S redox state. Primary
charge separation occurs in the PSII reaction center, which generates P680+ and Pheo-.
An electron is transferred from Pheo- to the first plastoquinone electron acceptor QA,
which in turn reduces QB; QA is bound tightly to its site while QB is bound loosely to
its site in PSII (Velthuys & Amesz, 1974). The times for the transitions of QA-QB
QAQB- and QA
- QB- QAQB
2- are assumed to be 150 μs and 400 μs respectively
(Bowes & Crofts, 1980).
4) After QB sequentially receives two electrons from QA-, QB becomes fully reduced in
the form of QB2- which is then protonated to form QBH2. For simplicity, we have
assumed that protonation of QB2- is instantaneous. QBH2 exchanges with oxidized
plastoquinone (PQ) in the thylakoid membrane. The oxidized plastoquinone binds to
the PSII QB binding site and re-forms QB again. PQH2 in the thylakoid membrane is
oxidized through the cytchrome b6f complex (Cyt b6f). It is assumed, as in the model
of Stirbet et al. (1998) that reactions beyond Cyt b6f do not affect the fluorescence
induction curve.
5) Oxidized PQ is assumed to act as a direct quencher of excitation energy in PSII and
not simply as a photochemical quencher; the changes in the redox state of the PQ
pool (Kramer et al., 1995, Vernotte et al., 1979) and their effects on fluorescence
were included in the model.
6) A closed reaction center is defined as a PSII reaction center in which the associated
QA is reduced. Therefore the proportion of open reaction centers (q) is given by:
q = [QA]/([QA]+ [QA-]) …… (1)
The model assumes a probability parameter p as the likelihood of the migration of
excitation energy from the core antenna of a closed reaction center to that of an open
reaction center (Deprez et al., 1990, Joliot & Joliot, 1964).
7) Except where noted, all reactions in our model are described using a first order
kinetic equation, e.g. the rate of exciton transfer from the peripheral to the core
7
antenna, vAU, is calculated as: [Ap]kAU, where [Ap] is the concentration of excited
singlet-state chlorophylls located in the peripheral antenna and kAU is the rate constant
of excitation energy transfer from the peripheral to the core antenna; the reversible
electron transfer between QA and QB, and the oxidation of plastoquinol in the
thylakoid membrane through the cytochrome b6f complex are assumed to have first-
order kinetics, as in the model of Stirbet et al. (1998). The only exception to first
order kinetics are the reactions for exchange of plastoquinones, e.g. the exchange of
oxidized PQ with QAQB2- (or QAQBH2) are assumed to be second order.
8) Lebedeva et al. (2002) showed that electric field effects are of consequence to FI only
in measurements in low and medium light fluxes. In this study, a saturating PPFD of
3000 �mol m-2 s-1 is used for simulation of the fluorescence induction curve; as a
result, the influence of the electrical field on fluorescence emission can be ignored.
Therefore, the changes in the rate constants of electron transfer from P680 to QA and
from QA- to QB upon changes in the electric field across the thylakoid membrane
during a dark to light transition are not considered in this model.
9) The net charges of the OEC influence the rate constants of primary charge separation
and charge recombination. However, only a minor fraction of PSII are thought to be
affected (Dau, 1994), therefore the effect of different S states on rate constants of
primary charge separation and charge recombination are ignored in our model. Baake
& Schloder (Baake & Schloder, 1992) have shown that consideration of other
reactions describing electron transfer steps beyond the oxidation of reduced PQ pool
does not improve model fit to the experimentally recorded fluorescence induction
curve at low light intensity, up to P on the induction curve. Therefore, only the
reactions prior to PQH2 oxidation are considered in our model.
10) Previous models (Stirbet et al. 1998, Lebedeva et al. 2002, Trissl and Lavergne 1995,
Vredenberg 2000) have not accounted for the heterogeneity of PSII, i.e. the QB-
reducing and QB-nonreducing PSII reaction centers, found in nature (Krause & Weis,
1991). In our model, the effects of different proportions of QB-nonreducing PSII
reaction centers are considered. Our model assumes that the inactive centers have
their own core antenna, which is 50% of size of an active reaction center, and does
not contain peripheral antenna (Chylla & Whitmarsh, 1990). The inactive PSII
B
8

centers are also assumed to have their own oxygen evolution complex, QA and QB.
The chlorophylls detached from core antenna and all the chlorophylls of peripheral
antenna of inactive center are assumed to be separated from inactive PSII reaction
center.
RATE EQUATIONS DESCRIBING EACH EXCITATION/ELECTRON
TRANSFER REACTION
This section describes the rate equations representing the model structure and
assumptions in the sequence of excitation energy absorption, excitation energy transfer,
charge separation and electron transfer around active PSII reaction centers. Reactions
around inactive PSII reaction centers use the same rate equations except that the rate
constant for electron transfer beyond QA is assumed to be zero.
1. Light absorption by different components of the photosystems.
The amount of excitation energy incident on different components of the PSII antenna is
determined by the total absorbed excitation energy, the concentration of chlorophylls in
different components of PSII units, and the concentration of chlorophylls in PSI units.
The PSII unit consists of more than 20 subunits (Hankamer et al., 1997), which are
simplified here to one PSII reaction center, one PSII peripheral antenna and two PSII
core antenna complexes (Fig. 1). The PSII peripheral antenna complex contains 220
chlorophyll a and b molecules, and the two PSII core antenna complexes contain about
35 chlorophylls each (Peter & Thornber, 1991). Therefore, it is assumed that a PSII unit
contains 290 chlorophyll molecules. Similarly to the PSII unit, the PSI unit is composed
of one PSI core complex with about 96 chlorophylls and one peripheral antenna binding
about 80~120 chlorophylls (Chitnis, 2001). Consequently, a PSI unit contains 200
chlorophylls in our model. As stated in the assumption, the number of chlorophylls of
core antenna of inactive reaction center is half of that of the active PSII reaction center,
i.e. 35 chlorophylls. Assuming the ratio of inactive to active PSII reaction center is x,
then the chlorophyll content associated with one active photosynthetic unit (i.e. one PSII
and associated PSI complexes) unit is (290 + 200n + 70x + 220x + 200nx), where n
9
represents the ratio of PSI units to PSII units where 290 represents the total number of
chlorophylls in both peripheral and core antenna of active PSII, 200n represents the
number of chlorophylls in antenna of PSI associated with one active PSII reaction center,
70x represents the total number of chlorophylls for core antenna of inactive PSII centers
among which half of chlorophylls are detached from the core antenna, 220x represents
the number of chlorophylls in peripheral antenna of inactive PSII centers, and 200nx
represents the number of chlorophylls of PSI associated with inactive PSII reaction
centers for one active PSII center. A default value n = 1 is used in the current model.
Assuming the total incident photon flux density (PFD) is Iin, the incident PFD on
peripheral antenna of active PSII will be calculated as:
Ia= 220Iin /(290 + 200n + 70x + 220 x + 200 nx) …… (2)
Similarly, the incident photon flux density on the PSII core antenna of active PSII unit is:
Ic= 70Iin /(290 + 200n + 70x + 220 x + 200 nx) …… (3)
The incident photon flux density on the core antenna of inactive PSII center is calculated
similar to equation 3 (in Appendix II).
2. Excitation energy dissipation as heat and fluorescence
The excitation energy of excited singlet-state chlorophyll is assumed to dissipate through
four different pathways: photochemistry, heat, fluorescence, and transfer to other
chlorophyll molecules. The rate equations of all these four reactions were assumed to
follow first-order kinetics as did by Stirbet et al. (1998). For example, assuming that the
concentration of excited singlet-state chlorophylls in peripheral antenna is Ap, the
fluorescence emission (vAf) and heat dissipation (vAd) from peripheral antenna are
calculated as
vAf = [Ap] kaf; …… (4)
vAd = [Ap]kad; …… (5)
Where [Ap] is the concentration of the excited singlet-state chlorophyll in the peripheral
antenna of PSII; kaf and ka
d are the rate constants for heat dissipation and fluorescence
emission from peripheral antenna respectively.
10
3. Excitation energy equilibrium and the primary charge separation reaction
The model assumes that excitation energy of chlorophylls in the core antenna reaches
equilibrium instantaneously. The equilibrium between the excitation energy in the
antenna chlorophyll of the PSII core complex (Chl*P680) and the excitation energy in P680
(ChlP680*) is represented as Chl*P680 ↔ ChlP680
*. The excited-state energy of different
chlorophylls is estimated from the absorption spectrum by:
abs
hcEλ
= …… (6)
where h is Planck’s constant, c is the speed of light, and λabs is the peak wavelength of
light absorbance of certain chlorophyll in our model. An excitation equilibrium is reached
when chlorophylls absorbing different wavelength stay at their excited states with a
probability proportional to the Boltzmann factor exp[-Ei/kT], where Ei is the energy
content of the lowest excited-state energy of chlorophyll, T is temperature and k is the
Boltzmann constant. Therefore,
)])(/(exp[][][ 11
*680
680*
−−− −−== PChlt
t kThckk
ChlPPChl λλ …… (7)
where kt is the rate constant of excitation energy transfer from Chl*P680 to ChlP680*, and k-t
is the rate constant of excitation energy transfer from ChlP680* to Chl*P680. λChl and λP
represent the wavelengths of the maximum absorbance of antenna chlorophyll (673 nm)
and reaction center chlorophyll (680 nm) respectively (Schatz et al., 1988).
Equation 7 for calculating the ratio of [Chl*P680] and [ChlP680*] does not consider the
relative concentration of P680 and other chlorophylls in the core antenna. If there are N
chlorophylls associated with one P680, the amount of excitation energy reaching P680 at
equilibrium will decrease gradually with increase in N. Considering both a) the energy
difference and b) the number of chlorophyll molecules in the PSII core antenna, the
amount of P680*Pheo is calculated as:
11
[P680*Pheo] = [U] )1(
t
t
kk−+ -1
/N …… (8)
Where U represents the total excited singlet-state chlorophylls (including P680*) in the
PSII core antenna. According to Eqn 10, changes in N will lead to changes in the
concentration of P680*Pheo, which will inevitably increase the rate of primary charge
separation. This has been confirmed by measurements of the rates of charge separation
for PSII of different antenna size (Holzwarth et al. 1985, Schatz et al. 1987).
The primary charge separation reaction is one of the major pathways for dissipating
excitation energy from excited singlet-state PSII reaction center: P680*.
v1 = q[ P680*Pheo]ko
1 + [P680*Pheo](1-q)(1-p)kc
1+[P680*Pheo](1-q)pko
1
…… (9)
where [P680*Pheo] = [U][P680Pheo] )1(
t
t
kk−+ -1/70 …… (10)
where q is the proportion of open reaction centers in all PSII reaction centers; [P680*Pheo]
is the concentration of excited singlet-state PSII reaction centers; p is the probability of
migration of excitation energy from the core antenna of a closed reaction center to that of
an open reaction center, ko1 is the rate constant of the primary charge separation reaction
for open reaction centers; kc1 is the rate constant of the primary charge separation
reaction for closed reaction centers. The rate constants of charge separation in closed
(kc1) and open reaction center (ko
1) are different. The ko1 is assumed to be 6.2kc
1,
similarly, the rate constant for charge recombination increases by two fold upon the
reduction of QA (Schatz et al., 1987). These changes in rate constants when QA is reduced
have been suggested to be the result of a) altered electrical field by the negative charge on
QA- and b) the shorter distance between QA
- and Pheo than from QA- to P680 (Dau, 1994).
This model assumes that PSII reaction centers are embedded in interconnected
photosynthetic units, i.e. they are not isolated from each other (Deprez et al., 1990, Joliot
& Joliot, 1964). A simple probability parameter (P) ranging from 0 to 1 is used in our
12
model to represent different probabilities of migration of excitation energy from core
antennas of closed reaction centers to core antennas of open reaction centers.
4. The charge recombination reaction
The rate equation for the charge recombination reaction which involves the transfer of
electron from Pheo- to P680+ is:
v-1 = q[P680+Pheo-]ko
-1 + (1-q)[P680+Pheo-]kc
-1 …… (11)
where v-1 is the charge recombination rate, and ko-1 and kc
-1 represent rate constants for
the charge recombination reaction between P680+ and Pheo- in open and closed PSII
reaction centers respectively.
5. Excitation energy quenching by P680+
P680+ is a quencher of chlorophyll fluorescence (Butler, 1972). On a nanosecond to sub-
nanosecond scale, the rise of Chl a fluorescence after a brief (< ns) actinic flash measures
the electron flow from tyrosine to P680+ (Sonneveld et al., 1979). After illumination with
a sequence of short light pulses, oscillation of fluorescence emission with a period of four
was observed (Delosme, 1971). This phenomena is currently explained by the hypothesis
that the oscillation of electrical fields, which stems from uncompensated positive charges
of the OEC, influences the rate of electron transport from the tyrosine residue (Yz) to
P680+ and correspondingly P680
+ quenching of chlorophyll fluorescence (Dau, 1994). In the
current model, a rate constant (kc) of 1 ns-1 was used to describe the quenching of Chl a
fluorescence by P680+ (Trissl et al., 1993). The quenching of excitation energy in the core
antenna is calculated as:
vP680qU = [U]([P680+Pheo] + [P680
+Pheo-])kc …… (12)
where [U] represents the concentration of excited singlet-state chlorophylls in PSII core
antenna.
The quenching of excitation energy in the peripheral antenna is calculated as:
vP680qA = [A]([P680+Pheo] + [P680
+Pheo-])kc …… (13)
13
where [A] represents the concentration of excited singlet-state chlorophlls in PSII
peripheral antenna (Trissl et al., 1993).
6. Excitation energy quenching by oxidized plastoquinone
Oxidized plastiquinone is also a strong quencher of chlorophyll fluorescence. Vernotte et
al. (1979) found that if all the plastoquinone (PQ) pool is reduced, chlorophyll
fluorescence emission is about 10~20% higher than when the PQ pool was oxidized (e.g.
with addition of DCMU) under high light. In the current model, the rate constant for
plastoquinone quenching is obtained based on the equation for the quantum yield of
fluorescence,
]Q[Pk[PQ]kkkkΦ
A680pqdf
ff +++
= …… (14)
where kf, kd, kq, and kp represent the rate constants for exciation energy deactivation in
the form of fluorescence, heat dissipation, PQ quenching, and quenching by P680QA
respectively (Reviewed: Govindjee, 1995). DCMU blocks electron transfer from QA to
QB; therefore PQ under high light in the presence of DCMU is in the oxidized state.
Assuming QA and PQ under high light without DCMU were all in the reduced state, the
difference in fluorescence emission under high light with and without DCMU can be
used to derive the empirical rate constant of plastoquinone quenching as following.
In the presence of DCMU, oxidation state of [PQ] is maximal since no electrons are
transferred to PQ while kp is zero, which leads to:
Φf1 = kf/(kf+ kd +kq[PQT]) …… (15)
where [PQT]t represents the concentration of the PQ pool assuming all plastoquinone is
reduced under strong light. Without DCMU, [PQ] and [QA] are zero, which leads to:
Φf2 = kf/(kf+ kd) …… (16)
Considering that fluorescence emission is about 15% higher in the presence of DCMU
than without (Vernotte et al., 1979), empirically then:
14

kq =0.15(kf + kd)/ [PQT] …… (17)
The rate equation for quenching of excitation energy in the core antenna by oxidized
plastoquinone is calculated as:
vPQqU = [U][PQ]kq …… (18)
The rate equation for calculating the quenching of excitation energy in peripheral antenna
by oxidized plastoquinone is calculated as:
vPQqA = [A][PQ]kq …… (19)
7. Reactions of the oxygen evolving complex
The oxidized PSII reaction center, P680+ is reduced by Yz of D1 protein. In this model, it
is assumed that electrons pass through Yz instantaneously. Therefore, electrons from
different S states of oxygen evolution complex directly to P680+Pheo or P680
+Pheo-. For
example, the rate of electron transfer from S1 state of OEC to P680+Pheo- was calculated
as:
v1z_1 = [S1T]kz[P680+Pheo-]/[P680PheoT] …… (20)
where kz is the rate constant of electron transfer from Yz to P680+, which is used
here as the rate constant for electron transfer from OEC to P680+; [S1T] is the
concentration of OEC in S1 state before donating electron to P680+. [P680PheoT]
represents the total concentration of different states of P680Pheo in PSII. The conversion
between different consecutive S states of the OEC assumes first-order kinetics.
8. Reduction of QA
Reduced pheophytin reduces the electron acceptor QA. A first-order rate equation is used
to describe this process. For example, electron transfer from Pheo+Pheo- to QA was
calculated as:
v2_1 = [P680+Pheo-]k2q …… (21)
15

where k2 is the rate constant for this reaction. Our model incorporates the reverse electron
transfer reaction from QA- to Pheo using a pseudo-first-order rate equation. For example,
the electron transfer rate from QA-QB to Pheo associated with P680
+ was calculated as:
vr2_01_1 = [QA-QB]k2 /Ke[P680
+Pheo]/[P680PheoT] ……(22)
where Ke2 is the equilibrium constant for the electron transfer between QA and Pheo.
9. Exchange of plastoquinone
The exchange of plastoquinone between the QB site and the thylakoid membrane was
calculated based on both the concentration of QB2- and the redox state of plastoquinone
pool in the thylakoid membrane, i.e.
v3 = [QAQB2-]k3[PQ]/[PQT] ……(23)
Where k3 is the rate constant of the exchange.
10. Fluorescence emission
The total fluorescence emission from both the peripheral antenna and the core antenna
complex is calculated as:
Φf = kafAp + ([U]+[Ui])ku
f + kaf[Aip] + ka
u[Uifc] …… (24)
Where kaf and ku
f are the rate constants for fluorescence emission at the peripheral and
core antenna respectively and Φf is the total fluorescence emission. [Ui] is the
concentration of excited singlet-state chlorophylls (including P680*) in the core antenna
associated with inactive PSII center. [Aip] is the concentration of excitation energy on
peripheral antenna of inactive photosystem II. [Uifc] is the concentration of excitation
energy on chlorophylls detached from core antenna of inactive photosystem II.
NUMERICAL SIMULATION PROCEDURE
The rate of change of the concentration of each discrete reduction state of each
intermediate or component in photosystem is represented by a differential equation. A
differential equation for a component is derived by subtracting the sum of all rates
consuming this component from the sum of all rates generating the component. All the
16

differential equations, describing rates of concentration change of all intermediates in
photosystem, form a system of linked differential equations. This system of differential
equations for the model is listed in Appendix I. The rate equations used in deriving the
system of differential equations are described in the preceding section (RATE
EQUATIONS DESCRIBING EACH EXCITATION/ELECTRON TRANSFER REACTION)
and listed in Appendix II. This system of differential equations was solved using the
ode15s procedure of MATLAB (the Mathworks, Inc. version 6, Natick, MA). This
algorithm proved the most computationally efficient in dealing with this set of stiff
differential equations. This algorithm is a variable order solver implementing implicit
multistep method (Shampine & Reichelt, 1997). Estimates of the kinetic parameters were
obtained from literature and from estimates as listed in Table 1. The concentrations of
intermediates in the light reactions in dark-adapted C3 leaves were used to initialize the
model. It was assumed that all QA, QB, and plastoquinone are in an oxidized state for
dark-adapted leaves.
In this study, we first compared the simulated fluorescence induction curve to a typical
measured fluorescence induction curve, assuming all reaction centers are active. Then the
origins of different phases of fluorescence induction curve were explored by comparing
the fluorescence emission to the concentrations of different intermediates or compounds
of photosystem. Thirdly the effects of modifying kinetic and structural parameters of PSII
units on fluorescence induction kinetics were studied. Finally, the influences of different
proportions of inactive PSII centers on fluorescence induction curve were explored.
RESULTS
Comparison of in silico and in vivo FI
The multi-phasic Chl a fluorescence induction curve predicted from the model when a
leaf is excited with 3000 μmol photons m-2 s-1 mimics the experimentally recorded
multiphasic O J I P transients (Fig. 2). The predicted fluorescence emission and the
reduction status of QA do not change at the same rate (Fig. 3). Under a PPFD of 3000
μmol m-2 s-1, QA approaches complete reduction much earlier than the predicted peak
17
value of fluorescence emission (Fig. 3) and the predicted fluorescence emission and the
reduction status of QA do not change at the same rate.
OJIP in relation to the kinetics of redox of intermediates
The different phases of FI coincide with peak concentrations of oxidized or reduced
forms of different components in the electron transfer chain. J coincides with the peak
concentrations of QA-QB and QA
-QB-; I with the first shoulder of QA
-QB2- concentration,
and P with the peak concentrations of both QA-QB
2- and PQH2 (Fig. 4).
The simulations showed that several factors influence the magnitude and shape of FI
kinetics. Increasing the probability of excitation transfer from the core antenna of closed
reaction centers to the core antenna of open reaction centers gradually delays the
fluorescence increase from O to J without changing fluorescence emission at O (Fig. 5 b).
Increasing the size of the peripheral antenna relative to the core antenna leads to higher
fluorescence emission, and heat dissipation at O (Fig. 5 b). By increasing the initial
concentration of S0, the simulated J becomes more sharply defined. With oxygen
evolving complex initially completely being in S0 state, FI shows a dip after J (Fig. 5 c).
The dip after J is eliminated if P680+ quenching of fluorescence is ignored (Fig. 6 a and 6
b). The fluorescence emission at J gradually increases and finally reaches I when the
initial state of QB:QB- is lowered from 1:0 to 0:1 (Fig. 6 d). Increasing the rate constant of
plastoquinone oxidation (kox) and the PQ pool size in the thylakoid membrane decreases
the fluorescence emission at P (Fig. 5 e and 5f).
The effects of inactive PSII centers on FI
Increasing the proportion of inactive reaction centers increased the fluorescence emission
at O phase (Fig. 7a), as a result, Fv/Fm gradually decreases with increase in the proportion
of inactive PSII (Fig. 7b).
18

DISCUSSION
Accepting the assumptions used in our model, when all discrete reactions of electron
transfer from water-splitting through to cyt b6f reduction are included, a realistic FI is
simulated and several properties apparently determining the OJIP transients emerge. This
model provides a new basis for extracting more information from the easily measured
fluorescence induction transient (Table 3). Simulations based on this model showed that J
corresponded to the peak concentrations of QA-QB
and QA-QB
- and I to the first shoulder
in the increase in concentration of QA-QB
2-. The P peak coincided with maximum
concentrations of both QA-QB
2- and PQH2. In addition, simulations using this model
suggest that different ratios of the peripheral antenna and core antenna lead to differences
in fluorescence emission at O without affecting fluorescence emission at J I and P.
Furthermore, increase inactive PSII center increase fluorescence emission at O phase and
correspondingly decrease Fv/Fm.
Based on concentrations of intermediates of dark adapted leaves and rate constants for
redox reactions and exciton transfer taken from the literature, this model predicts the
multi-phasic Chl a FI curve (Fig. 2 a), including the distinct O J I P transients, closely
mimicking observed FI kinetics (Fig. 2b). The current model is distinguished from
previous models by incorporating each discrete step of energy and electron transfer
around PSII. In addition, it differs from some previous models in that it uses the excited
singlet-state chlorophyll molecules to predict fluorescence emission (Fig. 1).
Furthermore, inclusion of the structural information for the core and the peripheral
antenna enables the model to a) use PPFD directly as an input rather than using the rate
of QA reduction (Stirbet et al., 1998), or the rate of excitation state formation (Lazar,
2003, Lebedeva et al., 2002); and b) examines the effect of different antenna structures
on FI, which was not possible in the previous models (Table 2). Our model assumed that
all the reaction centers are open on illumination, and predicts that fluorescence emission
at O occurs before any reduction of QA (Fig. 3). This shows that FI occurs at different
pace from QA reduction. The appearance of J was found to coincide most closely with the
maximum concentrations of QA-QB and QA
-QB- (Fig. 4). This result is consistent with the
19
experimental and theoretical results showing that the O-J phase is largely driven by
primary photochemistry, i.e. reduction of the primary electron acceptor in PSII,
pheophytin, and the first quinone electron acceptor of PSII, QA (Delosme, 1967, Lazar et
al., 1998, Lazar et al., 1997, Neubauer & Schreiber, 1987, Stirbet et al., 1998, Strasser et
al., 1995). Consistent with the model of Stirbet et al. (1998), the inflexion point I was
found to correspond to the first inflexion in the concentration of QA-QB
2- (Fig 4 c). The
concentration of QA-QB
2- was maximal at P (Fig. 4 c). At the same time, the
plastoquinone pool was also maximally reduced at point P (Fig. 4 d). Models of FI
lacking a description of the electron transfer reactions beyond QA reduction, i.e. the QB
reduction and plastoquinone reduction reactions, cannot simulate the I-P phase (Schreiber
& Krieger, 1996, Trissl & Lavergne, 1995, Vredenberg, 2000). Therefore, the appearance
of the I-P phase possibly requires the accumulation of double-reduced QB and the
reduced plastoquinone pool molecules.
In our model the connectivity between closed and open reaction centers is described
using a simple empirical probability parameter p (Eqn. 9). With a higher p value, the
connectivity between open and closed reaction centers is higher. As in the model of
Stirbet et al (1998), increasing p gradually delays the fluorescence increase from O to J
without changing emission at O. This suggests that increased connectivity between core
antennas of closed and open reaction centers will decrease the loss of excitation energy as
fluorescence and heat, and leads to a higher efficiency of excitation energy utilization. In
contrast to the O-J phase, the fluorescence intensities in the I-P phase are not detectably
influenced by p within the current model, which differs from the predictions of the model
of Stirbet et al. (1998).
Simulations with the current model suggest that the “structure” of the light harvesting
complex influences Fo without apparent changes in the fluorescence emissions at points J,
I and P. A relatively greater peripheral antenna compared to core antenna leads to higher
Fo (Fig. 5 b). This result provides another mechanism to alter the commonly used
fluorescence parameter, Fv/Fm, where Fv = Fm – Fo and Fm is the maximum fluorescence
emission under saturating light. Based on this result, Fv/Fm can be altered through
20

changes in the relative size of core antenna and peripheral antenna without any change in
the rate constant of charge separation in the PSII reaction center. Specifically, a relatively
smaller size of peripheral antenna compared to core antenna might be preferred for higher
efficiency of excitation energy utilization (Fig. 5b). In this respect, it is surprising to note
that the amount of chlorophyll in the peripheral antenna is nearly three times or more
than that in the core antenna (Horton et al., 1996, Peter & Thornber, 1991). This point to
a possibility to genetic manipulations of antenna structures to potentially increase
excitation energy utilization and correspondingly the photosynthetic carbon fixation for
leaves of shade environments, e.g. leaves of understory plants or leaves in the lower
layers of canopy.
With increase in the initial concentration of S0, the point J becomes more distinct. A dip
after point J correspondes most strongly to a high initial concentration of S0 (Fig. 5 c).
Similar results have been reported by Stirbet et al (1998). Considering the differences in
the rate of transitions between different states of OEC, especially the slower transition
between S0 and S1, Lazar (Lazar, 2003) has suggested that the dip after I reflects a
momentary accumulation of P680+, which is a strong quencher of fluorescence. This is
confirmed in our simulations where ignoring P680+ quenching of fluorescence eliminates
the dip after point J in FI when initial concentration of S0 is high (Fig. 6 a). On the
contrary, when the initial concentration of S1 is high, the transition between S1 and S2 is
fast enough to provide electrons to P680+ and therefore prevent accumulation of P680
+ and
correspondingly quenching of fluorescence by P680+ (Fig. 6 b). The S1:S0 ratio for dark-
adapted leaves has been suggested to range from 3:1 to 1:0 (Haumann & Junge, 1994,
Kok et al., 1970, Messinger & Ranger, 1993), which should not lead to a dip after J if the
transition between S1 and S2 is fast enough. Therefore, a recorded dip in FI for dark
adapted leaves might indicate a decrease in the rate constant of the transition between S1
and S2 states in an oxygen evolution complex, or a decrease in the ratio of S1:S0, which
causes transient accumulation of P680+.
Changing QB:QB- ratio influences the appearance of point J in FI. As shown in Fig. 4b,
the fluorescence emission at the point J gradually increases and finally reaches the
21

fluorescence emission of point I when the initial state of QB:QB- is changed from 1:0 to
0:1 (Fig. 6 d). Therefore, the relative redox state of QB appears to determine the
fluorescence emission at point J relative to point I in FI. A QB:QB- of 0.5:0.5 is consistent
with that reported for dark-adapted leaves (Rutherford et al., 1984).
The fluorescence emission at point P is influenced by both the rate constant of
plastoquinone oxidation (kox) (Fig. 5 e) and the pool size of plastoquinone (Fig. 5 f). The
fluorescence emission at point P reflects a balance between the rate of incident excitation
energy at the PSII side and the rate of utilization of the chemical (potential) energy and
the rate of heat dissipation. In our model, PQH2 oxidation by the cytochrome b6f complex
(with a rate constant kox) represents the final fate of the chemical energy. Higher kox leads
to a higher rate of energy utilization, which indirectly decreases the amount of excitation
energy available for dissipation as fluorescence since more energy can be utilized in
photochemistry. Furthermore, higher kox increases the oxidation state of PQ at steady
state under a given light flux. Higher oxidized PQ concentration quenches excitation
energy and therefore lowers fluorescence emission (Govindjee, 1995, Vernotte et al.,
1979) (Fig. 5 e). Therefore, changes in the fluorescence emission at P for a leaf sample
under certain treatment can be used to monitor the changes in PQH2 oxidation. Changes
in the PQ pool size change fluorescence emission at P level (Fig. 5f). Increases in the PQ
pool size in the thylakoid membrane leads to higher oxidized PQ concentration, which
results in decreased fluorescence emission at P (Fig. 5 f).
Finally, changes in the proportion of inactive PSII centers lead to changes in Fv/Fm (Fig.
7). There are many experimental evidences showing decreased Fv/Fm upon increase in
proportion of inactive PSII centers (Critchley & Russell, 1994, Hong & Xu, 1999, Melis,
1985). In this model, with increase in the proportion of inactive PSII centers, more
excitation energy is incident is absorbed by the core antennae of inactive PSII centers and
chlorophylls in peripheral antennas detached from the inactive center. Therefore, a higher
proportion of the incident energy is diverted into fluorescence and heat dissipation rather
than being utilized in primary charge separation. As a result, increase in the proportion of
22

inactive PSII centers increases fluorescence emission at the O phase (Fig. 7), which lead
to decrease in Fv/Fm.
23

Acknowledgement: This work is co-supported by the National Center for
Supercomputing Applications, and the U. S. National Science Foundation IBN 04-17126.
We thank Dr. Morgan P.B., Ainsworth E.A., Bernacchi C.J., Heaton E.A., Dr. Shawna
N. , Castro J., and Chen C. for useful comments on the manuscript.
24

LITERATURE
Baake E & Schloder JP (1992) Modeling the fast fluorescence rise of photosynthesis.
Bulletin of Mathematical Biology, 54, 999-1021.
Baker NR, East TM & Long SP (1983) Chilling damage to photosynthesis in young Zea
mays. Journal of Experimental Botany, 34, 189-197.
Bolhár-Nordenkampf HR, Long SP, Baker NR, Qquist G, Schreiber U & Lechner EG
(1989) Chlorophyll fluorescence as a probe of the photosynthetic competence of
leaves in the field - a review of current instrumentation. Functional Ecology, 3,
497-514.
Bowes J & Crofts AR (1980) Binary oscillations in the rate of reoxidation of the primary
acceptor of photosystem II. Biochimica et Biophysica Acta, 590.
Brody SS (2002) Fluorescence lifetime, yield, energy transfer and spectrum in
photosynthesis, 1950-1960. Photosynthesis research, 73, 127-132.
Butler WL (1972) On the primary nature of fluorescence yield changes associated with
photosynthesis. Proceedings of the National Academy of Sciences of the United
States of America, 69, 3420-3422.
Chitnis PR (2001) Photosystem I: function and physiology. Annual of Plant Physiology
and Plant Molecular Biology, 52, 593-636.
Chylla RA & Whitmarsh J (1990) Light saturation response of inactive photosystem-II
reaction centers in spinach. Photosynthesis Research, 25, 39-48.
Critchley C & Russell AW (1994) Photoinhibition of Photosynthesis in-Vivo - the Role
of Protein-Turnover in Photosystem-Ii. Physiologia Plantarum, 92, 188-196.
Crofts AR, Robinson HH & Snozzi M (1984) Reactions of quinones at catalytic sites: a
diffusional role in H-transfer. In Sybesma C (ed) Advances in Photosynthesis
Research. volume 1. Martinus Nijhoff/Dr W. Junk Publishers, The Hague,
Netherlands. pp461-468.
Dau H (1994) Molecular mechanisms and quantitative models of variable photosystem II
fluorescence. Photochemistry and Photobiology, 60, 1-23.
25
Dekker JP, Plijter JJ, Ouwehand L & van Gorkom HJ (1984) Kinetics of maganses redox
transitions in the oxygen evolving complex of photosystem II. Biochemica et
Biophysica Atca, 767, 176-179.
Delosme R (1967) Etude de l'induction de fluorescence des algues vertes et des
chloroplasts au debut d'une illumination intense. Biochimica et Biophysica Acta,
143, 108-128.
Delosme R (1971) New results about chlorophyll fluorescence in vivo. In Forti G, Avron
M and Melandri A (eds) Proceedings of the 11th International Congress on
Photosynthesis Research. volume 1. Martinus Nijhoff/Dr W. Junk, The Hague,
Netherlands. pp187-95.
Deprez J, Paillotin G, Dobek A, Leibl W, Trissl HW & Breton J (1990) Competition
between energy trapping and exciton annihilation in the lake model of the
photosynthetic membrane of purple bacteria. Biochimica et Biophysica Acta,
1015, 295-303.
Forbush B, Kok B & McGloin MP (1971) Cooperation of charges in photosynthetic O2
evolution. II. Damping of flash yield oscillation and deactivation. Photochemistry
and Photobiology, 14, 307-321.
Golbeck JH & Kok B (1979) Redox titration of electron acceptor Q and the
plastoquinone pool in photosystem II. Biochimica et Biophysica Acta, 547, 347-
360.
Govindjee (1995) Sixty -three years since Kautsky: Chlorophyll a fluorescence.
Australian Journal of Plant Physiology, 22, 131-160.
Hankamer B, Barber J & Boekema EJ (1997) Structure and membrane organization of
photosystem II in green plants. Annual Review of Plant Physiology and Plant
Molecular Biology, 48, 641-671.
Haumann M & Junge W (1994) Extent and rate of proton release by photosynthetic water
oxidation in thylakoids: electrostatic relaxation versus chemical production.
Biochemistry, 33, 864-872.
Hong SS & Xu DQ (1999) Light-induced increase in initial chlorophyll fluorescence Fo
level and the reversible inactivation of PSII reaction centers in soybean leaves.
Photosynthesis Research, 61, 269-280.
26

Horton P, Ruban AV & Walters RG (1996) Regulation of light harvesting in green plants.
Annual Review of Plant Physiology and Plant Molecular Biology, 47, 655-684.
Joliot A & Joliot P (1964) Etude cinetique de la reaction photochimique liberant
l'oxygene au cous de la photosynthese. Computes Rendue Academie Science
Paris, 258, 4622-4625.
Kok B, Forbush B & McGloin MP (1970) Cooperation of charges in photosynthetic O2
evolution. I. A linear four step mechanism. Photochemistry and Photobiology, 11,
457-475.
Kramer DM, Dimarco G & Loreto F (1995) Contribution of plastoquinone quenching to
saturation pulse-induced rise of chlorophyll fluorescence in leaves. In Mathis P
(ed). Photosynthesis from light to the biospere. volume 1. Kluwer Academic
Publishers, Dordrecht. pp147-150.
Krause GH & Weis E (1991) Chlorophyll fluorescence and photosynthesis - the basics.
Annual Review of Plant Physiology and Plant Molecular Biology, 42, 313-349.
Lavergne J & Trissl HW (1995) Theory of fluorescence induction in photosystem II -
Derivation of analytical expressions in a model including exciton-radical- pair
equilibrium and restricted energy transfer between photosynthetic units.
Biophysical Journal, 68, 2474-2492.
Lazar D (1999) Chlorophyll a fluorescence induction. Biochimica et Biophysica Acta-
Bioenergetics, 1412, 1-28.
Lazar D (2003) Chlorophyll a fluorescence rise induced by high light illumination of
dark-adapted plant tissue studied by means of a model of photosystem II and
considering photosystem II heterogeneity. Journal of Theoretical Biology, 220,
469-503.
Lazar D, Brokes M, Naus J & Dvorak L (1998) Mathematical modelling of 3-(3', 4'-
dichlorophenyl)-1,1-dimethylurea action in plant leaves. Journal of Theoretical
Biology, 191, 79-86.
Lazar D, Naus J, Matouskova M & Flasarova M (1997) Mathematical modeling of
changes in chlorophyll fluorescence induction caused by herbicides. Pesticide
Biochemitry and Physiology, 57, 200-210.
27

Lazar D & Pospisil P (1999) Mathematical simulation of chlorophyll a fluorescence rise
measured with 3-(3 ',4 '-dichlorophenyl)-1,1-dimethylure barley leaves at room
and high temperatures. European Biophysics Journal, 28, 468-477.
Lebedeva GV, Belyaeva NE, Demin OV, Riznichenko GY & Rubin AB (2002) Kinetic
model of primary photosynthetic processes in chloroplasts. Description of the fast
phase of chlorophyll fluorescence induction under different light intensities.
Biophysics, 47, 968-980.
Melis A (1985) Functional properties of photosystem II beta in spinach chloroplasts.
Biochimica et Biophysica Acta, 808, 334-342.
Messinger J & Ranger G (1993) Generation, oxidation by the oxidized form of the
tyrosine of polypeptide D2, and possible electronic configuration of the redox
states S0, S1 and S2 of the water oxidase in isolated spinach thylakoids.
Biochemistry, 32, 9379-9386.
Neubauer C & Schreiber U (1987) The polyphasic rise of chlorophyll fluorescence upon
onset of strong continous illumination: I. Saturation charactristics and partial
control by photosystem II acceptor side. Zeitschrift für Naturforschung, 42c,
1426-1254.
Peter GF & Thornber JP (1991) Biochemical composition and organization of higher
plant photosystem II light harvesting pigment proteins. Journal of Biological
Chemistry, 266, 16745-16754.
Roelofs TA, Lee CH & Holzwarth AR (1992) Global target analysis of picosecond
chlorophyll fluorescence kinetics from pea chloroplasts - a new approach to the
characterization of the primary processes in photosystem II α units and β units.
Biophysical Journal, 61, 1147-1163.
Rohacek K & Bartak M (1999) Technique of the modulated chlorophyll fluorescence:
basic concepts, useful parameters, and some applications. Photosynthetica, 37,
339-363.
Rutherford W, Govindjee & Inoue Y (1984) Charge accumulation and photochemistry in
leaves studied by thermoluminescence and delayed light emission. Proceedings of
the National Academy of Sciences of the United States of America, 81, 1107-
1111.
28
Sayed OH (2003) Chlorophyll fluorescence as a tool in cereal crop research.
Photosynthetica, 41, 321-330.
Schatz GH, Brock H & Holzwarth AR (1987) Picosecond kinetics of fluorescence and
absorbency changes in photosystem II particles excited at low photon density.
Proceedings of the National Academy of Sciences of the United States of
America, 84, 8414-8418.
Schatz GH, Brock H & Holzwarth AR (1988) Kinetics and energetic model for the
primary processes in photosystem II. Biophysical Journal, 54, 397-405.
Schreiber U & Krieger A (1996) Two fundermentally different types of variable
chlorophyll fluorescence in vivo. FEBS Letter, 397, 131-135.
Shampine LF & Reichelt MW (1997) The MATLAB ODE suite. SIAM Journal on
Scientific Computing, 18, 1-22.
Sonneveld A, Rademaker H & Duysens LNM (1979) Chlorophyll a fluorescence as a
monitor of nanosecond reduction of the photooxidized primary donor P680+ of
photosystem II. Biochimica et Biophysica Acta, 548, 536-551.
Stirbet A, Govindjee, Strasser BJ & Strasser R (1998) Chlorophyll a fluorescence
induction in higher plants: Modelling and numerical simulation. Journal of
Theoretical Biology, 193, 131-151.
Stirbet A & Strasser RJ (2001) The possible role of pheophytine in the fast fluorescence
risk OKJIP. In: Proceedings of the 12th International Congress on Photosynthesis
(CD-ROM), S11-027, CSIRO Publishing, Collingwood.
Strasser RJ, Srivastava A & Govindjee (1995) Polyphasic chlorophyll a fluorescence
transient in plants and cyanobacteria. Photochemistry and Photobiology, 61, 32-
42.
Trissl HW, Gao Y & Wulf K (1993) Theoretical fluorescence induction curves derived
from coupled differential equations describing the primary photochemistry of
photosystem II by an exciton radical pair equilibrium. Biophysical Journal, 64,
974-988.
Trissl HW & Lavergne J (1995) Fluorescence induction from photosystem II - analytical
equations for the yields of photochemistry and fluorescence derived from analysis
of a model including exciton-radical pair equilibrium and restricted energy-
29

transfer between photosynthetic units. Australian Journal of Plant Physiology, 22,
183-193.
Vavilin DV, Tyystjarvi E & Aro EM (1998) Model for the fluorescence induction curve
of photoinhibited thylakoids. Biophysical Journal, 75, 503-512.
Velthuys BR & Amesz J (1974) Charge accumulation at the reducing side of system II of
photosynthesis. Biochimica et Biophysica Acta, 325, 138-148.
Vernotte C, Etienne AL & Briantais JM (1979) Quenching of the system II chlorophyll
fluorescence by the plastoquinone pool. Biochimica et Biophysica Acta, 545, 519-
527.
Vredenberg WJ (2000) A three-state model for energy trapping and chlorophyll
fluorescence in photosystem II incorporating radical pair recombination.
Biophysical Journal, 79, 26-38.
30

FIGURE LEGEND
Figure 1
Block flow diagram of the steps underlying chlorophyll fluorescence induction on a dark-
light transition. In this diagram, only the reactions associated with one active PSII unit is
included. Each illustrated step is represented by a differential equation in the model.
Change in the concentration of each component illustrated is achieved by numerical
integration of these linked equaitons. The section enclosed by the dotted line represents
the charge separation process in the PSII reaction center. Uo and Uc represent the singlet-
excited chlorophylls within the core antenna associated with the open and closed reaction
center respectively. S1, S2, S3, and S4 represent the four redox states of the oxygen
evolving complex (OEC). Yz: primary electron donor for photosystem II reaction center
(P680). Phe: pheophytin. PQ: plastoquinone; PQH2: plastoquinol; QA: the first quinone
electron acceptor in PSII; QB: the second quinone electron acceptor in PSII; cyt b6f:
cytochrome b6f complex.
Figure 2
The fluorescence emission predicted by the current model (a) compared to the
experimentally recorded fluorescence induction curve (b, Strasser et al. 1995). The x axis
is the logarithm of time with time using second as unit. The input photon flux density
(PFD) used for the simulation is 3000 μmol photons m-2 s-1 (sunlight). The kinetic
parameters used in the simulation are listed in Table 5.1. The initial concentrations of
different electron carrier in the dark were assumed to be: a) QA and QB are completely
oxidized; b) photosystem II reaction centers are all in P680Phe state; c) oxygen evolution
complexes are in the state of either S1 or S2 with a ratio of 4:1; d) the ratio of PQ: PQH2
in thylakoid membrane is 1:1. In the simulation, all PSII reaction centers are assumed to
be active. The radiant flux used in the experiment was 600 W m-2 (Strasser et al., 1995),
which corresponds to a photon flux density of 3255 μmol photons (λ=650 nm) m-2 s-1.
31

Figure 3
The predicted fluorescence induction curve and the corresponding proportion of
reduced QA. The x axis is the logarithm of time with time using second as unit. The
proportion of reduced QA is calculated as: [QA-]/([QA]+ [QA
-]); where where [QA] =
[QAQB]+[QAQB-]+[QAQB
2-] and [QA-] = [QA
-QB] + [QA-QB
-] + [QA-QB
2-].
The input photon flux density and simulation conditions are as Fig. 2. a: predicted
fluorescence induction curve; b: predicted proportion of QA reduction.
Figure 4
The predicted fluorescence emission and the corresponding changes in concentrations of
different components involved in the primary events of PSII. The x axis is the logarithm
of time and the unit for time is second. The input photon flux density and simulation
conditions were as in Fig. 2. The components plotted in these four panels are
sequentially, a: QA-QB; b: QA
-QB-; c: QA
-QB2-; d) PQH2. In panel D, the fluorescence
emission assuming no PQ quenching, is also included as indicated as Fu(t). The
fluorescence emission with PQ quenching represented as F(t).
Figure 5
The predicted influences of different structural and kinetic parameters on the shape of the
fluorescence induction curve. The input photon flux density and simulation conditions
were as in Fig. 2. a) Probability of excitation transfer from core antenna of closed
reaction centers to that of open reaction centers; b) the ratio of the number of
chlorophylls in core antenna to that in peripheral antenna; c) the ratio of the initial
concentration of S1 state to S0 state of the oxygen evolution complex; d) the ratio of
initial concentration of QB to initial concentration of QB-; e) the rate constant of PQH2
oxidation; f) the pool size of plastoquinone (PQ) in thylakoid membrane.
Figure 6
The predicted fluorescence induction curve with and without quenching by P680+. The
condition used for simulations were same as Fig. 2. The simulations were done for two
32

different initial [S1]:[S0] of oxygen evolution complexes (a: [S1]:[S0] = 0.1:0.9; b:
[S1]:[S0] = 0.8:0.2). There was no detectable difference between the shapes of
fluorescence induction curves regardless of whether P680+ quenching is or is not included
if the initial ratio of S1 to S0 is 0.8:0.2.
Figure 7
The effects of the percentage of inactive PSII reaction center (x/(1+x) with x being the
ratio of inactive to active PSII reaction center ) on (a) fluorescence induction curve and
(b) Fv/Fm, or (Fm-Fo)/Fm where Fm and Fo are the fluorescence emission at P and O phase
respectively obtained from Fig. 7a. The input photon flux density and simulation
conditions used for simulations were same as Fig. 2. The maximum fluorescence
emission is scaled to be the same level.
33

FIGURES AND TABLES
Figure 1
34
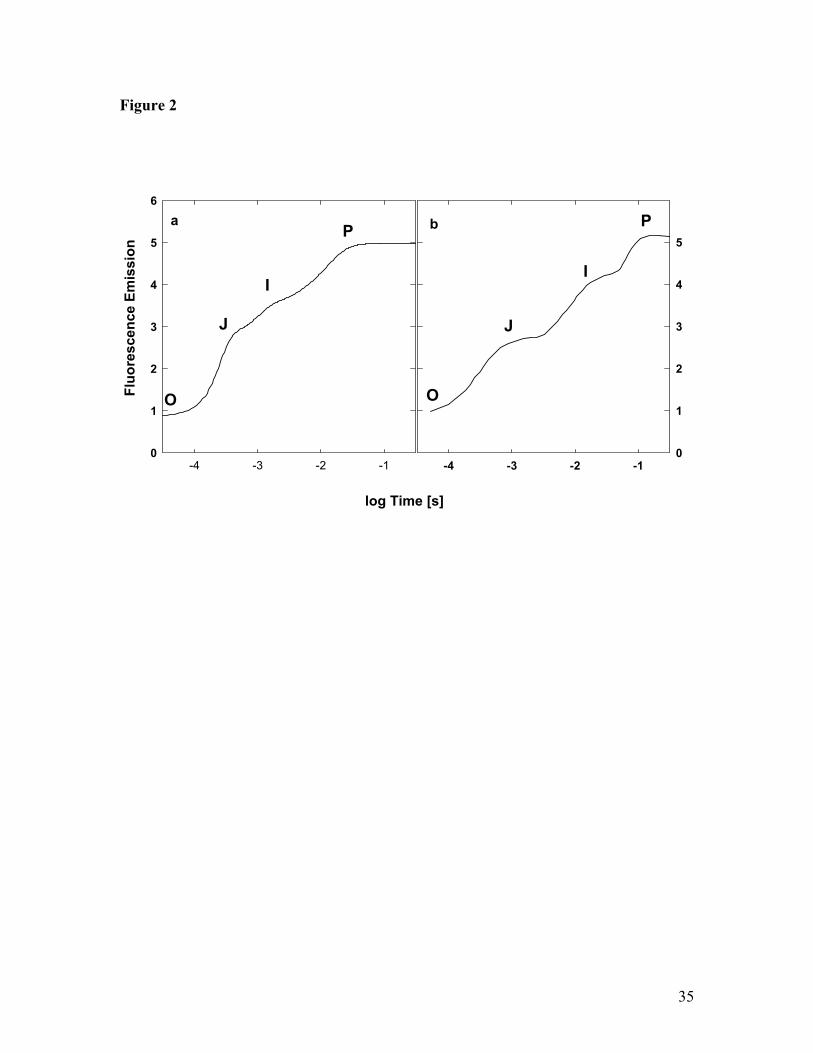
Figure 2
-4 -3 -2 -10
1
2
3
4
5
6
log Time [s]
-4 -3 -2 -1
Flu
ores
cenc
e Em
issi
on
0
1
2
3
4
5
O
P
I
JJ
O
I
Pa b
35
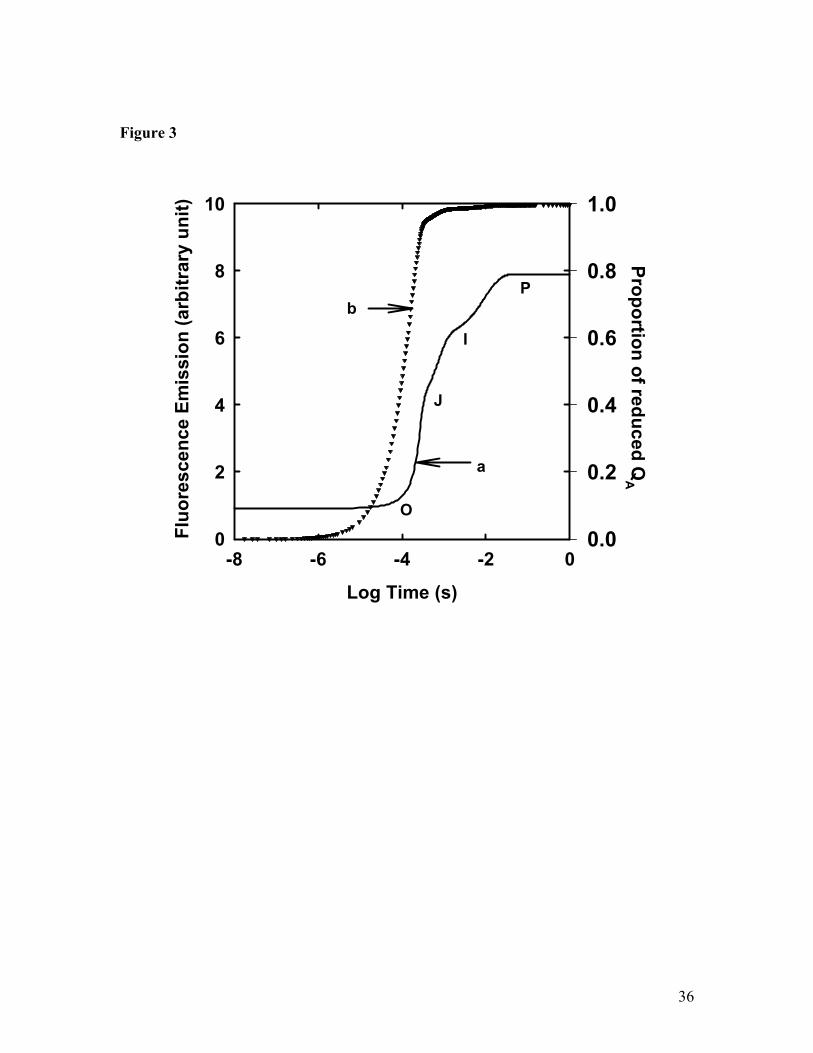
Figure 3
Log Time (s)
-8 -6 -4 -2 0
Flu
ores
cenc
e Em
issi
on (a
rbitr
ary
unit)
0
2
4
6
8
10Proportion of reduced Q
A
0.0
0.2
0.4
0.6
0.8
1.0
I
J
P
O
b
a
36

Figure 4
a
0
5
10
0.0
0.4
0.8
b
Com
pone
nt c
once
ntra
tion
( μm
ol m
-2)
0.0
0.4
0.8
c
-6 -4 -2 00
5
10
0.0
0.4
0.8 d
Log Time (s)
-6 -4 -2 00
2
4
6
Fluo
resc
ence
Em
issi
on (a
rbitr
ary
unit)
F(t)
F(t)
F(t)
Fu(t)
F(t)
[QA-QB
2-]
[QA-QB]
[QA-QB
-]
[PQH2]
O
J
I
P
37
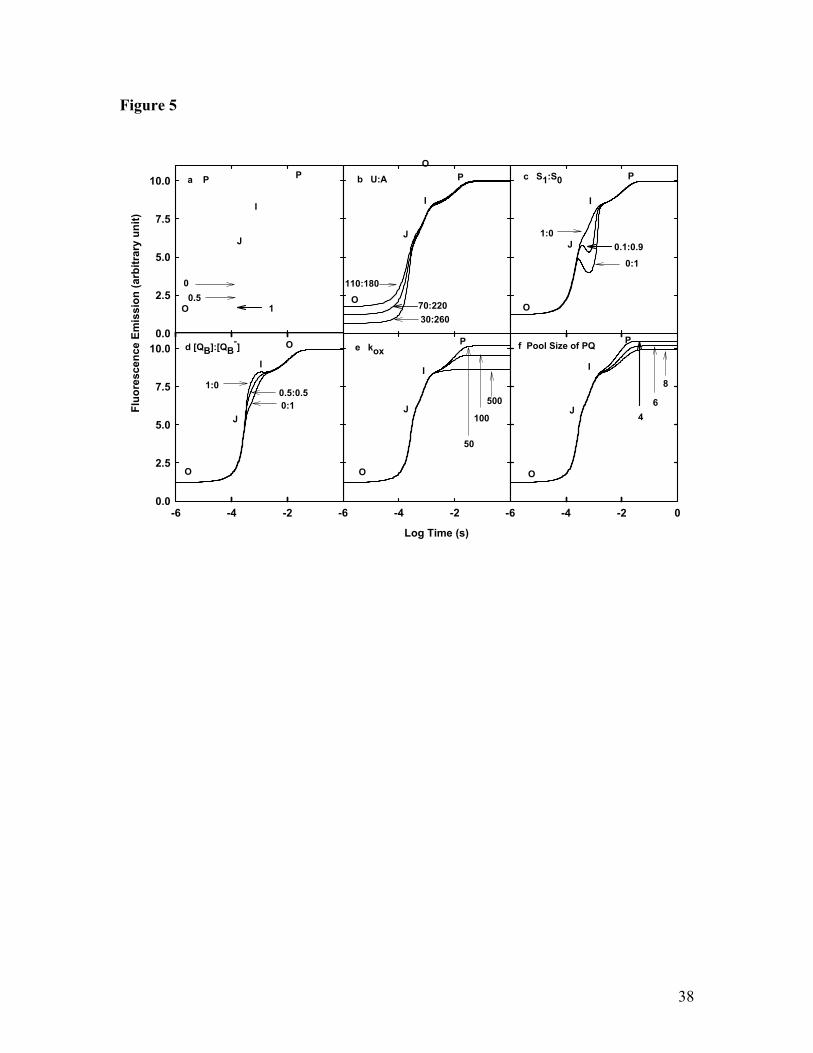
Figure 5
Log Time (s)
-6 -4 -2 -6 -4 -2 0
0.0
2.5
5.0
7.5
10.0
-6 -4 -2
Fluo
resc
ence
Em
issi
on (a
rbitr
ary
unit)
0.0
2.5
5.0
7.5
10.0
a P b U:A c S1:S0
f Pool Size of PQd [QB]:[QB-]
0
1
110:180
30:260
1:0
0:1
1:00.5:0.5
50
500
8
0.570:220
0.1:0.9
0:1100
6
e kox
4
P
I
J
OO
J
I
P
O
J
I
P
O
O
J
I
O
O
J
I
P P
I
J
O
38
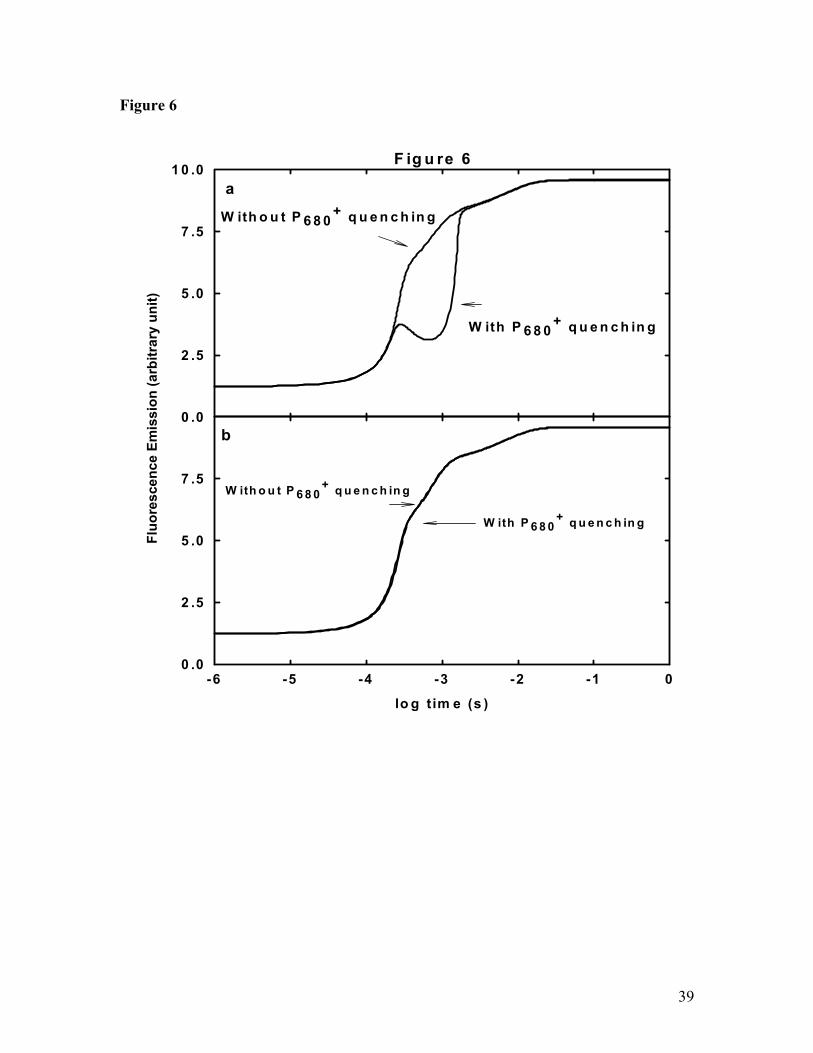
Figure 6
0 .0
2 .5
5 .0
7 .5
1 0 .0
W ith P 6 8 0+ q u e n c h in g
W ith o u t P 6 8 0+ q u e n c h in g
lo g tim e (s )
-6 -5 -4 -3 -2 -1 0
Fluo
resc
ence
Em
issi
on (a
rbitr
ary
unit)
0 .0
2 .5
5 .0
7 .5
W ith P 6 8 0+ q u e n c h in g
W ith o u t P 6 8 0+ q u e n c h in g
a
b
F ig u re 6
39

a
Log10 (Time, s)
-4 -2 0 2
Fluo
resc
ence
Yie
ld (a
rbitu
ry u
nit)
0
2
4
6
8
10
010%20%25%30%40%
% of inactive PSII center
0.0 0.1 0.2 0.3 0.4 0.5 0.6
F v/Fm
0.5
0.6
0.7
0.8
0.9
1.0
b
Figure 7
40

Table 1
Parameters used in the model of fluorescence induction.
Description Abb
r. Typical value Reference
Incident photon flux density
Iin
3,000 μmol m-2
s-1
The probability of the migration of excitation
energy from core antenna of closed reaction
centers to that of open reaction centers
p
0~1
Empirical
parameter
for our
model
Speed of light c 3 × 10⁸ m s-1
Planck’s constant h 6.62 ×10⁻³⁴ J s
Boltzmann constant
k 1.38 ×10⁻²³ J K-1
Rate constant of electron transfer from Pheo- to
QA
k2 2 × 10⁹ s-1
(Lazar &
Pospisil,
1999,
Roelofs et
al., 1992)
Rate constant of the exchange of PQ with QB2- k3
800 s-1
(Lazar,
1999)
Rate constant of electron transfer from QA- to
QB
kAB1 2500 s-1(Lazar,
1999)
41
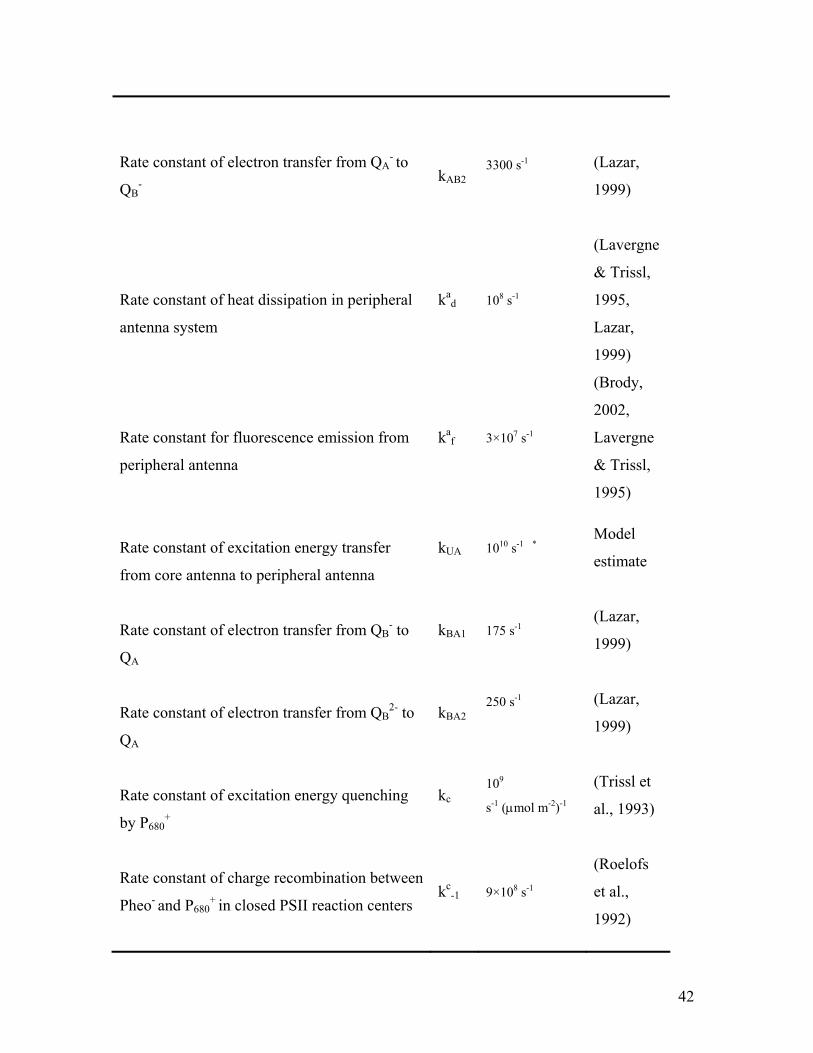
Rate constant of electron transfer from QA- to
QB-
kAB23300 s-1
(Lazar,
1999)
Rate constant of heat dissipation in peripheral
antenna system
kad 108 s-1
(Lavergne
& Trissl,
1995,
Lazar,
1999)
Rate constant for fluorescence emission from
peripheral antenna
kaf 3×10⁷ s-1
(Brody,
2002,
Lavergne
& Trissl,
1995)
Rate constant of excitation energy transfer
from core antenna to peripheral antenna
kUA 1010 s-1 *Model
estimate
Rate constant of electron transfer from QB- to
QA
kBA1 175 s-1(Lazar,
1999)
Rate constant of electron transfer from QB2- to
QA
kBA2250 s-1
(Lazar,
1999)
Rate constant of excitation energy quenching
by P680+
kc109
s-1 (μmol m-2)-1
(Trissl et
al., 1993)
Rate constant of charge recombination between
Pheo- and P680+
in closed PSII reaction centers
kc-1 9×10⁸ s-1
(Roelofs
et al.,
1992)
42

Rate constant of charge separation of closed
PSII reaction centers
kcl 4×10⁹ s-1
(Roelofs
et al.,
1992)
Equilibrium constant for electron transfer
between Pheo and QA
Ke 106 Model
estimate
Rate constant of transition from So to S1 state ko01 50 s-1
(Dekker et
al., 1984)
Rate constant of charge recombination between
Pheo- and P680+
in open PSII reaction center
ko-1 3×10⁸ s-1
(Roelofs
et al.,
1992)
Rate constant of transition from S1 to S2 state ko12 30,000 s-1
(Dekker et
al., 1984)
Rate constant of transition from S2 to S3 state ko23 10,000 s-1
(Dekker et
al., 1984)
Rate constant of transition from S3 to S0 state ko30 3000 s-1
(Dekker et
al., 1984)
Rate constant of charge separation in open PSII
reaction center
kol 2.5×10¹⁰ s-1
(Roelofs
et al.,
1992)
Rate constant of PQH2 oxidation
kox 50~500 s-1(Lazar,
1999)
Rate constant of excitation energy quenching
by oxidized plastoquinone
kq3 × 106
s-1 (μmol m-2)-1
Model
estimate
kr3 80~800 s-1 (Crofts et
43

Rate constant of the exchange of PQH2 with QB al., 1984,
Golbeck
& Kok,
1979)
Rate constant of excitation energy transfer
from core antenna to reaction center of PSII
kt Implicit s-1
Rate constant of excitation energy transfer
from reaction center to core antenna of PSII
k-t Implicit s-1
Rate constant of excitation energy transfer
from peripheral antenna to core antenna of
PSII
kAU 1010 s-1 *Model
estimate
Rate constant of heat dissipation in core
antenna associated with closed PSII reaction
centers
kUcd 108 s-1
(Lazar &
Pospisil,
1999,
Roelofs et
al., 1992)
Rate constant for fluorescence emission from
core antenna of PSII
kUf 3×10⁷ s-1
(Brody,
2002,
Lavergne
& Trissl,
1995)
Rate constant of heat dissipation in core
antenna associated with open PSII reaction
centers
kUod 0.00 s-1
(Roelofs
et al.,
1992)
Rate constant of electron transfer from oxygen
evolution complex to P680+
kz 5×10⁶ s-1(Lazar,
1999)
44

The number of chlorophylls in the core antenna
of an active PSII reaction center
N 70
(Peter &
Thornber,
1991)
Temperature T 298 K
The peak wavelength of light absorbance of
chlorophyll in PSII reaction center
λP 680 nm (Schatz et
al., 1988)
The peak wavelength of light absorbance of
certain chlorophyll
λabs
Dependent on
the location of
the chlorophyll
The peak wavelength of light absorbance of
chlorophyll in core antenna
λChl 673 nm (Schatz et
al., 1988)
Table 1 , cont.
* Estimated value based on the rate of excitation energy transfer between chlorophylls.
45

Table 2
Comparisons of the major assumptions and results of current models of fluorescence
induction.
Model Major Assumptions Major results and
conclusions
Stirbet et al.
(1998)
The model incorporates reactions at
both the acceptor side and the donor
sides of photosystem II, and
excitation energy quenching by the
oxidized plastoquinone molecules
from the lipid matrix of the thylakoid
membrane. Chlorophyll fluorescence
is calculated based on the redox state
of QA.
The point J corresponds
to peak [QA-QB], the
point I corresponds to
peak [QA-QB
-], and point
P corresponds to peak
[QA-QB
2-].
Lebedeva et al.
(2002)
This model includes a) a detailed
description of reactions related to
PSII, PSI, cytochrome b6f complex,
ATP synthesis, and the possible
leakage of H+, K+, and Cl- through
thylakoid membrane; b) the
dependence of electron transfer rate
on the membrane potential; c) no
molecular mechanism of the oxygen
evolution complex.
The model describes FI
under different light
conditions.
Fluorescence at every
moment is determined
by the sum of
fluorescence emission
by different
fluorescence-emiting
PSII states.
Trissl and
Lavergne
(1995)
The model assumes a) a
homogeneous PSII population, b) an
exciton-radical pair equilibrium
A simple analytical
relation is derived
describing fluorescence
46

mechanism, c) different rates of
exciton transfer between core and
peripheral antenna beds, d) a
calculation of fluorescence emission
based on the amount of excited
singlet chlorophyll in both core and
peripheral antenna
induction kinetics under
the presence of DCMU.
47

Lazar (2003) The model a) assumes equilibrium of
excited energy among all light
harvesting and reaction center
pigments, b) assumes reversible
radical pair formation mechanism, c)
considers both the acceptor side and
donor side reactions and PSII
heterogeneity, d) calculates
chlorophyll fluorescence based on
concentrations of different forms of
fluorescence-emitting excited state
forms.
1) Fo phase is influenced
by primary
photochemistry of PSII
and non-radiative loss
of excitation energy, 2)
the point J is influenced
by P680+ quenching,
changes in the rate
constant of electron
transfer from QA- to QB
due to different S states
of OEC, 3) the P point
is influenced by the
state transition of OEC
and electron transfer
from QA- to QB.
Vredenberg
(2000)
The model a) categorizes the reaction
center into open, semi-open and
closed states which can accept 2, 1
and 0 electrons respectively, b)
assumes at least two turnovers are
required for stationary closure of a
reaction center, c) considers the back
transfer of excitons from open and
semi-open reaction center to antenna,
d) does not consider oxygen
evolution mechanism, e) does not
include reaction mechanisms after QA
reduction.
Light dependent
changes in the rate
constant of charge
recombination causes
changes in Fo.
Fluorescence at point J
corresponds to
accumulation of
photosynthetic units in
the semi-open state.
Fluorescence at point I
is interpreted to be of
systems with 100% of
48
reaction centers closed.
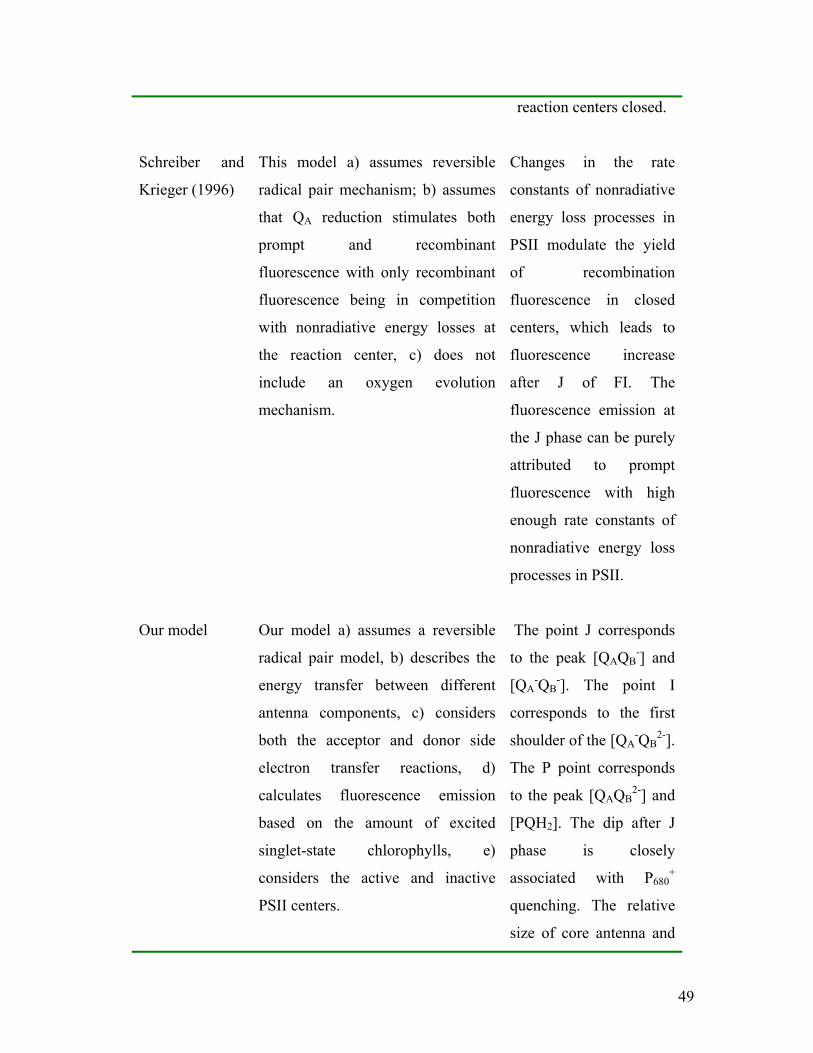
Schreiber and
Krieger (1996)
This model a) assumes reversible
radical pair mechanism; b) assumes
that QA reduction stimulates both
prompt and recombinant
fluorescence with only recombinant
fluorescence being in competition
with nonradiative energy losses at
the reaction center, c) does not
include an oxygen evolution
mechanism.
Changes in the rate
constants of nonradiative
energy loss processes in
PSII modulate the yield
of recombination
fluorescence in closed
centers, which leads to
fluorescence increase
after J of FI. The
fluorescence emission at
the J phase can be purely
attributed to prompt
fluorescence with high
enough rate constants of
nonradiative energy loss
processes in PSII.
Our model Our model a) assumes a reversible
radical pair model, b) describes the
energy transfer between different
antenna components, c) considers
both the acceptor and donor side
electron transfer reactions, d)
calculates fluorescence emission
based on the amount of excited
singlet-state chlorophylls, e)
considers the active and inactive
PSII centers.
The point J corresponds
to the peak [QAQB-] and
[QA-QB
-]. The point I
corresponds to the first
shoulder of the [QA-QB
2-].
The P point corresponds
to the peak [QAQB2-] and
[PQH2]. The dip after J
phase is closely
associated with P680+
quenching. The relative
size of core antenna and
49

peripheral antenna
influences the Fo level.
Table 2, cont.
50

Table 3
The origins and major influencing factors of different inflexion points based on this
model.
Inflexion point Origin and major influencing factors
O Influenced by the relative size of core
antenna and peripheral antenna of
PSII reaction center. Chlorophylls
detached from reaction center
contribute to fluorescence emission at
O level.
J Corresponds most closely to the peak
concentrations of QAQB- and QA
-QB-.
I Corresponds most closely to the first
shoulder of the concentration change
of QA-QB
2-
P Corresponds most closely to the peak
concentrations of QA-QB
2- and PQH2.
51

Appendix I The ordinary differential equations representing the model of fluorescence
induction (Fig. 1). This set of equations only includes the differential equations
representing the change of concentrations of components associated with active PSII
reaction centers. Same set of different equations were used to describe the concentration
changes of components associated with inactive PSII reaction centers. The inactive and
active reaction centers were assumed to share the same plastoquinol pool. The differential
equation for [PQH2] in the full model combines the contributions from reactions
associated with both active and inactive reaction centers. The rate equation for each
velocity variable is listed in Appendix II. The abbreviations of reaction velocities used in
the system of differential equations are defined in Appendix III.
PQqAqAPUAAUAdAfap vvvvvvI
dtAd
−−+−−−= 680
][
PQqUqUPUdUfUAAUc vvvvvvvvIdtUd
−+−−−−−+= 1_1680][
1_21_21_11680 ][
rz vvvvvdtPheoPd
+−−−= −
−+
2_1_21_2680 ][
zr vvvdt
PheoPd−−=
+
2_22_21_680 ][
rz vvvdtPheoPd
+−=−
ZssT vv
dtSd
11_01 ][
−=
ZssT vv
dtSd
22_12 ][
−=
ZssT vv
dtSd
33_23 ][
−=
ZssT vv
dtSd
00_30 ][
−=
2_111 ][
ssZpT vv
dtSd
−=
3_222 ][
ssZpT vv
dtSd
−=
0_333 ][
ssZpT vv
dtSd
−=
52

1_000 ][
ssZpT vv
dtSd
−=
2_00_21_00_22_00_21_00_23_3][
rrrBA vvvvvv
dtQQd
++−−−=
nrnBAABrrBA vvvvvvvv
dtQQd
_3__3112_00_21_00_22_00_21_00_2][
−++−−−+=−
2_01_21_01_22_01_21_01_211][
rrBAABBA vvvvvv
dtQQd
++−−−=−
2_01_21_01_22_01_21_01_222][
rrABBABA vvvvvv
dtQQd
−−++−=−−
2_02_21_02_22_02_21_02_23_322
2 ][rrrBAAB
BA vvvvvvvvdtQQd
++−−+−−=−
2_02_21_02_22_02_21_02_2_3_3_
2 ][rrnnr
BA vvvvvvdtQQd
−−++−=−−
oxpqnrrn vvvvvdt
PQHd___3_3__33
2 ][−−−+=
53

Appendix II. The rate equations describing the reactions associated with active reaction
centers used in the model of fluorescence induction. The set of equations for the reactions
associated with the inactive reaction centers were similar to this set and not listed. See
appendix for definition of abbreviations. The details for derivation of each rate equations
are in the main text. The detailed description for each abbreviation was listed in
Appendix III except that the rate constants are listed in table 1.
Ia= 220Iin/(290 + 200n + 70x + 220x + 200nx)
Ic= 70 Iin/(290 + 200n + 70x + 220x + 200nx)
Ai = 220xIin/(290 + 200n + 70x + 220x + 200nx)
Uif = 35xIin/(290 + 200n + 70x + 220x + 200nx)
vAf = [Ap]kaf
vAd = [Ap]kad
vAU =[Ap]kAU(1 – x/(1+x))
vUA =[U]kUA
vUf = [U]kuf
vUd = [U](1-q)kUcd+ [U]qkUo
d
where q = [QA]/([QA]+ [QA-])
where [QA] = [QAQB]+[QAQB-]+[QAQB
2-]
[QA-] = [QA
-QB] + [QA-QB
-] + [QA-QB
2-]
v1 = q[P680*Pheo]ko
1 + [P680*Pheo](1-q)(1-p)kc
1+[P680*Pheo](1-q)pko
1
where [P680*Pheo] = [U][P680Pheo] )1(
t
t
kk−+ -1/70
and )])(/(exp[ 11 −−− −−= PChlt
t kThckk λλ
v-1 = q[P680+Pheo-]ko
-1 + (1-q)[P680+Pheo-]kc
-1
vS1_S2 = [S1Tp]ko12
vS2_S3 = [S2Tp]ko23
vS3_S0 = [S3Tp]ko30
vS0_S1 = [S0Tp]ko01
54
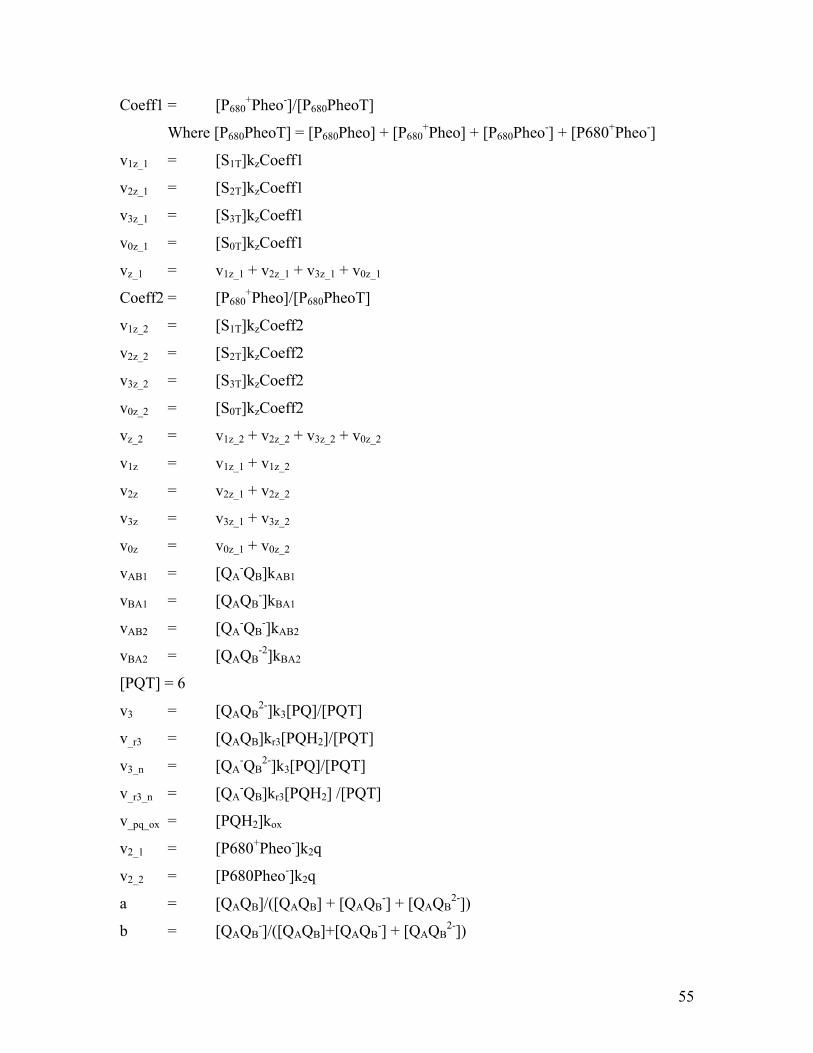
Coeff1 = [P680+Pheo-]/[P680PheoT]
Where [P680PheoT] = [P680Pheo] + [P680+Pheo] + [P680Pheo-] + [P680+Pheo-]
v1z_1 = [S1T]kzCoeff1
v2z_1 = [S2T]kzCoeff1
v3z_1 = [S3T]kzCoeff1
v0z_1 = [S0T]kzCoeff1
vz_1 = v1z_1 + v2z_1 + v3z_1 + v0z_1
Coeff2 = [P680+Pheo]/[P680PheoT]
v1z_2 = [S1T]kzCoeff2
v2z_2 = [S2T]kzCoeff2
v3z_2 = [S3T]kzCoeff2
v0z_2 = [S0T]kzCoeff2
vz_2 = v1z_2 + v2z_2 + v3z_2 + v0z_2
v1z = v1z_1 + v1z_2
v2z = v2z_1 + v2z_2
v3z = v3z_1 + v3z_2
v0z = v0z_1 + v0z_2
vAB1 = [QA-QB]kAB1
vBA1 = [QAQB-]kBA1
vAB2 = [QA-QB
-]kAB2
vBA2 = [QAQB-2]kBA2
[PQT] = 6
v3 = [QAQB2-]k3[PQ]/[PQT]
v_r3 = [QAQB]kr3[PQH2]/[PQT]
v3_n = [QA-QB
2-]k3[PQ]/[PQT]
v_r3_n = [QA-QB]kr3[PQH2] /[PQT]
v_pq_ox = [PQH2]kox
v2_1 = [P680+Pheo-]k2q
v2_2 = [P680Pheo-]k2q
a = [QAQB]/([QAQB] + [QAQB-] + [QAQB
2-])
b = [QAQB-]/([QAQB]+[QAQB
-] + [QAQB2-])
55

c = [QAQB2-]/([QAQB]+[QAQB
-] + [QAQB2-])
v2_00_1 = v2_1a
v2_01_1 = v2_1b
v2_02_1 = v2_1c
v2_00_2 = v2_2a
v2_01_2 = v2_2b
v2_02_2 = v2_2c
CE1 = [P680+Pheo]/[P680PheoT]
vr2_00_1 = CE1[QA-QB]k2/Ke
vr2_01_1 = CE1[QA-QB
-]k2 /Ke
vr2_02_1 = CE1[QA-QB
-2]k2/Ke
vr2_1 = vr2_00_1 + vr2_01_1 + vr2_02_1
CE2 = [P680Pheo]/[P680PheoT]
vr2_00_2 = CE2[QA-QB]k2/Ke
vr2_01_2 = CE2[QA-QB
-]k2/Ke
vr2_02_2 = CE2[QA-QB
-2] × k2/Ke
vr2_2 = vr2_00_2 + vr2_01_2 + vr2_02_2
vP680qU = [U]([P680+Pheo] + [P680
+Pheo-])kc
vP680qA = [A]([P680+Pheo] + [P680
+Pheo-])kc
kq = 0.15(kf + kh)/ [PQT]
vPQqU = [U][PQ]kq
vPQqA = [A][PQ]kq
Φf = kafAp + ([U]+[Ui])ku
f + kaf[Aip] + ku
f[Uifc]
56

Appendix III Definitions of all abbreviations except rate constants used in the model.
Abbrev. Description Unit
[Ap] Concentration of excitation energy on
peripheral antenna of photosystem II μmol m-2
[P680*Pheo]
The concentration of excited P680 associated
with Pheo
μmol m-2
[P680+Pheo]
The concentration of P680+ associated with
Pheo
μmol m-2
[P680+Pheo-
]
The concentration of P680+ associated with
Pheo-
μmol m-2
[P680Pheo]
The concentration of P680 associated with
Pheo
μmol m-2
[P680Pheo-]
The concentration of P680 associated with
Pheo-
μmol m-2
[P680PheoT
]
The total concentration of P680Pheo,
P680+Pheo, P680Pheo- and P680
+Pheo-.
μmol m-2
[PQ]
The concentration of plastoquinone μmol m-2
[PQ]
The concentration of oxidized
plastoquinone
μmol m-2
[PQH2]
The concentration of fully reduced
plastoquinone
μmol m-2
57
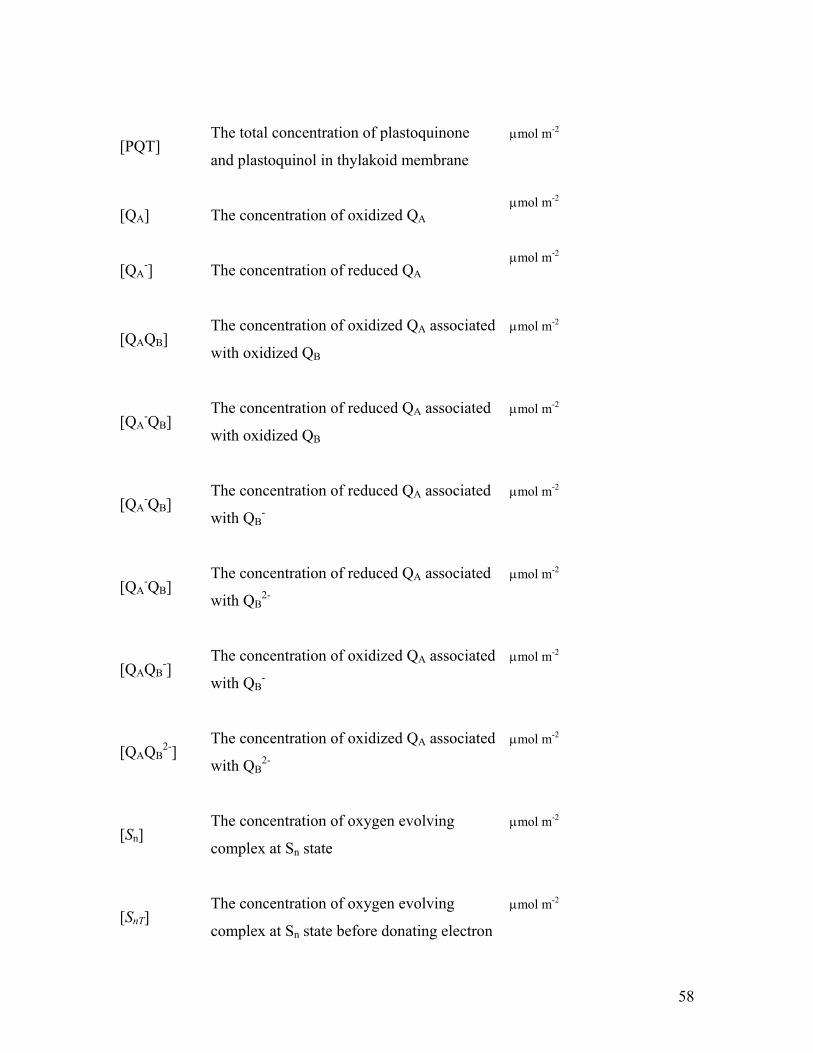
[PQT]
The total concentration of plastoquinone
and plastoquinol in thylakoid membrane
μmol m-2
[QA]
The concentration of oxidized QAμmol m-2
[QA-]
The concentration of reduced QAμmol m-2
[QAQB]
The concentration of oxidized QA associated
with oxidized QB
μmol m-2
[QA-QB]
The concentration of reduced QA associated
with oxidized QB
μmol m-2
[QA-QB]
The concentration of reduced QA associated
with QB-
μmol m-2
[QA-QB]
The concentration of reduced QA associated
with QB2-
μmol m-2
[QAQB-]
The concentration of oxidized QA associated
with QB-
μmol m-2
[QAQB2-]
The concentration of oxidized QA associated
with QB2-
μmol m-2
[Sn]
The concentration of oxygen evolving
complex at Sn state
μmol m-2
[SnT]
The concentration of oxygen evolving
complex at Sn state before donating electron
μmol m-2
58
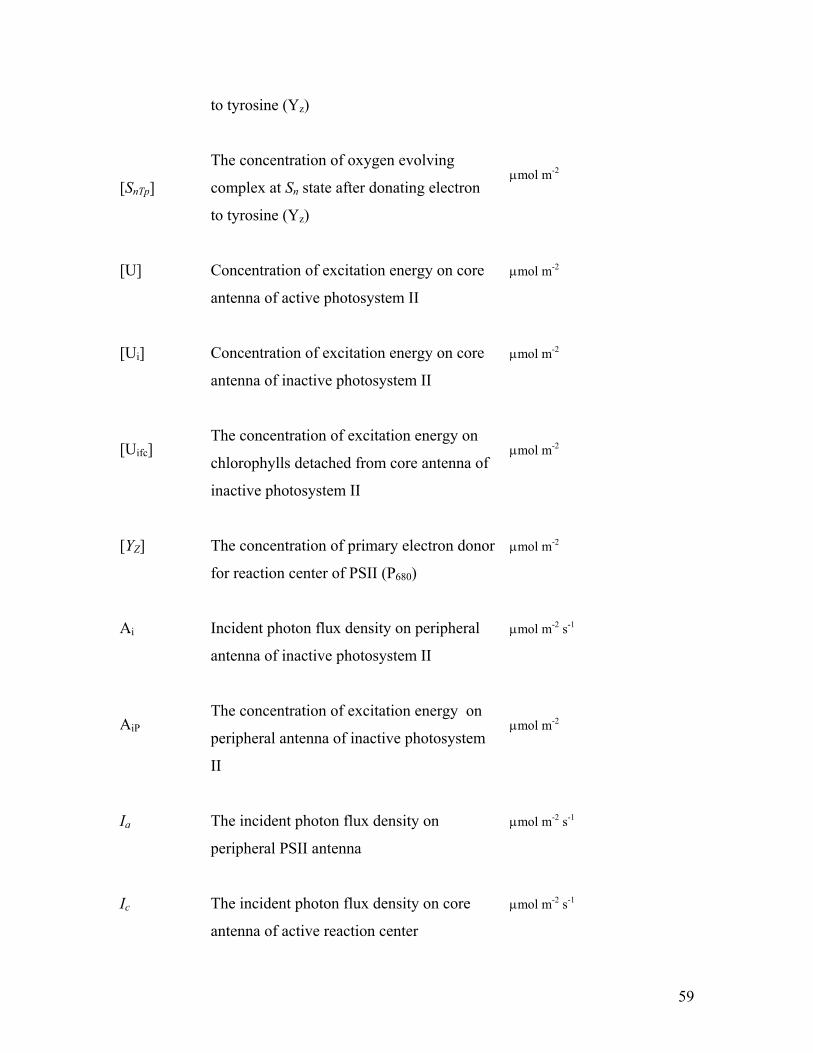
to tyrosine (Yz)
[SnTp]
The concentration of oxygen evolving
complex at Sn state after donating electron
to tyrosine (Yz)
μmol m-2
[U]
Concentration of excitation energy on core
antenna of active photosystem II
μmol m-2
[Ui]
Concentration of excitation energy on core
antenna of inactive photosystem II
μmol m-2
[Uifc]
The concentration of excitation energy on
chlorophylls detached from core antenna of
inactive photosystem II
μmol m-2
[YZ]
The concentration of primary electron donor
for reaction center of PSII (P680)
μmol m-2
Ai
Incident photon flux density on peripheral
antenna of inactive photosystem II
μmol m-2 s-1
AiP
The concentration of excitation energy on
peripheral antenna of inactive photosystem
II
μmol m-2
Ia
The incident photon flux density on
peripheral PSII antenna
μmol m-2 s-1
Ic
The incident photon flux density on core
antenna of active reaction center
μmol m-2 s-1
59

Iin
The total incident photon flux density μmol m-2 s-1
n
The ratio of PSI to PSII NA
P680
The reaction center chlorophyll of PSII. It
can exist in native state (P680), excited state
(P680*), or oxidized state (P680
+).
NA
Pheo
Pheophytin, the first electron acceptor of
primary charge separation in PSII. It can
exist in either native state (Pheo) or reduced
state (Pheo-).
NA
q
The proportion of oxidized QAΝΑ
QA
The first quinine electron acceptor of PSII NA
QB
The second quinine electron acceptor of
PSII
ΝΑ
Uif
Incident photon flux density on chlorophylls
detached from core antenna of inactive
photosystem II
μmol m-2 s-1
v_pq_ox
The rate of PQH2 oxidation by cyt b6f μmol m-2 s-1
v_r3
The rate of the exchange of PQH2 with QB
associated with QA
μmol m-2 s-1
v_r3_n
The rate of exchange of PQH2 with QB μmol m-2 s-1
60
associated with QA-
v1
The rate of charge separation in the active
PSII reaction center
μmol m-2 s-1
v-1
The rate of charge recombination in the
active PSII reaction center
μmol m-2 s-1
v2_0m_n
The rate of reactions relating to electron
transfer from Pheo- to QA where m
represents the redox state of QB with 0 for
QB, 1 for QB- and 2 for QB
-2, and n
represents the redox state of P680 with 1 for
P680+ and 2 for P680, e.g. v2_00_1: the rate of
reduction of QAQB by P680+Pheo-
μmol m-2 s-1
v2_1
The rate of QA reduction by P680+Pheo-
μmol m-2 s-1
v2_2
The rate of QA reduction by P680Pheo- μmol m-2 s-1
v3
The rate of exchange of PQ with QB2-
associated with QA
μmol m-2 s-1
v3_n
The rate of exchange of PQ with QB2-
associated with QA-
μmol m-2 s-1
vAB1
The rate of electron transfer from QA- to QB
μmol m-2 s-1
vAB2
The rate of electron transfer from QA- to QB
- μmol m-2 s-1
61
vAd
The rate of heat dissipation from the
peripheral antenna
μmol m-2 s-1
vAf
The rate of fluorescence emission from the
peripheral antenna
μmol m-2 s-1
vAU
The rate of excitation energy transfer from
peripheral to core antenna
μmol m-2 s-1
vBA1
The rate of electron transfer from QB- to QA
μmol m-2 s-1
vBA2
The rate of electron transfer from QB-2 to QA
μmol m-2 s-1
vnz
The rate of oxidation of Sn state of oxygen
evolution complex
μmol m-2 s-1
vnz_1
The rate of electron transfer from oxygen
evolution complex at Sn state to P680+
associated with Pheo- via Yz
μmol m-2 s-1
vnz_2
The rate of electron transfer from oxygen
evolution complex at Sn state to P680+
associated with Pheo via Yz
μmol m-2 s-1
vP680qA
The rate of quenching of excitation energy
in the peripheral antenna by P680+
μmol m-2 s-1
vP680qU
The rate of quenching of excitation energy
in the core antenna by P680+
μmol m-2 s-1
vPQqA μmol m-2 s-1
62

The rate of quenching of excitation energy
in the peripheral antenna by oxidized
plastoquinone
vPQqU
The rate of quenching of excitation energy
in the core antenna by oxidized
plastoquinone
μmol m-2 s-1
vr2_0m_n
The back reaction of v2_0m_n, see v2_0m_n for
details
μmol m-2 s-1
vr2_1
The rate of QA- oxidation by P680
+Pheo μmol m-2 s-1
vr2_2
The rate of QA- oxidation by P680Pheo
μmol m-2 s-1
vsm_sn
The rate of transition from Sm state to Sn
state of oxygen evolution complex
μmol m-2 s-1
vUA
The rate of excitation energy transfer from
core antenna to peripheral antenna
μmol m-2 s-1
vUd
The rate of heat dissipation of excitation
energy from the core antenna of active PSII
reaction center
μmol m-2 s-1
vUf
The rate of fluorescence emission from the
core antenna of active reaction center
μmol m-2 s-1
vz_1
The rate of P680+Pheo- reduction
μmol m-2 s-1
vz_2
The rate of P680+Pheo reduction
μmol m-2 s-1
63

x
The ratio of the concentration of inactive
PSII reaction center to that of active
reaction center
NA
Φf
Fluorescence yield μmol m-2 s-1
64