chloride in groundwater and surface water inareas ... in groundwater and surface water in areas...
TRANSCRIPT

U.S. Department of the InteriorU.S. Geological Survey
Scientific Investigations Report 2009–5086
National Water-Quality Assessment Program
Chloride in Groundwater and Surface Water inAreas Underlain by the Glacial Aquifer System,Northern United States

Cover. Rock salt being unloaded off of a ship in Oswego, New York, October, 2007 (James Rajotte/The New York Times/Redux)

Chloride in Groundwater and Surface Water in Areas Underlain by the Glacial Aquifer System, Northern United States
By John R. Mullaney, David L. Lorenz, and Alan D. Arntson
National Water-Quality Assessment Program
Scientific Investigations Report 2009–5086
U.S. Department of the InteriorU.S. Geological Survey

U.S. Department of the InteriorKEN SALAZAR, Secretary
U.S. Geological SurveySuzette M. Kimball, Acting Director
U.S. Geological Survey, Reston, Virginia: 2009
For product and ordering information:World Wide Web: http://www.usgs.gov/pubprodTelephone: 1-888-ASK-USGS
For more information on the USGS—the Federal source for science about the Earth, its natural and living resources, natural hazards, and the environment:World Wide Web: http://www.usgs.govTelephone: 1-888-ASK-USGS
Any use of trade, product, or firm names is for descriptive purposes only and does not imply endorsement by the U.S. Government.
Although this report is in the public domain, permission must be secured from the individual copyright owners to reproduce any copyrighted materials contained within this report.
Suggested citation:Mullaney, J.R., Lorenz, D.L., Arntson, A.D., 2009, Chloride in groundwater and surface water in areas underlain by the glacial aquifer system, northern United States: U.S. Geological Survey Scientific Investigations Report 2009–5086, 41 p.

iii
Foreword The U.S. Geological Survey (USGS) is committed to providing the Nation with credible scientific informa-tion that helps to enhance and protect the overall quality of life and that facilitates effective manage-ment of water, biological, energy, and mineral resources (http://www.usgs.gov/). Information on the Nation’s water resources is critical to ensuring long-term availability of water that is safe for drinking and recreation and is suitable for industry, irrigation, and fish and wildlife. Population growth and increasing demands for water make the availability of that water, now measured in terms of quantity and quality, even more essential to the long-term sustainability of our communities and ecosystems.
The USGS implemented the National Water-Quality Assessment (NAWQA) Program in 1991 to support national, regional, State, and local information needs and decisions related to water-quality management and policy (http://water.usgs.gov/nawqa). The NAWQA Program is designed to answer: What is the con-dition of our Nation’s streams and groundwater? How are conditions changing over time? How do natural features and human activities affect the quality of streams and groundwater, and where are those effects most pronounced? By combining information on water chemistry, physical characteristics, stream habitat, and aquatic life, the NAWQA Program aims to provide science-based insights for current and emerging water issues and priorities. From 1991-2001, the NAWQA Program completed interdisciplinary assess-ments and established a baseline understanding of water-quality conditions in 51 of the Nation’s river basins and aquifers, referred to as Study Units (http://water.usgs.gov/nawqa/studyu.html).
In the second decade of the Program (2001–2012), a major focus is on regional assessments of water-quality conditions and trends. These regional assessments are based on major river basins and principal aquifers, which encompass larger regions of the country than the Study Units. Regional assessments extend the findings in the Study Units by filling critical gaps in characterizing the quality of surface water and groundwater, and by determining status and trends at sites that have been consistently monitored for more than a decade. In addition, the regional assessments continue to build an understanding of how natural features and human activities affect water quality. Many of the regional assessments employ modeling and other scientific tools, developed on the basis of data collected at individual sites, to help extend knowledge of water quality to unmonitored, yet comparable areas within the regions. The models thereby enhance the value of our existing data and our understanding of the hydrologic system. In addi-tion, the models are useful in evaluating various resource-management scenarios and in predicting how our actions, such as reducing or managing nonpoint and point sources of contamination, land conversion, and altering flow and (or) pumping regimes, are likely to affect water conditions within a region.
Other activities planned during the second decade include continuing national syntheses of information on pesticides, volatile organic compounds (VOCs), nutrients, selected trace elements, and aquatic ecology; and continuing national topical studies on the fate of agricultural chemicals, effects of urbanization on stream ecosystems, bioaccumulation of mercury in stream ecosystems, effects of nutrient enrichment on stream ecosystems, and transport of contaminants to public-supply wells.
The USGS aims to disseminate credible, timely, and relevant science information to address practical and effective water-resource management and strategies that protect and restore water quality. We hope this NAWQA publication will provide you with insights and information to meet your needs, and will foster increased citizen awareness and involvement in the protection and restoration of our Nation’s waters.
The USGS recognizes that a national assessment by a single program cannot address all water-resource issues of interest. External coordination at all levels is critical for cost-effective management, regulation, and conservation of our Nation’s water resources. The NAWQA Program, therefore, depends on advice and information from other agencies—Federal, State, regional, interstate, Tribal, and local—as well as nongovernmental organizations, industry, academia, and other stakeholder groups. Your assistance and suggestions are greatly appreciated.
Matthew C. Larsen
Associate Director for Water


v
Contents
Foreword ........................................................................................................................................................iiiAbstract ...........................................................................................................................................................1Introduction.....................................................................................................................................................2
Purpose and Scope ..............................................................................................................................2Sources of Salts to Water Resources ...............................................................................................2
Natural Sources ...........................................................................................................................2Atmospheric Deposition ....................................................................................................2Weathering of Common Rocks, Minerals, and Soils .....................................................5Salt Deposits and Brines ...................................................................................................5
Anthropogenic Sources ..............................................................................................................5Application of Deicing Salts ..............................................................................................8Landfills.................................................................................................................................8Wastewater and Water Treatment ..................................................................................8Agriculture .........................................................................................................................12
Methods of Data Analysis ..........................................................................................................................12Compilation of Environmental Data .................................................................................................12Multiple Comparison Testing ............................................................................................................12Multiple Linear Regression Modeling ............................................................................................14Estimation of Chloride Loads ............................................................................................................14
Chloride in Groundwater and Surface Water .........................................................................................14Groundwater ........................................................................................................................................15
Sources of Chloride in Groundwater ......................................................................................16Surface Water .....................................................................................................................................18
Relation of Maximum Chloride Concentration to Explanatory Variables .........................19Loads and Yields of Chloride from Forested, Agricultural, and Urban Basins.................19Relation of Chloride Yield to Explanatory Variables .............................................................23Trends in Loads at Selected Sites and Evaluation of Sources of Chloride ......................23
Summary and Conclusions .........................................................................................................................31References Cited..........................................................................................................................................32Appendix 1 Surface-Water-Quality Monitoring Stations Used in Analyses for Chloride
Concentration or Load Estimation (or Both) ..............................................................................37

vi
Figures 1. Graphs showing— 1. Salt use and consumption in the United States by (A) all end users, 1975–2003,
and (B) consumption by use or industry, 1975–2005 ......................................................3 2–5. Maps showing— 2. Glacial aquifer system and National Water-Quality Assessment Program
study basins, northern United States ...............................................................................4 3. Mean wet deposition of chloride, 1994–2003, and locations of salt mining
in the glacial aquifer system study area, northern United States ...............................6 4. Estimated average concentration of chloride, 1994–2002, in runoff attributable
to atmospheric (wet) deposition in the glacial aquifer system study area, northern United States ........................................................................................................7
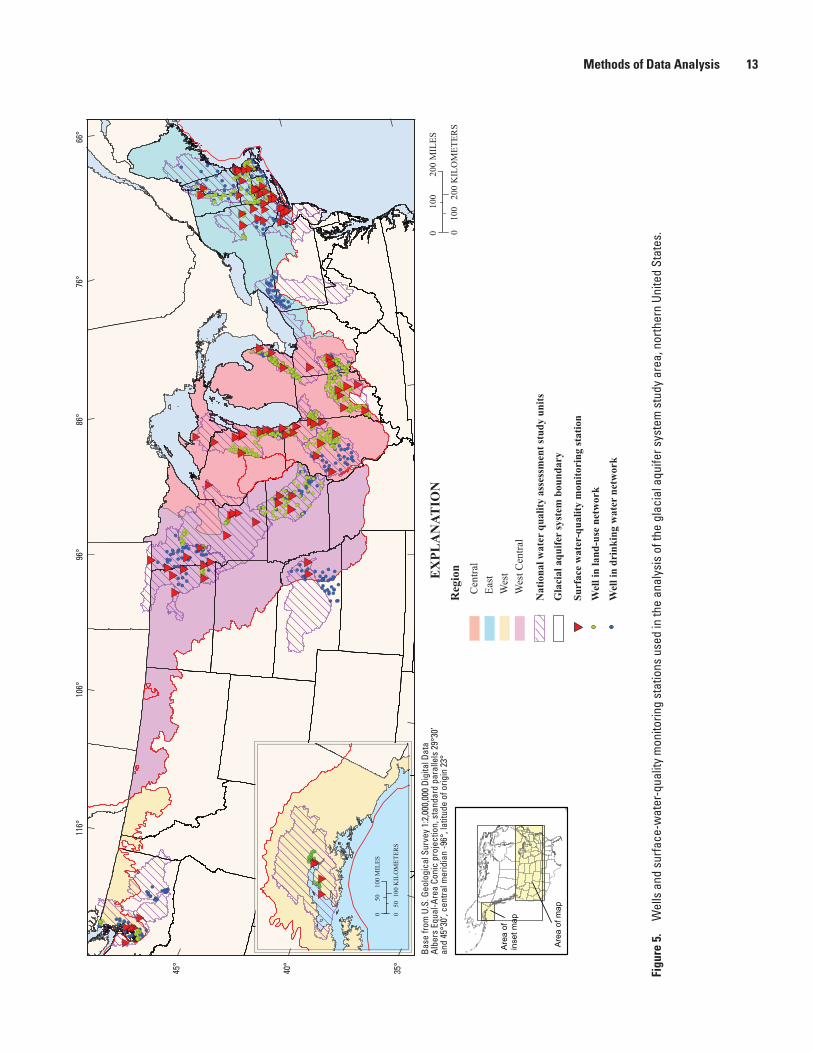
5. Wells and surface-water-quality monitoring stations used in the analysis of the glacial aquifer system study area, northern United States .................................13
6–17. Graphs showing— 6. Distribution of chloride concentrations in samples from shallow monitoring
wells in forested, agricultural, and urban areas and in drinking-water supply wells in the glacial aquifer system, northern United States, 1991–2003 ..................16
7. Distribution of sodium concentrations in samples from shallow monitoring wells in forested, agricultural, and urban areas and in drinking-water supply wells in the glacial aquifer system, northern United States, 1991–2003 ..................17
8. Distribution of chloride:bromide ratios (by mass) in samples from shallow monitoring wells in forested, agricultural, and urban areas and in drinking-water supply wells in the glacial aquifer system, northern United States, 1991–2003 ...............................................................................................................18
9. (A) Binary mixing curves representing sources of chloride. The relation of chloride concentration to chloride:bromide ratios (by mass) for samples from shallow monitoring wells in (B) forested areas, (C) agricultural areas, and (D) urban areas ...........................................................................................................20
10. Distribution of chloride:bromide ratios (by mass) in samples from drinking- water supply wells in geographic regions of the glacial aquifer system, northern United States, 1991–2003 .................................................................................23
11. Distribution of maximum chloride concentrations measured at selected surface-water-quality monitoring stations in the glacial aquifer system, northern United States, 1991–2004 .................................................................................24
12. Chloride concentrations, snow depth, and discharge at station 05288705, Shingle Creek at Queen Avenue in Minneapolis, Minnesota, February 1997 ..........26
13. Chloride concentrations in base flow, plotted against maximum measured chloride concentrations at selected forested, agricultural, and urban basins in the glacial aquifer system, northern United States, 1991–2004 .............................27

vii
14. Predicted natural log of maximum measured chloride concentrations from multiple linear regression modeling, and observed natural log of maximum measured chloride concentrations in selected forested, agricultural, and urban basins in the glacial aquifer system, northern United States, 1991–2004 .....28
15. Distribution of annual mean chloride yields at selected surface-water-quality monitoring stations in the glacial aquifer system, northern United States, 1991–2003 ............................................................................................................................28
16. Predicted natural log of annual chloride yield from multiple linear regression modeling and observed natural log of chloride yield in selected forested, agricultural, and urban basins in the glacial aquifer system, northern United States, 1991–2003 ...............................................................................................................29
17. Chloride loads with time at selected water-quality monitoring stations in the glacial aquifer system, northern United States: (A) Poplar Creek at Elgin, Illinois, water years 1978–2003; (B) Quinnipiac River at Wallingford, Connecticut, water years 1969–2003; and (C) Rahway River near Springfield, New Jersey, water years 1980–2003 ..............................................................................30
Tables 1. Estimated wet deposition of chloride on the glacial aquifer system, northern
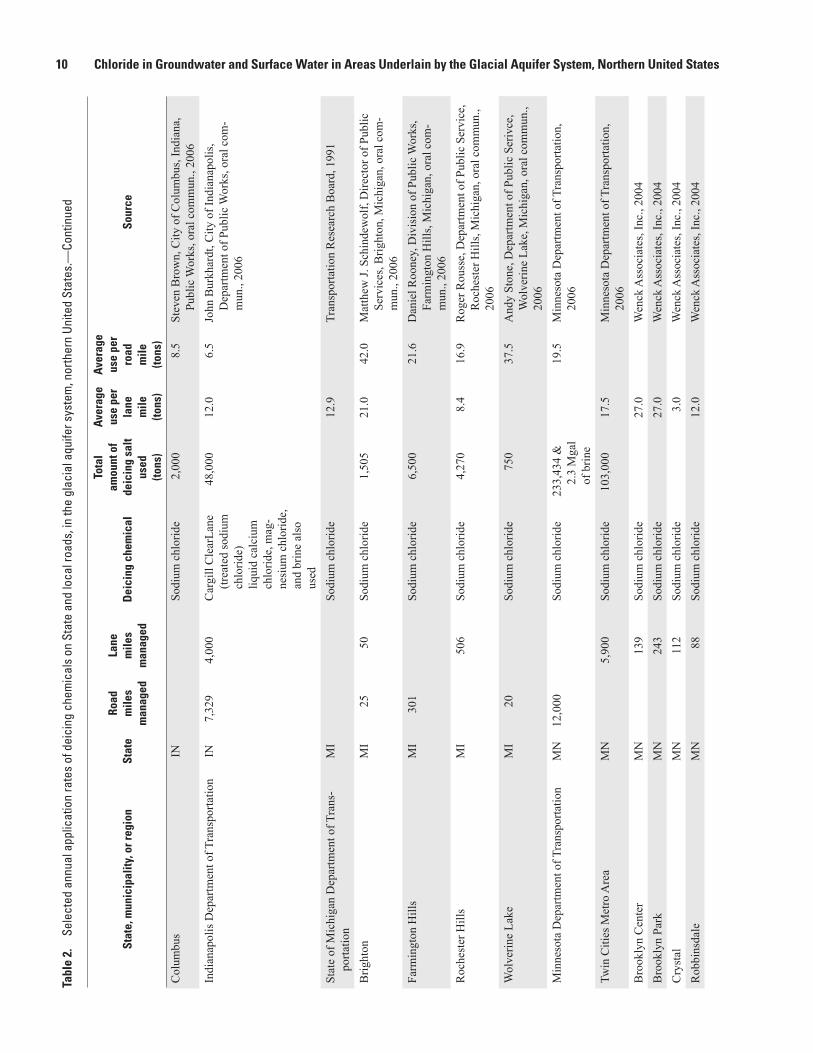
United States, 1994–2003 .............................................................................................................5 2. Selected annual application rates of deicing chemicals on State and local roads
in the glacial aquifer system, northern United States ............................................................9 3. Watershed characteristics evaluated in a regression analysis of maximum
measured chloride concentrations .........................................................................................15 4. Chloride:bromide ratios for sources of chloride to water resources ................................22 5. Monitoring stations where surface waters had chloride concentrations greater
than 230 milligrams per liter in the glacial aquifer system, northern United States, 1991–2004 .....................................................................................................................................25
6. Multiple linear-regression estimates of model coefficients, standard errors, t-statistic and p-values for the dependent variable natural log of maximum measured chloride concentration in surface water for selected urban, agricultural, and forested basins, in the glacial aquifer system, northern United States, 1991–2004 ...........................................................................................................27
7. Multiple linear regression estimates of model coefficients and standard errors, t-statistics, and p-values for the dependent variable natural log of chloride yield, selected forested, agricultural and urban basins in the glacial aquifer system, northern United States, 1991–2003 ..........................................................................................29

viii
Conversion Factors
Multiply By To obtainLength
inch (in.) 2.54 centimeter (cm)inch (in.) 25.4 millimeter (mm)foot (ft) 0.3048 meter (m)mile (mi) 1.609 kilometer (km)
Areasquare mile (mi2) 259.0 hectare (ha)square mile (mi2) 2.590 square kilometer (km2)
Volumegallon (gal) 3.785 liter (L) gallon (gal) 0.003785 cubic meter (m3) gallon (gal) 3.785 cubic decimeter (dm3) million gallons (Mgal) 3,785 cubic meter (m3)cubic foot (ft3) 28.32 cubic decimeter (dm3) cubic foot (ft3) 0.02832 cubic meter (m3)
Flow ratecubic foot per second (ft3/s) 0.02832 cubic meter per second (m3/s) million gallons per day (Mgal/d) 0.04381 cubic meter per second (km3/s) inch per year (in/yr) 25.4 millimeter per year (mm/yr)
Massounce, avoirdupois (oz) 28.35 gram (g) pound, avoirdupois (lb) 0.4536 kilogram (kg) ton, short (2,000 lb) 0.9072 megagram (Mg) ton per year (ton/yr) 0.9072 megagram per year (Mg/yr)ton per year (ton/yr) 0.9072 metric ton per yeartons per square mile (ton/mi2) 350.1947 kilograms per square kilometer
(kg/km2)pound (lb) 453,592.4 milligram (mg)pounds per day (lb/d) 453,592.4 milligram per day (mg/d) pound (lb) 0.4535924 kilogram (kg)
Concentrations of chemical constituents in water are given in milligrams per liter (mg/L).
Horizontal coordinate information is referenced to the North American Datum of 1983 (NAD 83).

Chloride in Groundwater and Surface Water in Areas Underlain by the Glacial Aquifer System, Northern United States
By John R. Mullaney, David L. Lorenz, and Alan D. Arntson
Abstract
A study of chloride in groundwater and surface water was conducted for the glacial aquifer system of the northern United States in forested, agricultural, and urban areas by analyzing data collected for the National Water-Quality Assessment Program from 1991 to 2004.
Groundwater-quality data from a sampling of 1,329 wells in 19 states were analyzed. Chloride concentrations were greater than the secondary maximum contaminant level established by the U.S. Environmental Protection Agency of 250 milligrams per liter in 2.5 percent of samples from 797 shallow monitoring wells and in 1.7 percent of samples from 532 drinking-water supply wells. Water samples from shallow monitoring wells in urban areas had the largest concentration of chloride, followed by water samples from agricultural and forested areas (medians of 46, 12, and 2.9 milligrams per liter, respectively).
An analysis of chloride:bromide ratios, by mass, and chloride concentrations compared to binary mixing curves for dilute groundwater, halite, sewage and animal waste, potas-sium chloride fertilizer, basin brines, seawater, and landfill leachate in samples from monitoring wells indicated multiple sources of chloride in samples from wells in urban areas and agricultural areas. Water from shallow monitoring wells in urban areas had the largest chloride:bromide ratio, and samples with chloride:bromide ratios greater than 1,000 and chloride concentrations greater than 100 milligrams per liter were dominated by halite; however, the samples commonly contained mixtures that indicated input from sewage or animal waste. Chloride:bromide ratios were significantly larger in samples from public-supply drinking-water wells than from private drinking-water wells, and ratios were significantly larger in all drinking-water wells in eastern and central regions of the glacial aquifer system than in west-central and western regions of the glacial aquifer system.
Surface-water-quality data collected regularly during varying time periods from 1991–2004 from 100 basins domi-nated by forested, agricultural, or urban land in 15 states were analyzed to determine maximum measured chloride concentra-tions. Samples from 15 sites in east, central, and west-central areas, collected primarily in winter, had chloride concentra-tions higher than the U.S. Environmental Protection Agency recommended chronic criterion concentration for aquatic life of 230 milligrams per liter. Concentrations of chloride in base-flow samples were predictive of maximum measured chloride concentrations, indicating that inputs of chloride from ground-water and (or) point-source wastewater discharges increase the likelihood of samples exceeding the recommended chronic aquatic criterion. Multiple linear regression analyses showed that the density of major roads, potential evapotranspiration, and the percentage of annual runoff from saturated overland flow were significant factors in describing the range of maxi-mum measured chloride concentrations in the basins studied.
Chloride loads and yields were determined at 95 surface-water-monitoring stations in basins dominated by forested, agricultural, or urban land. Annual chloride yield was largest in the urban basins (median of 88 tons per square mile) and smallest in the forested basins (median of 6.4 tons per square mile). The median chloride yield in the agricultural basins was 15.4 tons per square mile. Multiple linear regression analyses showed that the density of highways (roads in U.S. highway system), the number of major wastewater discharges in the basin, potential evapotranspiration, and urban minus agricul-tural land area were significant factors in describing the range of average annual chloride yields.
Upward trends in chloride loads were apparent in several urban basins for which additional long-term data were avail-able. Increases in chloride loads over time may be related to a variety of factors, including increases in road area and consequent deicing, increases in wastewater and septic-system discharges, recycling of chloride from drinking water, and leachate from landfills and salt storage areas.

2 Chloride in Groundwater and Surface Water in Areas Underlain by the Glacial Aquifer System, Northern United States
IntroductionThe use of salt has increased measurably in the United
States since 1950 (Kostick, 1993; Kostick and others, 2007) (fig. 1A), and the major increase in the use of salt has been for deicing of roads, parking lots, and other impervious surfaces during the winter months (fig. 1B). The application of salt for deicing these surfaces has raised awareness of potential adverse effects on water resources (Bubeck and others, 1971; Huling and Hollocher, 1972; Wulkowicz and Saleem, 1974).
Widespread upward trends in chloride concentrations in streams nationwide have been reported from 1974–81 (Smith and others, 1987). Similar trends have been reported in Connecticut from the 1970s to the 1990s (Trench, 1996; Colombo and Trench, 2002) and in New Jersey (Hay and Campbell, 1990; Robinson and others, 1996). Several studies have shown elevated concentrations of chloride and sodium in glacial aquifers related to urban land use (Grady and Mullaney, 1998; Fong, 2000; Thomas, 2000; Savoca and others, 2000).
The primary concern for water quality is the degradation of groundwater and surface water that may be used for drinking-water supply or for aquatic habitat. The U.S. Environmental Protection Agency (USEPA) has set a second-ary maximum contaminant level (SMCL) of 250 mg/L for chloride in drinking water (U.S. Environmental Protection Agency, 1992). The SMCL for chloride is an unenforceable guideline that relates to the aesthetics of the water and the perceived salty taste of water at concentrations above 250 mg/L. The USEPA-recommended chronic criterion for aquatic life is a 4-day average chloride concentration of 230 mg/L with an occurrence interval of once every 3 years, and the recommended acute criterion concentration for chloride is 860 mg/L (U.S. Environmental Protection Agency, 1988). The acute criterion relates to a 1-hour average concentration with a recurrence interval of less than once every 3 years. Other concerns regarding salt inputs include the effects of cation- exchange reactions on the quality of water (Granato and others, 1995).
The U.S. Geological Survey (USGS) has been collecting data since 1991 on the quality of water in the Nation’s aquifers and streams through the National Water-Quality Assessment (NAWQA) Program. Data are synthesized at the scale of regional principal aquifers (Lapham and others, 2005) to understand water-quality issues affecting aquifers used commonly for domestic and public water supply. The glacial aquifer system (Warner and Arnold, 2005) is the largest principal aquifer (fig. 2) in the United States, in terms of areal extent and its use as a source for drinking water. The glacial aquifer system is considered here to include all unconsolidated aquifers overlying bedrock north of the line of continental glaciation. Warner and Arnold (2005) divided the glaciated area in the United States into four major glacial regions (fig. 2) based on differing glacial source material: east, central, west-central and west.
The glacial aquifer system also is a source of surface water, because the aquifer and stream systems are commonly in hydraulic connection. Therefore, the discharge of ground-water to streams affects the quality of surface water, and surface water at times can become a source of groundwater.
Purpose and Scope
This report describes the concentrations of salt-related constituents (primarily chloride) in shallow groundwater and surface water in the glaciated northern United States, on the basis of water-quality data collected from 1991 to 2004 for the USGS NAWQA Program at 1,329 wells in 19 states and 100 surface-water sites in 15 states. The report presents information on natural and anthropogenic sources of chloride in the environment, concentrations of sodium and chloride in groundwater, concentrations of chloride in surface water, and estimates of chloride loads and yields from selected basins in the study area. The report also provides information on the relation between ancillary variables (land-use, land-cover, hydrologic, and climatic variables) and the concentrations and yields of chloride in surface water.
Groundwater data analyzed for this study generally were collected from coarse-grained glacial aquifers, and therefore the results may not translate to other areas in the glacial aqui-fer where coarse-grained deposits are absent, and the surficial material is glacial till or bedrock.
Sources of Salts to Water Resources
Natural Sources
Natural sources of salts to water resources include (1) the oceans; (2) the natural weathering of bedrock, surficial materials, and soils; (3) geologic deposits containing halite, or saline groundwater (brines); and (4) volcanic activity.
The oceans typically contain about 19,000 milligrams per liter (mg/L) of chloride (Feth, 1981). Sodium and chloride are the most abundant ions present in the atmosphere above the oceans, and atmospheric deposition of chloride and sodium from the oceans is highest along coastal areas. Atmospheric deposition may contain natural sources of chloride from the oceans, and dusts from surficial salt deposits such as in playa lakes, as well as chloride from anthropogenic sources, such as manufacturing and power generation.
Atmospheric Deposition
From 1994 to 2003, wet deposition of chloride contrib-uted an average of 0.04 to 6.2 ton/mi2 to the glacial aquifer system study area (table 1, fig. 3) based on the data from the National Atmospheric Deposition Program (NADP) (2006). The largest amount of wet deposition of chloride was on the eastern and western coastal parts of the study area, including the Puget Sound area and the New England coastal basins. The

Introduction 3
Figure 1. Salt use and consumption in the United States by (A) all end users, 1975–2003 (data from U.S. Geological Survey, 2005b), and (B) consumption by use or industry, 1975–2005 (data from U.S. Geological Survey, 2005b; Kostick and others, 2007).
35
40
45
50
55
60
YEAR
END
USE1 , I
N M
ILLI
ONS
OF T
ONS
PER
YEAR
1975
1976
1977
1978
1979
1980
1981
1982
1983
1984
1985
1986
1987
1988
1989
1990
1991
1992
1993
1994
1995
1996
1997
1998
1999
2000
2001
2002
2003
65
1975
1976
1977
1978
1979
1980
1981
1982
1983
1984
1985
1986
1987
1988
1989
1990
1991
1992
1993
1994
1995
1996
1997
1998
1999
2000
2001
2002
2003
2004
2005
0
7.5
15
22.5
30
END
USE1 , I
N M
ILLI
ONS
OF T
ONS
PER
YEAR
YEAR
Agriculture
Alkalies and chlorine
Deicing
Metal production
Other chemicals
Paper products
Petroleum
Textiles and dyeing
Water treatment
Other uses2
Food products
EXPLANATION
1 End use is defined as the use of the mineral commodity in a particular industrial sector or product.
2 The other uses category includes salt used in rubber, tanning and/or leather, industrial, institutional (commercial stores) and other wholesalers and retailers, U.S. Government resale, someexports for consumption in overseas territories administered by the United States, and other various minor uses (U.S. Geological Survey, 2005b).
SALT USE AND CONSUMPTION, ALL END USES
CONSUMPTION BY USE OR INDUSTRYB
A
Salt use and consumption

4 Chloride in Groundwater and Surface Water in Areas Underlain by the Glacial Aquifer System, Northern United States
Figu
re 2
. Gl
acia
l aqu
ifer s
yste
m a
nd N
atio
nal W
ater
-Qua
lity
Asse
ssm
ent P
rogr
am s
tudy
bas
ins,
nor
ther
n Un
ited
Stat
es.
UM
IS
RE
DN
CN
BR
LE
RI
LIR
B
EIW
A
WH
MI
CC
YK
NE
CB
WM
IC
AL
MN
CO
NN
HD
SN
UIR
B
DE
LR
PUG
T
LIN
J
116°
106°
96°
86°
76°
66°
35°
40°
45°
020
0 M
ILES
100
020
0 K
ILO
MET
ERS
100
Are
a of
inse
t map
Are
a of
map
EX
PLA
NAT
ION
CO
OK
010
050
50
MIL
ES
010
0K
ILO
MET
ERS
Reg
ion
Cen
tral
East
Wes
tW
est C
entra
l
Gla
cial
aqu
ifer
syst
em b
ound
ary
Stud
y ar
ea b
asin
iden
tific
atio
n LIR
B—
Low
er Il
linoi
s Riv
er B
asin
WM
IC—
Wes
tern
Lak
e M
ichi
gan
Dra
inag
esEI
WA
—Ea
ster
n Io
wa
Bas
ins
UM
IS—
Upp
er M
issi
ssip
pi R
iver
Bas
inR
EDN
—R
ed R
iver
of t
he N
orth
Bas
inC
NB
R—
Cen
tral N
ebra
ska
Bas
ins
CC
YC
—C
entra
l Col
umbi
a Pl
atea
u-Ya
kim
a R
iver
Bas
inPU
GT—
Puge
t Sou
nd D
rain
ages
CO
OK
—C
ook
Inle
t Dra
inag
es
NEC
B—
New
Eng
land
Coa
stal
Bas
ins
CO
NN
—C
onne
ctic
ut, H
ousa
toni
c, a
nd T
ham
es R
iver
Bas
ins
HD
SN—
Hud
son
Riv
er B
asin
LIN
J—Lo
ng Is
land
, New
Jers
ey C
oast
al D
rain
ages
DEL
R—
Del
awar
e R
iver
Bas
inA
LMN
—A
llegh
eny-
Mon
onga
hela
Riv
er B
asin
sLE
RI—
Lake
Erie
-Lak
e St
. Cla
ir W
HM
I—W
hite
, Gre
at a
nd L
ittle
Mia
mi R
iver
U
IRB
—U
pper
Illin
ois R
iver
Bas
in
Base
from
U.S
. Geo
logi
cal S
urve
y 1:
2,00
0,00
0 Di
gita
l Dat
aAl
bers
Equ
al-A
rea
Coni
c pr
ojec
tion,
sta
ndar
d pa
ralle
ls 2
9°30
’an
d 45
°30’
, cen
tral m
erid
ian
-96°
, lat
itude
of o
rigin
23°

Introduction 5
lowest amount of wet deposition of chloride was in the central parts of the study area, including Iowa, Minnesota, North Dakota, and South Dakota. In basins in the United States with little or no human activity, the yield of chloride from streams is correlated with the amount of precipitation. The chloride yield from atmospheric deposition is related to precipitation quantity and has been reported to contribute on average 28 to 62 percent of the chloride yield in undeveloped basins throughout the United States. Basins with crystalline bedrock were associated with the largest percentage of atmospheric chloride yield, followed, in order, by basins underlain by sand-stone and basins underlain by limestone (Peters, 1984).
Chloride concentrations in streams and groundwater that originated from wet deposition of chloride are different from concentrations measured in precipitation because of the concentration of chloride by the process of evapotranspiration. The average concentrations of chloride from wet deposition in runoff (surface and groundwater) can be calculated as the wet deposition of chloride divided by the runoff (fig. 4). This calculation indicates that average concentrations in runoff attributable to wet deposition are typically 0.1–2.0 mg/L.
Weathering of Common Rocks, Minerals, and Soils
In addition to the chloride deposited on a basin by pre-cipitation, there is a natural input from the weathering of rocks and minerals. Chlorine is present in several minerals in com-mon rocks, and its release to waters as chloride ions is gener-ally slow and through processes other than dissolution (Feth, 1981). The chloride in excess of the load from precipitation was attributed to the weathering of the mineral hornblende in glacial tills in two Adirondack Mountain basins in New York (Peters, 1991).
The chloride yields from 21 basins with no permanent residents, underlain by limestone, sandstone, and crystalline rocks, were analyzed by Peters (1984), who concluded, on the basis of a regression analysis, that 77 percent of the varia-tion in chloride yield from these basins could be explained by the quantity of precipitation a basin receives. The relation to precipitation probably includes direct wet deposition of chloride, as well as chemical weathering, which increases with
precipitation. A subset of 10 of these basins1 with very low population density was identified in the glacial aquifer system. The difference between the chloride yield attributable to direct input from precipitation and the amount attributable to the relation between precipitation and chloride yield probably represents an estimate of the amount derived from chemical weathering. This difference ranged from 0 to 72 percent of the chloride yield. Chloride yields from these 10 basins ranged from 0.7 to 68 tons/mi2, although all but one site had yields less than or equal to 9 tons/mi2. The estimated annual load from chemical weathering in these 10 basins, on the basis of the above percentage, ranged from 0 to 2 tons/mi2 with an average of 0.9 tons/mi2 (Peters, 1984).
Salt Deposits and BrinesBedded salt deposits underlie parts of the study area,
including parts of Michigan, Western New York, Ohio, and Pennsylvania (Norris, 1978). New York, Ohio, and Michigan produce much of the rock salt and other salts derived from brines in the United States. Most halite deposits occur at depth or at the downgradient ends of groundwater systems (Feth, 1981) and therefore generally may not affect the shallow- groundwater quality of the glacial aquifer system. Water with high concentrations of dissolved solids is present in sedimen-tary bedrock at depth in many parts of the study area (Feth, 1965). These halite deposits and brines may be a salinity source for groundwater in zones of flow convergence, where water of different ages and from different aquifers (surficial to deep bedrock) have mixed. Therefore, it is possible that part of the chloride budget for some basins in these areas may be from dissolution of halite deposits or mixing with brines. This component of the chloride budget is evidenced by saline springs in parts of the study area, such as Michigan, Illinois, and New York (Michigan Department of Environmental Quality, 1994; Panno and others, 2006; Rao and others, 2005).
Anthropogenic SourcesThe use of salt in the United States has increased from
42.9 million tons in 1975 to nearly 58.5 million tons in 2005 (Kostick and others, 2007) (fig. 1A). The largest use of salt has been in the chloralkali industry that produces chlorine and sodium hydroxide (Kostick, 1993) (fig. 1B). In 2005, salt used by the chloralkali industry represented 34.7 percent of the end use of salt. The second largest use of salt since 1975 has been deicing. Deicing use has increased since then, and was greater than that for the chloralkali industry in 2005, when it represented 39.5 percent of the end use of salt in the United States (Kostick and others, 2007). Other uses of salt (totaling about 25 percent of end use in 2005) include agriculture, food processing, metal processing, paper production, textiles and dyeing, petroleum production, water treatment, and other
1 Basins included the following stations from Peters (1984), table 1: 4045500, 4057004, 4126520, 4132052, 6452000, 6478500, 1066000, 4014500, 5124480, 12447390.
Table 1. Estimated wet deposition of chloride on the glacial aquifer system, northern United States, 1994–2003.
[Values are in tons per square mile per year. Data analyzed from the National Atmospheric Deposition Program, 2006]
Region Minimum Maximum Mean
East 0.19 4.16 0.71Central .09 .64 .25West central .04 .40 .13West .06 6.22 .91

6 Chloride in Groundwater and Surface Water in Areas Underlain by the Glacial Aquifer System, Northern United States
Figu
re 3
. M
ean
wet
dep
ositi
on o
f chl
orid
e, 1
994–
2003
, and
loca
tions
of s
alt m
inin
g in
the
glac
ial a
quife
r sys
tem
stu
dy a
rea,
nor
ther
n Un
ited
Stat
es.
116°
106°
96°
86°
76°
66°
35°
40°
45°
Gla
cial
aqu
ifer
syst
em b
ound
ary
Stud
y ar
ea b
asin
and
bou
ndar
y
0 to
.25
grea
ter t
han
.25
to .5
grea
ter t
han
.5 to
1
grea
ter t
han
1 to
1.5
grea
ter t
han
1.5
to 2
grea
ter t
han
2 to
2.5
grea
ter t
han
2.5
to 3
grea
ter t
han
3 to
3.5
grea
ter t
han
3.5
to 4
grea
ter t
han
4
EX
PLA
NAT
ION
Mea
n w
et d
epos
ition
of c
hlor
ide1 ,
in to
ns p
er sq
uare
mile
per
yea
r
Salt
min
ing
loca
tion2
020
010
0M
ILES
020
010
0K
ILO
MET
ERS
1. C
alcu
late
d fr
om N
atio
nal A
tmos
pher
ic
D
epos
ition
Pro
gram
, 200
62.
U.S
. Geo
logi
cal S
urve
y, 2
005b
Base
from
U.S
. Geo
logi
cal S
urve
y 1:
2,00
0,00
0 Di
gita
l Dat
aAl
bers
Equ
al-A
rea
Coni
c pr
ojec
tion,
sta
ndar
d pa
ralle
ls 2
9°30
’an
d 45
°30’
, cen
tral m
erid
ian
-96°
, lat
itude
of o
rigin
23°

Introduction 7
Figu
re 4
. Es
timat
ed a
vera
ge c
once
ntra
tion
of c
hlor
ide,
199
4–20
02, i
n ru
noff
attri
buta
ble
to a
tmos
pher
ic (w
et) d
epos
ition
in th
e gl
acia
l aqu
ifer s
yste
m s
tudy
are
a,
north
ern
Unite
d St
ates
. Dat
a ar
e co
mbi
ned
from
the
Nat
iona
l Atm
osph
eric
Dep
ositi
on P
rogr
am (2
006)
and
runo
ff da
ta fr
om D
avid
Wol
ock,
U.S
. Geo
logi
cal S
urve
y, w
ritte
n co
mm
un.,
2006
. 116°
106°
96°
86°
76°
66°
35°
40°
45°
grea
ter t
han
.25
to .5
grea
ter t
han
.5 to
1gr
eate
r tha
n 1
to 2
grea
ter t
han
2 to
3gr
eate
r tha
n 3
to 4
grea
ter t
han
4 to
5gr
eate
r tha
n 5
to 1
0
0 to
.25
020
010
0M
ILES
020
010
0K
ILO
MET
ERS
Est
imat
ed a
vera
ge c
once
ntra
tions
of c
hlor
ide
in r
unof
f att
ribu
tabl
e to
wet
dep
ositi
on, i
n m
illig
ram
s per
lite
r
EX
PLA
NA
TIO
N
Gla
cial
aqu
ifer
syst
em b
ound
ary
Stud
y ar
ea b
asin
and
bou
ndar
y
Base
from
U.S
. Geo
logi
cal S
urve
y 1:
2,00
0,00
0 Di
gita
l Dat
aAl
bers
Equ
al-A
rea
Coni
c pr
ojec
tion,
sta
ndar
d pa
ralle
ls 2
9°30
’an
d 45
°30’
, cen
tral m
erid
ian
-96°
, lat
itude
of o
rigin
23°

8 Chloride in Groundwater and Surface Water in Areas Underlain by the Glacial Aquifer System, Northern United States
manufacturing (fig. 1B). The northern states that compose the glacial aquifer system (fig. 2) were the end destination for about 76 percent of the shipments of evaporated salt and rock salt (excluding brine) in the United States in 2005 (Kostick and others, 2007).
For many uses of salt, the chloride and sodium may end up being discharged to groundwater and surface waters as a direct or indirect result of use. The common pathways include atmospheric deposition; the dissolution of deicing salts from normal use on streets, parking lots, highways, and other paved surfaces; storage and handling of deicing salt; release of brines from salt, oil, and gas production; leaching from landfills; the treatment of drinking water and wastewater; and discharge of wastewater from treatment facilities or septic systems. The section below describes some of the common pathways for salt to enter the environment from human use.
Application of Deicing SaltsThe use of deicing salts has improved the safety of winter
weather driving, reducing accident rates by a factor of 8 on two-lane highways and 4.5 on multi-lane highways. The use of salt reduces injuries, property damage, and the severity of accidents during winter storms, thereby reducing costs of accidents (Kuemmel and Hanbali, 1992).
General highway application rates for deicing salt range from less than 1 ton per lane mile2 per year to 20 tons per lane mile per year (Transportation Research Board, 1991; Jones and Sroka, 1997). Information on the rate of deicing-salt applications was acquired by compiling a list of the cities nearest to groundwater-sampling locations (table 2) and conducting an informal, qualitative survey of 20 local and State highway superintendents to provide information on the type and amount of deicing chemicals being applied to roads and highways in different parts of the study area. Respondents were asked to describe the number of lane or road miles serviced, and the type and amount of deicing chemicals pur-chased; application rates in units of tons per road or lane mile were calculated on the basis of that information (table 2).
Most of the highway superintendents reported the use of sodium chloride rock salt. Calcium and magnesium chloride were used in some cases as a wetting agent for rock salt. Application rates per lane mile ranged from less than 1 ton per road mile in Washington State to 74.5 tons per lane mile for a section of Interstate 84 in southeastern New York (Heisig, 2000). Most rates for deicing salt reported by high-way officials ranged from 10 to 30 tons per lane mile (table 2). These values are similar to those reported in the literature.
In addition to the effects of application of deicing salts to impervious areas, salt-storage areas have been sites of historical contamination caused by runoff from uncovered salt piles, and infiltration when stored over pervious areas
2 The lane mile is an areal measurement of road surface. The lane mile is one traffic lane (12 ft wide), extending for 1 mi along a road. When applied to highways, this measurement unit includes paved borders and breakdown lanes (Church and others, 1996).
(Ostendorf and others, 2006). Many of these historical sites have been improved in recent years through the use of covered salt-storage buildings on impervious substrate. However, high chloride concentrations can persist in groundwater because of the long traveltimes from recharge areas to discharge at a well or surface-water body.
Highway maintenance crews in some parts of the study area are using techniques that enhance the effectiveness of deicing practices. These anti-icing techniques are designed to use salt more effectively by preventing a bond between ice and road surfaces rather than melting ice that has already bonded to the road. These updated practices include the use of road weather-information systems (RWIS) to decide which road deicing practices are appropriate based on weather and road temperature data and the use of salt that has been prewetted, or salt brine, on roadways prior to a predicted storm (Aultman-Hall and others, 2006).
Landfills
Salt from human consumption or activities is commonly deposited in municipal landfills. These salts typically are from food wastes and other products containing salt, including rubber, metals, and paper products. The estimated 10.3 mil-lion tons of salt or salt-bearing products deposited in landfills in 1990 represented 23 percent of reported consumption (Kostick, 1993). This estimated mass indicates that landfills can be source areas for salt constituents. Chloride concentra-tions are typically high in landfill leachate or in groundwater beneath or downgradient from landfills. For instance, the median chloride concentration in leachate from seven land-fills in Illinois was 1,284 mg/L (Panno and others, 2006). The chloride concentration in leachate in a municipal landfill in Waterbury, Connecticut, was 724 mg/L in 1997 (Fuss & O’Neill, Inc., 1997), and 247 mg/L in shallow groundwater downgradient from the landfill (Mullaney and others, 1999). Landfills are commonly limited in aerial extent and can be areas with low groundwater recharge because of impervious capping material, which limits the release of large volumes of leachate to shallow aquifers or surface-water bodies. However, as with deicing-salt storage areas, landfills can be a long-term source of salt to aquifers and streams as a result of long groundwater traveltimes.
Wastewater and Water Treatment
Chloride in the environment is conservative (non-reactive), and thus there is little loss when chloride in salts contained in food, beverages, and household cleaning products is discharged to the environment through septic systems and wastewater-treatment facilities. In addition, water softeners used to treat water hardness commonly use salt brine to regenerate the resin in the treatment system with sodium, displacing calcium and magnesium. The remaining brine is then disposed of through the wastewater system, or to a dry well, where it may enter the underlying aquifer and ultimately discharge to a surface-water body.

Introduction 9Ta
ble
2.
Sele
cted
ann
ual a
pplic
atio
n ra
tes
of d
eici
ng c
hem
ical
s on
Sta
te a
nd lo
cal r
oads
in th
e gl
acia
l aqu
ifer s
yste
m, n
orth
ern
Unite
d St
ates
.—Co
ntin
ued
Stat
e, m
unic
ipal
ity, o
r reg
ion
Stat
eRo
ad
mile
s
man
aged
Lane
m
iles
m
anag
edD
eici
ng c
hem
ical
Tota
l am
ount
of
deic
ing
salt
used
(to
ns)
Aver
age
use
per
lane
m
ile
(tons
)
Aver
age
use
per
road
m
ile
(tons
)
Sour
ce
Con
nect
icut
Dep
artm
ent o
f Tra
nspo
rtatio
nC
T3,
276
Sodi
um c
hlor
ide
101,
947
31.1
Pat R
odge
rs, C
onne
ctic
ut D
OT,
ora
l com
-m
un.,
2006
Man
ches
ter
CT
200
Sodi
um c
hlor
ide
2,50
012
.5K
enne
th L
ongo
, Man
ches
ter D
epar
tmen
t of
Publ
ic W
orks
, ora
l com
mun
., 20
06W
oodb
ury
CT
86So
dium
chl
orid
e90
010
.5W
oodb
ury
Dep
artm
ent o
f Pub
lic W
orks
, ora
l co
mm
un.,
2006
Scitu
ate
Res
ervo
ir dr
aina
ge b
asin
–Sta
te
Roa
dsR
I90
191
Sodi
um c
hlor
ide
611
3.2
6.8
Nim
irosk
i and
Wal
dron
, 200
2, n
ote
that
est
i-m
ated
sodi
um c
hlor
ide
repo
rted
base
d on
ca
lciu
m c
hlor
ide/
sodi
um c
hlor
ide
mix
ture
Scitu
ate
Res
ervo
ir dr
aina
ge b
asin
–Loc
al
Roa
dsR
I13
927
7So
dium
chl
orid
e2,
784
10.1
20.1
Nim
irosk
i and
Wal
dron
, 200
2
Iow
a D
epar
tmen
t of T
rans
porta
tion–
Stat
e R
oads
IASo
dium
chl
orid
e3.
8Tr
ansp
orta
tion
Res
earc
h B
oard
, 199
1
Am
esIA
230
Sodi
um c
hlor
ide
2,00
08.
7Jo
hn Jo
iner
, Dire
ctor
, Am
es Io
wa,
Dep
art-
men
t of P
ublic
Wor
ks, o
ral c
omm
un.,
2006
Ced
ar R
apid
sIA
720
Sodi
um c
hlor
ide
7,50
010
.4D
epar
tmen
t of S
treet
Mai
nten
ance
, ora
l com
-m
un.,
2006
Wav
erly
IA75
Sodi
um c
hlor
ide
500
6.7
Bria
n Su
lliva
n, S
uper
inte
nden
t, D
ivis
ion
of
Stre
ets,
Publ
ic W
orks
Dep
artm
ent,
W
aver
ly, I
A, o
ral c
omm
un.,
2006
Illin
ois D
epar
tmen
t of T
rans
porta
tion
ILSo
dium
chl
orid
e6.
6Tr
ansp
orta
tion
Res
earc
h B
oard
, 199
1
Elgi
nIL
312
Sodi
um c
hlor
ide,
so
me
calc
ium
ch
lorid
e liq
uid
6,00
019
.2C
ity o
f Elg
in, I
llino
is, W
eb p
age
at
http
://w
ww.
city
ofel
gin.
org/
inde
x.as
p?N
ID=
180
Gur
nee
IL21
0So
dium
chl
orid
e14
.3C
ity o
f Gur
nee,
Illin
ois,
Web
pag
e at
ht
tp://
ww
w.gu
rnee
.il.u
s/pu
blic
_wor
ks/
abou
t.htm
l#st
reet
divi
sion
Indi
ana
Dep
artm
ent o
f Tra
nspo
rtatio
nIN
Sodi
um c
hlor
ide
335,
137
Indi
ana
Dep
artm
ent o
f Tra
nspo
rata
tion,
200
4,
Web
pag
e at
http
://w
ww.
in.g
ov/d
ot/d
iv/
com
mun
icat
ions
/200
4ann
ualre
port
/Saf
ety.
Indi
ana
Dep
artm
ent o
f Tra
nspo
rtatio
nIN
Sodi
um c
hlor
ide
9.0
Tran
spor
tatio
n R
esea
rch
Boa
rd, 1
991
10 Chloride in Groundwater and Surface Water in Areas Underlain by the Glacial Aquifer System, Northern United StatesTa
ble
2.
Sele
cted
ann
ual a
pplic
atio
n ra
tes
of d
eici
ng c
hem
ical
s on
Sta
te a
nd lo
cal r
oads
, in
the
glac
ial a
quife
r sys
tem
, nor
ther
n Un
ited
Stat
es.—
Cont
inue
d
Stat
e, m
unic
ipal
ity, o
r reg
ion
Stat
eRo
ad
mile
s
man
aged
Lane
m
iles
m
anag
edD
eici
ng c
hem
ical
Tota
l am
ount
of
deic
ing
salt
used
(to
ns)
Aver
age
use
per
lane
m
ile
(tons
)
Aver
age
use
per
road
m
ile
(tons
)
Sour
ce
Col
umbu
sIN
Sodi
um c
hlor
ide
2,00
08.
5St
even
Bro
wn,
City
of C
olum
bus,
Indi
ana,
Pu
blic
Wor
ks, o
ral c
omm
un.,
2006
Indi
anap
olis
Dep
artm
ent o
f Tra
nspo
rtatio
nIN
7,32
94,
000
Car
gill
Cle
arLa
ne
(trea
ted
sodi
um
chlo
ride)
liq
uid
calc
ium
ch
lorid
e, m
ag-
nesi
um c
hlor
ide,
an
d br
ine
also
us
ed
48,0
0012
.06.
5Jo
hn B
urkh
ardt
, City
of I
ndia
napo
lis,
Dep
artm
ent o
f Pub
lic W
orks
, ora
l com
-m
un.,
2006
Stat
e of
Mic
higa
n D
epar
tmen
t of T
rans
-po
rtatio
nM
ISo
dium
chl
orid
e12
.9Tr
ansp
orta
tion
Res
earc
h B
oard
, 199
1
Brig
hton
MI
2550
Sodi
um c
hlor
ide
1,50
521
.042
.0M
atth
ew J.
Sch
inde
wol
f, D
irect
or o
f Pub
lic
Serv
ices
, Brig
hton
, Mic
higa
n, o
ral c
om-
mun
., 20
06Fa
rmin
gton
Hill
s M
I30
1So
dium
chl
orid
e6,
500
21.6
Dan
iel R
oone
y, D
ivis
ion
of P
ublic
Wor
ks,
Farm
ingt
on H
ills,
Mic
higa
n, o
ral c
om-
mun
., 20
06R
oche
ster
Hill
sM
I50
6So
dium
chl
orid
e4,
270
8.4
16.9
Rog
er R
ouss
e, D
epar
tmen
t of P
ublic
Ser
vice
, R
oche
ster
Hill
s, M
ichi
gan,
ora
l com
mun
., 20
06W
olve
rine
Lake
MI
20So
dium
chl
orid
e75
037
.5A
ndy
Ston
e, D
epar
tmen
t of P
ublic
Ser
ivce
, W
olve
rine
Lake
, Mic
higa
n, o
ral c
omm
un.,
2006
Min
neso
ta D
epar
tmen
t of T
rans
porta
tion
MN
12,0
00So
dium
chl
orid
e23
3,43
4 &
2.
3 M
gal
of b
rine
19.5
Min
neso
ta D
epar
tmen
t of T
rans
porta
tion,
20
06
Twin
Citi
es M
etro
Are
aM
N5,
900
Sodi
um c
hlor
ide
103,
000
17.5
Min
neso
ta D
epar
tmen
t of T
rans
porta
tion,
20
06B
rook
lyn
Cen
ter
MN
139
Sodi
um c
hlor
ide
27.0
Wen
ck A
ssoc
iate
s, In
c., 2
004
Bro
okly
n Pa
rkM
N24
3So
dium
chl
orid
e27
.0W
enck
Ass
ocia
tes,
Inc.
, 200
4C
ryst
alM
N11
2So
dium
chl
orid
e3.
0W
enck
Ass
ocia
tes,
Inc.
, 200
4R
obbi
nsda
leM
N88
Sodi
um c
hlor
ide
12.0
Wen
ck A
ssoc
iate
s, In
c., 2
004

Introduction 11Ta
ble
2.
Sele
cted
ann
ual a
pplic
atio
n ra
tes
of d
eici
ng c
hem
ical
s on
Sta
te a
nd lo
cal r
oads
, in
the
glac
ial a
quife
r sys
tem
, nor
ther
n Un
ited
Stat
es.—
Cont
inue
d
Stat
e, m
unic
ipal
ity, o
r reg
ion
Stat
eRo
ad
mile
s
man
aged
Lane
m
iles
m
anag
edD
eici
ng c
hem
ical
Tota
l am
ount
of
deic
ing
salt
used
(to
ns)
Aver
age
use
per
lane
m
ile
(tons
)
Aver
age
use
per
road
m
ile
(tons
)
Sour
ce
New
Ham
pshi
re D
epar
tmen
t of T
rans
por-
tatio
n, In
ters
tate
93
NH
111
Sodi
um c
hlor
ide
2,76
224
.9Ph
il Tr
owbr
idge
, New
Ham
pshi
re D
epar
t-m
ent o
f Env
ironm
enta
l Ser
vice
s, w
ritte
n co
mm
un.,
2006
New
Yor
k, C
roto
n W
ater
shed
–Int
erst
ate
84N
YSo
dium
chl
orid
e74
.529
8.0
Hei
sig,
200
0N
ew Y
ork,
Cro
ton
Wat
ersh
ed–T
acon
ic
Park
way
NY
Sodi
um c
hlor
ide
18.8
75.0
Hei
sig,
200
0
New
Yor
k, C
roto
n W
ater
shed
Loc
al R
oads
NY
Sodi
um c
hlor
ide
9.3
37.0
Hei
sig,
200
0
Col
onie
Vill
age
NY
35So
dium
chl
orid
e1,
500
43.5
Car
l Fle
shm
an, S
uper
inte
nden
t of P
ublic
W
orks
, Col
onie
Vill
age,
NY,
ora
l com
-m
un.,
2006
Ohi
o D
epar
tmen
t of T
rans
porta
tion
OH
Sodi
um c
hlor
ide,
ca
lciu
m c
hlor
ide
also
use
d
9.7
Kun
ze a
nd S
roka
, 200
4 (f
or se
lect
ed c
oun-
ties)
Har
rison
OH
100
Sodi
um c
hlor
ide,
ca
lciu
m c
hlor
ide
600,
1,
000
gal.
6.0
Jam
es L
eslie
, Dire
ctor
of P
ublic
Wor
ks,
Har
rison
, OH
, ora
l com
mun
., 20
06W
est C
arro
llton
OH
300
Sodi
um c
hlor
ide,
ca
lciu
m c
hlor
ide
800
0.4
Lace
y C
ityW
A25
Sodi
um c
hlor
ide
100.
4D
enni
s Ritt
er, P
ublic
Wor
ks D
epar
tmen
t, La
cey,
WA
, ora
l com
mun
., 20
06O
lym
pia
WA
200
Cal
cium
mag
ne-
sium
ace
tate
, so
me
sodi
um
chlo
ride
50.
03R
andy
Ste
war
t, D
epar
tmen
t of T
rans
porta
-tio
n, L
acey
, Was
hing
ton,
ora
l com
mun
., 20
06
Bro
okfie
ldW
I48
2So
dium
chl
orid
e4,
400
9.1
17.2
Terr
y St
arns
, Dep
artm
ent o
f Pub
lic W
orks
, B
rook
field
, Wis
cons
in, o
ral c
omm
un.,
2006
Lake
Gen
eva
WI
300
Sodi
um c
hlor
ide
300
7.5
Lynn
Alle
n, D
epar
tmen
t of P
ublic
Wor
ks,
City
of L
ake
Gen
eva,
Wis
cons
in, o
ral c
om-
mun
., 20
06M
ilwau
kee
WI
7,11
2So
dium
chl
orid
e50
,000
7.0
Hin
tz a
nd o
ther
s, 20
01Su
ssex
WI
45So
dium
chl
orid
e1,
500
33.3
Jere
my
Smith
, Dep
artm
ent o
f Pub
lic W
orks
, Su
ssex
, Wis
cons
in, o
ral c
omm
un.,
2006

12 Chloride in Groundwater and Surface Water in Areas Underlain by the Glacial Aquifer System, Northern United States
A conservative estimate of the per capita salt consump-tion and chloride loss from wastewater can be made on the basis of the recommended daily adult sodium intake of 2,300 mg/d. The salt intake associated with 2,300 mg/d of sodium is 5,847 mg, which includes about 3,547 mg of chloride. This indicates that the average person on this diet would consume about 2.1 kg (4.7 lbs) of salt per year, and release about 1.3 kg (2.9 lbs) of chloride per year to wastewater discharge.
Water softeners can release considerably larger amounts of chloride to the environment. Discharge of chloride to the environment from water softening is through on-site septic systems, dry wells, or wastewater-treatment facilities. In 2005, salt for water treatment represented 3.1 percent of salt use in the United States (Kostick and others, 2007). Salt use varies in a typical residential water-softener installation, however, because of differences in water softeners, water use, and water hardness.
Water softeners likely are used extensively in the study area for homes with self-supplied domestic wells and in areas with publicly provided surface and groundwater supplies. Moderately hard water is found in most regions of the study area, although soft water predominates in the New England area. Hard and very hard waters are present in central and west central States, including Ohio, Michigan, Illinois, Wisconsin, Minnesota, and North Dakota (Briggs and Ficke, 1977).
Agriculture
Agricultural use of salt was about 3.5 percent of total use in 2005 (Kostick and others, 2007). Salt is used as an animal feed additive and may be used in other agricultural products such as pesticides and fertilizers. Salt from animal feeds may discharge to surface water and groundwater from feedlots and manure containment areas and from the use of manure as a fertilizer. Panno and others (2006) reported a median chloride concentration of 847 mg/L from hog and horse waste, and a median concentration of 57 mg/L in water samples from wells affected by animal waste in Illinois.
Agricultural fertilizers can be a source of chloride to receiving waters because the potassium in most fertilizers is in the form of potassium chloride. Other sources of chloride include the concentration and dissolution of salts resulting from irrigation from deep groundwater sources.
Methods of Data AnalysisNAWQA Program data from 1991 to 2004 from wells
in the glacial aquifer system and from streams draining areas underlain by the glacial aquifer system were analyzed for this study. Ancillary information was synthesized from data com-piled for each surface-water-quality station that was sampled in the NAWQA Program. Many surface-water monitoring sta-tions had additional water-quality data collected by the USGS for State water-quality monitoring networks.
Data analysis included graphical plotting of concentra-tions of water-quality constituents, multiple-comparison tests, and statistical analyses of the relations between ancillary vari-ables and chloride concentrations and yields in surface water. A multiple linear regression model (LOADEST) (Runkel and others, 2004) was used to analyze chloride loads in water from 95 surface-water monitoring stations.
Compilation of Environmental Data
Groundwater-quality and surface-water-quality data were synthesized from data collected from 1991 to 2004 in the study basins shown in figure 2. Groundwater-quality data were compiled from a national database established for all ground-water samples collected for the NAWQA Program in the gla-cial aquifer system study area. The groundwater data collected represent two different networks: (1) shallow monitoring wells in forested, agricultural, or urban land (land-use studies), and (2) drinking-water supply wells tapping glacial deposits (major aquifer studies) (Rosen and Lapham, 2008).
In land-use studies, data were collected from installed observation wells and selected existing observation wells to assess the quality of recently recharged shallow groundwater beneath different land-use settings (Gilliom and others, 1995). For this investigation, data from 797 wells from land-use stud-ies (fig. 5) representing forested, agricultural, and urban areas were compiled for statistical analysis. Samples generally were collected only once from these wells.
In major aquifer studies conducted by the NAWQA Program, data were collected from 94 public and 438 private drinking-water supply wells in the glacial aquifer system (drinking-water network, fig. 5). These wells are typically deeper than the wells sampled for land-use studies and may integrate recharge from several land uses.
Water-quality data from 100 surface-water monitoring stations (Appendix 1) draining basins dominated by forested, agricultural, or urban land were selected for analysis (fig. 5). The contributing areas of these basins average 286 mi2, and the median is 88 mi2; of these basins, at least 31 contain major point-source wastewater discharges listed in the Permit Compliance System (PCS) database (U.S. Environmental Protection Agency, 2007). Surface-water monitoring stations had at least 20 samples collected over at least a 3-year period from 1991 to 2004. Samples generally were collected monthly for 3 to 13 years. Nineteen of the stations selected have long-term-flow and water-quality records that began in the 1960s to 1980s.
Multiple Comparison Testing
Multiple comparison tests were done by using S-PLUS 7 software (Insightful Corporation, 2005) to determine if populations of log base 10 chloride and sodium concentrations and chloride:bromide ratios by mass (Cl:Br) in groundwater were significantly different by adjacent land use or well type.
Methods of Data Analysis 13
Figu
re 5
. W
ells
and
sur
face
-wat
er-q
ualit
y m
onito
ring
stat
ions
use
d in
the
anal
ysis
of t
he g
laci
al a
quife
r sys
tem
stu
dy a
rea,
nor
ther
n Un
ited
Stat
es.
!!!!!!!!
! !! !!!!!!!!!!
!!!
!!!
!!!
!
010
0 M
ILES
50
010
0 K
ILO
MET
ERS
50
020
0 M
ILES
100
020
0 K
ILO
MET
ERS
100
116°
35°
40°
45°
96°
86°
76°
66°
106°
Surf
ace
wat
er-q
ualit
y m
onito
ring
stat
ion
Wel
l in
land
-use
net
wor
k
Wel
l in
drin
king
wat
er n
etw
ork
EX
PLA
NAT
ION
Reg
ion
Gla
cial
aqu
ifer
syst
em b
ound
ary
Nat
iona
l wat
er q
ualit
y as
sess
men
t stu
dy u
nits
Cen
tral
East
Wes
tW
est C
entra
l
Base
from
U.S
. Geo
logi
cal S
urve
y 1:
2,00
0,00
0 Di
gita
l Dat
aAl
bers
Equ
al-A
rea
Coni
c pr
ojec
tion,
sta
ndar
d pa
ralle
ls 2
9°30
’an
d 45
°30’
, cen
tral m
erid
ian
-96°
, lat
itude
of o
rigin
23°

14 Chloride in Groundwater and Surface Water in Areas Underlain by the Glacial Aquifer System, Northern United States
This analysis also was used with maximum measured chloride concentrations and yields from samples collected in streams. A one-way analysis of variance (ANOVA) test was used to determine if the null hypothesis was rejected; the null hypoth-esis states that the means of all groups were not significantly different. If the null hypothesis was rejected, a Tukey’s test for pairwise comparisons was done (Helsel and Hirsch, 2002).
Multiple Linear Regression Modeling
Multiple linear regression models were developed to describe maximum measured chloride concentrations (1991–2004) and mean chloride yield (1991–2003) for samples collected from surface-water monitoring stations. Explanatory variables that were evaluated for use in the mod-els included land-use/land-cover characteristics, population density, road density, hydrologic and climatic variables, and wastewater discharges (table 3). Variables were selected on the basis of plausibility, statistical significance, and the distribu-tion of residuals.
Data on land-use and land-cover characteristics were determined from LANDSAT Thematic Mapper (TM) images created for the National Land Cover Dataset (NLCD) (Vogelmann and others, 1998). The version of the NLCD (NLCDe) used was enhanced as described by Nakagaki and Wolock (2005).
Road density was computed as the length of all roads in a basin divided by basin area (Curtis Price, U.S. Geological Survey, written commun., 2006). Road density by category was compiled for surface-water basins from the digital Streetmap layer of the Tele Atlas North America (ESRI, Inc., 2006).
Potential evapotranspiration data for each surface-water site were developed through the use of the Parameter-elevation Regressions on Independent Slopes Model (PRISM) with the methodology described by Daly and others (1994).
Hydrologic variables were compiled from a national application of the TOPMODEL rainfall-runoff model (Wolock, 1993). Stream base-flow index was estimated by using data developed by Wolock (2003).
Estimation of Chloride Loads
Chloride loads in streams were estimated for 95 basins (those with sufficient data for load estimation)—21, 44, and 30 representing forested, agricultural, and urban as the dominant land use, respectively (Appendix 1). Loads were estimated for water years with available data from 1992–2003. Nineteen sta-tions had data collected earlier than 1992, and chloride loads at these sites were plotted against time to identify obvious long-term trends.
Loads were estimated by using a multiple linear regression model included in the computer program LOADEST (Runkel and others, 2004). Given a time series of streamflow, additional data variables, and constituent
concentration, LOADEST assists the user in developing a regression model for the estimation of constituent load. Explanatory variables in the regression model include vari-ous functions of streamflow, decimal time, and additional user-specified data variables. The formulated regression model then is used to estimate loads over a user-specified time interval. Mean load estimates, standard errors, and 95-per-cent confidence intervals are developed on an annual basis. The calibration and estimation procedures in LOADEST are based on three statistical estimation methods. The first two methods, Adjusted Maximum Likelihood Estimation (AMLE) and Maximum Likelihood Estimation (MLE), are appropriate when the calibration model errors (residuals) are normally dis-tributed. Of the two, AMLE is the method of choice when the calibration data set (time series of streamflow, additional data variables, and concentration) contains censored data. The third method, Least Absolute Deviation (LAD), is an alternative to MLE when the residuals are not normally distributed (Runkel and others, 2004). Load estimates for selected urban basins were plotted to demonstrate visible trends with time by using a LOWESS smooth (Helsel and Hirsch, 2002).
Chloride in Groundwater and Surface Water
The concentrations of chloride and sodium in water from wells in the land-use studies network and major aquifer studies network were compared first by land use and well type and then to applicable drinking-water standards. Sources of chloride were evaluated on the basis of Cl:Br plotted against chloride and compared to binary mixing curves estimated for different sources.
Surface-water-quality data were compared with the recommended criteria for chloride concentrations to protect aquatic life and to determine the months when the recom-mended criteria concentrations commonly were exceeded. A multiple linear regression model was developed to describe the variability of the natural log of the maximum measured chloride concentration at all surface-water monitoring sta-tions. These maximum measured concentrations of chloride were compared with concentrations of chloride in base-flow samples from each station to determine if base-flow concen-trations could be used to predict which stations would have chloride concentrations greater than recommended aquatic criteria. Lastly, the loads and yields of chloride from 95 monitoring stations were computed, and yields were compared by dominant land use. A multiple linear regression model was used to describe the variability of the natural log of chloride yield. Selected stations with long-term data were used to show examples of apparent trends in chloride loads with time.

Chloride in Groundwater and Surface Water 15
Groundwater
Groundwater samples collected from wells in the land-use studies contained different distributions of chloride depending on the dominant land use (fig. 6). The largest median concentration of chloride was in samples from urban land-use wells (46 mg/L) and was about 16 times larger than the median concentration in samples from forested land-use wells (2.9 mg/L). The median concentration in water samples from agricultural land-use wells (12 mg/L) was about four times larger than in samples from forested land-use wells. The median concentration of chloride in drinking-water supply wells was 26 mg/L in public-supply wells and 12 mg/L in pri-vate domestic wells (fig. 6). The results of a one-way ANOVA indicated that the means of the populations of log base-10
transformed chloride data were significantly different. A Tukey’s test indicated that only the agricultural land-use wells and the private drinking-water wells were not significantly different (fig. 6).
Chloride concentrations in groundwater were greater than the SMCL of 250 mg/L for drinking water (U.S. Environmental Protection Agency, 1992) in samples from 20 of 797 land-use wells (2.5 percent); 17 were urban land-use wells and 3 were agricultural land-use wells. Chloride concentrations were greater than 250 mg/L in 10 of 532 drinking-water wells (1.7 percent); 9 were private domestic wells and 1 was a public-supply well. Groundwater with concentrations of chloride in excess of 230 mg/L that discharges to surface water may cause toxic effects to aquatic life on the basis of the recommended criteria established by U.S. Environmental Protection Agency (1988).
Table 3. Watershed characteristics evaluated in a regression analysis of maximum measured chloride concentrations.
[NLCDe, National Land Cover Dataset, Vogelmann and others, 1998, enhanced as described by Nakagaki and Wolock (2005); km, kilometer; km2, square kilometer; cm, centimeter; mi, mile; mi2, square mile; PRISM, Parameter-elevation Regressions on Independent Slopes Model; PCS, permit compliance system]
Land use, land cover (Vogelmann and others, 1998), population and road density
Percent of basin composed of low intensity residential, NLCDePercent basin composed of high intensity residential, NLCDePercent basin composed of commercial/industrial/transportation, NLCDePercent of basin composed of orchards/vineyards/other, NLCDePercent basin composed of pasture/hay, NLCDePercent basin composed of row crops, NLCDePercent basin composed of small grains, NLCDePercent basin composed of fallow, NLCDePopulation density 2000, in people/km2 (ESRI, 2006)Road density in km/km2 (Curtis Price, U.S. Geological Survey, written commun., 2006)
Road density by type (ESRI, Inc., 2006)
Major highway density, in mi/mi2
Major highway connector density, in mi/mi2
Highway density, in mi/mi2
Major road density, in mi/mi2
Local road density, in mi/mi2
Hydrologic and climatic variables
Percent of basin streamflow contributed by Dunne overland flow (estimated by means of TOPMODEL (Wolock, 1993) hydrologic model)Percent of basin streamflow contributed by Horton overland flow (estimated by means of TOPMODEL (Wolock, 1993) hydrologic model)Mean subsurface contact time in days (estimated by means of TOPMODEL (Wolock, 1993) hydrologic model)Base-flow indexMean potential evapotranspiration in cm (PRISM) [Daly and others, 1994]
Wastewater discharges
Number of major discharges upstream of monitoring site, PCS database (U.S. Environmental Protection Agency, 2007)Number of minor discharges upstream of monitoring site, PCS database (U.S. Environmental Protection Agency, 2007)

16 Chloride in Groundwater and Surface Water in Areas Underlain by the Glacial Aquifer System, Northern United States
Because sodium in drinking water is considered a human health issue, concentrations of sodium were also summarized for groundwater sites in this study. The distribution of sodium concentrations (in samples from 1,332 sites) was similar to that of chloride in the land-use wells. The largest median concentration of sodium was in samples from urban-land-use wells (26 mg/L) and was more than six times larger than the median concentration of sodium (4.1 mg/L) in water samples from forested-land-use wells. The median sodium concentra-tion in water samples from agricultural-land-use wells (6.3 mg/L) was larger than the median sodium concentrations in the forested-land-use wells (fig. 7). The median sodium con-centration was 19 mg/L in public-supply wells and 12 mg/L in private domestic wells. The only Federal drinking-water stan-dard for sodium is an unenforceable Drinking Water Advisory of 20 mg/L for individuals on a 500 milligram per day (mg/d), low-sodium diet (U.S. Environmental Protection Agency, 2004). Water in the majority of urban land-use wells (57.1 percent) had concentrations of sodium equal to or greater than 20 mg/L, followed by agricultural land-use wells (16.7 per-cent) and forested land-use wells (8.0 percent). The concentra-tion of sodium was equal to or larger than 20 mg/L in samples from 46.8 percent of the public-supply wells and 33.9 percent of the domestic wells.
Sources of Chloride in GroundwaterChloride:bromide ratios (Cl:Br) have been used by sev-
eral researchers to identify the sources of chloride in ground-water (Davis and others, 1998; Thomas, 2000; Jagucki and Darner, 2001; Panno and others 2006). The method is based on understanding the Cl:Br and chloride concentrations of different chloride sources, and the resulting Cl:Br and chloride concentrations when these sources are mixed.
Groundwater samples collected from a network of forested land-use wells had the lowest median Cl:Br ratio (by mass) (148). Samples collected from wells in the urban land-use study had the highest median Cl:Br (879), followed by the samples from wells in the agricultural land-use well study (283) (fig. 8). The median Cl:Br of water samples from the private drinking-water wells (193) was not significantly different from the median for forested land-use wells, and the median Cl:Br of samples from the public drinking-water-sup-ply wells (673) was not significantly different from the ratio for the urban land-use wells (fig. 8).
Mixing curves (fig. 9A) were developed to represent binary mixtures of halite, sewage or animal waste, potassium chloride fertilizers, landfill leachate, basin brines, and seawa-ter sources of chloride on the basis of data and studies listed in table 4. Binary mixing-curve lines were determined by using
Figure 6. Distribution of chloride concentrations in samples from shallow monitoring wells in forested, agricultural, and urban areas and in drinking-water supply wells in the glacial aquifer system, northern United States, 1991–2003.
50 430 317 94 438
Forest Agriculture Urban Public Private0.1
1
10
100
1,000
10,000
CON
CEN
TRAT
ION
OF
CHLO
RIDE
, IN
MIL
LIGR
AMS
PER
LITE
R
SMCL
30
90th percentile
75th percentile
median
25th percentile
10th percentile
EXPLANATION
Number of samples
SMCL, Secondary Maximum Contaminant Level
A B BC D
CHLORIDE CONCENTRATION BY WELL TYPE, p = <0.0001
B Sample populations that share the same letter symbol are not significantly different at the 0.05 level of significance
p is the attained significance level for one-way analysis of variance
Land-use monitoring wells Drinking-water supply wells

Chloride in Groundwater and Surface Water 17
mixing equations described by Jagucki and Darner (2001). Data from the land-use wells were plotted with the binary-mixing curves to evaluate if any of samples were representa-tive of end members or simple mixtures (figs. 9B–D).
Points representing groundwater samples that do not fall on any of the binary mixing lines reflect the reality that there may be more than two sources of chloride, and the actual mix-tures in groundwater samples are not likely mixtures of full-strength end members, but have been diluted with additional water. The effect of dilution of a concentrated end member with precipitation or dilute groundwater will be to retain the Cl:Br, but reduce the chloride concentration. An example of this would be a mixture containing chloride from sewage/animal waste and halite. The binary mixing curves 5 and 6 on figures 9A–D are based on the assumption that mixtures can contain different proportions of the full-strength end members. The halite end members were assumed to have a chloride concentration of 10,000–20,000 mg/L; higher concentrations are possible based on the solubility of halite. In reality, deicing salt is likely to be diluted with precipitation before recharging the groundwater, and septic-system waste may also be diluted with precipitation or dilute groundwater before moving down-gradient. Therefore, most mixtures are not likely equivalent to binary mixtures, unless samples are collected very close to the source of the chloride.
The samples from the forested-land-use wells generally had low Cl:Br and low concentrations of chloride; however, the positions of the plotted points for nine samples (fig. 9B)
indicated human influence from halite or sewage and animal waste. Samples from the agricultural-land-use wells were not dominated by any one source of chloride (fig. 9C), although there was a large concentration of points around mixtures of dilute groundwater and potassium chloride or sewage and animal waste. Sources of chloride in agricultural areas could include deicing salt; salt used in animal feeds, fertilizer, and water softeners; salt in animal waste; and the use of deep groundwater (containing brines) for irrigation. Points for chlo-ride concentrations above 100 mg/L in samples from agri-cultural-land-use wells plotted near the binary mixing curves (lines) for dilute groundwater and (1) halite, or (2) sewage or animal waste mixed with halite, or (3) dilute groundwater mixed with basin brines, or (4) landfill leachate.
Points representing samples from the urban-land-use wells plotted along or between the mixing lines for dilute groundwater/halite, or dilute groundwater/sewage or animal waste, and dilute groundwater and potassium chloride fertil-izer (fig. 9D). Many samples had a Cl:Br of 1,000 or higher and chloride concentrations greater than 100 mg/L. This analy-sis shows that, as in the agricultural areas, there are mixed sources of anthropogenic inputs of chloride to groundwater. Samples with a Cl:Br greater than 1,000 and chloride concen-trations greater than 100 mg/L are likely to be dominated by halite inputs from deicing or water softeners.
Points representing samples from drinking-water sup-ply wells initially were plotted with the binary mixing curves that were used in figures 9A–D; however, there was a wide
Figure 7. Distribution of sodium concentrations in samples from shallow monitoring wells in forested, agricultural, and urban areas and in drinking-water supply wells in the glacial aquifer system, northern United States, 1991–2003.
50 431 317 94 440
CON
CEN
TRAT
ION
OF
SODI
UM,
IN M
ILLI
GRAM
S PE
R LI
TER
A B C DC D1
10
100
1,000
Drinking water advisory
SODIUM CONCENTRATION BY WELL TYPE, p = <0.0001
30
90th percentile
75th percentile
median
25th percentile
10th percentile
EXPLANATION
Number of samples
p is the attained significance level for one-way analysis of variance
B Sample populations that share the same letter symbol are not significantly different at the 0.05 level of significance
Forest Agriculture Urban Public Private
Land-use monitoring wells Drinking-water supply wells

18 Chloride in Groundwater and Surface Water in Areas Underlain by the Glacial Aquifer System, Northern United States
scattering of points around the binary mixing lines. There were, however, some statistically significant differences in the Cl:Br by supply-well type (fig. 8) and by the geographic region (fig. 10). Public drinking-water supply wells had a significantly higher Cl:Br than private drinking-water wells, indicating that water quality in these public drinking-water supply wells is influenced by human activities, primarily deic-ing, water softening, and sewage/animal waste.
The Cl:Br in samples from the private drinking-water supply wells was were not significantly different from ratios in samples from the forested land-use wells (fig. 8); however, concentrations of chloride were significantly higher in the private drinking-water supply wells than in samples from the forested land-use wells (fig. 6).
Samples from drinking-water supply wells in the east had significantly higher Cl:Br than samples from other regions in the glacial aquifer system (fig. 10). Samples from the west-central and west parts of the glacial aquifer system had the lowest Cl:Br (fig. 10). The Cl:Br in 65 percent of the samples from the east and 43 percent of the samples from the central parts of the glacial aquifer system were greater than 460 (table 4, minimum value for sewage and animal waste), indicating the influence of chloride from deicing salt, water-softening salt, and sewage and animal waste (fig. 10).
Surface Water
Surface-water-quality data from monitoring sites on 100 streams or rivers that were sampled 10 or more times for chloride from 1991 to 2004 were analyzed to make compari-sons of chloride concentration to basinwide land use. Samples generally were collected monthly for 3 to 13 years. Some sites that were part of State networks had many more years of chlo-ride data. Multiple linear regression models were developed to describe the distribution of maximum measured chloride concentrations and chloride yields for samples collected from 1991 to 2004 in forested, agricultural, and urban basins. Chloride yields were compared among forested, agricultural, and urban basins.
To evaluate the potential for chloride concentrations to be greater than the USEPA recommended aquatic life criteria described below for chloride (U.S. Environmental Protection Agency, 1988), the maximum measured concentrations (samples collected from 1991 to 2004) were compared by land use (fig. 11). The recommended chronic criterion for aquatic life is a 4-day average of 230 mg/L with a recurrence interval of once every 3 years (U.S. Environmental Protection Agency, 1988). Samples from 13 sites with urban land use and 2 sites with agricultural land use had chloride values that were greater
Figure 8. Distribution of chloride:bromide ratios (by mass) in samples from shallow monitoring wells in forested, agricultural, and urban areas and in drinking-water supply wells in the glacial aquifer system, northern United States, 1991–2003.
0.1
1
10
100
1,000
10,000
CHLO
RIDE
:BRO
MID
E RA
TIO
BY M
ASS
A AB C C
CHLORIDE:BROMIDE RATIO BY WELL TYPE, p = <0.0001
30
35 373 294 86 378
90th percentile
75th percentile
median
25th percentile
10th percentile
EXPLANATION
Number of samples
p is the attained significance level for one-way analysis of variance
B Sample populations that share the same letter symbol are not significantly different at the 0.05 level of significance
Forest Agriculture Urban Public Private
Land-use monitoring wells Drinking-water supply wells

Chloride in Groundwater and Surface Water 19
than the chronic concentration value at least once (table 5). Sampling frequency was insufficient to determine whether the 4-day average would have been greater than 230 mg/L with a recurrence interval of less than once every 3 years. Six of the sites had chloride concentrations greater than 230 mg/L in 10 percent or more of the samples collected. Concentrations in samples from three sites were greater than the recommended acute aquatic criterion concentration for chloride of 860 mg/L (U.S. Environmental Protection Agency, 1988). This criterion relates to a 1-hour average concentration with a recurrence interval of less than once every 3 years.
Samples with concentrations of chloride greater than 230 mg/L generally were collected during the winter and spring months, primarily November–April, indicating a possible relation with winter deicing activity (table 5). Concentrations above the recommended criteria may occur during a rain or freezing rain event following the application of deicing chemicals, or when daytime temperatures rise high enough to melt roadside and parking-lot snow and ice (fig. 12). Samples with chloride concentrations above the recommended aquatic criteria in late spring and summer may be explained by the discharge of groundwater containing high concentrations of chloride (for example, Shingle Creek, station 05288705 and Lincoln Creek, station 040869415; table 5) or could be related to wastewater discharges with high chloride during a low-flow period, as in the case of two monitoring stations in Illinois (05531500, 05532000) identified in table 5 (CH2M HILL Inc., 2003).
Concentrations of chloride considered to represent base-flow samples collected from 1991–2004 were selected from the data by using the sample with the lowest river discharge at each site. Samples collected during base-flow periods are presumed to represent the quality of groundwater, except for basins with major wastewater discharges. The median concentration of chloride was 81 mg/L in base-flow samples from urban basins, 21 mg/L from agricultural basins, and 3.5 mg/L from forested basins. Chloride concentrations for the selected base-flow samples were plotted against the maximum measured chloride concentrations to determine whether there was a relation (fig. 13). Maximum measured chloride concentrations were greater than 230 mg/L in samples from sites at which base-flow chloride concentrations were greater than about 75–90 mg/L. This result suggests that base-flow concentrations can be used to predict which streams may have concentrations larger than the USEPA recommended chronic criteria for chloride. Streams with elevated concentra-tions of chloride in base flow may be more likely to exceed the recommended criteria during the winter months, because the chloride concentrations are high at the beginning of snowmelt events that contribute stormwater discharge contain-ing concentrated chloride. Therefore, the loads in base flow from groundwater discharge and wastewater discharge are an important consideration in basins with chloride concentrations larger than 230 mg/L.
Relation of Maximum Chloride Concentration to Explanatory Variables
A multiple linear regression model was developed to describe the variability of the natural log of maximum measured chloride concentrations. The regression analysis was performed on chloride data from 83 of the 100 stations previously described. This subset was used because data for some of the explanatory variables (table 3) were unavailable for some stations. The data set included 15 forested basins, 41 agricultural basins, and 27 urban basins. Three significant variables—major road density, potential evapotranspiration, and the percentage of the annual streamflow from saturated overland flow (Dunne overland flow), (table 6)—explained 66 percent of the variability in the natural log of the maxi-mum measured chloride concentration. Model residuals were approximately normally distributed with a constant variance (fig. 14).
Basins with greater density of major roads had higher maximum chloride concentrations. This variable indicates a likely relation with areas receiving deicing salts, but road densities also are usually correlated with overall urbanization and population density, indicating the possibility for multiple sources of chloride, as described in earlier sections of this report.
Basins with higher average potential evapotranspiration generally had higher maximum concentrations of chloride. The significance of this variable may be explained as follows: sites with low evapotranspiration are more likely to have more groundwater recharge (Granato and others, 1995), and areas with high potential evapotranspiration may be more likely to concentrate salts in basin recharge and runoff.
The variable “Dunne overland flow” was significant and had a negative sign. This variable is also known as “saturation overland flow” and was described by Dunne and Black (1970). The negative sign indicates that basins with the most annual saturated overland flow had lower maximum chloride concen-trations, because with more overland runoff, there is a greater potential for dilution of salts.
Loads and Yields of Chloride from Forested, Agricultural, and Urban Basins
Chloride loads were estimated for 20 forested, 44 agricultural, and 31 urban basins from 1991 to 2003. The average load was determined from the LOADEST results for the number of years of available data within the study time period. Loads were normalized by drainage area and converted to yields in tons of chloride per square mile. The median yield was 6.4 tons/mi2 from the forested basins, 15.4 tons/mi2 from the agricultural basins, and 88 tons/mi2 from the urban basins (fig. 15).

20 Chloride in Groundwater and Surface Water in Areas Underlain by the Glacial Aquifer System, Northern United States
Figure 9. (A) Binary mixing curves representing sources of chloride. The relation of chloride concentration to chloride:bromide ratios (by mass) for samples from shallow monitoring wells in (B) forested areas, (C) agricultural areas, and (D) urban areas.
10 100 1,000 10,0001
10
100
1,000
10,000
0.1 1
1. 2.
3.
4.
5. 6.
7. 8.
9.
10.
Range for sewage and animal waste end member
10 100 1,000 10,0001
10
100
1,000
10,000
0.1 1
Approximate range for dilutegroundwater
1. 2.
3.
4.
5. 6.
7. 8.
9.
10.
CONCENTRATION OF CHLORIDE, IN MILLIGRAMS PER LITER
CHLO
RIDE
:BRO
MID
E RA
TIO
BY M
ASS
Approximate range for dilutegroundwater
Binary mixing curves
1. Dilute groundwater/halite used for deicing, high range2. Dilute groundwater/halite used for deicing, low range3. Dilute groundwater/sewage or animal waste high range4. Dilute groundwater/sewage or animal waste low range5. Halite used for deicing/sewage or animal waste high range6. Halite used for deicing/sewage or animal waste low range7. Dilute groundwater/potassium chloride fertilizer8. Dilute groundwater/basin brines9. Dilute groundwater/seawater10. Dilute groundwater/landfill leachate
A
B

Chloride in Groundwater and Surface Water 21
Figure 9. (A) Binary mixing curves representing sources of chloride. The relation of chloride concentration to chloride:bromide ratios (by mass) for samples from shallow monitoring wells in (B) forested areas, (C) agricultural areas, and (D) urban areas.—Continued
Approximate range for dilutegroundwater
Approximate range for dilutegroundwater
10 100 1,000 10,000
1
10
100
1,000
10,000
0.1 1
1. 2.
3.
4.
5. 6.
7. 8.
9.
10.
C
10 100 1,000 10,0001
10
100
1,000
10,000
0.1 1
1. 2.
5. 6.
8.
9.
10.
3.
4.7.
CONCENTRATION OF CHLORIDE, IN MILLIGRAMS PER LITER
CHLO
RIDE
:BRO
MID
E RA
TIO
BY M
ASS
D
Binary mixing curves
1. Dilute groundwater/halite used for deicing, high range2. Dilute groundwater/halite used for deicing, low range3. Dilute groundwater/sewage or animal waste high range4. Dilute groundwater/sewage or animal waste low range5. Halite used for deicing/sewage or animal waste high range6. Halite used for deicing/sewage or animal waste low range7. Dilute groundwater/potassium chloride fertilizer8. Dilute groundwater/basin brines9. Dilute groundwater/seawater10. Dilute groundwater/landfill leachate

22 Chloride in Groundwater and Surface Water in Areas Underlain by the Glacial Aquifer System, Northern United States
Table 4. Chloride:bromide ratios for sources of chloride to water resources.
[mg/L, milligrams per liter; Cl:Br, chloride to bromide ratio by mass; shaded areas represent end members used to draw binary mixing curves]
Chloride source and referenceChloride
(mg/L)Bromide
(mg/L)Cl:Br
Dilute groundwater
Forested land-use wells, glacial aquifer system (median of 35 samples) 3 0.02 148End member used for dilute groundwater, from forested land-use well network .33 .015 22
Sewage and animal waste
Panno and others, 2006, median of samples from 6 private septic systems 91 .09 76911,011
Davis and others, 1998 (assembled for U.S., England) -- -- 300–600Thomas, 2000; Jagucki and Darner, 2001 69 -- 460Peavy, 1978 37–101 -- --Panno and others, 2006, median of 4 samples of hog and horse waste 847 .570 1,395
Halite
Granato, 1996; analysis of deicing salt -- -- 5,000End member range used in binary mixing curves for deicing salt 210,000–20,000Knuth and others, 1990, analysis of deicing salt -- -- 8,400Davis and others, 1998 -- -- 1,000–10,000Panno and others, 2006, analysis of deicing salt -- -- 13,497Panno and others, 2006, analysis of water softening salt -- -- 5,139Panno and others, 2006, analysis of water softening salt -- -- 3,438
Seawater
Feth, 1981 19,300 67 288
Landfill leachate
Panno and others, 2006, median of 10 leachate samples from Illinois 1,284 7.8 1933164
Mullaney and others, 1999, landfill leachate affected groundwater sample 247 1.4 173
Fertilizer
Panno and others, 2006, potassium chloride fertilizer sample analysis 440 -- 510
Basin brines
Panno and others, 2006, Illinois Basin brines summarized from other studies 64,600 -- 4061 Cl:Br ratio based on dividing Cl and Br values reported by Panno and others (2006).2 Assumed range in concentrated deicing salt runoff in binary mixing curves used.3 Cl:Br ratio based on dividing Cl and Br values reported by Panno and others (2006).4 Estimated upper limit based on analysis in Panno and others (2006).

Chloride in Groundwater and Surface Water 23
Relation of Chloride Yield to Explanatory Variables
A multiple linear regression model was developed to describe the natural log of chloride yield. The data set included 15 forested basins, 41 agricultural basins, and 27 urban basins. Four variables (table 7) explained 69 percent of the variability in the natural log of chloride yield. Significant variables selected or modified from table 3 and shown in table 7 were Highway density and the Number of major discharges upstream of monitoring site in USEPA PCS database + (plus) 1, potential evapotranspiration, and the difference between the percent of urban and agricultural land. Model residuals were approximately normally distributed, with a constant variance (fig. 16).
Major dischargers include municipal wastewater-treat-ment facilities with discharges greater than 1 million gallons per day (Mgal/d) and other facilities with discharges that have been rated by USEPA as major, based on volume and type of pollutants and type of receiving waters (Steven Winnett, U.S. Environmental Protection Agency, written commun., 2007). The variable “number of major discharges upstream of the monitoring site in the USEPA Permit Compliance System (PCS) database,” if used alone in a simple linear regression
model, explains about 17 percent of the variability in the chlo-ride yield, indicating that wastewater discharges are a likely component of chloride loads in some streams sampled.
The significance of the variable Highway density (table 3) is probably related to areas that receive deicing salts in winter. The density of different road categories is gener-ally correlated with urban land use and population density, and therefore other sources of chloride from urban settings cannot be excluded from this analysis. The difference between percent urban and percent agricultural land was only weakly correlated (correlation coefficient 0.44) with highway density, and explained an additional 14 percent of the variability in chloride yield.
Trends in Loads at Selected Sites and Evaluation of Sources of Chloride
Long-term data were available for 19 of the monitor-ing sites for which loads were estimated. Load estimates for three selected urban basins with long-term data were plotted to demonstrate visible trends with time by using a LOWESS smooth (Helsel and Hirsch, 2002) (figs. 17A–C). The appar-ent trends are similar to those reported by Kaushal and others (2005). Increases in chloride load over time generally can be
Figure 10. Distribution of chloride:bromide ratios (by mass) in samples from drinking-water supply wells in geographic regions of the glacial aquifer system, northern United States, 1991–2003.
30
90th percentile
75th percentile
median
25th percentile
10th percentile
EXPLANATION
Number of samples
B Sample populations that share the same letter symbol are not significantly different at the 0.05 level of significance
p is the attained significance level for one-way analysis of variance
103 185 108 68
0.1
1
10
100
1,000
10,000
CHLO
RIDE
:BRO
MID
E RA
TIO
BY M
ASS
EAST CENTRAL WEST-CENTRAL
WEST
CHLORIDE:BROMIDE IN DRINKING-WATER SUPPLY WELLSBY GEOGRAPHIC REGION, p = <0.0001
A B C C
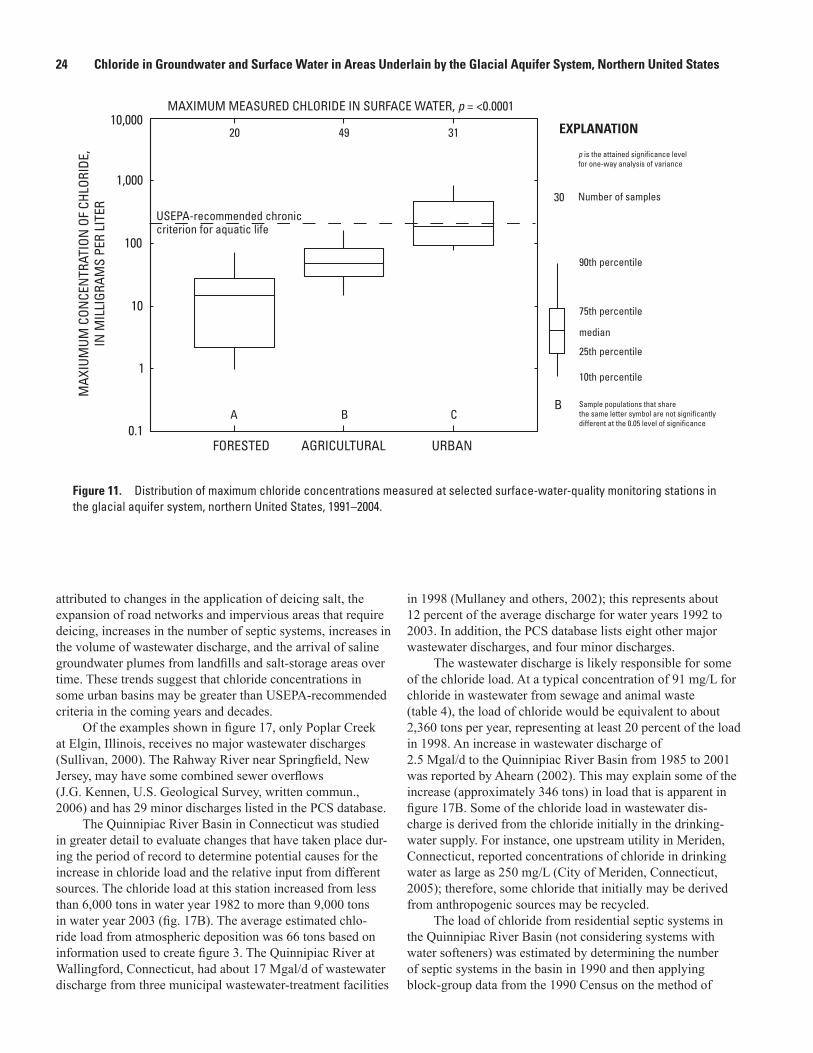
24 Chloride in Groundwater and Surface Water in Areas Underlain by the Glacial Aquifer System, Northern United States
Figure 11. Distribution of maximum chloride concentrations measured at selected surface-water-quality monitoring stations in the glacial aquifer system, northern United States, 1991–2004.
20 49 31
FORESTED URBAN
USEPA-recommended chroniccriterion for aquatic life
1
10
100
1,000
10,000
0.1
MAX
IUM
UM C
ONCE
NTR
ATIO
N O
F CH
LORI
DE,
IN M
ILLI
GRAM
S PE
R LI
TER
AGRICULTURAL
A B C
MAXIMUM MEASURED CHLORIDE IN SURFACE WATER, p = <0.0001
30
90th percentile
75th percentile
median
25th percentile
10th percentile
EXPLANATION
Number of samples
B Sample populations that share the same letter symbol are not significantly different at the 0.05 level of significance
p is the attained significance level for one-way analysis of variance
attributed to changes in the application of deicing salt, the expansion of road networks and impervious areas that require deicing, increases in the number of septic systems, increases in the volume of wastewater discharge, and the arrival of saline groundwater plumes from landfills and salt-storage areas over time. These trends suggest that chloride concentrations in some urban basins may be greater than USEPA-recommended criteria in the coming years and decades.
Of the examples shown in figure 17, only Poplar Creek at Elgin, Illinois, receives no major wastewater discharges (Sullivan, 2000). The Rahway River near Springfield, New Jersey, may have some combined sewer overflows (J.G. Kennen, U.S. Geological Survey, written commun., 2006) and has 29 minor discharges listed in the PCS database.
The Quinnipiac River Basin in Connecticut was studied in greater detail to evaluate changes that have taken place dur-ing the period of record to determine potential causes for the increase in chloride load and the relative input from different sources. The chloride load at this station increased from less than 6,000 tons in water year 1982 to more than 9,000 tons in water year 2003 (fig. 17B). The average estimated chlo-ride load from atmospheric deposition was 66 tons based on information used to create figure 3. The Quinnipiac River at Wallingford, Connecticut, had about 17 Mgal/d of wastewater discharge from three municipal wastewater-treatment facilities
in 1998 (Mullaney and others, 2002); this represents about 12 percent of the average discharge for water years 1992 to 2003. In addition, the PCS database lists eight other major wastewater discharges, and four minor discharges.
The wastewater discharge is likely responsible for some of the chloride load. At a typical concentration of 91 mg/L for chloride in wastewater from sewage and animal waste (table 4), the load of chloride would be equivalent to about 2,360 tons per year, representing at least 20 percent of the load in 1998. An increase in wastewater discharge of 2.5 Mgal/d to the Quinnipiac River Basin from 1985 to 2001 was reported by Ahearn (2002). This may explain some of the increase (approximately 346 tons) in load that is apparent in figure 17B. Some of the chloride load in wastewater dis-charge is derived from the chloride initially in the drinking-water supply. For instance, one upstream utility in Meriden, Connecticut, reported concentrations of chloride in drinking water as large as 250 mg/L (City of Meriden, Connecticut, 2005); therefore, some chloride that initially may be derived from anthropogenic sources may be recycled.
The load of chloride from residential septic systems in the Quinnipiac River Basin (not considering systems with water softeners) was estimated by determining the number of septic systems in the basin in 1990 and then applying block-group data from the 1990 Census on the method of

Chloride in Groundwater and Surface Water 25
Table 5. Monitoring stations where surface waters had chloride concentrations greater than 230 milligrams per liter in the glacial aquifer system, northern United States, 1991–2004.—Continued
[mg, milligram; L, liter; U, urban land use; A, agricultural land use]
Station identifier
Station nameDominant
landuse
Number of
chloride samples
Number of samples greater than 230
mg/L
Per-cent
Maxi-mum
chloride concen-tration (mg/L)
Months with concentration greater than 230 mg/L
J F M A M J J A S O N D
01102500Aberjona River
at Winchester, Massachusetts
U 127 12 9.4 673 X X X X X
01356190
Lisha Kill north-west of Niskayuna, New York
U 90 7 7.8 353 X X X
01391500Saddle River at
Lodi, New Jersey
U 59 1 1.7 408 X
01394500
Rahway River near Springfield, New Jersey
U 59 4 6.8 1,320 X X X
03353637
Little Buck Creek near Indianapolis, Indiana
U 205 4 2.0 470 X X X
04072050
Duck Creek at Seminary Road near Oneida, Wisconsin
A 93 2 2.2 425 X X
040869415
Lincoln Creek at 47th Street at Milwaukee, Wisconsin
U 184 42 22.8 4,330 X X X X X X X X X X X
04161820
Clinton River at Sterling Heights, Michigan
U 43 3 7.0 300 X X X
04186500Auglaize River
near Fort Jennings, Ohio
A 80 1 1.3 251 X
05288705
Shingle Creek at Queen Avenue in Minneapo-lis, Minnesota
U 115 25 21.7 2,020 X X X X X
05330902
Nine Mile Creek near James Circle at Bloomington, Minnesota
U 56 7 12.5 522 X X X

26 Chloride in Groundwater and Surface Water in Areas Underlain by the Glacial Aquifer System, Northern United States
Figure 12. Chloride concentrations, snow depth, and discharge at station 05288705, Shingle Creek at Queen Avenue in Minneapolis, Minnesota, February 1997. (Data from James Fallon, U.S. Geological Survey, written commun., 2006.)
2/7/1997 2/14/1997 2/21/1997 2/28/1997
10
100
1,000
5
10
15
20
25
ChlorideSnow DepthDischarge
CHLO
RIDE
CON
CEN
TRAT
ION
, IN
MIL
LIGR
AMS
PER
LITE
R
DATE
SNOW
DEP
TH, I
N IN
CHES
30
2/1/1997
DISC
HARG
E, IN
CUB
IC F
EET
PER
SECO
ND
Table 5. Monitoring stations where surface waters had chloride concentrations greater than 230 milligrams per liter in the glacial aquifer system, northern United States, 1991–2004.—Continued
[mg, milligram; L, liter; U, urban land use; A, agricultural land use]
Station identifier
Station nameDominant
landuse
Number of
chloride samples
Number of samples greater than 230
mg/L
Percent
Maxi-mum
chloride concen-tration (mg/L)
Months with concentration greater than 230 mg/L
J F M A M J J A S O N D
05531500
Salt Creek at Western Springs, Illinois
U 137 40 29.2 635 X X X X X
05527800
Des Plaines River at Russell, Illinois
U 39 1 2.6 252 X
05532000Addison Creek
at Bellwood, Illinois
U 51 16 31.4 829 X X X X X X X
05550500 Poplar Creek at Elgin, Illinois
U 45 12 26.7 432 X

Chloride in Groundwater and Surface Water 27
Figure 13. Chloride concentrations in base flow, plotted against maximum measured chloride concentrations at selected forested, agricultural, and urban basins in the glacial aquifer system, northern United States, 1991–2004.
Table 6. Multiple linear-regression estimates of model coefficients, standard errors, t-statistic and p-values for the dependent variable natural log of maximum measured chloride concentration in surface water for selected urban, agricultural, and forested basins, in the glacial aquifer system, northern United States, 1991–2004.
[mi, mile; mi2, square mile; mm, millimeter; yr, year; <, less than; -, minus]
Variable Units Parameter estimate Standard error t-statistic p-value
Intercept Dimensionless -8.3728 1.6394 -5.1071 <0.0001Major road density mi/mi2 1.1229 .1498 7.4941 <.0001Potential evapotranspiration 1961–90
(effect applied only up to 625 mm/year)
mm/yr .0212 .0028 7.4909 <.0001
Percent Dunne overland flow(saturated overland flow)
Percent of annual stream-flow -.4547 .1061 -4.2838 .0001
AgricultureForested
Urban
0.1
1
10
100
1,000
10,000
BASE-FLOW CHLORIDE CONCENTRATION, IN MILLIGRAMS PER LITER
MAX
IMUM
MEA
SURE
D CH
LORI
DE C
ONCE
NTR
ATIO
N,
IN M
ILLI
GRAM
S PE
R LI
TER
10 1000.1 1,0001
log10
(Y) = 1.025(log10
(X)) + 0.2875
R2 = 0.84
USEPA-recommended chroniccriterion for aquatic life

28 Chloride in Groundwater and Surface Water in Areas Underlain by the Glacial Aquifer System, Northern United States
Figure 15. Distribution of annual mean chloride yields at selected surface-water-quality monitoring stations in the glacial aquifer system, northern United States, 1991–2003.
FORESTED URBANAGRICULTURAL
1
10
100
1,000
CHLO
RIDE
YIE
LD, I
N T
ONS
PER
SQUA
RE M
ILE
PER
YEAR
CHLORIDE YIELD FROM STREAMS, p = <0.0001
30
90th percentile
75th percentile
median
25th percentile
10th percentile
EXPLANATION
Number of samples
B Sample populations that share the same letter symbol are not significantly different at the 0.05 level of significance
p is the attained significance level for one-way analysis of variance
20 44 31
A A B
Figure 14. Predicted natural log of maximum measured chloride concentrations from multiple linear regression modeling, and observed natural log of maximum measured chloride concentrations in selected forested, agricultural, and urban basins in the glacial aquifer system, northern United States, 1991–2004.
PREDICTED NATURAL LOG OF MAXIMUM MEASURED CHLORIDE CONCENTRATION
OBSE
RVED
NAT
URAL
LOG
OF
MAX
IMUM
M
EASU
RED
CHLO
RIDE
CON
CEN
TRAT
ION
1:1line
least squares fitted line
0
2
4
6
8
1 2 3 4 5 6 7

Chloride in Groundwater and Surface Water 29
Figure 16. Predicted natural log of annual chloride yield from multiple linear regression modeling and observed natural log of chloride yield in selected forested, agricultural, and urban basins in the glacial aquifer system, northern United States, 1991–2003.
Table 7. Multiple linear regression estimates of model coefficients and standard errors, t-statistics, and p-values for the dependent variable natural log of chloride yield in selected forested, agricultural and urban basins in the glacial aquifer system, northern United States, 1991–2003.
[mi, mile; mm, millimeter; yr, year; USEPA PCS, U.S. Environmental Protection Agency Permit Compliance System; NLCDe, National Landcover Dataset (Vogelmann and others (1998), enhanced by Nakagaki and Wolock (2005)); +, plus; -, minus; <, less than]
Variable Units Parameter estimate Standard error t-statistic p-value
Intercept Dimensionless -5.0085 1.0433 -4.8005 <0.0001Highway density (U.S. numbered
routes; does not include limited access highways)
mi/mi2 2.3846 .8936 2.6687 .0093
natural log of (number of major discharges upstream of monitoring site in USEPA PCS database+1)
Dimensionless .4149 .1809 2.2934 .0245
Potential evapotranspiration 1961–90 (effect applied only up to 700 mm/year)
mm/yr .0123 .0017 7.2562 <.0001
Percent of urban-agricultural land (NLCDe) Percent of basin area .0109 .0018 5.9849 <.0001
PREDICTED NATURAL LOG OF ANNUAL CHLORIDE YIELD
OBSE
RVED
NAT
URAL
LOG
OF
ANN
UAL
CHLO
RIDE
YIE
LD
1:1line
least squares fitted line
0
1
2
3
4
5
1 432 5 6

30 Chloride in Groundwater and Surface Water in Areas Underlain by the Glacial Aquifer System, Northern United States
Figure 17. Chloride loads with time at selected water-quality monitoring stations in the glacial aquifer system, northern United States: (A) Poplar Creek at Elgin, Illinois, water years 1978–2003; (B) Quinnipiac River at Wallingford, Connecticut, water years 1969–2003; and (C)Rahway River near Springfield, New Jersey, water years 1980–2003.
1978 19
79 19
80 19
81 19
82 19
83 19
84 19
85 19
86 19
87 19
88 19
89 19
90 19
91 19
92 19
93 19
94 19
95 19
96 19
97 19
98 19
99 20
00 20
01 20
02 20
030
4,000
8,000
12,000
16,00005550500 Poplar Creek at Elgin, IllinoisA
Fitted line is a LOWESS smooth
1969
1971
1973
1975
1977
1979
1981
1983
1985
1987
1989
1991
1993
1995
1997
1999
2001
2003
2,000
4,000
6,000
8,000
10,000
12,000
0
CHLO
RIDE
LOA
D, IN
TON
S PE
R YE
AR
01196500 Quinnipiac River at Wallingford, Connecticut B
Fitted line is a LOWESS smooth
1980
1981
1982
1983
1984
1985
1986
1987
1988
1989
1990
1991
1992
1993
1994
1995
1996
1997
1998
1999
2000
2001
2002
2003
WATER YEAR
0
1,000
2,000
3,000
4,000
5,000
6,000
01394500 Rahway River near Springfield, New Jersey C
Fitted line is a LOWESS smooth

Summary and Conclusions 31
sewage disposal (U.S. Department of Commerce, 1991). The estimated number of septic systems in the basin upstream from the monitoring station was 10,400. By using the estimated chloride concentration of 91 mg/L for wastewater (table 4) and assuming 300 gal/d of water use per household, the estimated load of chloride from septic systems was 430 tons in 1990. The number of septic systems likely has increased since 1990, and the presence of water softeners could increase this load substantially.
The other likely source of the increase in chloride load in this basin is the increase in the impervious area, including roads, during the period of record, and subsequent increases in deicing these areas. The impervious area of the basin above the Quinnipiac monitoring station was analyzed for 1985 and 2002 using the Impervious Surface Analysis Tool (ISAT) described by Chabaeva and others (2004). This method was used with impervious surface coefficients developed for Connecticut and population-density classes (Prisloe and others, 2003). The University of Connecticut has developed consistently interpreted satellite imagery for Connecticut land use and land cover for 1985, 1990, 1995, and 2002 (Civco and others, 1998). The ISAT method estimated that the impervious cover for the basin upstream from the monitoring station was 13.3 percent in 1985, but increased to 14.7 percent in 2002—an increase of 1.4 percent, or about 890 acres. In addition to these increases, Interstate 691 was completed in 1988, adding about 5.5 miles of four-lane road, and an estimated 85 tons of deicing salt (or about 52 tons of chloride) (Patrick Rodgers, Connecticut Department of Transportation, oral commun., 2004). Additional potential sources of chloride include 9 salt-storage areas and 20 landfills (Connecticut Department of Environmental Protection, 1995). This analysis indicates that although deicing salts may be the dominant input of chlo-ride in many of the urban basins studied, other sources should be considered in the establishment of Total Maximum Daily Loads (TMDLs).
Summary and ConclusionsThe use of salt in the United States has increased since
the 1950s. Salt use has increased from 42.9 million tons in 1975 to nearly 58.5 million tons in 2005. However, the largest use of salt for many years has been the chloralkali industry. In 2005 the largest use was for deicing (39.5 percent), followed by use in the chloralkali industry (34.7 percent). The remain-ing uses total about 25 percent. The Northern States that compose the glacial aquifer system were the end destination for about 76 percent of the shipments of evaporated salt and rock salt.
Chloride concentrations were greater than the U.S. Environmental Protection Agency secondary maximum con-taminant level (SMCL) of 250 milligrams per liter in 2.5 per-cent of samples from 797 shallow monitoring wells sampled (land-use wells), and in 1.7 percent of 532 drinking-water
supply wells sampled from 1991 to 2003. Chloride concentra-tions were largest in samples from shallow monitoring wells in urban areas (median concentration of 46 milligrams per liter), followed by the concentrations in samples from agricultural areas (median, 12 milligrams per liter), and forested areas (median, 2.9 milligrams per liter).
Chloride:bromide ratios, by mass, in groundwater samples were plotted against chloride concentrations along with binary mixing curves for different sources of chloride. Samples from shallow monitoring wells in the urban areas had the largest ratios of chloride to bromide, and generally plotted on or between binary mixing curves for dilute groundwater, and (1) halite, (2) sewage and animal waste, and (3) potassium chloride fertilizer; these results indicate mixed sources of chloride. Samples that had a chloride:bromide ratio greater than 460 are dominated by anthropogenic sources of chloride. Samples that had a chloride:bromide ratio greater than 1,000 and chloride concentrations greater than 100 milligrams per liter are likely dominated by halite by mass, but may contain lesser proportions of other sources.
Samples from shallow monitoring wells in agricultural areas were not dominated by any one source of chloride, but there was a cluster of points representing samples that plotted on or near the binary mixing lines for dilute groundwater and potassium chloride or dilute groundwater and sewage and animal waste. Sources of chloride in agricultural areas include deicing salt, salt used in animal feeds, water-softening salts, salts in animal waste and fertilizer, and the use of irrigation water containing brines.
Ratios for samples from drinking-water wells indicated mixed sources of chloride, but two general patterns emerged when chloride:bromide ratios were compared by well type (private domestic drinking-water wells, and public drinking-water wells) and by region in the glacial aquifer system. The chloride:bromide ratios of the samples from the public drink-ing-water wells were significantly larger than for the private domestic wells, indicating anthropogenic sources of chloride. This may be a result of the integration of water of different depths and ages into public drinking-water wells due to pump-ing. Drinking-water-well samples from the east region of the glacial aquifer system had the highest chloride:bromide ratios followed by the central region. Samples from the west-central and west areas had low chloride:bromide ratios, indicating less human influence on water quality.
Data collected from 1991 to 2004 from 100 surface-water monitoring sites in the glacial aquifer system draining land dominated by forested land cover or urban, and agricultural land use were analyzed to compare chloride concentrations to USEPA-recommended chronic aquatic criteria, to relate maximum measured chloride concentrations to ancillary factors, and to compute annual loads so that chloride yields could be compared. Fifteen (12 urban, 3 agricultural) of the 100 sites had samples with concentrations greater than the USEPA-recommended aquatic criteria concentration for chloride of 230 milligrams per liter. Six of the 15 sites had 10 percent or more of their values greater than 230 milligrams

32 Chloride in Groundwater and Surface Water in Areas Underlain by the Glacial Aquifer System, Northern United States
per liter, indicating frequent occurrence of high concentra-tions. Concentrations of chloride greater than 230 milligrams per liter occurred most frequently during the months from November to April, indicating a likely relation with winter deicing activities.
Sites with maximum concentrations of chloride greater than 230 milligrams per liter had base-flow concentrations of chloride greater than 75 to 90 milligrams per liter. This result indicates that basins with high chloride concentrations in groundwater or wastewater discharge were more likely to exceed the recommended chronic criteria.
A multiple linear regression model was used to describe the natural log of the maximum measured chloride at 84 surface-water-monitoring stations that had ancillary data. Significant variables were the density of major roads (roads in the U.S. highway system), potential annual evapotranspira-tion, and the percentage of the annual streamflow derived from saturated overland flow (runoff).
The load of chloride was determined for each of 95 surface-water monitoring stations for the years with data collected from 1991 to 2003. The loads were normalized by drainage area to calculate yields of chloride. The median chloride yield was 88 tons per square mile from the basins dominated by urban land use, 15.4 tons per square mile from agricultural basins, and 6.4 tons per square mile from forested basins. The significant variables to describe chloride yields were highway density, number of major wastewater dis-charges, potential evapotranspiration, and percentage of urban minus agricultural land in each watershed.
Long-term historical data and the literature on this subject suggest that chloride concentrations in streams are currently increasing in urbanized and urbanizing areas, potentially exceeding recommended criteria for aquatic life now or in the coming decades. Increases in chloride load over time gener-ally can be attributed to changes in the application of deicing salt, the expansion of road networks and impervious areas that require deicing, increases in the number of septic systems, increases in the volume of wastewater discharge, and the arrival of saline groundwater plumes from landfills and salt-storage areas over time.
Data from the Quinnipiac River in Connecticut were analyzed to explore the role of different sources of chloride in the overall chloride load. The analysis indicated that in basins with a high volume of wastewater discharge and a moderate to high density of septic systems, at least 31 percent of the chloride load can be derived from these sources. The wet deposition of chloride from precipitation represents less than one percent of the chloride load. The source of the chloride in wastewater and septic-system leachate can include chloride recycled from anthropogenic sources in the public and private water supplies; landfills and storage sites for deicing chemicals represent additional anthropogenic sources. A large part of the remaining load can be attributed to the use of deicing salt on impervious areas.
References Cited
Ahearn, E.A., 2002, Streamflow in the Quinnipiac River Basin, Connecticut—Statistics and trends, 1931–2000: U.S. Geological Survey Water-Resources Investigations Report 02–4217, 42 p.
Aultman-Hall, L., Mahoney, J., and Zinke, S., 2006, Improving winter highway maintenance—Case studies for Connecticut’s consideration: Connecticut Academy of Science and Engineering, Hartford, Connecticut, 44 p.
Briggs, J.C., and Ficke, J.F., 1977, Quality of rivers of the United States, 1975 Water Year—Based on the National Stream Quality Accounting Network (NASQAN): U.S. Geological Survey Open-File Report 78–200, 436 p.
Bubeck, R.C., Diment, W.H., Deck, B.L., Baldwin, A.L., and Lipton, S.D., 1971, Runoff of deicing salt—Effect on Irondequoit Bay, Rochester, New York: Science, v. 172, p. 1128–1132.
CH2M HILL Inc., 2003, Total maximum daily loads for Salt Creek Illinois, Draft Report: Herndon, Virginia, [variously paginated].
Chabaeva, A.A., Civco, D.L., and Prisloe, S., 2004, Development of a population and land use based regression model to calculate the amount of imperviousness, in Proceedings of the annual ASPRS convention, Denver, Colorado, 2004, 9 p., accessed on September 10, 2009 at http://nemo.uconn.edu/tools/impervious_surfaces/pdfs/Chabaeva_etal_2004.pdf.
Church, P.E., Armstrong, D.S., Granato, G.E., Stone, V.J., Smith, K.P., Provencher, P.L., 1996, Effectiveness of highway-drainage systems in preventing contamination of ground water by road salt, Route 25, southeastern Massachusetts; description of study area, data collection programs, and methodology: U.S. Geological Survey Open File Report 96–317, 72 p.
City of Elgin, Illinois, Snow and Ice Control, Web page accessed in 2005 at http://www.cityofelgin.org/index.asp?NID=180.
City of Gurnee, Illinois, Street Division, Web page accessed on March 30, 2009 at http://www.gurnee.il.us/public_works/about.html#streetdivision.
City of Meriden, Connecticut, 2005, 2005 annual water qual-ity report, 2 p., accessed March 30, 2009 at http://www.cityofmeriden.org/forms/customer-files/208-2006Meriden-QualityReportBrochureFinal2.pdf.

References Cited 33
Civco, D.L., Arnold, C.L., Hurd, J.D., 1998, Land use and land cover mapping for the Connecticut and New York portions of the Long Island Sound Watershed: Office of Long Island Sound Programs, Connecticut Department of Environmental Protection, Research Project CWF 330–R Technical Completion Report [unpaginated].
Colombo, M.J., and Trench, E.C.T., 2002, Trends in surface-water quality in Connecticut: U.S. Geological Survey Water-Resources Investigations Report 02–4012, 39 p.
Connecticut Department of Environmental Protection, 1995, Leachate and wastewater discharge inventory: Connecticut Department of Environmental Protection, Environmental and Geographic Information Center, Hartford, Connecticut, Digital Shapefile, 1:50,000, accessed on September 10, 2009 at http://www.ct.gov/dep/cwp/view.asp?A=2698&Q=322898.
Daly, C., Neilson, R.P., and Phillips, D.L., 1994, A statistical-topographic model for mapping climatological precipitation over mountainous terrain: Journal of Applied Meteorology, v. 33, p. 140–158.
Davis, S.N., Whittemore, D.O., Fabryka-Martin, J., 1998, Uses of chloride/bromide ratios in studies of potable water: Ground Water, v. 36, no. 2, p 338–350.
Dunne, T., Black, R.D., 1970, Partial area contributions to storm runoff in a small New England watershed: Water Resources Research, v. 6, no. 5, p. 1296–1311.
ESRI, Inc., 2006, Tele Atlas North America, ESRI data and maps—Streetmap, Redlands California, geospatial data set.
Feth, J.H., 1965, Preliminary map of the conterminous United States showing depth to and quality of shallowest ground water containing more than 1,000 parts per million dis-solved solids: U.S. Geological Survey Hydrologic Atlas 199, 2 sheets.
Feth, J.H., 1981, Chloride in natural continental water—A review: U.S. Geological Survey Water Supply Paper 2176, 30 p.
Fong, A.L., 2000, Water-quality assessment of part of the Upper Mississippi River Basin, Minnesota and Wisconsin—Ground-water quality in three different land-use areas, 1996-98: U.S. Geological Survey Water-Resources Investigations Report 00–4131, 37 p.
Fuss & O’Neill, Inc., 1997, North End Disposal Area, quar-terly operations and water quality monitoring report, Waterbury, Connecticut, August 1997.
Gilliom, R.J., Alley, W.M., and Gurtz, M.E., 1995, Design of the National Water-Quality Assessment Program—Occurrence and distribution of water-quality conditions: U.S. Geological Survey Circular 1112, 33 p.
Grady, S.J., and Mullaney, J.R., 1998, Natural and human factors affecting shallow water quality in surficial aquifers in the Connecticut, Housatonic, and Thames River Basins: U.S. Geological Survey Water-Resources Investigations Report 98–4042, 81 p.
Granato, G.E., Church, P.E., Stone, V.J., 1995, Mobilization of major and trace constituents of highway runoff in ground-water potentially caused by deicing-chemical migration: Washington D.C., Transportation Research Record 1483, Transportation Research Board, National Research Council, p. 92–104.
Granato, G.E., 1996, Deicing chemicals as a source of constit-uents in highway runoff: Washington D.C., Transportation Research Record 1533, Transportation Research Board, National Research Council, p. 50–58.
Hay, L.E., and Campbell, J.P., 1990, Water-quality trends in New Jersey streams: U.S. Geological Survey Water-Resources Investigations Report 90–4046, 297 p.
Heisig, P.M., 2000, Effects of residential and agricultural land use on the chemical quality of baseflow of small streams in the Croton watershed, southeastern New York: U.S. Geological Survey Water-Resources Investigations Report, 99–4173, 15 p.
Helsel, D.R., and Hirsch, R.M., 2002, Statistical meth-ods in water resources: Techniques of Water-Resources Investigations, book 4, chap. A3, 510 p.
Hintz, G., Kettlewell, A., Shambarger, E., Sweeney, T., 2001, Milwaukee’s snow and ice control service, in La Follette Policy Report: Madison, Wisconsin, Robert M. La Follete School of Public Affairs, v. 12, no. 1, p. 16–20, accessed on March 30, 2009 at http://www.lafollette.wisc.edu/publica-tions/policyreports/policyReport12_1.pdf.
Huling, E.E., and Hollocher, T.C., 1972, Groundwater con-tamination by road salt—Steady-state concentrations in east-central Massachusetts: Science, v. 176, p. 288–290.
Indiana Department of Transportation, 2004, Making our high-ways safer, accessed at www.ai.org/indot/files/Safety.pdf.
Insightful Corporation, 2005, S-Plus 7—Statistical applica-tion software: accessed December 15, 2006, at http://www.insightful.com/products/splus/default.asp.
Jagucki, M.L., Darner, R.A., 2001, Ground-water quality in Geauga County, Ohio—Review of previous studies, status in 1999, and comparison of 1986 and 1999 data: U.S. Geological Survey Water-Resources Investigations Report 01–4160, 61 p.
Jones, A.L., and Sroka, B.N., 1997, Effects of highway deic-ing chemicals on shallow unconsolidated aquifers in Ohio, interim report, 1988-93: U.S. Geological Survey Water-Resources Investigations Report 97–4027, 139 p.

34 Chloride in Groundwater and Surface Water in Areas Underlain by the Glacial Aquifer System, Northern United States
Kaushal, S.J., Groffman, P.M., Likens, G.E., Belt, K.T., Stack, W.P., Kelly, V.R., Band, L.E., and Fisher, D.T., 2005, Increased salinization of fresh water in the northeastern United States: Proceedings of the National Academy of Sciences, v. 102, no. 38, p. 13,517–13,520.
Knuth, M., Jackson, J.L., and Whittemore, D.O., 1990, An integrated approach to identifying the salinity source con-taminating a ground-water supply: Ground Water, v. 28, no. 2, p. 207–214.
Kostick, D.S., 1993, The material flow of salt: Bureau of Mines, Information Circular 9343, 32 p.
Kostick, D.S. , Milanovich, J.A., and Coleman, R.R., 2007, 2005 minerals yearbook—Salt: U.S. Geological Survey, March 2007, accessed on September 10, 2009 at http://min-erals.er.usgs.gov/minerals/pubs/commodity/salt/salt_myb05.pdf.
Kuemmel, D.A. and Hanbali, R.M., 1992, Accident analy-sis of ice control operations—Final report, June 1, 1992: Marquette University, Department of Civil and Environmental Engineering, Milwaukee, Wisconsin, 24 p., accessed on September 10, 2009 at www.trc.marquette.edu/publications/IceControl/ice-control-1992.pdf.
Kunze, A.E., and Sroka, B.N., 2004, Effects of deicing chemicals on shallow unconsolidated aquifers in Ohio, final report: U.S. Geological Survey Scientific Investigations Report 2004–5150, 187 p.
Lapham, W.W., Hamilton, P.A., and Myers, D.N., 2005, National water-quality assessment program—Cycle II regional assessments of aquifers: U.S. Geological Survey Fact Sheet 2005–3013, 4 p.
Michigan Department of Environmental Quality, 1994, Salt, a Michigan resource: Lansing, Michigan, Michigan Department of Environmental Quality, 2 p., accessed on September 10, 2009 at www.deq.state.mi.us/documents/deq-ogs-gimdl-GGSB.pdf.
Minnesota Department of Transportation, 2006, Snow and ice fact sheet, winter 2005–2006, Office of Communications, 2 p., accessed at http://www.dot.state.mn.us/workzone/sno-wicefacts.pdf.
Mullaney, J.R., Mondazzi, R.A., and Stone, J.R., 1999, Hydrogeology and water quality of the Nutmeg Valley area, Wolcott and Waterbury, Connecticut: U.S. Geological Survey Water-Resources Investigations Report 99–4081, 90 p., 2 pl.
Mullaney, J.R., Schwarz, G.E., and Trench, E.C.T., 2002, Estimation of nitrogen yields and loads from basins draining to Long Island Sound, 1988-98: U.S. Geological Survey Water-Resources Investigations Report 02–4044, 84 p.
Nakagaki, N., and Wolock, D.M., 2005, Estimation of agricul-tural pesticide use in drainage basins using land cover maps and county pesticide data: U.S. Geological Survey Open-File Report 2005–1188, 46 p.
National Atmospheric Deposition Program (NRSP–3), 2006, NADP Program Office, Illinois State Water Survey, 2204 Griffith Dr., Champaign, Illinois 61820.
Nimiroski, M.T., and Waldron, M.C., 2002, Sources of sodium and chloride in the Scituate Reservoir Drainage Basin, Rhode Island: U.S. Geological Survey Water-Resources Investigations Report 02–4149, 16 p.
Norris, S.E., 1978, Hydrologic environment of the Silurian salt deposits in parts of Michigan, Ohio, and New York: U.S. Geological Survey Open-File Report 78–684, 31 p.
Ostendorf, D.W., Hinlein, E.S., Rotaru, C., and DeGroot, D.J., 2006, Contamination of groundwater by outdoor highway deicing agent storage: Journal of Hydrology, v. 326, p. 109–121.
Panno, S.V., Hackley, K.C., Hwang, H.H., Greenberg, S.E., Krapac, I.G., Landsberger, S., and O’Kelly, D.J., 2006, Characterization and identification of Na-Cl sources in ground water: Ground Water, v. 44, no. 2, p. 176–187.
Peavy, H.S., 1978, Groundwater pollution from septic tank drainfields—A report to the Blue Ribbons of the Big Sky Country Areawide Planning Organization: Bozeman, Montana, Dept. of Civil Engineering and Engineering Mechanics, Montana State University.
Peters, N.E., 1984, Evaluation of environmental factors affect-ing yields of major dissolved ions of streams in the United States: U.S. Geological Survey Water-Supply Paper 2228, 39 p.
Peters, N.E., 1991, Chloride cycling in two forested lake watersheds in the west-central Adirondack mountains, New York, U.S.A.: Water, Air, and Soil Pollution, v. 59, p. 201–215.
Prisloe, M., Wilson, E.H., Arnold, C., 2003, Final report—Refinement of population-calibrated land-cover-specific impervious surface coefficients for Connecticut: Nemo FY02 Workplan, DEP project 01–08, University of Connecticut, Middlesex County Extension Center, 20 p.
Rao, U., Hollocher, K., Sherman, J., Eisele, I., Frunzi, M.N., Swatkoski, S.J., and Hammons, A.L., 2005, The use of 36 Cl and chloride/bromide ratios in discerning salinity sources and fluid mixing patterns—A case study at Saratoga Springs: Chemical Geology, v. 222, p. 94–111.

References Cited 35
Robinson, K.W., Lazaro, T.L., and Pak, C., 1996, Associations between water-quality trends in New Jersey streams and drainage-basin characteristics, 1975–1986: U.S. Geological Survey Water-Resources Investigations Report 96–4119, 148 p.
Rosen, M.R., Lapham, W.W., 2008, Introduction to the U.S. Geological Survey National Water-Quality Assessment (NAWQA) of ground-water quality trends and compari-son to other national programs: Journal of Environmental Quality, v. 37, S–190–S–198.
Runkel, R.L., Crawford, C.G., Cohn, T.A., 2004, Load estima-tor (LOADEST)—A FORTRAN program for estimating constituent loads in streams and rivers: U.S. Geological Survey Techniques and Methods, book 4, chap. A5, 69 p.
Savoca, M.E., Sadorf, E.M., Linhart, S.M., and Akers, K.K.B., 2000, Effects of land use and hydrogeology on the water quality of alluvial aquifers in eastern Iowa and southern Minnesota, 2000: U.S. Geological Survey Water-Resources Investigations Report 99–4246, 38 p.
Smith, R.A., Alexander, R.B., and Wolman, M.G., 1987, Water-quality trends in the Nation’s rivers: Science, v. 235, p. 1607–1615.
Sullivan, D.J., 2000, Nutrients and suspended solids in surface waters of the Upper Illinois River basin in Illinois, Indiana, and Wisconsin, 1978–97: U.S. Geological Survey Water Resources Investigations Report 99–4275, 57 p.
Thomas, M., 2000, The effect of residential development on ground-water quality near Detroit, Michigan: Journal of the American Water Resources Association, v. 36, no. 5, p. 1023–1038.
Transportation Research Board, 1991, Highway deicing—Comparing salt and calcium magnesium acetate: Washington, D.C., Transportation Research Board National Research Council, 1991 Special Report 235, 168 p., accessed August 4, 2006, at http://onlinepubs.trb.org/onlinepubs/sr/sr235/149-158.pdf.
Trench, E.C.T., 1996, Trends in surface-water quality in Connecticut, 1969-88: U.S. Geological Survey Water-Resources Investigations Report 96–4161, 176 p.
U.S. Department of Commerce, 1991, 1990 census of popula-tion and housing, summary population and housing char-acteristics, Connecticut: Washington, D.C., Bureau of the Census, publication 1990/CPH–1–8, 64 p.
U.S. Environmental Protection Agency, 1988, Ambient water quality criteria for chloride—1988: U.S. Environmental Protection Agency Office of Water Regulations and Standards 440/5–88–001, 47 p., accessed December 17, 2007, at http://www.epa.gov/ost/pc/ambientwqc/chlo-ride1988.pdf.
U.S. Environmental Protection Agency, 1992, Secondary drinking water regulations—Guidance for nuisance chemi-cals: EPA 810/K–92–001 accessed June 13, 2006, at http://www.epa.gov/safewater/consumer/2ndstandards.html.
U.S. Environmental Protection Agency, 2004, 2004 edition of the drinking water standards and health advisories: Office of Water, U.S. Environmental Protection Agency, Washington, DC, EPA 822–R–04–005, 12 p., accessed on September 10, 2009 at www.epa.gov/waterscience/criteria/drinking/dwstandards2004.pdf.
U.S. Environmental Protection Agency, 2007, Permit Compliance System database, accessed December 17, 2007, at http://www.epa.gov/waterscience/basins/.
U.S. Geological Survey, 2005a, Active mines and mineral pro-cessing plants in the United States in 2003: U.S. Geological Survey, Web page accessed March 20, 2009, at http://tin.er.usgs.gov/metadata/mineplant.faq.html.
U.S. Geological Survey, 2005b, Salt statistics, in Kelly, T.D., and Matos, G.R., comps., Historical statistics for min-eral and material commodities in the United States: U.S. Geological Survey Data Series 140, accessed January 16, 2006, at http://pubs.usgs.gov/ds/2005/140/.
Vogelmann, J.E., Sohl, T.L., Campbell, P.V., Shaw, D.M., 1998, Regional land cover characterization using LANDSAT thematic mapper data and ancillary data sources: Environmental Monitoring and Assessment, v. 51, p. 415–428.
Warner, K.L., and Arnold, T.L., 2005, Framework for regional synthesis of water-quality data for the glacial aquifer system in the United States: U.S. Geological Survey Scientific Investigations Report 2005–5223, 6 p.
Wenck Associates Inc., 2004, Chloride TMDL report prepared for Shingle Creek Water Management Commission and the Minnesota Pollution Control Agency: City of Maple Plain, Minnesota, [variously paginated.]
Wolock, D.M., 1993, Simulating the variable-source-area concept of streamflow generation with the watershed model TOPMODEL: U.S. Geological Survey Water-Resources Investigations Report 93–4124, 33 p.
Wolock, D.M., 2003, Estimated mean annual natural recharge in the conterminous United States: U.S. Geological Survey Open-File Report 03–311.
Wulkowicz, G.M., and Saleem, Z.A., 1974, Chloride balance of an urban basin in the Chicago area: Water Resources Research, v. 10, no. 5, p. 974–982.


Appendix 1 37
Appendix 1

38 Chloride in Groundwater and Surface Water in Areas Underlain by the Glacial Aquifer System, Northern United StatesA
ppen
dix
1.
Surfa
ce-w
ater
-qua
lity
mon
itorin
g st
atio
ns u
sed
in a
naly
ses
for c
hlor
ide
conc
entra
tion
or lo
ad e
stim
atio
n (o
r bot
h).—
Cont
inue
d
[NF,
Nor
th F
ork;
SF,
Sou
th F
ork;
--, d
ata
not a
vaila
ble]
USG
S id
entifi
erSt
atio
n na
me
Hyd
rolo
gic
unit
code
Cont
rib-
utin
g dr
ain-
age
area
(s
quar
e m
iles)
Dom
inan
t la
nd u
se
Num
ber
of
chlo
ride
sa
mpl
es
1992
–20
04
Long
Te
rm
(pre
- 19
91)
data
av
ail-
able
Max
imum
m
easu
red
chlo
ride
co
ncen
-tr
atio
n (m
illi-
gram
s pe
r lit
er)
Mea
n ch
lori
de
yiel
d fo
r pe
riod
of
sele
cted
da
ta
(tons
per
sq
uare
m
ile)
Num
ber
of m
ajor
pe
rmit-
com
-pl
ianc
e sy
stem
di
s-ch
arg-
ers
0109
5220
Still
wat
er R
iver
nea
r Ste
rling
, MA
0107
0004
31.6
Fore
sted
6968
.429
.10
0110
1500
Ipsw
ich
Riv
er a
t Sou
th M
iddl
eton
, MA
0109
0001
44.5
Urb
an46
98.7
84.8
101
1023
45Sa
ugus
Riv
er a
t Sau
gus I
ron
Wor
ks a
t Sau
gus,
MA
0109
0001
20.8
Urb
an44
197
109.
80
0110
2500
Abe
rjona
Riv
er a
t Win
ches
ter,
MA
0109
0001
24.7
Urb
an12
767
318
2.6
101
1050
00N
epon
set R
iver
at N
orw
ood,
MA
0109
0001
34.7
Urb
an32
149
88.0
001
1090
00W
adin
g R
iver
nea
r Nor
ton,
MA
0109
0004
43.3
Urb
an34
77.6
64.6
201
1353
00Sl
eepe
rs R
iver
(site
W-5
) nea
r St.
John
sbur
y, V
T01
0801
0242
.9A
gric
ultu
ral
349.
76.
30
0113
7500
Am
mon
oosu
c R
iver
at B
ethl
ehem
Junc
tion,
NH
0108
0101
87.6
Fore
sted
348
5.3
001
1701
00G
reen
Riv
er n
ear C
olra
in, M
A01
0802
0341
.4Fo
rest
ed78
157.
30
0118
4490
Bro
ad B
rook
at B
road
Bro
ok, C
T01
0802
0515
.5A
gric
ultu
ral
101
36.9
37.0
001
1845
00Sc
antic
Riv
er a
t Bro
ad B
rook
, CT
0108
0205
98.2
Agr
icul
tura
l21
19--
--01
1880
00B
unne
ll (B
urlin
gton
) Bro
ok n
ear B
urlin
gton
, CT
0108
0207
4.1
Fore
sted
52Ye
s27
25.0
001
1890
00Pe
quab
uck
Riv
er a
t For
estv
ille,
CT
0108
0207
45.8
Urb
an40
7648
.13
0119
2500
Hoc
kanu
m R
iver
nea
r Eas
t Har
tford
, CT
0108
0205
73.4
Urb
an12
912
460
.32
0119
3500
Salm
on R
iver
nea
r Eas
t Ham
pton
, CT
0108
0205
100
Fore
sted
74Ye
s27
.422
.80
0119
6500
Qui
nnip
iac
Riv
er a
t Wal
lingf
ord,
CT
0110
0004
115
Urb
an10
8Ye
s82
.367
.111
0119
9900
Tenm
ile R
iver
at S
outh
Dov
er n
ear W
ingd
ale,
NY
0110
0006
192.
5A
gric
ultu
ral
5435
23.6
001
2088
73R
oost
er R
iver
at F
airfi
eld,
CT
0110
0006
10.6
Urb
an35
140
50.4
001
2089
90Sa
ugat
uck
Riv
er n
ear R
eddi
ng, C
T01
1000
0621
Fore
sted
75Ye
s38
36.2
001
2097
10N
orw
alk
Riv
er a
t Win
nipa
uk, C
T01
1000
0633
Urb
an20
9Ye
s83
.158
.01
0134
9150
Can
ajoh
arie
Cre
ek n
ear C
anaj
ohar
ie, N
Y02
0200
0459
.7A
gric
ultu
ral
136
118
28.4
001
3561
90Li
sha
Kill
nor
thw
est o
f Nis
kayu
na, N
Y02
0200
0415
.6U
rban
9035
310
3.8
001
3612
00C
lave
rack
Cre
ek a
t Cla
vera
ck, N
Y02
0200
0660
.6A
gric
ultu
ral
2430
----
0136
2200
Esop
us C
reek
at A
llabe
n, N
Y02
0200
0663
.7Fo
rest
ed55
14.8
10.5
001
3720
51Fa
ll K
ill a
t Pou
ghke
epsi
e, N
Y02
0200
0818
.8U
rban
2411
078
.80
0137
9500
Pass
aic
Riv
er n
ear C
hath
am, N
J02
0301
0310
0U
rban
31Ye
s21
094
.78

Appendix 1 39A
ppen
dix
1.
Surfa
ce-w
ater
-qua
lity
mon
itorin
g st
atio
ns u
sed
in a
naly
ses
for c
hlor
ide
conc
entra
tion
or lo
ad e
stim
atio
n (o
r bot
h).—
Cont
inue
d
[NF,
Nor
th F
ork;
SF,
Sou
th F
ork;
--, d
ata
not a
vaila
ble]
USG
S id
entifi
erSt
atio
n na
me
Hyd
rolo
gic
unit
code
Cont
rib-
utin
g dr
ain-
age
area
(s
quar
e m
iles)
Dom
inan
t la
nd u
se
Num
ber
of
chlo
ride
sa
mpl
es
1992
–20
04
Long
Te
rm
(pre
- 19
91)
data
av
ail-
able
Max
imum
m
easu
red
chlo
ride
co
ncen
-tr
atio
n (m
illi-
gram
s pe
r lit
er)
Mea
n ch
lori
de
yiel
d fo
r pe
riod
of
sele
cted
da
ta
(tons
per
sq
uare
m
ile)
Num
ber
of m
ajor
pe
rmit-
com
-pl
ianc
e sy
stem
di
s-ch
arg-
ers
0138
0500
Roc
kaw
ay R
iver
abo
ve re
serv
oir a
t Boo
nton
, NJ
0203
0103
116
Fore
sted
31Ye
s12
060
.72
0138
1500
Whi
ppan
y R
iver
at M
orris
tow
n, N
J02
0301
0329
.4U
rban
31Ye
s19
010
6.4
101
3818
00W
hipp
any
Riv
er n
ear P
ine
Bro
ok, N
J02
0301
0368
.5U
rban
5916
516
8.6
701
3905
00Sa
ddle
Riv
er a
t Rid
gew
ood,
NJ
0203
0103
21.6
Urb
an31
197
130.
40
0139
1500
Sadd
le R
iver
at L
odi,
NJ
0203
0103
54.6
Urb
an59
Yes
408
184.
14
0139
4500
Rah
way
Riv
er n
ear S
prin
gfiel
d, N
J02
0301
0425
.5U
rban
59Ye
s1,
320
141.
61
0143
5000
Nev
ersi
nk R
iver
nea
r Cla
ryvi
lle, N
Y02
0401
0466
.6Fo
rest
ed37
517
.66.
00
0144
0000
Flat
Bro
ok n
ear F
latb
rook
ville
, NJ
0204
0104
64Fo
rest
ed49
21.7
20.6
001
4435
00Pa
ulin
s Kill
at B
lairs
tow
n, N
J02
0401
0512
6Fo
rest
ed59
Yes
73.9
61.2
203
2679
00M
ad R
iver
at S
t. Pa
ris P
ike
at E
agle
City
, OH
0508
0001
310
Agr
icul
tura
l97
30.5
19.8
103
3536
37Li
ttle
Buc
k C
reek
nea
r Ind
iana
polis
, IN
0512
0201
17U
rban
205
470
66.9
003
3608
95K
essi
nger
Ditc
h ne
ar M
onro
e C
ity, I
N05
1202
0256
.2A
gric
ultu
ral
5535
21.8
003
3665
00M
usca
tatu
ck R
iver
nea
r Dep
uty,
IN05
1202
0729
3A
gric
ultu
ral
2815
9.9
004
0620
85Pe
shek
ee R
iver
nea
r Mar
tins L
andi
ng, M
I04
0301
0743
.9Fo
rest
ed10
10.
50
0406
3700
Popp
le R
iver
nea
r Fen
ce, W
I04
0301
0813
9Fo
rest
ed12
43.
61.
00
0407
1795
Pens
auke
e R
iver
nea
r Kra
kow,
WI
0403
0103
35.8
Agr
icul
tura
l34
617.
80
0407
2050
Duc
k C
reek
at S
emin
ary
Roa
d ne
ar O
neid
a, W
I04
0301
0395
.5A
gric
ultu
ral
9342
524
.90
0408
0798
Tom
orro
w R
iver
nea
r Nel
sonv
ille,
WI
0403
0202
44A
gric
ultu
ral
326.
63.
5--
0408
5109
East
Riv
er a
t Mid
way
Roa
d ne
ar d
e Pe
re, W
I04
0302
0447
Agr
icul
tura
l26
86--
--04
0863
075
Nor
th B
ranc
h M
ilwau
kee
Riv
er n
ear R
ando
m L
ake,
WI
0404
0003
51.4
Agr
icul
tura
l53
40.7
16.5
--04
0866
00M
ilwau
kee
Riv
er n
ear C
edar
burg
, WI
0404
0003
607
Agr
icul
tura
l80
104
24.2
--04
0869
415
Linc
oln
Cre
ek a
t 47t
h St
reet
at M
ilwau
kee,
WI
0404
0003
9.6
Urb
an18
44,
330
162.
90
0415
9492
Bla
ck R
iver
nea
r Jed
do, M
I04
0900
0146
4A
gric
ultu
ral
2969
.2--
--04
1618
20C
linto
n R
iver
at S
terli
ng H
eigh
ts, M
I04
0900
0330
9U
rban
4330
011
2.1
304
1756
00R
iver
Rai
sin
near
Man
ches
ter,
MI
0410
0002
132
Agr
icul
tura
l30
25.6
17.8
004
1865
00A
ugla
ize
Riv
er n
ear F
ort J
enni
ngs,
OH
0410
0007
332
Agr
icul
tura
l80
251
26.4
3

40 Chloride in Groundwater and Surface Water in Areas Underlain by the Glacial Aquifer System, Northern United StatesA
ppen
dix
1.
Surfa
ce-w
ater
-qua
lity
mon
itorin
g st
atio
ns u
sed
in a
naly
ses
for c
hlor
ide
conc
entra
tion
or lo
ad e
stim
atio
n (o
r bot
h).—
Cont
inue
d
[NF,
Nor
th F
ork;
SF,
Sou
th F
ork;
--, d
ata
not a
vaila
ble]
USG
S id
entifi
erSt
atio
n na
me
Hyd
rolo
gic
unit
code
Cont
rib-
utin
g dr
ain-
age
area
(s
quar
e m
iles)
Dom
inan
t la
nd u
se
Num
ber
of
chlo
ride
sa
mpl
es
1992
–20
04
Long
Te
rm
(pre
- 19
91)
data
av
ail-
able
Max
imum
m
easu
red
chlo
ride
co
ncen
-tr
atio
n (m
illi-
gram
s pe
r lit
er)
Mea
n ch
lori
de
yiel
d fo
r pe
riod
of
sele
cted
da
ta
(tons
per
sq
uare
m
ile)
Num
ber
of m
ajor
pe
rmit-
com
-pl
ianc
e sy
stem
di
s-ch
arge
rs
0503
0150
Otte
r Tai
l Riv
er n
ear P
erha
m, M
N09
0201
0333
5Fo
rest
ed23
51.
80
0505
1300
Boi
s de
Siou
x R
iver
nea
r Dor
an, M
N09
0201
011,
880
Agr
icul
tura
l26
473.
40
0505
3000
Wild
Ric
e R
iver
nea
r Abe
rcro
mbi
e, N
D09
0201
051,
490
Agr
icul
tura
l29
Yes
62.4
2.4
005
0560
00Sh
eyen
ne R
iver
nea
r War
wic
k, N
D09
0202
0376
0A
gric
ultu
ral
35Ye
s26
1.9
005
0587
00Sh
eyen
ne R
iver
at L
isbo
n, N
D09
0202
042,
490
Agr
icul
tura
l45
Yes
482.
80
0506
2500
Wild
Ric
e R
iver
at T
win
Val
ley,
MN
0902
0108
934
Agr
icul
tura
l45
152.
20
0506
6500
Goo
se R
iver
at H
illsb
oro,
ND
0902
0109
1,09
3A
gric
ultu
ral
30Ye
s53
.23.
70
0508
2625
Turtl
e R
iver
at T
urtle
Riv
er S
tate
Par
k ne
ar A
rvill
a, N
D09
0203
0731
1A
gric
ultu
ral
9116
03.
60
0508
5900
Snak
e R
iver
abo
ve A
lvar
ado,
MN
0902
0309
218
Agr
icul
tura
l26
382.
60
0511
2000
Ros
eau
Riv
er b
elow
Sta
te D
itch
51 n
ear C
arib
ou, M
N09
0203
141,
420
Agr
icul
tura
l29
Yes
381.
60
0527
6005
Nor
th F
ork
Cro
w R
iver
abo
ve P
ayne
svill
e, M
N07
0102
0423
2A
gric
ultu
ral
3519
.95.
50
0528
7890
Elm
Cre
ek n
ear C
ham
plin
, MN
0701
0206
86U
rban
103
109
23.2
005
2887
05Sh
ingl
e C
reek
at Q
ueen
Ave
nue
in M
inne
apol
is, M
N07
0102
0628
.2U
rban
115
2,02
015
1.5
005
3202
70Li
ttle
Cob
b R
iver
nea
r Bea
ufor
d, M
N07
0200
1113
0A
gric
ultu
ral
9550
.37.
60
0533
0902
Nin
e M
ile C
reek
nea
r Jam
es C
ircle
at B
loom
ingt
on, M
N07
0200
1244
.6U
rban
5652
252
.60
0533
1833
Nam
ekag
on R
iver
at L
eona
rds,
WI
0703
0002
126
Fore
sted
3216
.43.
30
0542
0680
Wap
sipi
nico
n R
iver
nea
r Trip
oli,
IA07
0801
0234
6A
gric
ultu
ral
7436
.615
.81
0545
1210
Sout
h Fo
rk Io
wa
Riv
er n
orth
east
of N
ew P
rovi
denc
e, IA
0708
0207
224
Agr
icul
tura
l10
041
.613
.30
0546
1390
Floo
d C
reek
nea
r Pow
ersv
ille,
IA07
0802
0212
4A
gric
ultu
ral
3420
.814
.00
0546
4220
Wol
f Cre
ek n
ear D
ysar
t, IA
0708
0205
299
Agr
icul
tura
l56
25.4
16.0
005
5205
00K
anka
kee
Riv
er a
t Mom
ence
, IL
0712
0001
2,29
4A
gric
ultu
ral
72Ye
s84
27.0
805
5255
00Su
gar C
reek
at M
ilfor
d, IL
0712
0002
446
Agr
icul
tura
l75
149
15.0
005
5260
00Ir
oquo
is R
iver
nea
r Che
bans
e, IL
0712
0002
2,09
1A
gric
ultu
ral
3350
.312
.93
0552
7800
Des
Pla
ines
Riv
er a
t Rus
sell,
IL07
1200
0412
3A
gric
ultu
ral
3925
261
.11
0553
1500
Salt
Cre
ek a
t Wes
tern
Spr
ings
, IL
0712
0004
115
Urb
an13
763
530
4.6
905
5320
00A
ddis
on C
reek
at B
ellw
ood,
IL07
1200
0417
.9U
rban
51Ye
s82
922
9.5
1

Appendix 1 41A
ppen
dix
1.
Surfa
ce-w
ater
-qua
lity
mon
itorin
g st
atio
ns u
sed
in a
naly
ses
for c
hlor
ide
conc
entra
tion
or lo
ad e
stim
atio
n (o
r bot
h).—
Cont
inue
d
[NF,
Nor
th F
ork;
SF,
Sou
th F
ork;
--, d
ata
not a
vaila
ble]
USG
S
iden
tifier
Stat
ion
nam
eH
ydro
logi
c un
it co
de
Cont
rib-
utin
g dr
ain-
age
area
(s
quar
e m
iles)
Dom
inan
t la
nd u
se
Num
ber
of
chlo
ride
sa
mpl
es
1992
–20
04
Long
Te
rm
(pre
- 19
91)
data
av
ail-
able
Max
imum
m
easu
red
chlo
ride
co
ncen
-tr
atio
n (m
illi-
gram
s pe
r lit
er)
Mea
n ch
lori
de
yiel
d fo
r pe
riod
of
sele
cted
da
ta
(tons
per
sq
uare
m
ile)
Num
ber
of m
ajor
pe
rmit-
com
-pl
ianc
e sy
stem
di
s-ch
arge
rs
0554
8105
Nip
pers
ink
Cre
ek a
bove
Won
der L
ake,
IL07
1200
0684
.5A
gric
ultu
ral
3817
651
.71
0555
0500
Popl
ar C
reek
at E
lgin
, IL
0712
0006
35.2
Urb
an45
Yes
432
257.
10
0556
7000
Pant
her C
reek
nea
r El P
aso,
IL07
1300
0493
.9A
gric
ultu
ral
2915
023
.40
0556
8800
Indi
an C
reek
nea
r Wyo
min
g, IL
0713
0005
62.7
Agr
icul
tura
l29
5120
.80
0557
2000
Sang
amon
Riv
er a
t Mon
ticel
lo, I
L07
1300
0655
0A
gric
ultu
ral
105
9520
.30
0558
4500
La M
oine
Riv
er a
t Col
mar
, IL
0713
0010
655
Agr
icul
tura
l73
60.1
14.3
106
7955
00Sh
ell C
reek
nea
r Col
umbu
s, N
E10
2002
0129
4A
gric
ultu
ral
249.
71.
60
0680
0000
Map
le C
reek
nea
r Nic
kers
on, N
E10
2200
0336
8A
gric
ultu
ral
200
58.3
2.9
012
0565
00N
F Sk
okom
ish
Riv
er b
elow
Sta
ircas
e R
apid
s nea
r Hoo
dspo
rt, W
A17
1100
1757
.2Fo
rest
ed63
1.4
6.8
012
1033
80G
reen
Riv
er a
bove
Tw
in C
amp
Cre
ek n
ear L
este
r, W
A17
1100
1316
.5Fo
rest
ed24
1.2
3.6
012
1126
00B
ig S
oos C
reek
abo
ve H
atch
ery
near
Aub
urn,
WA
1711
0013
66.7
Urb
an36
4.9
7.7
012
1133
75Sp
ringb
rook
Cre
ek a
t Tuk
wila
, WA
1711
0013
19U
rban
3753
.922
.50
1212
8000
Thor
nton
Cre
ek n
ear S
eattl
e, W
A17
1100
1212
.1U
rban
9827
5.1
015
2416
00N
inilc
hik
Riv
er a
t Nin
ilchi
k, A
K19
0203
0113
5Fo
rest
ed36
4.3
1.9
--15
2661
10K
enai
Riv
er b
elow
Ski
lak
Lake
Out
let n
ear S
terli
ng A
K19
0203
021,
206
Fore
sted
360.
13.
0--
1527
4000
SF C
ampb
ell C
reek
nea
r Anc
hora
ge, A
K19
0204
0129
.2Fo
rest
ed38
0.7
0.5
--15
2751
00C
hest
er C
reek
at A
rctic
Bou
leva
rd a
t Anc
hora
ge, A
K19
0204
0127
.4U
rban
4294
.215
.1--
3917
3208
5414
401
Clif
ty C
reek
at C
ount
y R
oad
1150
E n
ear H
arts
ville
, IN
0512
0206
87.9
Agr
icul
tura
l33
3023
.40
3933
0608
6585
201
Big
Wal
nut C
reek
at C
ount
y R
oad
700
W a
t Ree
lsvi
lle, I
N05
1202
0331
8A
gric
ultu
ral
3140
22.0
139
4340
0855
2460
1Su
gar C
reek
at C
ount
y R
oad
400
S at
New
Pal
estin
e, IN
0512
0204
92.6
Agr
icul
tura
l24
610
026
.20
3953
5508
4173
600
Still
wat
er R
iver
on
Mar
tinda
le R
oad
near
Uni
on, O
H05
0800
0164
6A
gric
ultu
ral
3066
.220
.61
3954
5708
4095
100
Gre
at M
iam
i Riv
er n
ear V
anda
lia, O
H05
0800
011,
142
Agr
icul
tura
l30
84.1
----


Prepared by the Pembroke Publishing Service Center.
For more information concerning this report, contact:
DirectorU.S. Geological SurveyConnecticut Water Science Center101 Pitkin StreetEast Hartford, CT [email protected]
or visit our Web site at:http://ct.water.usgs.gov

Mullaney and others—
Chloride in Groundwater and Surface W
ater in Areas Underlain by the Glacial Aquifer System, N
orthern United States—Scientific Investigations Report 2009–5086
Printed on recycled paper
EXPLANATION
Glacial aquifer system
Science Center DirectorUSGS Connecticut Water Science Center101 Pitkin StreetEast Hartford, CT 06108http://ct.water.usgs.gov