chinese direct investment in california -...
TRANSCRIPT
CHINESE DIRECT INVESTMENT IN CALIFORNIA
BY DANIEL H. ROSEN AND THILO HANEMANN
SPECIAL REPORT
CHINESE DIRECT INVESTMENT IN
CALIFORNIA
BY DANIEL H. ROSEN AND THILO HANEMANN
October 2012
SPECIAL REPORT
AsiaSociety.org/ChinaCAInvestment

© 2012 The Asia Society. All rights reserved.
To download an electronic version of this report, please visit www.asiasociety.org/centers/northern-california.
Asia Society Northern California500 Washington Street, Suite 350
San Francisco, CA 94111Phone: 415-421-8707
Fax: 415-421-2465Email: [email protected]
www.asiasociety.org/centers/northern-california
Partner Organizations
Asia Society Northern CaliforniaJohn S. Wadsworth, Co-Chairman
N. Bruce Pickering, Vice President, Global Programs; Executive Director
Asia Society Southern CaliforniaTh omas E. McLain, Chairman
John Windler, Executive Director
Center on U.S.-China Relations, Asia SocietyOrville Schell, Arthur Ross Director
About the AuthorsDaniel H. Rosen is co-founder and China Practice Leader of Rhodium Group, a private research fi rm that
advises both the public and private sectors. Mr. Rosen is a Visiting Fellow at the Peterson Institute for International
Economics in Washington, D.C., with which he has been affi liated since 1993, and an Adjunct Associate Professor
teaching graduate courses at Columbia University’s School of International and Public Aff airs since 2001. From 2000
to 2001, he was Senior Advisor for International Economic Policy to the White House National Economic Council
and National Security Council, where he played a key role in completing China’s accession to the World Trade
Organization. Mr. Rosen is a Member of the Council on Foreign Relations and serves on the Board of the National
Committee on U.S.–China Relations.
Th ilo Hanemann is Research Director at Rhodium Group. His research focuses on China’s macroeconomic
development and the implications for global trade and investment fl ows. Mr. Hanemann works with the private and
public sectors in assessing China’s role in global cross-border investment transactions. He is a frequent speaker and
commentator on China’s outward investment and has published numerous articles on the topic. He co-authored
Rhodium Group’s reports on Chinese investment in the United States (An American Open Door? Maximizing the Benefi ts of Chinese Foreign Direct Investment, 2011) and Europe (China Invests in Europe: Patterns, Impacts and Policy Implications, 2012). A major study (with Mr. Rosen) on the global policy implications of the rise in China’s
global investment is scheduled for release in spring 2013 from the Peterson Institute for International Economics in
Washington, D.C.
Rhodium Group combines policy experience, quantitative economic tools, and on-the-ground research to
analyze disruptive global trends. Its work supports the investment management, strategic planning, and policy needs
of the fi nancial, corporate, government, and not-for-profi t sectors. Rhodium Group is based in New York City, with
associates in Washington, D.C., Shanghai, and New Delhi (http://www.rhgroup.net).
Th e China Investment Monitor is an interactive online tool developed by Rhodium Group that allows users
to track Chinese direct investment transactions in the United States by state and industry. It is updated on a quarterly
basis, along with public notes discussing the most important deals and policy trends (http://rhgroup.net/interactive/
china-investment-monitor).

Contents
6
Contents
Foreword. . . . . . . . . . . . . . . . . . . . . . . . . . . . . . . . . . . . . . . . . . . . . . . . . . . . .
Authors’ Acknowledgments. . . . . . . . . . . . . . . . . . . . . . . . . . . . . . . . . . . . . . . .
Executive Summary . . . . . . . . . . . . . . . . . . . . . . . . . . . . . . . . . . . . . . . . . . . . .
Introduction: California and China, a Long Time Coming . . . . . . . . . . . . . . . . . . .
I. A Chinese Investment Boom in the United States . . . . . . . . . . . . . . . . . . . . . .
II. The Benefi ts of Chinese Investment . . . . . . . . . . . . . . . . . . . . . . . . . . . . . . . .
III. Patterns of Chinese Investment in California . . . . . . . . . . . . . . . . . . . . . . . . .
IV. Drivers and Targeted Industries . . . . . . . . . . . . . . . . . . . . . . . . . . . . . . . . . .
V. Investors and Entry Modes . . . . . . . . . . . . . . . . . . . . . . . . . . . . . . . . . . . . . .
VI. The Potential for Future Growth . . . . . . . . . . . . . . . . . . . . . . . . . . . . . . . . . .
Conclusions: Working Together to Maximize Benefi ts . . . . . . . . . . . . . . . . . . . . . .
References . . . . . . . . . . . . . . . . . . . . . . . . . . . . . . . . . . . . . . . . . . . . . . . . . . .
Appendix: FDI Defi nitions and Data Sources . . . . . . . . . . . . . . . . . . . . . . . . . . . .
6
9
11
14
17
22
26
32
42
47
55
63
69
6 | CHINESE DIRECT INVESTMENT IN CALIFORNIA
A s we proceed into the second decade of the twenty-fi rst century, the web of global relationships
that connects the major nations of the world is undergoing a series of high-speed, tectonic
changes. One of the most signifi cant of these changes is the way in which fl ows of foreign direct
investment (FDI) now move around the world.
During the last century, most fl ows of global investment capital moved back and forth between the
so-called developed nations of the Western world. With the largest, most open, and most dynamic
economy, the United States has long been such an alluring destination for FDI that Americans hardly
even needed to think about soliciting it.
But toward the end of the last century, Western countries also began to step up investments in “emerg-
ing markets”—that is, in the economies of countries once referred to, somewhat dismissively, as the
“third world” or the “developing world.”
Now, however, as we head into the second decade of the twenty-fi rst century, the United States and
the global economy fi nd themselves on the precipice of yet another great and unanticipated change
in global capital fl ows: funds moving from the developing to the developed world. In other words,
increasing amounts of FDI are beginning to fl ow abroad from nations such as China and India. China
has vastly ramped up its outward FDI in recent years, and in 2010, it even made the top 10 list of
global investors.
In 2011, the United States was still the largest global recipient of FDI, with almost $230 billion in
infl ows. But the source of those fl ows is increasingly coming from countries such as China. While still
relatively small—China invested only around $5 billion in the United States in 2010 and 2011—the
aggregate amount of FDI fl owing out of China nonetheless represents an average annual growth rate
of 130% since 2007.
Indeed, our recent report, An American Open Door? Maximizing the Benefi ts of Chinese Foreign Direct
Investment (published in 2011 by the Asia Society Center on U.S.–China Relations and the Kissinger
Institute on China at the Woodrow Wilson International Center for Scholars) estimated that by 2020,
some $1 trillion to $2 trillion of new investment capital will have fl owed out of China. In other words,
the river of investment that once ran almost exclusively from West to East is now beginning to fl ow
in the other direction as well, from East to West.
Foreword
FOREWORD | 7
Th is new reality raises a host of critical questions for the United States:
• Is this the “next big thing” in global capital fl ows? Where will all of this new FDI end up?
• How will the changing FDI landscape aff ect American interests?
• Is the United States prepared to maximize its share of this important new source of FDI stock?
• What are the current obstructions preventing the United States from doing so, and how can
those obstructions be overcome?
• What new strategies should both the federal government and U.S. states and cities adopt to
capitalize on this new trend?
Th e most notable conclusion that emerged from An American Open Door? was that American policy
makers, businesspeople, and members of the public were grievously uniformed about this looming
new reality. Th ree other realities seem inescapable:
• Th e historic change in fl ows of FDI from China will aff ect America in a profound way.
• It is emphatically in the U.S. national interest to gain a larger share of these new investment
fl ows.
• It is dangerous to assume that because of the historic openness of the U.S. economy and the de-
sirability of the U.S. investment climate that Chinese capital will automatically fi nd its way here
without any new eff orts to woo or facilitate it.
So, how does California fi t into this changing global picture?
As a follow-up to our last report, which looked generally at FDI fl ows from China to the United
States, we thought that it would make sense to look at the question through the lens of a specifi c
geographic region. Because California is not only the largest and arguably most iconic state in the
United States, but also a dynamic and varied economy with a historical relationship with China, we
thought that it was an obvious and logical choice. Again we chose to work with Daniel H. Rosen
and Th ilo Hanemann of Rhodium Group to help us illuminate the actual state of past fl ows of direct
investment into California and to suggest what future fl ows can be anticipated. Th e report also recom-
mends how the state might interface more eff ectively with Chinese state-owned and private investors
to encourage further investment.
Toward that end, the Asia Society is pleased to off er this study. We do so in the hope that this eff ort
will be of some utility to the state of California as it goes about the process of encouraging more
Chinese investment.
We are also pleased to be working with California Governor Jerry Brown and other state offi cials in
the belief that the state’s economy can be invigorated by increased FDI from China and that, if we are
successful, something of a model for other states can be created as well.
8 | CHINESE DIRECT INVESTMENT IN CALIFORNIA
Finally, it is worth noting that although eff orts to encourage mutually constructive kinds of Chinese
investment in California will most certainly help forge closer relations between the state and China,
we are also hopeful that in some modest way, they also will help cement better relations between
the United States and China. For, as fraught as this bilateral relationship can be, because so many
global problems cannot be remedied without joint Sino–U.S. action, it has become an inescapably
important one.
Orville Schell
Arthur Ross Director
Asia Society Center on U.S.–China Relations
New York City
Jack Wadsworth
Vice-Chairman, Asia Society
Co-Chairman, Asia Society Northern California Center
San Francisco
N. Bruce Pickering
Vice President, Global Programs; Executive Director
Asia Society Northern California Center
San Francisco
Th omas E. McLain
Chairman
Asia Society Southern California Center
Los Angeles
John Windler
Executive Director
Asia Society Southern California Center
Los Angeles
W e are grateful to many people for their contributions to and support for this study. As with
last year’s An American Open Door? report, Asia Society has been the strongest and most
creative partner in this undertaking. We would like to thank the principals at Asia Society for their
support and encouragement, including Orville Schell at the Center on U.S.–China Relations, Bruce
Pickering at the Asia Society Northern California Center, and Th omas McLain and John Windler at
the Asia Society Southern California Center. Robert Bullock, Robert W. Hsu, Wendy Soone-Broder,
Kate Ryge, Maria Scarzella-Th orpe, and other Asia Society staff provided useful feedback and worked
hard behind the scenes to minimize the administrative burden and maximize the impact of our
research. Th e Asia Society arranged considerable corporate sponsorship, and we want to add our
appreciation to the fi rms they invited to contribute: Silicon Valley Bank, Wells Fargo, University of
Southern California’s Marshall School of Business, and Citibank. Our particular thanks are due to
Jack Wadsworth, who, in addition to his leadership as Vice-Chairman of the Asia Society and a key
supporter of this research, shared his experience, contacts, and wisdom from 49 years (and counting)
in fi nance and investment.
Th e participants in three study groups in San Francisco (June 19, 2012), Sacramento (June 20), and
Los Angeles (June 21) provided useful reactions and comments on early drafts of the report. We
benefi ted greatly from discussions with a wide range of individuals at institutions in the United States
and China, including SelectUSA, the U.S. Bureau of Economic Analysis, the Offi ce of the Governor
of California, GO-Biz, the California Chamber of Commerce, the Bay Area Council, ChinaSF, the
Los Angeles County Economic Development Corporation, Columbia University, Stanford University,
the University of Southern California, the University of California, Berkeley, Davis, and Los Angeles,
China’s Ministry of Commerce, the Export-Import Bank of China, China Development Bank, China
Investment Corporation, the State Administration of Foreign Exchange, and the bureau of research of
China’s State-Owned Assets Supervision and Administration Commission.
We owe a debt of gratitude to a number of fellow economists at the Peterson Institute for International
Economics who have worked on the larger topic of foreign direct investment in the past. Important
among them are Ted Moran, Monty Graham (1944–2007), and Ted Truman. Jacob Kirkegaard
provided critical feedback on our work and greatly helped inform our understanding of global
capital fl ows.
Finally, special thanks go to our colleagues at Rhodium Group in New York City for their superb re-
search support and critical comments. Adam Lysenko in particular was critical to our data assessment
Authors’ Acknowledgments
10 | CHINESE DIRECT INVESTMENT IN CALIFORNIA
and chart work. Shashank Mohan helped optimize our search algorithms and quantitative analysis.
Michelle McKeehan managed the editorial process with enthusiasm and responsibility. While all of
these people improved the outcome, imperfections surely remain, which are solely the responsibility
of the authors.
Daniel H. Rosen, Th ilo Hanemann
New York, October 2012
EXECUTIVE SUMMARY | 11
T he era of signifi cant growth in outward foreign direct investment (OFDI) from China to ad-
vanced market economies has begun. Just as Chinese exports exploded in the last decade—from
$250 billion in 2000 to nearly $2 trillion by 2011—China’s OFDI is poised to skyrocket in the years
ahead. We expect China’s cumulative outward FDI to grow to between $1 trillion and $2 trillion by
2020. Given the evolving set of motives for Chinese investors, the United States and other developed
economies can expect to receive a substantial share of these fl ows.
California, with its long history with China, the most sizable Chinese American population in the
country, and more inward investment deals from China than any other state, is in a position to
lead the nation in attracting Chinese investment in the decade to come. Th e Golden State has the
potential to attract between $10 billion and $60 billion of Chinese direct investment by 2020. Th ose
fl ows would bolster employment, feed the tax base, generate exports, and bring positive spillovers of
know-how and relationships.
However, these benefi ts are not foreordained. Competitors for these dollars are ramping up eff orts to
attract Chinese fi rms, and they could well out-compete California if the state fails to resolve its fi scal
and political problems, provide attractive terms to Chinese fi rms, and demonstrate its readiness to
stand up for Chinese investors and address OFDI impediments at the national level. To build the case
for a robust response to these opportunities and looming risks, this report analyzes Chinese invest-
ment in California in depth, mining a unique database for insights about California’s comparative
advantages, the Chinese fi rms most suited to its economy, and the forces motivating this infl ection in
cross-border investment patterns. We explain where China is as an outbound investor relative to its
past, its future, and other countries and assess California’s position as a destination for Chinese OFDI
fl ows compared to its sister states.
Th e report argues that maximizing California’s success as a host for Chinese investors must start with
better coordination among interested stakeholders, including government, business, and civil society.
Just as it was state-level action, not federal horse-trading, that determined who benefi ted most from
nearly $300 billion in Japanese FDI in America since the early 1980s, the contest to host China’s
fi rms will play out in the 50 state capitals. No single politician, government agency, or chamber of
commerce can deliver success; attractiveness is truly a function of coordination across all of these
actors, and many more.
Executive Summary
EXECUTIVE SUMMARY | 11
12 | CHINESE DIRECT INVESTMENT IN CALIFORNIA
In fact, the race has already begun, and because the United States is no longer the world’s champion
of consumption growth, the competition does not stop at the nation’s borders—it extends to Canada,
South America, Europe, and every other country that is eager for the benefi ts of FDI. Building on
this call to action, the study suggests four initial steps in a long-term strategy to establish California
as the top choice in America for Chinese OFDI dollars:
1. Understand California’s value and China’s needs. Amid tough competition for Chinese capital,
a thorough understanding of Chinese motives and what California has to off er is the cornerstone of
a strategy to promote Chinese investment. Chinese fi rms are considering a U.S. presence for various
reasons, and California sets itself apart with distinct value propositions. Our analysis of more than
500 U.S. deals highlights several strengths of California that should be emphasized: It has the largest
state market in the country, which off ers Chinese fi rms a gateway to the rest of the U.S. marketplace;
it is the national leader in many of the high-technology industries that Chinese fi rms wish to invest
in; it is a global leader in higher-value-added service sector activity, one of the weaknesses of Chinese
fi rms; it has an experienced, creative, and multicultural pool of workers, which can help Chinese fi rms
enrich their homogenous and inexperienced staff ; and it has an international reputation for its quality
of life, which is attractive to both Chinese fi rms and individuals. Understanding these strengths is
vital to developing a relationship with Chinese investors.
2. Target the right Chinese fi rms. China is a nation of almost 5 million businesses, but not all of
these potential investors will be interested in California or serve the state’s long-term objectives. Th e
numbers presented in this study provide a starting point for segmenting and prioritizing prospects.
First, our data set highlights that California is the place to go for China’s private fi rms. Th e bas-
tions of Chinese entrepreneurialism, such as Shanghai, Zhejiang, and Guangdong, should therefore
be a geographic focus of outreach activities. Chinese investors are clearly favoring certain sectors
in California—for example, information technology, renewable energy, hospitality, and electronic
equipment. In each of these sectors, state investment offi cials should be capitalizing on past successes
to make the case to the next generation of Chinese outbound investors: nothing motivates like the
knowledge that your competitor is already doing something. In addition to such an approach based
on past patterns, China’s large investors, including sovereign wealth funds and industrial conglomer-
ates, are an important potential source of capital. State leaders should systematically open lines of
communication to these investment giants regardless of sector, reaching out to China’s 100 largest
fi rms and institutional investors.
3. Overhaul the institutional setup for investment promotion. California (and the United States
as a whole) needs institutional change in its investment promotion eff orts. Th e traditional hands-off
approach is outdated, as offi cials from the President to local mayors have acknowledged. Th e United
States is no longer unrivaled as a destination for FDI, and a new generation of Chinese investors
looking abroad needs local partners and facilitators. Chinese investors are less familiar with Western
culture and business practices, they are rooted in a diff erent regulatory environment, and they have
relatively little experience operating abroad. Active investment promotion can also help overcome
negative preconceptions of the U.S. investment environment stemming from a handful of past deals
EXECUTIVE SUMMARY | 13
gone sour. As a fi rst step, we recommend creating a state-level agency with a mandate to lead and
coordinate local eff orts to promote Chinese investment. Th e establishment of physical presence in
China would be another element of such an overhaul, probably starting with Beijing, Shanghai and
Guangzhou. Th e integration of relevant stakeholders is another key component, for example, through
an advisory board of Chinese and other foreign fi rms already present in California, or regular confer-
ences to improve the business environment for foreign fi rms.
4. Take a proactive stance on national anxieties. Growth in China’s U.S. direct investment has
rekindled old arguments about foreign fi rms and the national interest. Narrowly defi ned security
screenings for foreign investments are imperative, and Chinese investment raises legitimate concerns
because of a range of general and special considerations. However, security concerns can be misap-
plied in situations that present no real threat because of simple overreaction or—more worrying—as
a back-door route to stifl e competition. California, with the largest numbers of deals and a more
high-tech economy than most American states, will suff er disproportionately if infl ows are rejected
arbitrarily. Rather than wait to see whether Washington strikes the right balance between caution and
commerce, California should step forward and contribute to the solution. With fi rms in computing,
telecommunications, energy, agriculture, and other sectors at the forefront of the security debate, and
a disproportionate number of the deals that have been politicized over the past decade, California has
ample experience from which to derive a model for avoiding politicization. In the signature case of
OFDI politicization to date, China National Off shore Oil Corporation’s bid for Unocal, California
politicians in fact played the opposite role, actively rousing national anxiety. Taking a positive stance
on the issue today would go a long way toward improving the state’s reputation and would be in
California’s long-term interest.
Th e fi ndings and recommendations presented in this report are intended to contribute to a better
understanding of growing Chinese investment in California and help inform the policy debate on
how to maximize the state’s benefi ts from this new trend. While the recent growth is impressive,
many chapters in the story of Chinese overseas investment have yet to be written. Securing the proper
policy response is crucial, given the potential for future fl ows from China and from a range of other
emerging economies that will follow the “south-north” trail that Chinese fi rms blaze.
14 | CHINESE DIRECT INVESTMENT IN CALIFORNIA
C alifornia was built in no small part by foreign investment. Before there was statehood, before
the California Republic, foreign traders and trading ports, natural resource prospectors, and
fi nanciers all made their mark on the Golden State’s economy. When gold was discovered on the
American River in 1848, a promising infl ux of foreign infl ows turned into a rush, and immigration
and direct investment boomed. In the years ahead, “California investment societies” proliferated in
faraway France; the Franco-British Rothschild merchant banking giants opened offi ces to fi nance
prospecting; English breweries built large-scale operations and bought into existing businesses;
Sweden’s Nobel family established the Giant Powder Company to manufacture high explosives in
San Francisco; Hamburg’s J. C. Godeff roy set up rep offi ces; and thousands of other concerns and
individuals staked their capital on California’s future. All became ’49ers. After California entered
the Union in 1850, the boom continued, and it was sustained through the decades by the bountiful
allure of the state’s resources, geography, rapid population growth, and unrivaled gifts for creativity
and technological innovation.
California was no stranger to foreign direct investment (FDI), nor to China. While China’s fabled
tea played an infamous role in the American Revolution and silks and porcelain were common cargo
on Boston’s clipper ships, eighteenth-century Americans generally had little exposure to the Middle
Kingdom. In contrast, more than 75,000 Chinese arrived in California between 1850 and 1880,
with the same dreams of economic opportunity that lured sojourners from so many other nations.
By 1880, around 9% of California’s population hailed from China, the largest proportion in the
Western world.1 Th e Chinese presence on the Pacifi c Coast was large enough to trigger a darker side
of Sino-American interaction—an era of injustice defi ned by Chinese exclusion legislation, anti-Asian
violence, and unequal treatment.
Despite California’s extensive history with both FDI and China, there was little, if any, FDI from
China at the start. Chinese arrived as laborers, not investors. But, as elsewhere on the trail of the
Chinese diaspora, hard work and an instinct for commerce built strong communities and brought
prosperity. Images of railroad work gangs and collectives of Chinese gold panners banding together to
resist abuse and images of thriving merchants involved in skilled crafts and trading carried equal truth.
Despite extensive immigration from China in the nineteenth century, FDI did not follow to
California—or the United States more broadly. In the next hundred years, investment from England
Introduction: California and China, a Long Time Coming
1 Historical data from the U.S. Census Bureau.
and continental Europe, then Japan, Latin America, and elsewhere took off ; little investment came
from China, for a few reasons. First, at the onset of its relationship with California, China was on
the verge of collapse. From the British-provoked Opium Wars, through the Taiping internal revolt
of the 1850s and 1860s, to the collapse of the Qing dynasty in 1911, which led fi rst to civil war
among warlords and then pitted Nationalists against Communists, China’s fi rms could barely survive
at home, let alone sustain a presence abroad. When unity came, it was under a socialist, Soviet-bloc
banner, and fi rms (even if they had the wherewithal to operate in the exotic antipodes of America,
which they did not) would shun interactions with capitalism for another 30 years. While fi rms from
Mao’s China were systematically dissolved and withdrawn after 1949, “Chinese” fi rms from the other
Chinas—Taiwan, Hong Kong, and enclaves of overseas Chinese operation such as Singapore—thrived
in California, building up the global production chains, innovation partnerships, and cross-border
investment links that would change Asia and the world.
China’s absence from the FDI ranks persisted long after it shed its aversion to engagement with the
market-oriented Western world. After 30 years of reform-driven boom, China has now reached the
threshold of investing directly in the mature marketplace of the United States.2 In recent years, the
nation’s fi rms have taken the fi rst signifi cant steps through that door, with more than 500 investments
worth $16.4 billion deployed in America from 2000 to 2011. California is at the forefront of this
burgeoning of Chinese investment in the United States, attracting more Chinese fi rms than any
other state. Th e benefi ts of that infl ow are beyond bragging rights: an infusion of investment capital,
jobs, and wages; increased trade and exports, including back to China; better positioning in global
production chains; additional research and development (R&D) spending; and growth in the tax
base. Foreign investment benefi ts consumers and improves the overall quality of competition in the
marketplace. And China’s bet on California can supply the confi dence needed to accelerate crucial
investments in state infrastructure and other public goods.
But the potential benefi ts are not guaranteed. Mobilizing diverse state interest groups will require
political leadership. Beyond California, there are national-level anxieties about China in Congress
and the White House, and an inclination to hold investment access back for negotiating leverage.
While such horse-trading has no basis in United States law, the political impulse to haggle is natural,
and will unavoidably enter the picture given the mix of real and illusory national security concerns
arising from Chinese deal making. If California is to maximize the benefi ts of inbound Chinese FDI,
it must do more than local housekeeping: the Golden State must lead the United States forward on
this new front in the global economy.
In this report, the evidence on Chinese investment in California and worldwide is analyzed and
pulled together into a toolbox. Section 1 lays out the national picture for Chinese investment in the
United States and provides the comparative and historical context. In Section 2, we summarize the
benefi ts from Chinese investment to illustrate the opportunities arising from this new trend. Section
3 off ers the most in-depth analysis to date of the detailed patterns and trends in Chinese mergers and
2 See Rosen and Hanemann (2011)
INTRODUCTION: CALIFORNIA AND CHINA, A LONG TIME COMING | 15
16 | CHINESE DIRECT INVESTMENT IN CALIFORNIA
acquisitions (M&A) and greenfi eld investments in California, helping clarify areas of promise and
potential. In Section 4, we turn to the drivers and prerequisites for Chinese fi rms making the trek
to distant shores, with a detailed sector-by-sector analysis of Chinese investment in California. We
continue the focus on current and potential investors in Section 5, with a careful assessment of the
ownership structure, entry modes, and other deal-specifi c details of the fi rms arriving in California
with checkbooks ready. Section 6 discusses the long-term dimensions of Chinese investment fl ows
and outlines California’s advantages in attracting a signifi cant share of these fl ows. In the conclu-
sion, we summarize the key fi ndings and off er our recommendations on how to position the state of
California to maximize the benefi ts from the beginning Chinese investment boom.

EXECUTIVE SUMMARY | 17
C hina’s outward foreign direct investment (OFDI) has grown quickly over the past decade,
from an annual average of less than $3 billion before 2005 to $20 billion in 2006 and to
more than $50 billion in 2008. By 2010 and 2011, China’s annual OFDI topped $60 billion, despite
declining levels of global FDI, making China one of the world’s top 10 exporters of direct investment
in the post-fi nancial-crisis years (Figure 1). At year-end 2011, China’s global OFDI stock reached
$365 billion. Initially, the major recipients of this boom in investment were developing countries and
just a handful of resource-rich advanced economies, including Australia and Canada. For the most
part, forays to invest in developed economies were few and far between.
Figure 1: China’s Outward FDI versus Global FDI FlowsBillions of U.S. dollars, three-year average
Sources: Ministry of Commerce and State Administration of Foreign Exchange, People’s Republic of China; United Nations Conference on Trade and Development; Rhodium Group.
Now, the story has changed. Since 2008, Chinese direct investments in the United States and other
developed economies have taken off . While offi cial statistics have not yet caught up in refl ecting
these new trends, a bottom-up analysis of greenfi eld and acquisition projects shows that Chinese
I. A Chinese Investment Boom in the United States
0
15
30
45
60
0
200
400
600
800
1,000
1,200
1,400
1,600
1,800
2,000
19
82
1
98
3
19
84
1
98
5
19
86
1
98
7
19
88
1
98
9
19
90
1
99
1
19
92
1
99
3
19
94
1
99
5
19
96
1
99
7
19
98
1
99
9
20
00
2
00
1
20
02
2
00
3
20
04
2
00
5
20
06
2
00
7
20
08
2
00
9
20
10
2
011
Chinese Outward FDI Flows (RHS)
Global Outward FDI Flows (LHS)
EXECUTIVE SUMMARY | 17
18 | CHINESE DIRECT INVESTMENT IN CALIFORNIA
direct investment in the United States has accelerated sharply over the past four years, from a low
base. An alternative data set based on such a bottom-up assessment was released in the 2011 report
An American Open Door? and since then, Chinese OFDI in the United States based on this alternative
methodology has been tracked through Rhodium Group’s China Investment Monitor.3
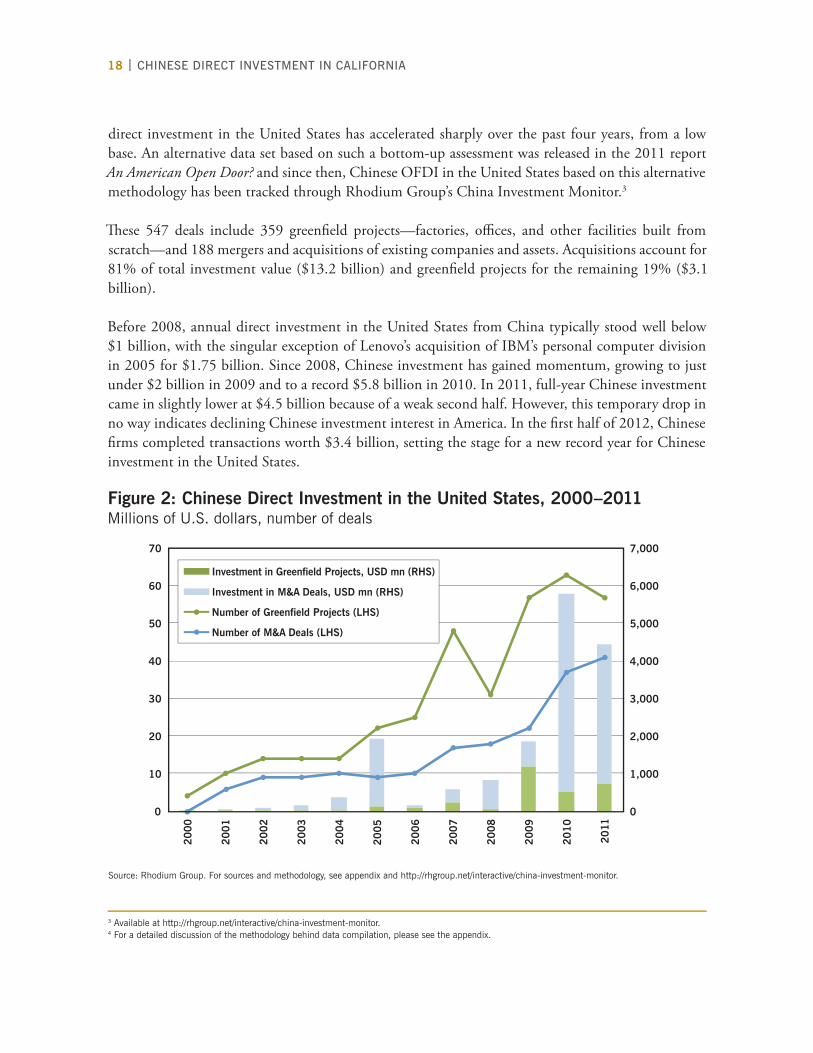
Th ese 547 deals include 359 greenfi eld projects—factories, offi ces, and other facilities built from
scratch—and 188 mergers and acquisitions of existing companies and assets. Acquisitions account for
81% of total investment value ($13.2 billion) and greenfi eld projects for the remaining 19% ($3.1
billion).
Before 2008, annual direct investment in the United States from China typically stood well below
$1 billion, with the singular exception of Lenovo’s acquisition of IBM’s personal computer division
in 2005 for $1.75 billion. Since 2008, Chinese investment has gained momentum, growing to just
under $2 billion in 2009 and to a record $5.8 billion in 2010. In 2011, full-year Chinese investment
came in slightly lower at $4.5 billion because of a weak second half. However, this temporary drop in
no way indicates declining Chinese investment interest in America. In the fi rst half of 2012, Chinese
fi rms completed transactions worth $3.4 billion, setting the stage for a new record year for Chinese
investment in the United States.
Figure 2: Chinese Direct Investment in the United States, 2000–2011Millions of U.S. dollars, number of deals
Source: Rhodium Group. For sources and methodology, see appendix and http://rhgroup.net/interactive/china-investment-monitor.
3 Available at http://rhgroup.net/interactive/china-investment-monitor.4 For a detailed discussion of the methodology behind data compilation, please see the appendix.
0
10
20
30
40
50
60
70
Investment in M&A Deals, USD mn (RHS)
Investment in Greenfield Projects, USD mn (RHS)
Number of Greenfield Projects (LHS)
Number of M&A Deals (LHS)
0
1,000
2,000
3,000
4,000
5,000
6,000
7,000
20
00
20
01
20
02
20
03
20
04
20
05
20
06
20
07
20
08
20
09
20
10
20
11
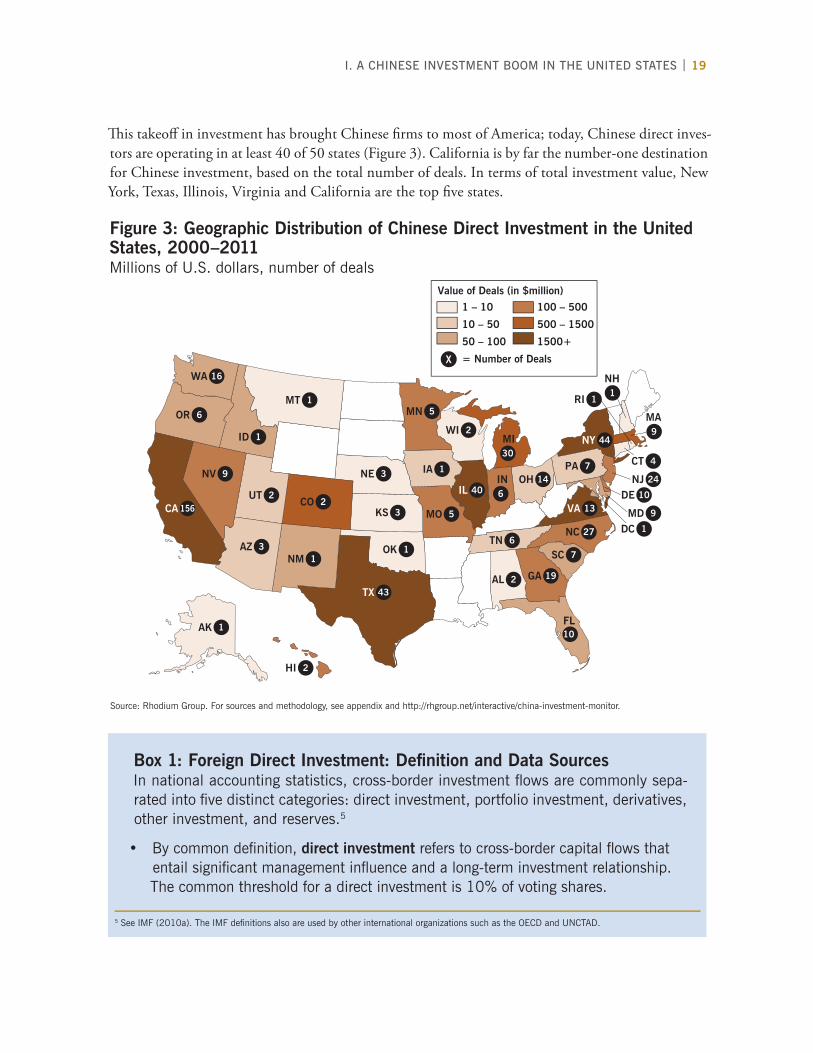
Th is takeoff in investment has brought Chinese fi rms to most of America; today, Chinese direct inves-
tors are operating in at least 40 of 50 states (Figure 3). California is by far the number-one destination
for Chinese investment, based on the total number of deals. In terms of total investment value, New
York, Texas, Illinois, Virginia and California are the top fi ve states.
Figure 3: Geographic Distribution of Chinese Direct Investment in the United States, 2000–2011Millions of U.S. dollars, number of deals
Source: Rhodium Group. For sources and methodology, see appendix and http://rhgroup.net/interactive/china-investment-monitor.
Box 1: Foreign Direct Investment: Defi nition and Data SourcesIn national accounting statistics, cross-border investment fl ows are commonly sepa-rated into fi ve distinct categories: direct investment, portfolio investment, derivatives, other investment, and reserves.5
• By common defi nition, direct investment refers to cross-border capital fl ows that entail signifi cant management infl uence and a long-term investment relationship. The common threshold for a direct investment is 10% of voting shares.
5 See IMF (2010a). The IMF defi nitions also are used by other international organizations such as the OECD and UNCTAD.
WA 16
OR 6
ID 1
NV 9
CA 156UT 2
AZ 3NM 1
CO 2
TX 43
OK 1
KS 3
NE 3
MT 1MN 5
IA 1
MO 5
IL 40
WI 2NY 44
VA 13
OH 14IN6
MI30
NH1
MA9
PA 7NJ 24
DE 10
MD 9
DC 1TN 6
AL 2 GA 19
FL10
SC 7
NC 27
AK 1
HI 2
RI 1
CT 4
Value of Deals (in $million)
1 – 10
10 – 50
50 – 100
= Number of Deals
100 – 500
500 – 1500
1500+
X
I. A CHINESE INVESTMENT BOOM IN THE UNITED STATES | 19
20 | CHINESE DIRECT INVESTMENT IN CALIFORNIA
• Portfolio investment is typically a shorter-term investment in liquid (easily bought and sold) securities, which might include holdings of equity shares with less than 10% of voting rights or corporate debt instruments (neither of which convey con-trol or, in the case of debt, ownership).
• The derivatives category includes fi nancial instruments such as swaps, futures, and options, which are only contractually related to the underlying value of real assets such as fi rms or commodities.6
• The residual category of other investment captures all fl ows that do not fall under the previous categories, such as foreign bank deposits, currency holdings, cross-border loans, and trade credits.
• Reserves held by governments in the form of gold, foreign exchange, or Interna-tional Monetary Fund (IMF) special drawing rights are another category in interna-tional fi nancial statistics.
Foreign direct investment fl ows comprise three components: equity investment, reinvested earnings, and other capital fl ows. A direct investment relationship starts with an equity injection into an overseas subsidiary, either to establish a new overseas subsidiary (greenfi eld investments) or to acquire a controlling stake (greater than 10%) in an existing company (mergers and acquisitions). Once such a direct invest-ment relationship begins, subsequent capital fl ows between the parent company and the foreign subsidiary are counted as direct investment. In addition to potential additional equity injections, this can include profi ts that are not sent home but rather are reinvested in the company (reinvested earnings) and other capital fl ows between the two fi rms—for example, when the overseas parent lends money to its overseas subsidiary, or vice versa (intracompany debt).7
A range of different measures and sources are available for tracking FDI fl ows and stocks. Most countries compile balance of payments statistics that include information on annual infl ows and outfl ows for each type of cross-border investment and related income fl ows. The corresponding numbers for the inward and outward stock of each category—the accumulated fl ows adjusted for exchange rate and valuation changes—are recorded in a country’s international investment position statistics. The IMF uses these fi gures as reported by its member states to compile global fi nancial statistics.
In addition to national accounting statistics based on IMF standard defi nitions, many countries publish data sets that provide a more disaggregated view of their investment
6 The new category of derivatives was introduced in the sixth edition of the IMF’s Balance of Payments and International Investment Position Manual, released in 2009; most countries’ statistics still are based on earlier versions and thus do not yet show derivatives as a separate category. 7 Detailed information on the nature of direct investment and its measurement can be found in the OECD’s “Benchmark Defi nition of Foreign Direct Investment” (OECD 2008a).
relationship with other economies. These detailed statistics are usually published by central banks or national statistical authorities. Several international organizations, such as the United Nations Conference on Trade and Development (UNCTAD) or the Organization for Economic Co-operation and Development (OECD), also collect data on FDI and other cross-border investment fl ows.
Unfortunately, the accuracy and quality of offi cial statistics on cross-border invest-ment fl ows suffers as fi nancial transactions become increasingly complicated, with tax optimization strategies, transfer pricing, and the use of shell companies in offshore fi nancial centers. In light of these distortions, alternative methods of data collection—such as the bottom-up collection of transaction data based on completed greenfi eld projects and acquisitions—often produce results that are more reliable than offi cial statistics. Online-based research opportunities, commercial databases for certain types of cross-border investment fl ows, and specialized research products provide a fertile ground for alternative data collection strategies.
The Rhodium Group (RHG) data set captures expenses by Chinese investors for greenfi eld projects and acquisitions in the United States with a value of $1 million or more and any publicized follow-up fi nancing fl ows related to these projects. It is not directly comparable to offi cial balance of payments data but allows a real-time assessment of Chinese expenses for FDI projects in the United States. More informa-tion on the methodology can be found in the appendix of this report. The China Investment Monitor, an interactive web application based on the RHG data set, is available at http://rhgroup.net/interactive/china-investment-monitor.
I. A CHINESE INVESTMENT BOOM IN THE UNITED STATES | 21

22 | CHINESE DIRECT INVESTMENT IN CALIFORNIA
T he increase in Chinese investment in the United States is tangible, but many wonder whether
these fl ows are benefi cial. America’s historical openness to foreign investment has been based
on the conviction that FDI is overwhelmingly advantageous for the host economy and that existing
risks can be dealt with through specifi c policy frameworks such as national security screenings for
acquisitions and a competition policy regime. Is China an exception to that analysis?
Foreign direct investment generally increases the welfare of both producers and consumers. It allows
fi rms to explore new markets and to operate more effi ciently across borders, thereby reducing produc-
tion costs, increasing economies of scale, and promoting specialization. It is particularly important
when serving overseas markets requires an on-the-ground presence—such as in machinery or high-
end appliances. Foreign direct investment also means better prices for fi rms looking to divest assets,
thanks to a bigger and more competitive pool of bidders. For consumers, foreign investment increases
competition for buyers’ attention, leading to more choices, lower prices, and innovation. And in local
communities, foreign investment brings new jobs, tax revenue, and knowledge spillovers from worker
training, technology transfers, and R&D activities. Analyzing more than 500 investments in the
United States from 2000 to 2011, we fi nd that Chinese FDI has so far produced the same benefi ts as
direct investment from other countries.
First, Chinese FDI brings fresh capital. With the United States entrenched in a protracted period
of tepid economic recovery and structural reform that is likely to impose reduced growth for some
years to come, external capital infusions are more important than ever. While OFDI from traditional
investors has fallen off severely—global FDI fl ows declined from a peak of $2.2 trillion in 2007
to $1.1 trillion in 2009 and recovered to only $1.6 trillion in 20118—Chinese OFDI is growing
rapidly, amplifying China’s importance to developed nations including the United States. We project
$1 trillion to $2 trillion in global OFDI from China over the decade from 2010 to 2020 based on
an extrapolation of historical outward investment growth for other nations, China’s current position,
and its expected gross domestic product (GDP) performance. If the United States maintains its aver-
age intake of global FDI fl ows in the 2000s—around 17%—then by 2020, the United States would
look for a cumulative $100 billion to $400 billion in new Chinese M&A and greenfi eld investments.
Second, by injecting capital into the U.S. economy, either through new greenfi eld projects or posi-
tions in existing ones, foreign investment is generating employment. Majority-owned U.S. affi liates
II. The Benefi ts Of Chinese Investment
8 Source: OECD, Foreign Direct Investment Statistics.
of foreign fi rms employed 5.3 million Americans in 2009, according to the most recent data, out
of a total civilian workforce of 154 million (i.e., 3.4% of U.S. employment). According to 2009
fi gures from the U.S. Bureau of Economic Analysis (BEA), majority-owned U.S. affi liates of Chinese
companies employed about 4,300 people in the United States. However, these outdated fi gures were
released prior to the surge of Chinese investment. Our own data indicate that Chinese fi rms presently
provide more than 25,000 jobs in the United States, or six times the latest offi cial BEA fi gures.9 While
this number is still small compared to the total U.S. workforce, other historical examples illustrate the
potential for job creation: in 2009, majority-owned U.S. affi liates of Japanese fi rms employed more
than 660,000 Americans, with a total payroll of $49 billion.10 Th ere are concerns that Chinese fi rms
are more likely than investors from elsewhere to acquire U.S. fi rms, move valuable assets back home,
and shut down local U.S. operations. However, our database shows that such cases are very rare, if
present at all. Prized American technology in most cases relies heavily on intangible skilled staff and
know-how, which do not travel well. In most M&A transactions, the opposite trend can be observed:
Chinese buyers of American high-tech assets actually inject additional capital after the acquisition to
maintain or increase local staffi ng.11 Exceptions to this have typically occurred in sunset industries
in which the loss of employment can be primarily attributed not to Chinese ownership, but to an
industry-wide decline in that sector.
Th ird, Chinese investment increases competition and delivers U.S. consumer welfare in the form of
lower prices, product diversity and selection, and faster innovation cycles. Th ese gains extend beyond
traditional goods trade to product segments that require a more active presence in consumer markets
and—especially—to services. Chinese fi rms have already developed strong global positions in several
service industries. For instance, the market entrance of Haier America fostered greater competition in
U.S. white goods markets, bringing American consumers lower prices and more innovative products.
Haier’s mini-fridges are now standard items in American college dorms and hotel mini-bars, and
Lenovo laptops have become almost as commonplace.
Fourth, Chinese investment helps maximize shareholder value. Greater investment interest from China
increases competition for assets and thus raises prices for American sellers. CNOOC’s failed acquisi-
tion of Unocal in 2005 is an example. Unocal attracted an acquisition bid of $18.5 billion from
CNOOC in mid-2005, compared to an initial bid of just $16.5 billion from Chevron. Although the
Chinese bid ultimately was scuttled by U.S. politics, Chevron’s winning bid ended up being raised
by $600 million (which, in turn, increased the profi t for pension funds and other holders of Unocal
shares). Th ere has been much speculation about whether Chinese investors are willing to “overpay”
for direct investment assets. Th is might be true, given the lack of experience of Chinese fi rms in
factoring global pricing variables into their deal making. However, this may be off set by positive
information asymmetries: Chinese fi rms are often much better briefed on market conditions in China,
and because Chinese marginal demand growth has become a huge share of total global growth, they
9 This estimate refers to majority-owned affi liates only and does not include the thousands of jobs in fi rms in which Chinese fi rms own only minority stakes or provide fi nancing. 10 Source: U.S. Bureau of Economic Analysis, Financial and Operating Data for U.S. Affi liates of Foreign Multinational Companies.11 Some recent examples include the acquisitions of Cirrus in 2011, Nexteer in 2010, and certain Kennametal operations in 2009.
II. THE BENEFITS OF CHINESE INVESTMENT | 23
24 | CHINESE DIRECT INVESTMENT IN CALIFORNIA
are often in a strong position to value productive assets. For unlocking American shareholder value,
the impact of Chinese OFDI might be more than additive; it may be defi nitive.
Fifth, Chinese FDI can have positive eff ects on productivity and innovation. Given their lower starting
level of technology and more modest management skills, it might seem premature to expect Chinese
fi rms to bring to the United States the intellectual property and business know-how that fuels total
factor productivity growth.12 However, Japan is a historical example of how quickly emerging-market
fi rms can swing from students to leaders. Japanese auto and electronics fi rms were dismissed as primi-
tive when they arrived in the United States in the 1960s and 1970s, but little more than a decade
later, they were at the forefront of technology, promoting important new management techniques,
such as just-in-time logistics. A few Chinese fi rms such as Huawei have already moved beyond reverse
engineering and imitation toward technological leadership in their industries, and they are investing
heavily in American R&D capacities.
Sixth, growing Chinese FDI can help keep China’s market open. By welcoming Chinese investment,
the United States encourages China to keep its door open to American investment. While China has
embraced an exceptionally open stance toward foreign investment since the late 1980s, U.S. fi rms
have been outspoken about recent signs of backsliding as China’s fi rms graduate from relying on
partnerships with multinationals to possessing more homegrown capabilities. Th ese concerns are not
hallucinatory; there are indeed factions in China that are counseling less liberal treatment for foreign
fi rms in the domestic economy. We are optimistic that pro-international arguments will prevail, but
their success—and the plethora of economic and security benefi ts dependent on continuing Chinese
convergence with liberal international norms—relies in part on America’s continuing demonstration
of the virtues of openness.
Finally, greater Chinese investment can lead to a regulatory upward convergence. Chinese fi rms invest-
ing in the United States, by necessity, absorb the global business norms and habits characteristic of
OECD markets. As fi rms’ global presence increases, China’s multinationals may start lobbying for
stricter compliance with global business norms as they realize that being able to comply with stricter
regulatory supervisions gives them a strong competitive advantage over their homebound rivals. Also,
if Chinese fi rms holding assets in the United States fail to internalize Western business norms, they
are more vulnerable to litigation in U.S. courts, something they were immune from when serving
the U.S. market solely through exports. Th is regulatory power to govern fi rms operating within U.S.
borders off ers a means of combating harmful Chinese business practices that did not exist before
Chinese investors came to the United States.
While Chinese investment should deliver the same benefi ts as FDI from other countries, there are also
concerns that it may present greater risks for host countries due to China’s non-democratic political
system and “socialist market economy”. Existing economic concerns spring from the exceptional size
12 Studies of business innovation in China generally conclude that manufacturers take low-tech approaches, reverse-engineer foreign innovation rather than make breakthroughs, and rely on foreign talent and inputs for a high share of advanced capabilities. See, e.g., the OECD’s review of China’s in-novation system (OECD 2008b).

and velocity of China’s growth, the role of the state in the economy, and the revival of interest in
state capitalism and nationalism as alternatives to Western consumer-centric models. Concerns about
greater national security risks result from China’s authoritarian political system, its intention to re-
shape the existing global and regional power balance, its history of sharing sensitive technologies with
rogue regimes, and its record of commercial and political espionage. Th ese concerns are legitimate,
but they can be addressed through the existing policy framework for inward FDI in the United States.
Th e Committee on Foreign Investment in the United States is eff ective and diligent in addressing
national security risks from foreign acquisitions, and competition policy authorities are screening
foreign acquisition to avoid anti-competitive impacts. Th ese regimes ensure that the United States
can keep the door open to Chinese investors and maximize the potential benefi ts of Chinese FDI.13
13 For a more detailed analysis of the potential benefi ts and risks posed by Chinese investment and a discussion of future risks that existing frameworks may not be able to adequately address, see Rosen and Hanemann (2011) and Hanemann and Rosen (2012).
II. THE BENEFITS OF CHINESE INVESTMENT | 25

26 | CHINESE DIRECT INVESTMENT IN CALIFORNIA
C alifornia is at the forefront of China’s beginning investment boom in the United States. It
is by far the number-one destination for Chinese investment, based on the total number of
deals. Th e Golden State attracted 156 deals from 2000 to 2011, more than any other state (Figure
4). Th e state accounts for more than one-quarter of all Chinese investments in the United States and
has attracted far more deals than the other top recipient states—New York, Texas, Illinois, and North
Carolina. It has attracted the most greenfi eld deals (109), as well as the most acquisitions (47). In
terms of total investment value, California ranks fi fth nationwide, with $1.3 billion of consummated
deals. Th is refl ects the fact that California has not—unlike New York, Texas, Illinois, or Virginia—at-
tracted large-scale takeover deals.
California’s prime position mirrors the state’s overall economic importance and general attractiveness
to foreign investors. As the most economically potent state in the nation, with a GDP of more than
III. Patterns of Chinese Investment in California
Figure 4: Top Destinations of Chinese Direct Investment in the United States, 2000–2011Percentage of total deals, percentage of total investment value
Source: Rhodium Group. For sources and methodology, see appendix and http://rhgroup.net/interactive/china-investment-monitor.
California29%
New York 8%
Texas 8%
Illinois 7%
Michigan5%
Rest of the U.S. 43%
NUMBER OF INVESTMENTS
New York 19%
Texas 16%
Illinois 12%
Virginia 11%
California 8%
Rest of the U.S. 34%
INVESTMENT VALUE (USD)
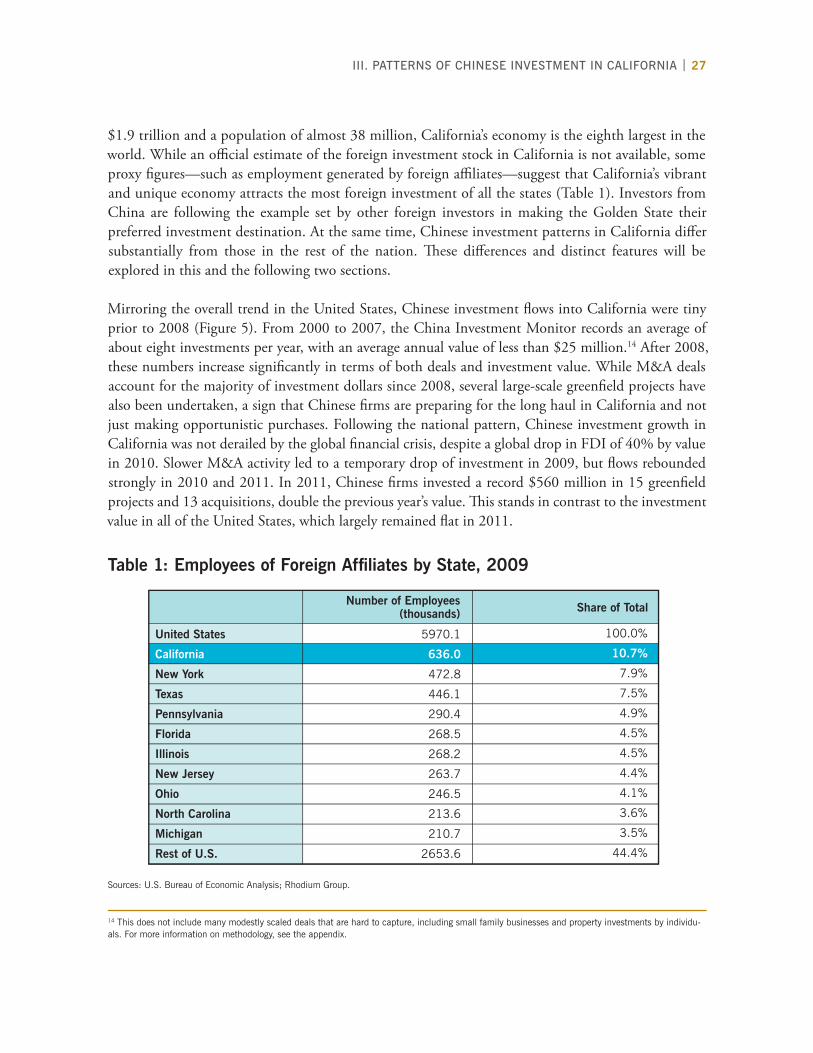
Table 1: Employees of Foreign Affi liates by State, 2009
Sources: U.S. Bureau of Economic Analysis; Rhodium Group.
14 This does not include many modestly scaled deals that are hard to capture, including small family businesses and property investments by individu-als. For more information on methodology, see the appendix.
$1.9 trillion and a population of almost 38 million, California’s economy is the eighth largest in the
world. While an offi cial estimate of the foreign investment stock in California is not available, some
proxy fi gures—such as employment generated by foreign affi liates—suggest that California’s vibrant
and unique economy attracts the most foreign investment of all the states (Table 1). Investors from
China are following the example set by other foreign investors in making the Golden State their
preferred investment destination. At the same time, Chinese investment patterns in California diff er
substantially from those in the rest of the nation. Th ese diff erences and distinct features will be
explored in this and the following two sections.
Mirroring the overall trend in the United States, Chinese investment fl ows into California were tiny
prior to 2008 (Figure 5). From 2000 to 2007, the China Investment Monitor records an average of
about eight investments per year, with an average annual value of less than $25 million.14 After 2008,
these numbers increase signifi cantly in terms of both deals and investment value. While M&A deals
account for the majority of investment dollars since 2008, several large-scale greenfi eld projects have
also been undertaken, a sign that Chinese fi rms are preparing for the long haul in California and not
just making opportunistic purchases. Following the national pattern, Chinese investment growth in
California was not derailed by the global fi nancial crisis, despite a global drop in FDI of 40% by value
in 2010. Slower M&A activity led to a temporary drop of investment in 2009, but fl ows rebounded
strongly in 2010 and 2011. In 2011, Chinese fi rms invested a record $560 million in 15 greenfi eld
projects and 13 acquisitions, double the previous year’s value. Th is stands in contrast to the investment
value in all of the United States, which largely remained fl at in 2011.
United States
California
New York
Texas
Pennsylvania
Florida
Illinois
New Jersey
Ohio
North Carolina
Michigan
Rest of U.S.
5970.1
636.0
472.8
446.1
290.4
268.5
268.2
263.7
246.5
213.6
210.7
2653.6
100.0%
10.7%
7.9%
7.5%
4.9%
4.5%
4.5%
4.4%
4.1%
3.6%
3.5%
44.4%
Number of Employees Share of Total (thousands)
III. PATTERNS OF CHINESE INVESTMENT IN CALIFORNIA | 27

28 | CHINESE DIRECT INVESTMENT IN CALIFORNIA
Figure 5: Chinese Direct Investment in California, 2000–2011Millions of U.S. dollars, number of deals
Source: Rhodium Group. For sources and methodology, see appendix and http://rhgroup.net/interactive/china-investment-monitor.
Chinese investment in the Golden State is concentrated in the northern and southern coastal hubs
with the largest metropolitan areas, the densest populations, and the highest per capita GDP.15 In the
south, the Los Angeles–Long Beach–Santa Ana metropolitan area is California’s most populous region
and the metropolitan area with the third-highest per capita GDP in California. It is also the premier
destination for Chinese investment, by both number of deals and value. Th e 69 deals recorded in
this region from 2000 to 2011 account for $618 million in investments. A signifi cant portion of this
came from a single $250 million acquisition of Los Angeles–based Riot Games in 2011. However,
even without this transaction, the Los Angeles–Long Beach–Santa Ana area would remain top ranked,
receiving more Chinese investment from 2000 to 2011 than any other California metropolitan area.
Th e remainder of China’s investment fl ows to Southern California include acquisitions in San Diego
County, which ranks fourth among California metropolitan areas in terms of per capita GDP. A
handful of smaller greenfi eld projects in the San Diego and Riverside–San Bernardino–Ontario
metropolitan areas round out the rest from 2000 to 2011.
Th e San Francisco–Oakland–Fremont metropolitan area, with the fi fth-highest per capita GDP in
the nation and the second highest in California, ranks second in Chinese investment in California
by number of deals and third in total deal value. Conversely, the San Jose–Sunnyville–Santa Clara
metropolitan area, which has the highest per capita GDP of any metropolitan area nationwide, ranks
third in Chinese investment in California by number of deals and second in total deal value. Th is is
15 All GDP and income data used in this section are from the U.S. Bureau of Economic Analysis’s Regional Economic Accounts.
0
5
10
15
20
25 2
00
0
20
01
20
02
20
03
20
04
20
05
20
06
20
07
20
08
20
09
20
10
20
11
Investment in Greenfield Projects, USD mn (RHS)
Investment in M&A Deals, USD mn (RHS)
Number of M&A Deals (LHS)
Number of Greenfield Projects (LHS)
0
100
200
300
400
500
600
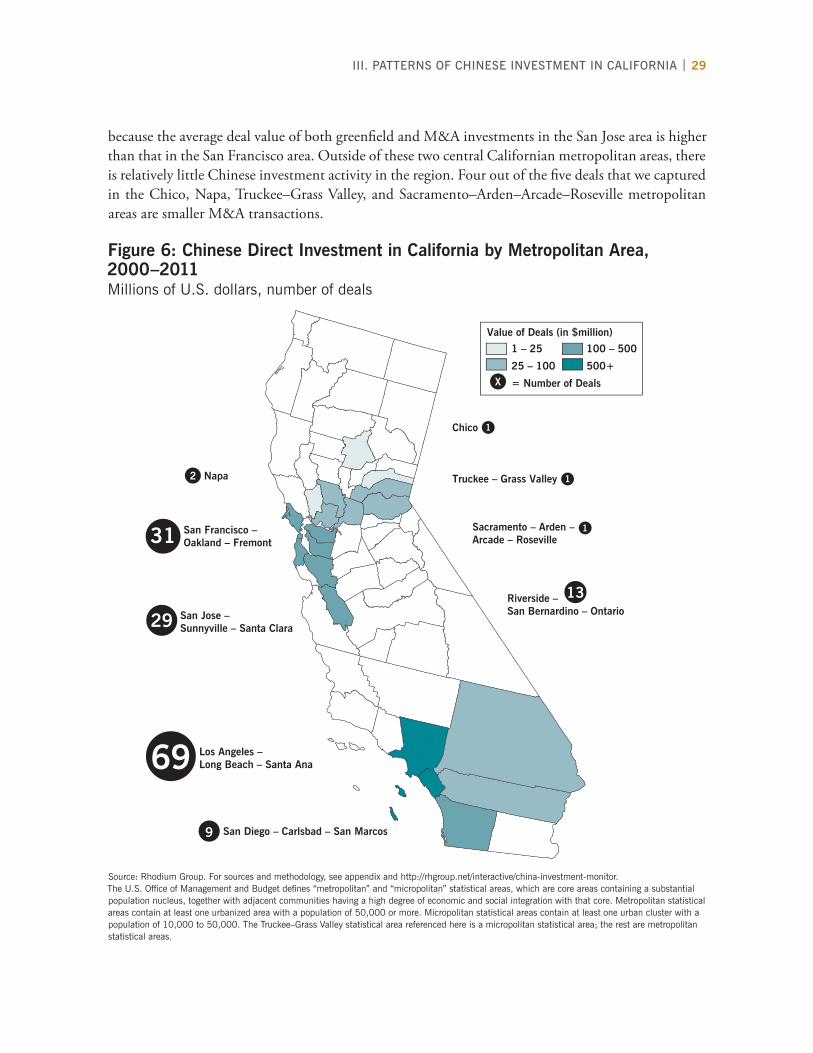
because the average deal value of both greenfi eld and M&A investments in the San Jose area is higher
than that in the San Francisco area. Outside of these two central Californian metropolitan areas, there
is relatively little Chinese investment activity in the region. Four out of the fi ve deals that we captured
in the Chico, Napa, Truckee–Grass Valley, and Sacramento–Arden–Arcade–Roseville metropolitan
areas are smaller M&A transactions.
Figure 6: Chinese Direct Investment in California by Metropolitan Area, 2000–2011Millions of U.S. dollars, number of deals
Source: Rhodium Group. For sources and methodology, see appendix and http://rhgroup.net/interactive/china-investment-monitor.The U.S. Offi ce of Management and Budget defi nes “metropolitan” and “micropolitan” statistical areas, which are core areas containing a substantial population nucleus, together with adjacent communities having a high degree of economic and social integration with that core. Metropolitan statistical areas contain at least one urbanized area with a population of 50,000 or more. Micropolitan statistical areas contain at least one urban cluster with a population of 10,000 to 50,000. The Truckee–Grass Valley statistical area referenced here is a micropolitan statistical area; the rest are metropolitan statistical areas.
Napa 2
Chico
Value of Deals (in $million)
1 – 25
25 – 100
= Number of Deals
100 – 500
500+
Truckee – Grass Valley
Sacramento – Arden – Arcade – Roseville
Riverside – San Bernardino – Ontario
San Francisco – Oakland – Fremont
San Jose – Sunnyville – Santa Clara
Los Angeles – Long Beach – Santa Ana
San Diego – Carlsbad – San Marcos
1
1
1
13
29
31
9
69
X
III. PATTERNS OF CHINESE INVESTMENT IN CALIFORNIA | 29

30 | CHINESE DIRECT INVESTMENT IN CALIFORNIA
It is notable that the most popular Chinese investment destinations in California all possess large
populations of individuals with Chinese ancestry (Figure 7). Th e most popular target of Chinese
investment, the Los Angeles–Long Beach–Santa Ana metropolitan area, has the largest population of
individuals of Chinese ancestry in all of California. Th e second most popular destination by number
of deals is the San Francisco–Oakland–Fremont metropolitan area, which contains the highest pro-
portion of Chinese residents to total population in all of California. Th e cultural and historical ties
shared with these ethnic Chinese populations may help explain why these locations have emerged as
preferred targets for Chinese investors.
Figure 7: Chinese Populations in California, 2010Thousands, percentage of total population
Sources: U.S. Census Bureau; Rhodium Group.
Box 2: Other Chinese Capital Flows to California
The RHG data set used for this report consists of direct investment transactions with a total value of more than $1 million, which includes greenfi eld projects, joint ventures, and acquisitions with a fi nal ownership stake of 10% or more. In addition
Population with Chinese Ancestry(Thousands)
10–40
40–140
140–300
300+
Proportion of Population with Chinese Ancestry
1–2%
2%–7%
7%–18%
18% +
16 See “China Wealth Fund Said to Invest More than $100 Million in Visa,” New York Times, March 25, 2008, http://dealbook.nytimes.com/2008/03/25/china-wealth-fund-said-to-invest-more-than-100-million-in-visa/.17 See “China’s Giant Tencent Placing Bets on Small Silicon Valley Startups,” Bloomberg, April 10, 2012, http://go.bloomberg.com/tech-deals/2012-04-10-chinas-giant-tencent-placing-bets-on-small-silicon-valley-startups/.18 See Lingling Wei, “Bank of China Ramps Up Presence in N.Y. Real Estate,” Wall Street Journal, April 11, 2011, http://online.wsj.com/article/SB10001424052748703841904576257143952307056.html.19 See Syanne Olson, “China Development Bank Approves LDK’s Project Loan for Two Solar Plants Totaling 8MW,” PV Tech, January 5, 2012, http://www.pv-tech.org/news/china_development_bank_approves_ldks_project_loan_for_2_solar_plants_totall.20 See Dinny McMahon, “China in Talks with U.S. Home Builder,” Wall Street Journal, June 25, 2012, http://online.wsj.com/article/SB10001424052702304458604577489062449154168.html.21 Monthly statistics on foreign ownership of U.S. Treasury securities can be found at http://www.treasury.gov/resource-center/data-chart-center/tic/Pages/ticsec2.aspx#ussecs.
to direct investment projects, there are other Chinese capital fl ows to California not captured in our assessment, most of which are increasing as well.
First, Chinese investors are fi nancing California-based fi rms through the purchase of corporate bonds and portfolio equity stakes below the 10% threshold. Most of these investments are made by portfolio managers inside or outside China and are impossible to track down accurately, unless they are signifi cant investments that are announced voluntarily or through mandatory regulatory fi lings. In 2008, for example, China Life and China International Capital Corporation reportedly invested in the initial public offering of San Francisco–headquartered Visa.16 There are also smaller fi rms buying smaller equity stakes for investment diversifi cation, strategic learning, or preparation for a more signifi cant stake. Recent examples include a 6% stake by JiLin Aodong Medicine Industry Group in San Diego–based Vital Therapies Inc. and a planned 5% stake by Xiamen-based Kaifajing Lighting in BridgeLux Inc., a Livermore-based manufacturer of light-emitting diodes. There are also signs of in-creasing activity by Chinese private equity fi rms in the United States, which does not count as FDI if the stakes are below the 10% level. In California, recent investments have been focused on venture capital in high-tech start-ups. Chinese Internet giant Tencent, for example, recently announced a series of venture capital investments in small Internet start-ups in the Bay Area.17
Second, Chinese banks are increasingly providing cross-border loans to projects and fi rms in the United States. Bank of China, for example, recently expanded its fi nanc-ing for real estate projects in Manhattan.18 In California, China Development Bank has committed to provide fi nancing for several projects, among them the develop-ment of solar photovoltaic fi elds by SPI Solar.19 As of the writing of this report, China Development Bank is also in negotiations to provide up to $1.7 billion to revitalize two stalled large-scale real estate development projects in San Francisco.20
Finally, Chinese capital is fl owing into U.S. government bonds, fi nancing state and federal expenses. As of May 2012, China offi cially held $1.17 trillion in U.S. Treasury bills and bonds.21 Detailed statistics on Chinese holdings of municipal bonds from California are not available.
III. PATTERNS OF CHINESE INVESTMENT IN CALIFORNIA | 31
32 | CHINESE DIRECT INVESTMENT IN CALIFORNIA
M any assume that China’s outward FDI is the product of strategic government campaigns
guiding Chinese fi rms’ overseas activities for political motivations. Analysts have strained
to identify such a strategic rationale for a decade, and the Chinese government has given them plenty
of fodder by portraying itself as a facilitator of outward FDI through a “Going Out” campaign pro-
mulgated since 2000.22 However, although a new policy stance is an important variable for growing
outward investment, we take the view that the growth of China’s outward FDI stems from changes
in China’s growth model and marketplace rather than a political agenda. Th e recent surge in Chinese
OFDI in the United States was mostly driven by changing commercial realities at home, forcing fi rms
to look abroad to sustain their growth.
In the past, the attraction of domestic market growth overshadowed the lure of overseas opportuni-
ties, and outward FDI was limited to securing natural resources and trade-facilitating infrastructure.
Most investment activity took place in developing countries, and forays into developed economies
were few. Th is is true for California, where only a few Chinese fi rms were invested in early years, for
example, logistics fi rms such as the China Ocean Shipping Group and smaller-scale trading fi rms.
Chinese bids for natural resources assets in developed economies, such as China National Off shore
Oil Corporation’s (CNOOC) bid for Unocal in 2005, were met with strong political resistance.
However, outward investment in developed economies is poised to grow substantially, as a struc-
tural adjustment process at home is forcing Chinese companies to adjust their business models. Th e
foundations of China’s old growth model, which relied on excessive fi xed investment and exports
of overcapacity to overseas markets, are eroding. Th e prices of key input factors are gradually rising:
labor costs are increasing as a result of demographic and social pressures to give households a greater
share of the national income; the cost of land has risen dramatically as a result of a property bubble;
exchange rates are being reformed in response to infl ation and increasing pressure from trading
partners; regulatory compliance costs are rising quickly as the government is forced to address air
pollution and other environmental damages; and, perhaps most importantly, capital costs are being
pushed up as China is forced to reform its fi nancial system in order to end fi nancial repression of
households, improve the allocation of capital to higher-return investments, and prepare for a gradual
opening of the country’s capital account.
IV. Drivers and Targeted Industries
22 See, for example, Premier Wen Jiabao’s report to the delegates of the 2012 National People’s Congress, in which he said that the government would “guide Chinese enterprises under various forms of ownership in making overseas investments . . . in an orderly manner” (Wen 2012).

Th ese changes are translating into pressure on fi rms to adjust their business model by moving up and
down the value chain and to capture profi ts outside their traditional manufacturing focus (Figure 8).
Th is process necessitates greater presence beyond China’s borders. Overseas investment is one way
to achieve deeper market penetration, explore new service provision opportunities, and buy assets
that can give them a competitive edge at home and abroad. Th ese new motives are leading Chinese
investors to the industrialized world with great vigor.
Figure 8: China in the Global Value ChainStylized display
Source: Rhodium Group.
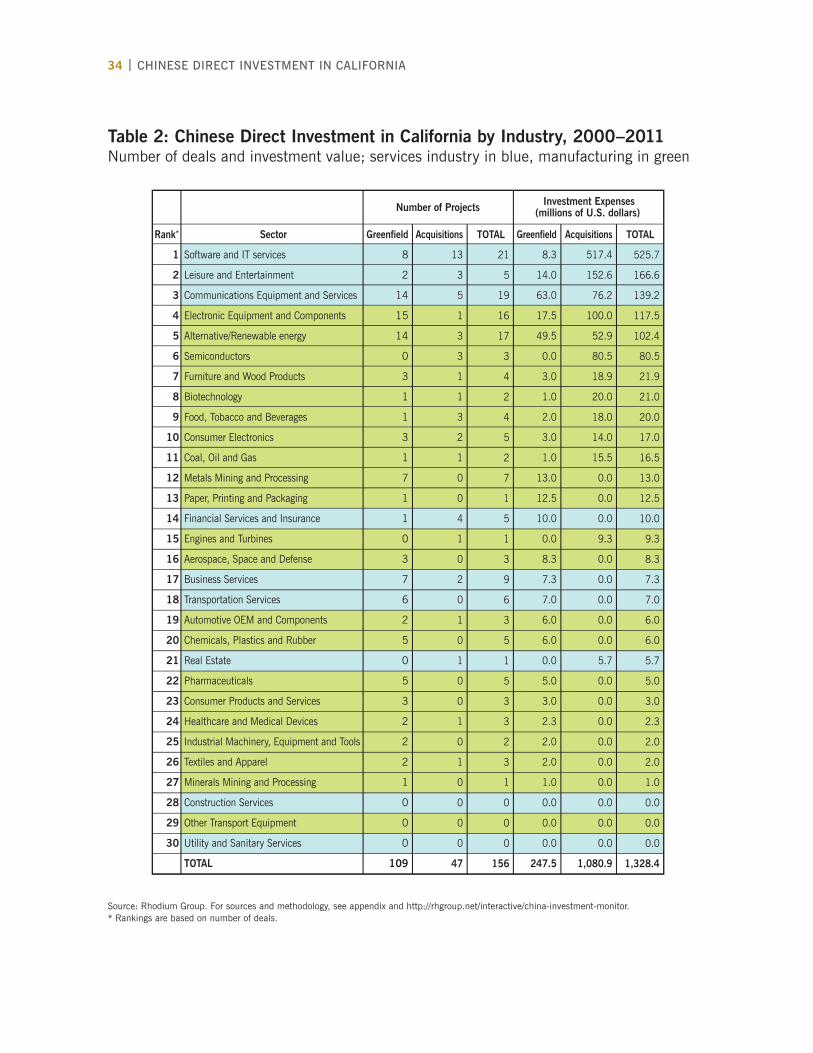
California’s popularity as a destination for Chinese investment refl ects these changing motivations.
Table 2 breaks down Chinese investments in California by industry, ranked by number of investments.
Several broad trends are important. First, the investments are spread across a range of industries, not
only a few strategic sectors. Second, the service sectors are the most attractive to Chinese investors,
as are the service components of manufacturing value chains. Th e top fi ve industries are all service
oriented, and even investments in manufacturing include a strong service component—whether it be
upstream in R&D or downstream in distribution, branding, and customer service. Finally, high-tech
industries (in which California traditionally has been strong), such as software or communications
equipment, are the premier draw for Chinese fi rms.
Not surprisingly, software and information technology services top the list, both in number of invest-
ments and deal value. Th e biggest-ticket greenfi eld investments in this sector are concentrated in the
Los Angeles and San Jose regions, while M&A deals are spread fairly evenly across the Los Angeles,
San Jose, San Francisco, and San Diego metropolitan areas. Firms that have established operations
in California include Internet portal Sohu (San Francisco), software outsourcing provider Neusoft
IV. DRIVERS AND TARGETED INDUSTRIES | 33
UPSTREAM MANUFACTURING DOWNSTREAM
CHINA PROFIT MARGINS
High
Low
Resources, R&D, Branding Assembly Distribution and Retail
34 | CHINESE DIRECT INVESTMENT IN CALIFORNIA
Table 2: Chinese Direct Investment in California by Industry, 2000–2011Number of deals and investment value; services industry in blue, manufacturing in green
Source: Rhodium Group. For sources and methodology, see appendix and http://rhgroup.net/interactive/china-investment-monitor.* Rankings are based on number of deals.
Sector
Software and IT services
Leisure and Entertainment
Communications Equipment and Services
Electronic Equipment and Components
Alternative/Renewable energy
Semiconductors
Furniture and Wood Products
Biotechnology
Food, Tobacco and Beverages
Consumer Electronics
Coal, Oil and Gas
Metals Mining and Processing
Paper, Printing and Packaging
Financial Services and Insurance
Engines and Turbines
Aerospace, Space and Defense
Business Services
Transportation Services
Automotive OEM and Components
Chemicals, Plastics and Rubber
Real Estate
Pharmaceuticals
Consumer Products and Services
Healthcare and Medical Devices
Industrial Machinery, Equipment and Tools
Textiles and Apparel
Minerals Mining and Processing
Construction Services
Other Transport Equipment
Utility and Sanitary Services
TOTAL
Rank*
1
2
3
4
5
6
7
8
9
10
11
12
13
14
15
16
17
18
19
20
21
22
23
24
25
26
27
28
29
30
Greenfield
8
2
14
15
14
0
3
1
1
3
1
7
1
1
0
3
7
6
2
5
0
5
3
2
2
2
1
0
0
0
109
Acquisitions
13
3
5
1
3
3
1
1
3
2
1
0
0
4
1
0
2
0
1
0
1
0
0
1
0
1
0
0
0
0
47
TOTAL
21
5
19
16
17
3
4
2
4
5
2
7
1
5
1
3
9
6
3
5
1
5
3
3
2
3
1
0
0
0
156
Greenfield
8.3
14.0
63.0
17.5
49.5
0.0
3.0
1.0
2.0
3.0
1.0
13.0
12.5
10.0
0.0
8.3
7.3
7.0
6.0
6.0
0.0
5.0
3.0
2.3
2.0
2.0
1.0
0.0
0.0
0.0
247.5
Acquisitions
517.4
152.6
76.2
100.0
52.9
80.5
18.9
20.0
18.0
14.0
15.5
0.0
0.0
0.0
9.3
0.0
0.0
0.0
0.0
0.0
5.7
0.0
0.0
0.0
0.0
0.0
0.0
0.0
0.0
0.0
1,080.9
TOTAL
525.7
166.6
139.2
117.5
102.4
80.5
21.9
21.0
20.0
17.0
16.5
13.0
12.5
10.0
9.3
8.3
7.3
7.0
6.0
6.0
5.7
5.0
3.0
2.3
2.0
2.0
1.0
0.0
0.0
0.0
1,328.4
Number of Projects Investment Expenses
(millions of U.S. dollars)
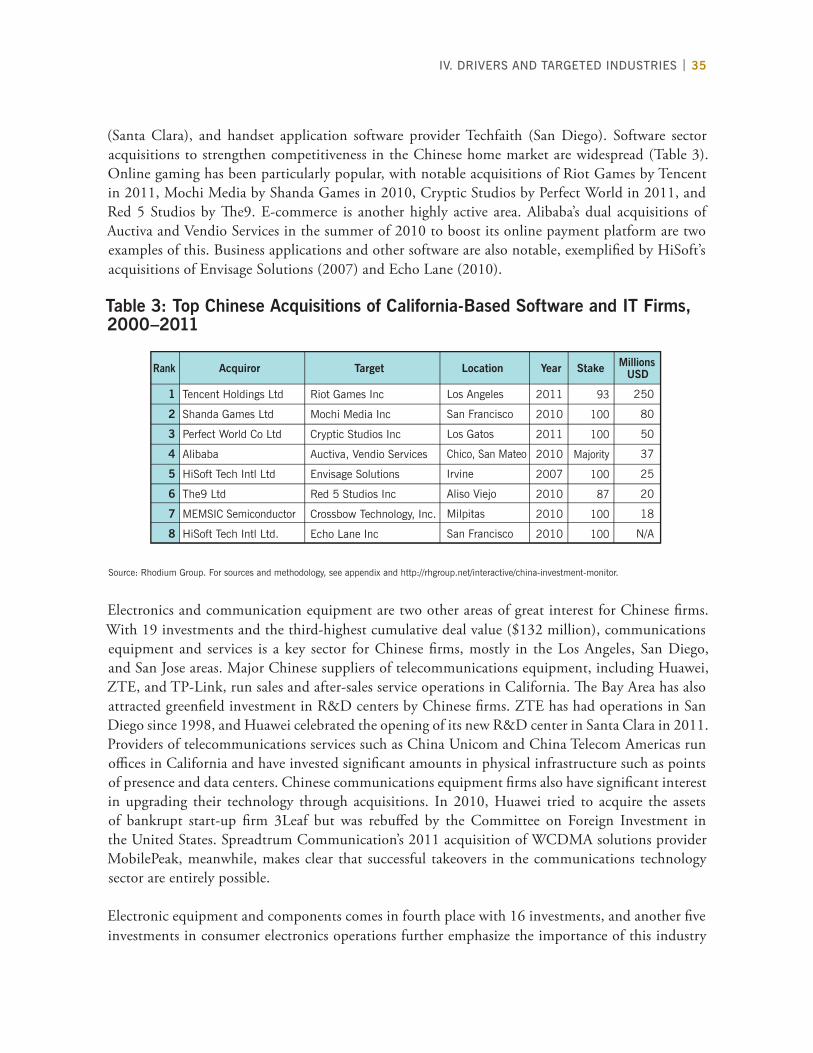
(Santa Clara), and handset application software provider Techfaith (San Diego). Software sector
acquisitions to strengthen competitiveness in the Chinese home market are widespread (Table 3).
Online gaming has been particularly popular, with notable acquisitions of Riot Games by Tencent
in 2011, Mochi Media by Shanda Games in 2010, Cryptic Studios by Perfect World in 2011, and
Red 5 Studios by Th e9. E-commerce is another highly active area. Alibaba’s dual acquisitions of
Auctiva and Vendio Services in the summer of 2010 to boost its online payment platform are two
examples of this. Business applications and other software are also notable, exemplifi ed by HiSoft’s
acquisitions of Envisage Solutions (2007) and Echo Lane (2010).
Table 3: Top Chinese Acquisitions of California-Based Software and IT Firms, 2000–2011
Source: Rhodium Group. For sources and methodology, see appendix and http://rhgroup.net/interactive/china-investment-monitor.
Electronics and communication equipment are two other areas of great interest for Chinese fi rms.
With 19 investments and the third-highest cumulative deal value ($132 million), communications
equipment and services is a key sector for Chinese fi rms, mostly in the Los Angeles, San Diego,
and San Jose areas. Major Chinese suppliers of telecommunications equipment, including Huawei,
ZTE, and TP-Link, run sales and after-sales service operations in California. Th e Bay Area has also
attracted greenfi eld investment in R&D centers by Chinese fi rms. ZTE has had operations in San
Diego since 1998, and Huawei celebrated the opening of its new R&D center in Santa Clara in 2011.
Providers of telecommunications services such as China Unicom and China Telecom Americas run
offi ces in California and have invested signifi cant amounts in physical infrastructure such as points
of presence and data centers. Chinese communications equipment fi rms also have signifi cant interest
in upgrading their technology through acquisitions. In 2010, Huawei tried to acquire the assets
of bankrupt start-up fi rm 3Leaf but was rebuff ed by the Committee on Foreign Investment in
the United States. Spreadtrum Communication’s 2011 acquisition of WCDMA solutions provider
MobilePeak, meanwhile, makes clear that successful takeovers in the communications technology
sector are entirely possible.
Electronic equipment and components comes in fourth place with 16 investments, and another fi ve
investments in consumer electronics operations further emphasize the importance of this industry
Tencent Holdings Ltd
Shanda Games Ltd
Perfect World Co Ltd
Alibaba
HiSoft Tech Intl Ltd
The9 Ltd
MEMSIC Semiconductor
HiSoft Tech Intl Ltd.
Riot Games Inc
Mochi Media Inc
Cryptic Studios Inc
Auctiva, Vendio Services
Envisage Solutions
Red 5 Studios Inc
Crossbow Technology, Inc.
Echo Lane Inc
Los Angeles
San Francisco
Los Gatos
Chico, San Mateo
Irvine
Aliso Viejo
Milpitas
San Francisco
2011
2010
2011
2010
2007
2010
2010
2010
Acquiror Target Location Year Stake Millions USD
93
100
100
Majority
100
87
100
100
250
80
50
37
25
20
18
N/A
Rank
1
2
3
4
5
6
7
8
IV. DRIVERS AND TARGETED INDUSTRIES | 35
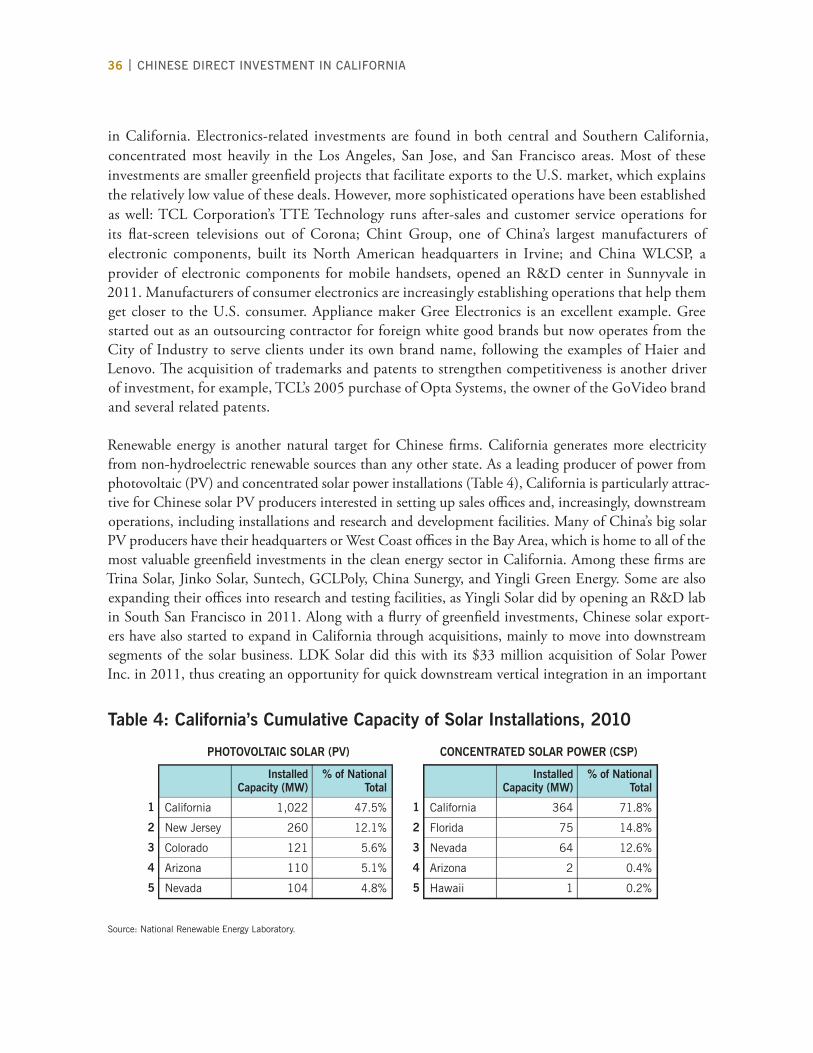
36 | CHINESE DIRECT INVESTMENT IN CALIFORNIA
in California. Electronics-related investments are found in both central and Southern California,
concentrated most heavily in the Los Angeles, San Jose, and San Francisco areas. Most of these
investments are smaller greenfi eld projects that facilitate exports to the U.S. market, which explains
the relatively low value of these deals. However, more sophisticated operations have been established
as well: TCL Corporation’s TTE Technology runs after-sales and customer service operations for
its fl at-screen televisions out of Corona; Chint Group, one of China’s largest manufacturers of
electronic components, built its North American headquarters in Irvine; and China WLCSP, a
provider of electronic components for mobile handsets, opened an R&D center in Sunnyvale in
2011. Manufacturers of consumer electronics are increasingly establishing operations that help them
get closer to the U.S. consumer. Appliance maker Gree Electronics is an excellent example. Gree
started out as an outsourcing contractor for foreign white good brands but now operates from the
City of Industry to serve clients under its own brand name, following the examples of Haier and
Lenovo. Th e acquisition of trademarks and patents to strengthen competitiveness is another driver
of investment, for example, TCL’s 2005 purchase of Opta Systems, the owner of the GoVideo brand
and several related patents.
Renewable energy is another natural target for Chinese fi rms. California generates more electricity
from non-hydroelectric renewable sources than any other state. As a leading producer of power from
photovoltaic (PV) and concentrated solar power installations (Table 4), California is particularly attrac-
tive for Chinese solar PV producers interested in setting up sales offi ces and, increasingly, downstream
operations, including installations and research and development facilities. Many of China’s big solar
PV producers have their headquarters or West Coast offi ces in the Bay Area, which is home to all of the
most valuable greenfi eld investments in the clean energy sector in California. Among these fi rms are
Trina Solar, Jinko Solar, Suntech, GCLPoly, China Sunergy, and Yingli Green Energy. Some are also
expanding their offi ces into research and testing facilities, as Yingli Solar did by opening an R&D lab
in South San Francisco in 2011. Along with a fl urry of greenfi eld investments, Chinese solar export-
ers have also started to expand in California through acquisitions, mainly to move into downstream
segments of the solar business. LDK Solar did this with its $33 million acquisition of Solar Power
Inc. in 2011, thus creating an opportunity for quick downstream vertical integration in an important
Table 4: California’s Cumulative Capacity of Solar Installations, 2010
Source: National Renewable Energy Laboratory.
California
New Jersey
Colorado
Arizona
Nevada
Installed Capacity (MW)
1,022
260
121
110
104
% of National Total
47.5%
12.1%
5.6%
5.1%
4.8%
1
2
3
4
5
California
Florida
Nevada
Arizona
Hawaii
Installed Capacity (MW)
364
75
64
2
1
% of National Total
71.8%
14.8%
12.6%
0.4%
0.2%
1
2
3
4
5
PHOTOVOLTAIC SOLAR (PV) CONCENTRATED SOLAR POWER (CSP)
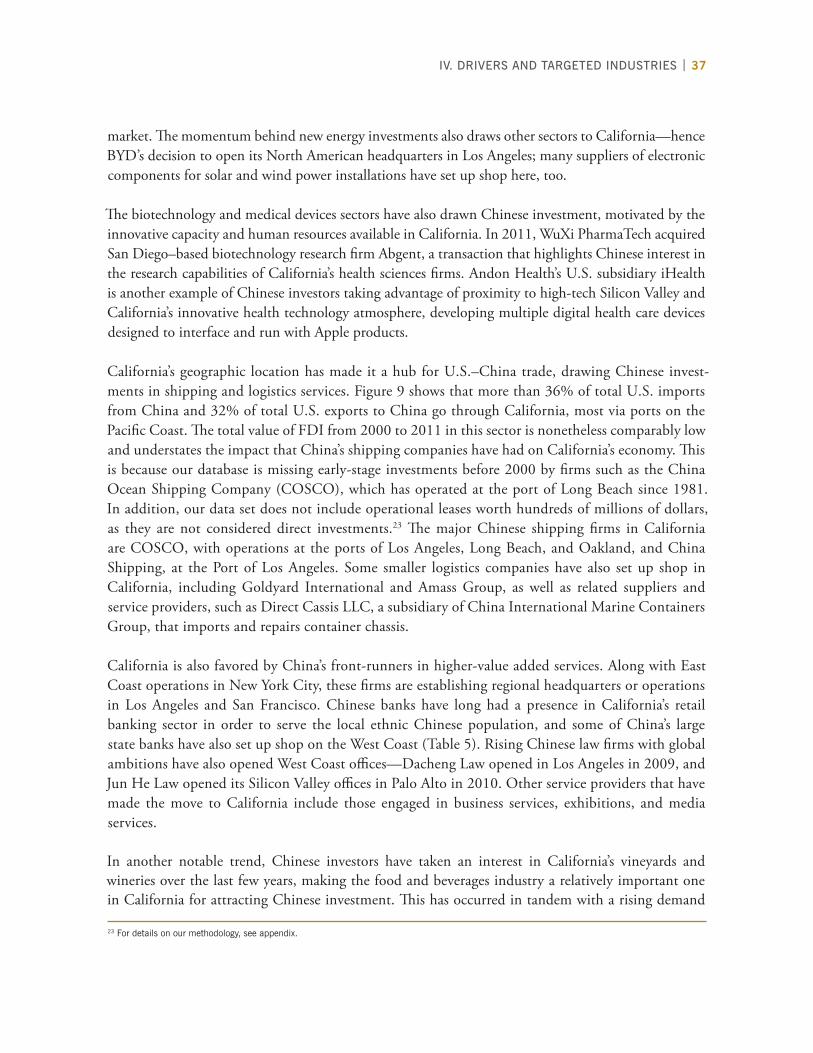
market. Th e momentum behind new energy investments also draws other sectors to California—hence
BYD’s decision to open its North American headquarters in Los Angeles; many suppliers of electronic
components for solar and wind power installations have set up shop here, too.
Th e biotechnology and medical devices sectors have also drawn Chinese investment, motivated by the
innovative capacity and human resources available in California. In 2011, WuXi PharmaTech acquired
San Diego–based biotechnology research fi rm Abgent, a transaction that highlights Chinese interest in
the research capabilities of California’s health sciences fi rms. Andon Health’s U.S. subsidiary iHealth
is another example of Chinese investors taking advantage of proximity to high-tech Silicon Valley and
California’s innovative health technology atmosphere, developing multiple digital health care devices
designed to interface and run with Apple products.
California’s geographic location has made it a hub for U.S.–China trade, drawing Chinese invest-
ments in shipping and logistics services. Figure 9 shows that more than 36% of total U.S. imports
from China and 32% of total U.S. exports to China go through California, most via ports on the
Pacifi c Coast. Th e total value of FDI from 2000 to 2011 in this sector is nonetheless comparably low
and understates the impact that China’s shipping companies have had on California’s economy. Th is
is because our database is missing early-stage investments before 2000 by fi rms such as the China
Ocean Shipping Company (COSCO), which has operated at the port of Long Beach since 1981.
In addition, our data set does not include operational leases worth hundreds of millions of dollars,
as they are not considered direct investments.23 Th e major Chinese shipping fi rms in California
are COSCO, with operations at the ports of Los Angeles, Long Beach, and Oakland, and China
Shipping, at the Port of Los Angeles. Some smaller logistics companies have also set up shop in
California, including Goldyard International and Amass Group, as well as related suppliers and
service providers, such as Direct Cassis LLC, a subsidiary of China International Marine Containers
Group, that imports and repairs container chassis.
California is also favored by China’s front-runners in higher-value added services. Along with East
Coast operations in New York City, these fi rms are establishing regional headquarters or operations
in Los Angeles and San Francisco. Chinese banks have long had a presence in California’s retail
banking sector in order to serve the local ethnic Chinese population, and some of China’s large
state banks have also set up shop on the West Coast (Table 5). Rising Chinese law fi rms with global
ambitions have also opened West Coast offi ces—Dacheng Law opened in Los Angeles in 2009, and
Jun He Law opened its Silicon Valley offi ces in Palo Alto in 2010. Other service providers that have
made the move to California include those engaged in business services, exhibitions, and media
services.
In another notable trend, Chinese investors have taken an interest in California’s vineyards and
wineries over the last few years, making the food and beverages industry a relatively important one
in California for attracting Chinese investment. Th is has occurred in tandem with a rising demand
23 For details on our methodology, see appendix.
IV. DRIVERS AND TARGETED INDUSTRIES | 37
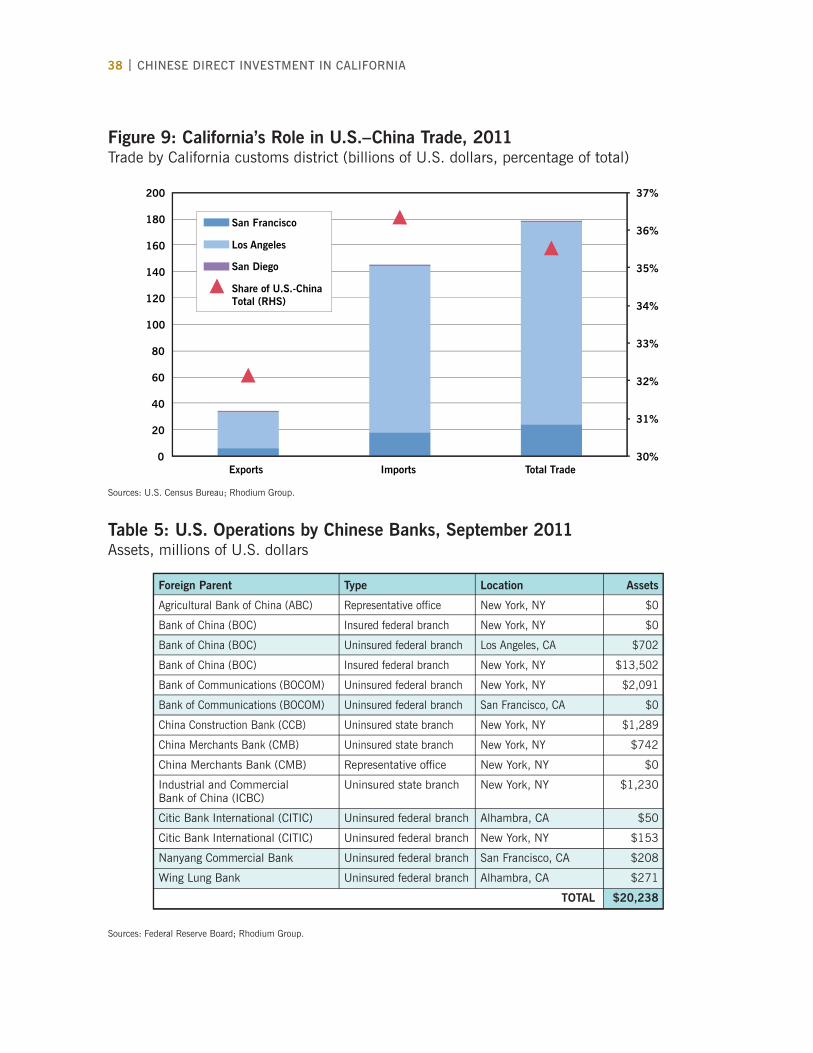
38 | CHINESE DIRECT INVESTMENT IN CALIFORNIA
Figure 9: California’s Role in U.S.–China Trade, 2011Trade by California customs district (billions of U.S. dollars, percentage of total)
Sources: U.S. Census Bureau; Rhodium Group.
Foreign Parent Type Location Assets
Agricultural Bank of China (ABC) Representative office New York, NY $0
Bank of China (BOC) Insured federal branch New York, NY $0
Bank of China (BOC) Uninsured federal branch Los Angeles, CA $702
Bank of China (BOC) Insured federal branch New York, NY $13,502
Bank of Communications (BOCOM) Uninsured federal branch New York, NY $2,091
Bank of Communications (BOCOM) Uninsured federal branch San Francisco, CA $0
China Construction Bank (CCB) Uninsured state branch New York, NY $1,289
China Merchants Bank (CMB) Uninsured state branch New York, NY $742
China Merchants Bank (CMB) Representative office New York, NY $0
Industrial and Commercial Uninsured state branch New York, NY $1,230Bank of China (ICBC)
Citic Bank International (CITIC) Uninsured federal branch Alhambra, CA $50
Citic Bank International (CITIC) Uninsured federal branch New York, NY $153
Nanyang Commercial Bank Uninsured federal branch San Francisco, CA $208
Wing Lung Bank Uninsured federal branch Alhambra, CA $271
30%
31%
32%
33%
34%
35%
36%
37%
0
20
40
60
80
100
120
140
160
180
200
Exports Imports Total Trade
San Francisco
Los Angeles
San Diego
Share of U.S.-China Total (RHS)
Table 5: U.S. Operations by Chinese Banks, September 2011Assets, millions of U.S. dollars
Sources: Federal Reserve Board; Rhodium Group.
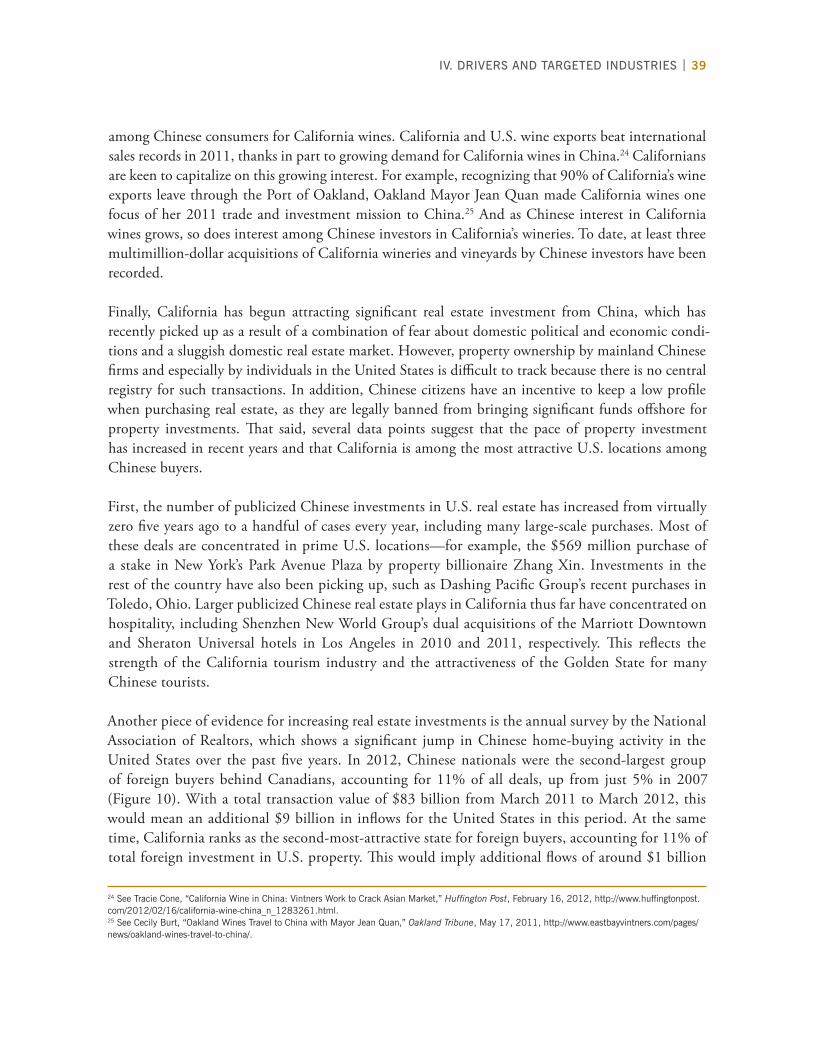
24 See Tracie Cone, “California Wine in China: Vintners Work to Crack Asian Market,” Huffi ngton Post, February 16, 2012, http://www.huffi ngtonpost.com/2012/02/16/california-wine-china_n_1283261.html.25 See Cecily Burt, “Oakland Wines Travel to China with Mayor Jean Quan,” Oakland Tribune, May 17, 2011, http://www.eastbayvintners.com/pages/news/oakland-wines-travel-to-china/.
among Chinese consumers for California wines. California and U.S. wine exports beat international
sales records in 2011, thanks in part to growing demand for California wines in China.24 Californians
are keen to capitalize on this growing interest. For example, recognizing that 90% of California’s wine
exports leave through the Port of Oakland, Oakland Mayor Jean Quan made California wines one
focus of her 2011 trade and investment mission to China.25 And as Chinese interest in California
wines grows, so does interest among Chinese investors in California’s wineries. To date, at least three
multimillion-dollar acquisitions of California wineries and vineyards by Chinese investors have been
recorded.
Finally, California has begun attracting signifi cant real estate investment from China, which has
recently picked up as a result of a combination of fear about domestic political and economic condi-
tions and a sluggish domestic real estate market. However, property ownership by mainland Chinese
fi rms and especially by individuals in the United States is diffi cult to track because there is no central
registry for such transactions. In addition, Chinese citizens have an incentive to keep a low profi le
when purchasing real estate, as they are legally banned from bringing signifi cant funds off shore for
property investments. Th at said, several data points suggest that the pace of property investment
has increased in recent years and that California is among the most attractive U.S. locations among
Chinese buyers.
First, the number of publicized Chinese investments in U.S. real estate has increased from virtually
zero fi ve years ago to a handful of cases every year, including many large-scale purchases. Most of
these deals are concentrated in prime U.S. locations—for example, the $569 million purchase of
a stake in New York’s Park Avenue Plaza by property billionaire Zhang Xin. Investments in the
rest of the country have also been picking up, such as Dashing Pacifi c Group’s recent purchases in
Toledo, Ohio. Larger publicized Chinese real estate plays in California thus far have concentrated on
hospitality, including Shenzhen New World Group’s dual acquisitions of the Marriott Downtown
and Sheraton Universal hotels in Los Angeles in 2010 and 2011, respectively. Th is refl ects the
strength of the California tourism industry and the attractiveness of the Golden State for many
Chinese tourists.
Another piece of evidence for increasing real estate investments is the annual survey by the National
Association of Realtors, which shows a signifi cant jump in Chinese home-buying activity in the
United States over the past fi ve years. In 2012, Chinese nationals were the second-largest group
of foreign buyers behind Canadians, accounting for 11% of all deals, up from just 5% in 2007
(Figure 10). With a total transaction value of $83 billion from March 2011 to March 2012, this
would mean an additional $9 billion in infl ows for the United States in this period. At the same
time, California ranks as the second-most-attractive state for foreign buyers, accounting for 11% of
total foreign investment in U.S. property. Th is would imply additional fl ows of around $1 billion
IV. DRIVERS AND TARGETED INDUSTRIES | 39
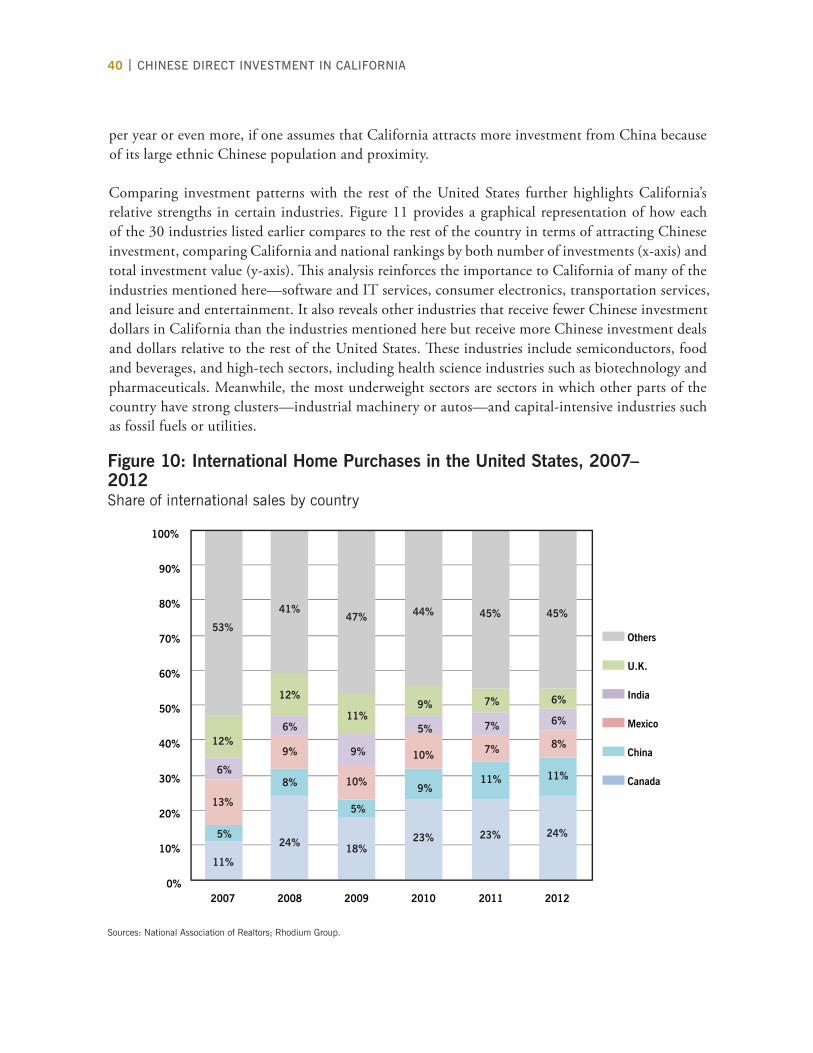
40 | CHINESE DIRECT INVESTMENT IN CALIFORNIA
per year or even more, if one assumes that California attracts more investment from China because
of its large ethnic Chinese population and proximity.
Comparing investment patterns with the rest of the United States further highlights California’s
relative strengths in certain industries. Figure 11 provides a graphical representation of how each
of the 30 industries listed earlier compares to the rest of the country in terms of attracting Chinese
investment, comparing California and national rankings by both number of investments (x-axis) and
total investment value (y-axis). Th is analysis reinforces the importance to California of many of the
industries mentioned here—software and IT services, consumer electronics, transportation services,
and leisure and entertainment. It also reveals other industries that receive fewer Chinese investment
dollars in California than the industries mentioned here but receive more Chinese investment deals
and dollars relative to the rest of the United States. Th ese industries include semiconductors, food
and beverages, and high-tech sectors, including health science industries such as biotechnology and
pharmaceuticals. Meanwhile, the most underweight sectors are sectors in which other parts of the
country have strong clusters—industrial machinery or autos—and capital-intensive industries such
as fossil fuels or utilities.
0%
10%
20%
30%
40%
50%
60%
70%
80%
90%
100%
2007 2008 2009 2010 2011 2012
Others
U.K.
India
Mexico
China
Canada 6%
6%
9%
5% 7% 6%
12%
12%
11% 9% 7% 6%
53%
41% 47% 44% 45% 45%
11%
24% 18% 23% 23% 24% 5%
8%
5%
9% 11% 11%
13%
9%
10%
10% 7% 8%
Figure 10: International Home Purchases in the United States, 2007–2012Share of international sales by country
Sources: National Association of Realtors; Rhodium Group.
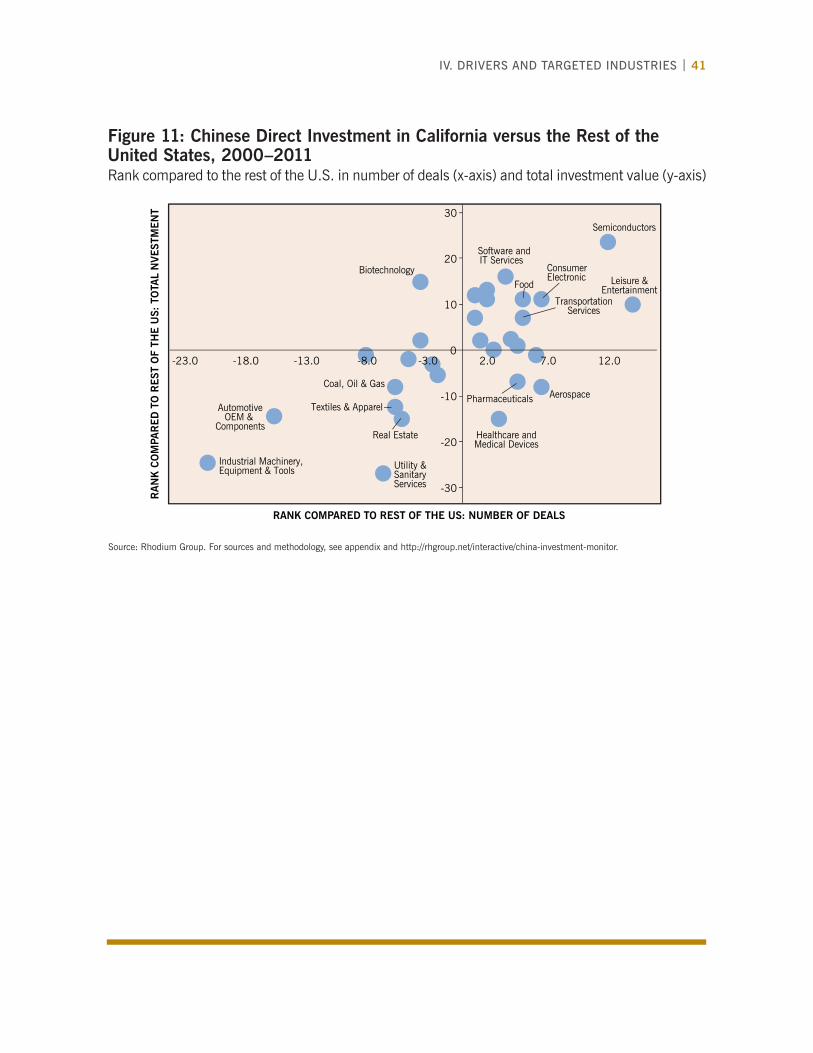
Figure 11: Chinese Direct Investment in California versus the Rest of the United States, 2000–2011Rank compared to the rest of the U.S. in number of deals (x-axis) and total investment value (y-axis)
Source: Rhodium Group. For sources and methodology, see appendix and http://rhgroup.net/interactive/china-investment-monitor.
IV. DRIVERS AND TARGETED INDUSTRIES | 41
-30
-20
-10
0
10
20
30
-23.0 -18.0 -13.0 -8.0 -3.0 2.0 7.0 12.0
RA
NK
CO
MPA
RED
TO
REST
OF
THE U
S: T
OTA
L N
VEST
MEN
T
RANK COMPARED TO REST OF THE US: NUMBER OF DEALS
Pharmaceuticals
Coal, Oil & Gas
Real Estate
Semiconductors
Leisure &Entertainment
AutomotiveOEM &
Components
Biotechnology
Industrial Machinery,Equipment & Tools Utility &
SanitaryServices
AerospaceTextiles & Apparel
Food
Healthcare andMedical Devices
Consumer Electronic
Transportation Services
Software and IT Services
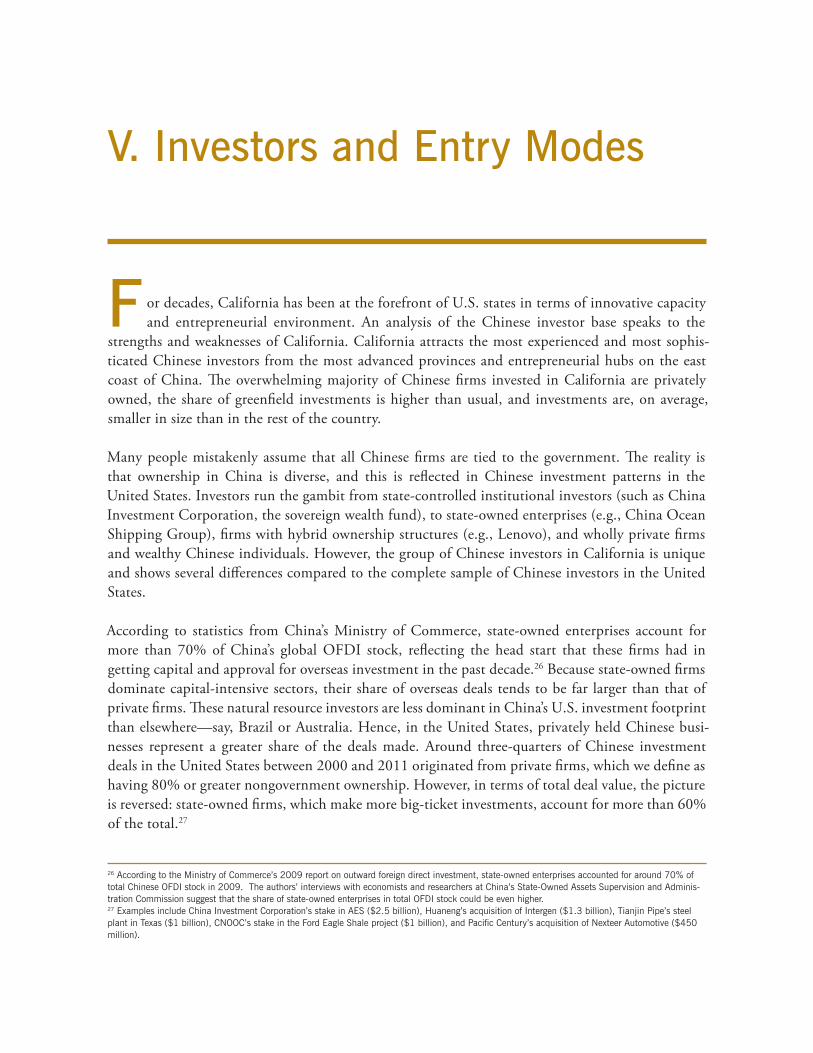
42 | CHINESE DIRECT INVESTMENT IN CALIFORNIA
F or decades, California has been at the forefront of U.S. states in terms of innovative capacity
and entrepreneurial environment. An analysis of the Chinese investor base speaks to the
strengths and weaknesses of California. California attracts the most experienced and most sophis-
ticated Chinese investors from the most advanced provinces and entrepreneurial hubs on the east
coast of China. Th e overwhelming majority of Chinese fi rms invested in California are privately
owned, the share of greenfi eld investments is higher than usual, and investments are, on average,
smaller in size than in the rest of the country.
Many people mistakenly assume that all Chinese fi rms are tied to the government. Th e reality is
that ownership in China is diverse, and this is refl ected in Chinese investment patterns in the
United States. Investors run the gambit from state-controlled institutional investors (such as China
Investment Corporation, the sovereign wealth fund), to state-owned enterprises (e.g., China Ocean
Shipping Group), fi rms with hybrid ownership structures (e.g., Lenovo), and wholly private fi rms
and wealthy Chinese individuals. However, the group of Chinese investors in California is unique
and shows several diff erences compared to the complete sample of Chinese investors in the United
States.
According to statistics from China’s Ministry of Commerce, state-owned enterprises account for
more than 70% of China’s global OFDI stock, refl ecting the head start that these fi rms had in
getting capital and approval for overseas investment in the past decade.26 Because state-owned fi rms
dominate capital-intensive sectors, their share of overseas deals tends to be far larger than that of
private fi rms. Th ese natural resource investors are less dominant in China’s U.S. investment footprint
than elsewhere—say, Brazil or Australia. Hence, in the United States, privately held Chinese busi-
nesses represent a greater share of the deals made. Around three-quarters of Chinese investment
deals in the United States between 2000 and 2011 originated from private fi rms, which we defi ne as
having 80% or greater nongovernment ownership. However, in terms of total deal value, the picture
is reversed: state-owned fi rms, which make more big-ticket investments, account for more than 60%
of the total.27
V. Investors and Entry Modes
26 According to the Ministry of Commerce’s 2009 report on outward foreign direct investment, state-owned enterprises accounted for around 70% of total Chinese OFDI stock in 2009. The authors’ interviews with economists and researchers at China’s State-Owned Assets Supervision and Adminis-tration Commission suggest that the share of state-owned enterprises in total OFDI stock could be even higher.27 Examples include China Investment Corporation’s stake in AES ($2.5 billion), Huaneng’s acquisition of Intergen ($1.3 billion), Tianjin Pipe’s steel plant in Texas ($1 billion), CNOOC’s stake in the Ford Eagle Shale project ($1 billion), and Pacifi c Century’s acquisition of Nexteer Automotive ($450 million).
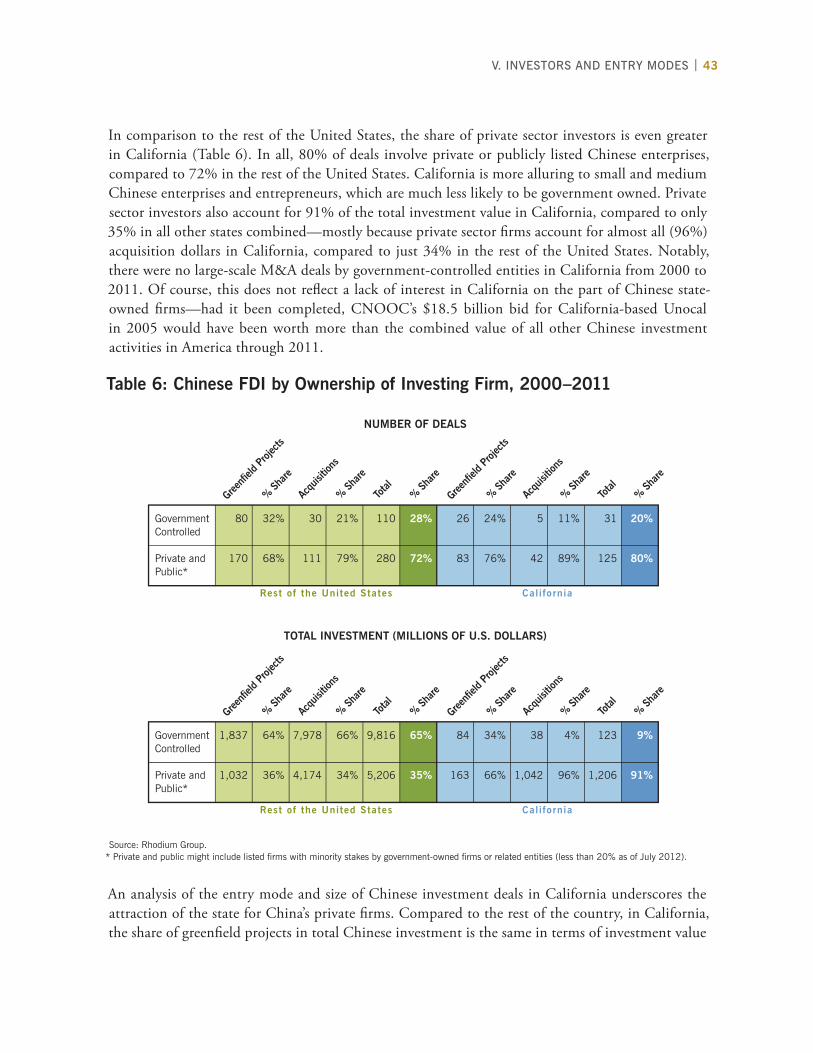
V. INVESTORS AND ENTRY MODES | 43
In comparison to the rest of the United States, the share of private sector investors is even greater
in California (Table 6). In all, 80% of deals involve private or publicly listed Chinese enterprises,
compared to 72% in the rest of the United States. California is more alluring to small and medium
Chinese enterprises and entrepreneurs, which are much less likely to be government owned. Private
sector investors also account for 91% of the total investment value in California, compared to only
35% in all other states combined—mostly because private sector fi rms account for almost all (96%)
acquisition dollars in California, compared to just 34% in the rest of the United States. Notably,
there were no large-scale M&A deals by government-controlled entities in California from 2000 to
2011. Of course, this does not refl ect a lack of interest in California on the part of Chinese state-
owned fi rms—had it been completed, CNOOC’s $18.5 billion bid for California-based Unocal
in 2005 would have been worth more than the combined value of all other Chinese investment
activities in America through 2011.
Table 6: Chinese FDI by Ownership of Investing Firm, 2000–2011
Source: Rhodium Group.* Private and public might include listed fi rms with minority stakes by government-owned fi rms or related entities (less than 20% as of July 2012).
An analysis of the entry mode and size of Chinese investment deals in California underscores the
attraction of the state for China’s private fi rms. Compared to the rest of the country, in California,
the share of greenfi eld projects in total Chinese investment is the same in terms of investment value
Government 80 32% 30 21% 110 28% 26 24% 5 11% 31 20% Controlled
Private and 170 68% 111 79% 280 72% 83 76% 42 89% 125 80% Public*
Greenfi
eld P
rojec
ts
% Share
% Share
% Share
Acqu
isitio
ns
Total
Greenfi
eld P
rojec
ts
% Share
% Share
% Share
Acqu
isitio
ns
Total
Government 1,837 64% 7,978 66% 9,816 65% 84 34% 38 4% 123 9% Controlled
Private and 1,032 36% 4,174 34% 5,206 35% 163 66% 1,042 96% 1,206 91% Public*
Greenfi
eld P
rojec
ts
% Share
% Share
% Share
Acqu
isitio
ns
Total
Greenfi
eld P
rojec
ts
% Share
% Share
% Share
Acqu
isitio
ns
Total
TOTAL INVESTMENT (MILLIONS OF U.S. DOLLARS)
NUMBER OF DEALS
Rest of the United States Cal i fornia
Rest of the United States Cal i fornia
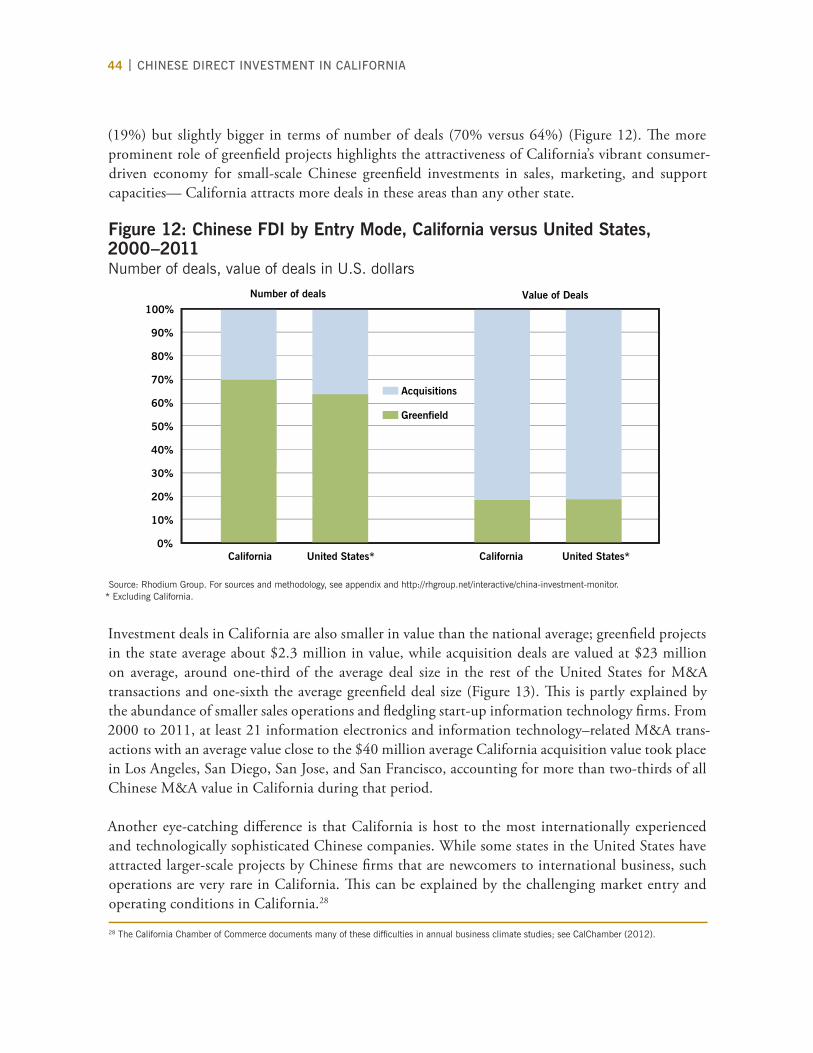
44 | CHINESE DIRECT INVESTMENT IN CALIFORNIA
(19%) but slightly bigger in terms of number of deals (70% versus 64%) (Figure 12). Th e more
prominent role of greenfi eld projects highlights the attractiveness of California’s vibrant consumer-
driven economy for small-scale Chinese greenfi eld investments in sales, marketing, and support
capacities— California attracts more deals in these areas than any other state.
Figure 12: Chinese FDI by Entry Mode, California versus United States, 2000–2011Number of deals, value of deals in U.S. dollars
Source: Rhodium Group. For sources and methodology, see appendix and http://rhgroup.net/interactive/china-investment-monitor.* Excluding California.
Investment deals in California are also smaller in value than the national average; greenfi eld projects
in the state average about $2.3 million in value, while acquisition deals are valued at $23 million
on average, around one-third of the average deal size in the rest of the United States for M&A
transactions and one-sixth the average greenfi eld deal size (Figure 13). Th is is partly explained by
the abundance of smaller sales operations and fl edgling start-up information technology fi rms. From
2000 to 2011, at least 21 information electronics and information technology–related M&A trans-
actions with an average value close to the $40 million average California acquisition value took place
in Los Angeles, San Diego, San Jose, and San Francisco, accounting for more than two-thirds of all
Chinese M&A value in California during that period.
Another eye-catching diff erence is that California is host to the most internationally experienced
and technologically sophisticated Chinese companies. While some states in the United States have
attracted larger-scale projects by Chinese fi rms that are newcomers to international business, such
operations are very rare in California. Th is can be explained by the challenging market entry and
operating conditions in California.28
28 The California Chamber of Commerce documents many of these diffi culties in annual business climate studies; see CalChamber (2012).
0%
10%
20%
30%
40%
50%
60%
70%
80%
90%
100%
California United States* California United States*
Acquisitions
Greenfield
Number of deals Value of Deals
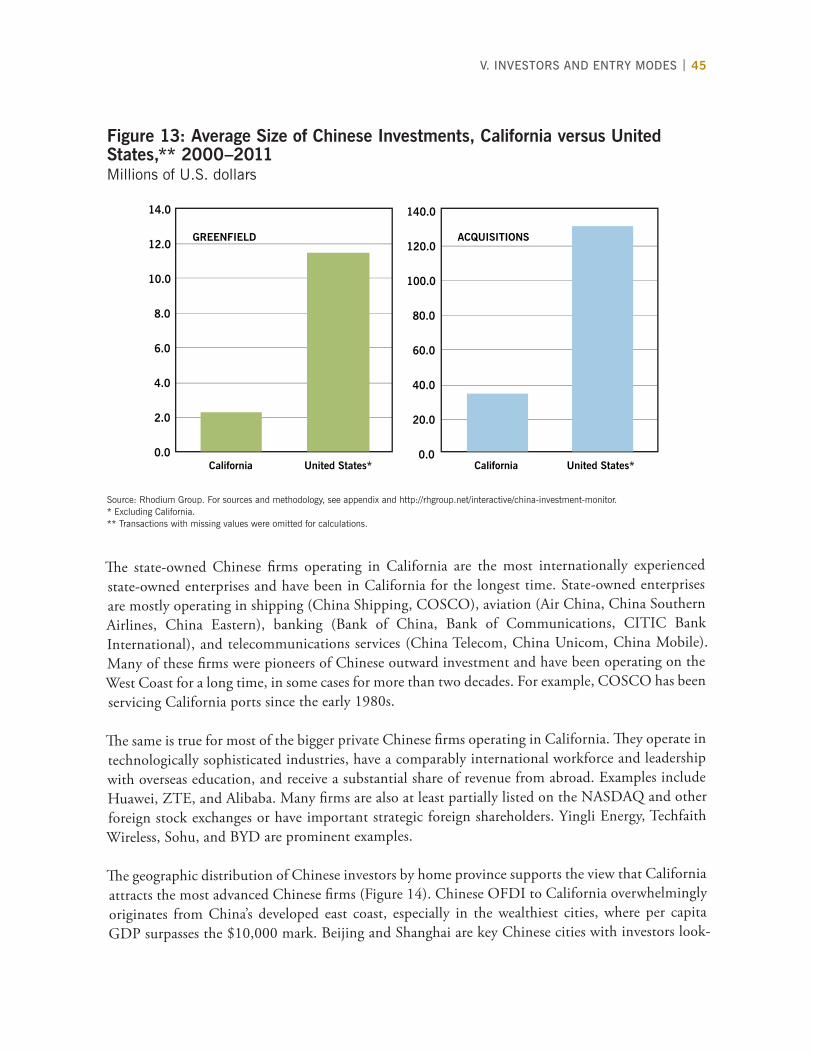
Th e state-owned Chinese fi rms operating in California are the most internationally experienced
state-owned enterprises and have been in California for the longest time. State-owned enterprises
are mostly operating in shipping (China Shipping, COSCO), aviation (Air China, China Southern
Airlines, China Eastern), banking (Bank of China, Bank of Communications, CITIC Bank
International), and telecommunications services (China Telecom, China Unicom, China Mobile).
Many of these fi rms were pioneers of Chinese outward investment and have been operating on the
West Coast for a long time, in some cases for more than two decades. For example, COSCO has been
servicing California ports since the early 1980s.
Th e same is true for most of the bigger private Chinese fi rms operating in California. Th ey operate in
technologically sophisticated industries, have a comparably international workforce and leadership
with overseas education, and receive a substantial share of revenue from abroad. Examples include
Huawei, ZTE, and Alibaba. Many fi rms are also at least partially listed on the NASDAQ and other
foreign stock exchanges or have important strategic foreign shareholders. Yingli Energy, Techfaith
Wireless, Sohu, and BYD are prominent examples.
Th e geographic distribution of Chinese investors by home province supports the view that California
attracts the most advanced Chinese fi rms (Figure 14). Chinese OFDI to California overwhelmingly
originates from China’s developed east coast, especially in the wealthiest cities, where per capita
GDP surpasses the $10,000 mark. Beijing and Shanghai are key Chinese cities with investors look-
Figure 13: Average Size of Chinese Investments, California versus United States,** 2000–2011Millions of U.S. dollars
Source: Rhodium Group. For sources and methodology, see appendix and http://rhgroup.net/interactive/china-investment-monitor.* Excluding California.** Transactions with missing values were omitted for calculations.
V. INVESTORS AND ENTRY MODES | 45
California United States*
GREENFIELD
California United States*
ACQUISITIONS
0.0
2.0
4.0
6.0
8.0
10.0
12.0
14.0
0.0
20.0
40.0
60.0
80.0
100.0
120.0
140.0
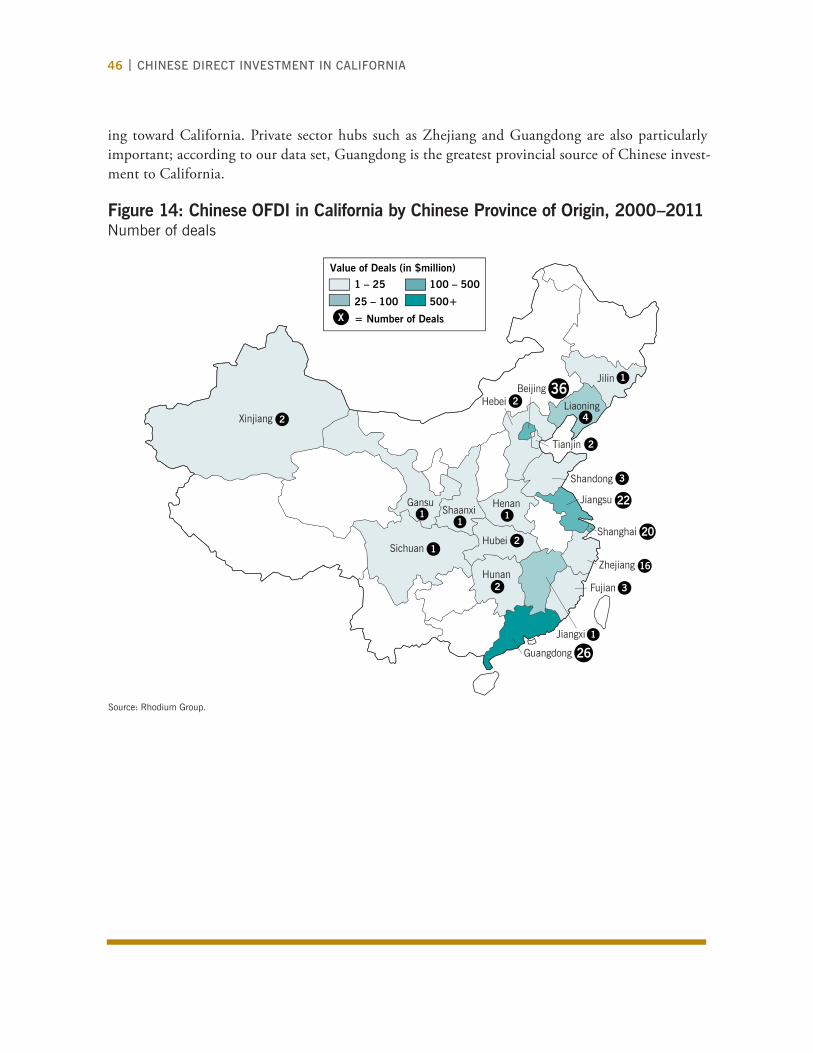
46 | CHINESE DIRECT INVESTMENT IN CALIFORNIA
ing toward California. Private sector hubs such as Zhejiang and Guangdong are also particularly
important; according to our data set, Guangdong is the greatest provincial source of Chinese invest-
ment to California.
Figure 14: Chinese OFDI in California by Chinese Province of Origin, 2000–2011Number of deals
Source: Rhodium Group.
2
2
2
111
Xinjiang
Hunan
Guangdong
Jiangxi
Fujian
Zhejiang
BeijingHebei Liaoning
Jilin
ShaanxiHenan
Tianjin
Shandong
Shanghai
Jiangsu
Hubei
Gansu
Value of Deals (in $million)
1 – 25
25 – 100
= Number of Deals
100 – 500
500+X
36
22
20
16
261
3
3
2
4
1
2
Sichuan 1

Y | 47
L ooking forward, the United States as a whole and California in particular can attract a signifi -
cant amount of investment dollars and related benefi ts. Despite rapid growth in recent years,
the Chinese investment boom is still in its early stages, and its impact on California’s economy is still
relatively small. Th e $1.6 billion of Chinese investment from 2000 to 2011 is miniscule compared
to the size of California’s economy and total investment from other sources, and Chinese companies
presently employ only a small share of California’s 18.5 million workers. In 2010, although China
accounted for 20% of the global population and 10% of global GDP, it contributed a mere 1.5% to
global FDI stocks (Figure 15).
China’s foreign investment stature remains dwarfed by the magnitude of its impressive domestic mod-
ernization and economic development. But China is catching up. If it follows the typical development
trajectory of other nations, the world can expect to see hundreds of billions of dollars in Chinese
overseas investment in the coming decade poured into resource-rich nations and highly developed
economies. Th ere is a tremendous opportunity to capture additional Chinese investment dollars in
the coming years as this wave approaches.
China’s Ministry of Commerce expects China to become a net exporter of FDI by around 2015.29 By
2020, China’s GDP likely will have surpassed $20 trillion, equivalent to GDP per capita of around
$14,000. If the traditional relationship between GDP growth and FDI fl ow holds, outward invest-
ment over these 10 years will grow quickly, even under conservative assumptions. Th e current low
OFDI-to-GDP ratio of 5% would yield $1 trillion in new OFDI through 2020 ($100 billion per year,
on average). If China’s ratio rises to the transitional economy average of 15%, outfl ows would amount
to roughly $3 trillion, or approximately $300 billion annually. Based on those projections, we place
our bet between these two fi gures, at $1 trillion to $2 trillion by 2020.
Given the shifting motives and necessities of Chinese fi rms, investment fl ows from China to devel-
oped economies will grow strongly in the coming years. Developed economies can expect to receive
a substantial share of the $1 trillion to $2 trillion in direct investment that China will place around
the world over the next decade. A precise estimate of the amount of Chinese investment fl owing to
the United States is impossible, but historical data off er a rough guideline of the potential magnitude.
In the past decade, the United States received about 17%, on average, of global FDI fl ows. If this
VI. The Potential for Future Growth
29 See Ding Qingfen, “Overseas Direct Investment to Grow,” China Daily, December 24, 2010, http://www.chinadaily.com.cn/bizchina/2010-12/24/content_11749290.htm.
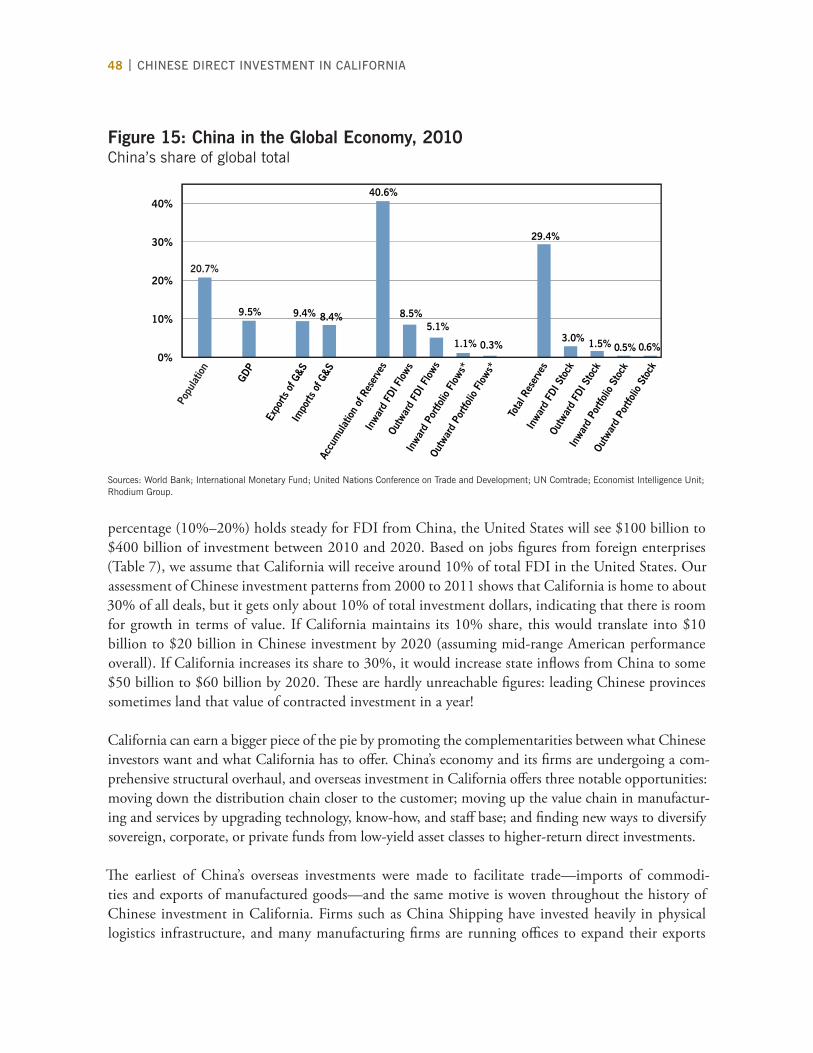
48 | CHINESE DIRECT INVESTMENT IN CALIFORNIA
percentage (10%–20%) holds steady for FDI from China, the United States will see $100 billion to
$400 billion of investment between 2010 and 2020. Based on jobs fi gures from foreign enterprises
(Table 7), we assume that California will receive around 10% of total FDI in the United States. Our
assessment of Chinese investment patterns from 2000 to 2011 shows that California is home to about
30% of all deals, but it gets only about 10% of total investment dollars, indicating that there is room
for growth in terms of value. If California maintains its 10% share, this would translate into $10
billion to $20 billion in Chinese investment by 2020 (assuming mid-range American performance
overall). If California increases its share to 30%, it would increase state infl ows from China to some
$50 billion to $60 billion by 2020. Th ese are hardly unreachable fi gures: leading Chinese provinces
sometimes land that value of contracted investment in a year!
California can earn a bigger piece of the pie by promoting the complementarities between what Chinese
investors want and what California has to off er. China’s economy and its fi rms are undergoing a com-
prehensive structural overhaul, and overseas investment in California off ers three notable opportunities:
moving down the distribution chain closer to the customer; moving up the value chain in manufactur-
ing and services by upgrading technology, know-how, and staff base; and fi nding new ways to diversify
sovereign, corporate, or private funds from low-yield asset classes to higher-return direct investments.
Th e earliest of China’s overseas investments were made to facilitate trade—imports of commodi-
ties and exports of manufactured goods—and the same motive is woven throughout the history of
Chinese investment in California. Firms such as China Shipping have invested heavily in physical
logistics infrastructure, and many manufacturing fi rms are running offi ces to expand their exports
Figure 15: China in the Global Economy, 2010China’s share of global total
Sources: World Bank; International Monetary Fund; United Nations Conference on Trade and Development; UN Comtrade; Economist Intelligence Unit; Rhodium Group.
20.7%
9.5% 9.4% 8.4%
40.6%
8.5% 5.1%
1.1% 0.3%
29.4%
3.0% 1.5% 0.5% 0.6% 0%
10%
20%
30%
40%
Popu
latio
n
GDP
Expo
rts o
f G&S
Im
ports
of G
&S
Accu
mul
atio
n of
Res
erve
s
Inwa
rd F
DI F
lows
Outw
ard
FDI F
lows
Inwa
rd P
ortfo
lio F
lows
*
Outw
ard
Portf
olio
Flo
ws*
Tota
l Res
erve
s In
ward
FDI
Sto
ck
Outw
ard
FDI S
tock
Inwa
rd P
ortfo
lio S
tock
Outw
ard
Portf
olio
Sto
ck
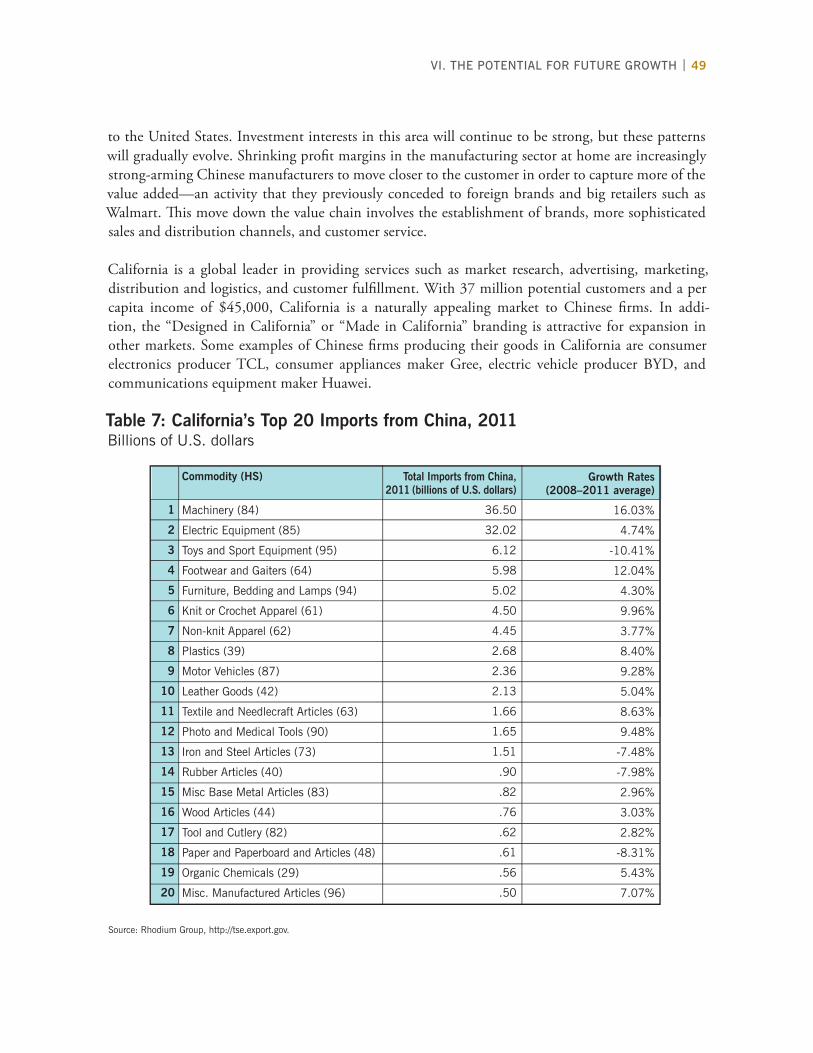
to the United States. Investment interests in this area will continue to be strong, but these patterns
will gradually evolve. Shrinking profi t margins in the manufacturing sector at home are increasingly
strong-arming Chinese manufacturers to move closer to the customer in order to capture more of the
value added—an activity that they previously conceded to foreign brands and big retailers such as
Walmart. Th is move down the value chain involves the establishment of brands, more sophisticated
sales and distribution channels, and customer service.
California is a global leader in providing services such as market research, advertising, marketing,
distribution and logistics, and customer fulfi llment. With 37 million potential customers and a per
capita income of $45,000, California is a naturally appealing market to Chinese fi rms. In addi-
tion, the “Designed in California” or “Made in California” branding is attractive for expansion in
other markets. Some examples of Chinese fi rms producing their goods in California are consumer
electronics producer TCL, consumer appliances maker Gree, electric vehicle producer BYD, and
communications equipment maker Huawei.
Table 7: California’s Top 20 Imports from China, 2011Billions of U.S. dollars
Source: Rhodium Group, http://tse.export.gov.
VI. THE POTENTIAL FOR FUTURE GROWTH | 49
Machinery (84)
Electric Equipment (85)
Toys and Sport Equipment (95)
Footwear and Gaiters (64)
Furniture, Bedding and Lamps (94)
Knit or Crochet Apparel (61)
Non-knit Apparel (62)
Plastics (39)
Motor Vehicles (87)
Leather Goods (42)
Textile and Needlecraft Articles (63)
Photo and Medical Tools (90)
Iron and Steel Articles (73)
Rubber Articles (40)
Misc Base Metal Articles (83)
Wood Articles (44)
Tool and Cutlery (82)
Paper and Paperboard and Articles (48)
Organic Chemicals (29)
Misc. Manufactured Articles (96)
Total Imports from China, 2011 (billions of U.S. dollars)
36.50
32.02
6.12
5.98
5.02
4.50
4.45
2.68
2.36
2.13
1.66
1.65
1.51
.90
.82
.76
.62
.61
.56
.50
Growth Rates(2008–2011 average)
16.03%
4.74%
-10.41%
12.04%
4.30%
9.96%
3.77%
8.40%
9.28%
5.04%
8.63%
9.48%
-7.48%
-7.98%
2.96%
3.03%
2.82%
-8.31%
5.43%
7.07%
Commodity (HS)
1
2
3
4
5
6
7
8
9
10
11
12
13
14
15
16
17
18
19
20

50 | CHINESE DIRECT INVESTMENT IN CALIFORNIA
Moving up the value chain is another priority for many Chinese fi rms. China can no longer compete
in low-value-added light manufacturing industries based solely on cheap labor and scale. Firms are
being forced to move into new products in order to maintain export growth and to compete for
domestic market share against foreign multinationals. Th ese measures require technology upgrades,
better-trained staff , and a greater range of manufacturing-related service activities such as R&D and
quality control. With its innovative capacity, unique human resources, and vast experience, California
off ers unrivaled opportunities for investors looking to move up the value chain.
Firms drawn to California to upgrade manufacturing value chains are likely to deal in sectors in which
California has been traditionally strong, such as communications equipment, consumer electronics,
renewable energy, and information technology. Chinese fi rms have begun acquiring assets, investing
in R&D operations, and hiring qualifi ed staff in these industries in recent years. More important than
actual hard technology is human talent and the experience of the local workforce in higher-value-
added activities. Th is is a key value proposition for Chinese fi rms coming to California. Huawei’s
expansion through signifi cant local hiring and acquisitions is an example. Chinese fi rms will be most
interested in investing in sectors in which California has a strong advantage over global competition.
Table 8 lists sectors in which California leads in traded goods. Firms in high-tech sectors designated
as strategic by the Chinese government have a particular interest in investing in sectors such as
energy-saving technologies, environmental remediation, biotechnology, and new energy vehicles,
which defi ne the leading edge of California’s high-tech economy.30
Along with electronics, optical instruments, and other high-tech goods, California is particularly
strong in agriculture. California not only has a large agricultural sector, but also has learned to create
value beyond land and labor intensity. Facing a land shortage, rising rural wages, and widespread
quality control problems, China could greatly benefi t from moving up the value chain in California,
and we have seen the fi rst ventures begin in the past two years.
Along with upgrading the manufacturing sector, there are tremendous benefi ts to above-trend service
sector growth in China in the coming years. Th e focus on light manufacturing and infrastructure build-
out has left China with one of the smallest service sectors in the world relative to its GDP (Figure 16).
Higher-value-added services in particular are in the very early stages of development. Th e macroeconomic
rebalancing process that China will go through in the coming years is expected to shift huge amounts of
capital from manufacturing, real estate, and infrastructure into service sector activity. Th is will lead to a
breakup of traditional service sector monopolies, as is currently happening in the Chinese banking sector.
For fi rms looking for a competitive edge in the coming service sector boom, California is a natural target
as a leader in creating services value added. Its investment history highlights that California is already a
preferred investment target in specifi c service clusters such as software development and biotechnology.
Other traditionally strong service industries that are underdeveloped in China, such as entertainment or
education, have received more interest from Chinese investors in the past two years, and there remains
a huge potential to expand Chinese investment in modern service sector activities.
30 See Lan Lan, “Nation Seeks Strategic Industries’ Development,” China Daily, July 24, 2012, http://www.chinadaily.com.cn/china/2012-07/24/con-tent_15610285.htm.

Table 8: California’s Revealed Comparative Advantage (RCA) in Traded GoodsRCA ratio, billions of U.S. dollars, percent growth
Sources: USATrade; UN Comtrade; World Bank; Rhodium Group.Revealed comparative advantage (RCA) is an index used for calculating the relative strength of a specifi c region in producing certain goods from trade fi gures. It is calculated by dividing the proportion of the region’s total exports composed of a certain class of goods or services by the proportion of total global exports composed of the same class of goods or services. Our RCA values are an average of California’s annual RCA statistics from 2007 to 2009 based on data from the United Nations’ Comtrade database and the U.S. Census Bureau.
VI. THE POTENTIAL FOR FUTURE GROWTH | 51
Commodity (HS Code)
Fruits and nuts (8)
Musical Instruments (92)
Arms and ammunition (93)
Optic and medical Tools (90)
Aerospace (88)
Pulp and waste paper (47)
Misc edible preparations (21)
Edible vegetables (7)
Art and antiques (97)
Photo and film goods (37)
Prep vegetables (20)
Chemical products (38)
Cotton products (52)
Toys and sport equipment (95)
Base metals and cements (81)
Electric equipment (85)
Misc animal products (5)
Misc plant products (12)
Explosives and pyrotechnics (36)
Beverages and spirits (22)
Dairy products and honey (4)
Nuclear machinery (84)
Egg and starch products (35)
Precious metals and jewels (71)
Vegetable plaiting materials (14)
Cosmetic perfumes and oils (33)
Knitted or crocheted fabrics (60)
Aluminum articles (76)
Printed items (49)
Revealed Comparative Advantage*
8.63
4.13
3.84
3.41
3.41
3.19
2.78
2.52
2.41
2.37
1.76
1.67
1.66
1.65
1.58
1.55
1.49
1.45
1.38
1.33
1.24
1.24
1.23
1.22
1.15
1.12
1.08
1.02
1.02
Export Growth (2003-2011 Average)
12.6%
5.7%
-0.3%
6.8%
3.9%
13.5%
5.1%
6.6%
12.4%
3.5%
9.8%
7.3%
2.6%
4.0%
17.8%
2.5%
5.9%
7.8%
1.4%
9.5%
26.2%
4.0%
16.0%
26.5%
5.4%
9.5%
0.9%
12.3%
-1.9%
Total Exports 2011 ($ billion)
8.00
0.26
0.35
16.67
6.67
1.40
1.39
1.30
0.37
0.21
0.97
2.21
1.04
1.45
0.36
28.35
0.16
1.01
0.04
1.53
1.39
27.45
0.32
6.88
0.01
1.09
0.22
1.66
0.40
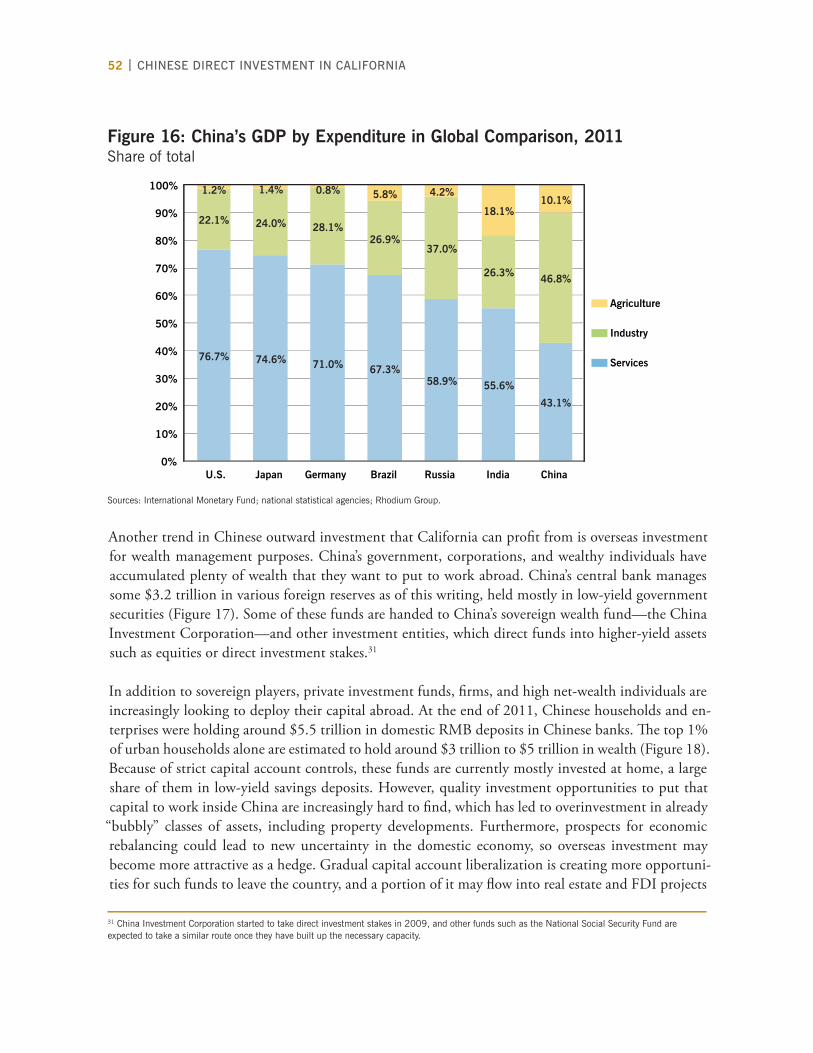
52 | CHINESE DIRECT INVESTMENT IN CALIFORNIA
Another trend in Chinese outward investment that California can profi t from is overseas investment
for wealth management purposes. China’s government, corporations, and wealthy individuals have
accumulated plenty of wealth that they want to put to work abroad. China’s central bank manages
some $3.2 trillion in various foreign reserves as of this writing, held mostly in low-yield government
securities (Figure 17). Some of these funds are handed to China’s sovereign wealth fund—the China
Investment Corporation—and other investment entities, which direct funds into higher-yield assets
such as equities or direct investment stakes.31
In addition to sovereign players, private investment funds, fi rms, and high net-wealth individuals are
increasingly looking to deploy their capital abroad. At the end of 2011, Chinese households and en-
terprises were holding around $5.5 trillion in domestic RMB deposits in Chinese banks. Th e top 1%
of urban households alone are estimated to hold around $3 trillion to $5 trillion in wealth (Figure 18).
Because of strict capital account controls, these funds are currently mostly invested at home, a large
share of them in low-yield savings deposits. However, quality investment opportunities to put that
capital to work inside China are increasingly hard to fi nd, which has led to overinvestment in already
“bubbly” classes of assets, including property developments. Furthermore, prospects for economic
rebalancing could lead to new uncertainty in the domestic economy, so overseas investment may
become more attractive as a hedge. Gradual capital account liberalization is creating more opportuni-
ties for such funds to leave the country, and a portion of it may fl ow into real estate and FDI projects
Figure 16: China’s GDP by Expenditure in Global Comparison, 2011Share of total
Sources: International Monetary Fund; national statistical agencies; Rhodium Group.
31 China Investment Corporation started to take direct investment stakes in 2009, and other funds such as the National Social Security Fund are expected to take a similar route once they have built up the necessary capacity.
0%
10%
20%
30%
40%
50%
60%
70%
80%
90%
100%
U.S. Japan Germany Brazil Russia India China
Agriculture
Industry
Services 76.7% 74.6% 71.0% 67.3% 58.9% 55.6%
43.1%
22.1% 24.0% 28.1% 26.9%
37.0%
26.3% 46.8%
1.2% 1.4% 0.8% 5.8% 4.2%
18.1% 10.1%
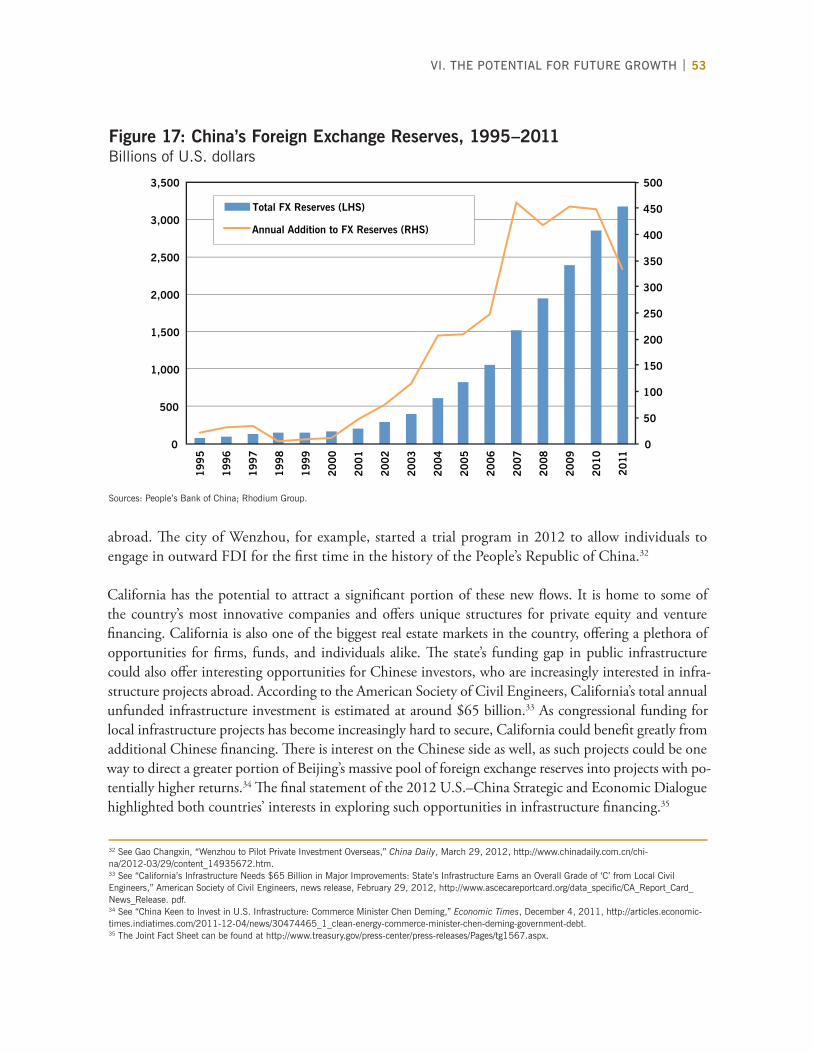
abroad. Th e city of Wenzhou, for example, started a trial program in 2012 to allow individuals to
engage in outward FDI for the fi rst time in the history of the People’s Republic of China.32
California has the potential to attract a signifi cant portion of these new fl ows. It is home to some of
the country’s most innovative companies and off ers unique structures for private equity and venture
fi nancing. California is also one of the biggest real estate markets in the country, off ering a plethora of
opportunities for fi rms, funds, and individuals alike. Th e state’s funding gap in public infrastructure
could also off er interesting opportunities for Chinese investors, who are increasingly interested in infra-
structure projects abroad. According to the American Society of Civil Engineers, California’s total annual
unfunded infrastructure investment is estimated at around $65 billion.33 As congressional funding for
local infrastructure projects has become increasingly hard to secure, California could benefi t greatly from
additional Chinese fi nancing. Th ere is interest on the Chinese side as well, as such projects could be one
way to direct a greater portion of Beijing’s massive pool of foreign exchange reserves into projects with po-
tentially higher returns.34 Th e fi nal statement of the 2012 U.S.–China Strategic and Economic Dialogue
highlighted both countries’ interests in exploring such opportunities in infrastructure fi nancing.35
Figure 17: China’s Foreign Exchange Reserves, 1995–2011Billions of U.S. dollars
Sources: People’s Bank of China; Rhodium Group.
32 See Gao Changxin, “Wenzhou to Pilot Private Investment Overseas,” China Daily, March 29, 2012, http://www.chinadaily.com.cn/chi-na/2012-03/29/content_14935672.htm.33 See “California’s Infrastructure Needs $65 Billion in Major Improvements: State’s Infrastructure Earns an Overall Grade of ‘C’ from Local Civil Engineers,” American Society of Civil Engineers, news release, February 29, 2012, http://www.ascecareportcard.org/data_specifi c/CA_Report_Card_ News_Release. pdf.34 See “China Keen to Invest in U.S. Infrastructure: Commerce Minister Chen Deming,” Economic Times, December 4, 2011, http://articles.economic-times.indiatimes.com/2011-12-04/news/30474465_1_clean-energy-commerce-minister-chen-deming-government-debt.35 The Joint Fact Sheet can be found at http://www.treasury.gov/press-center/press-releases/Pages/tg1567.aspx.
VI. THE POTENTIAL FOR FUTURE GROWTH | 53
0
50
100
150
200
250
300
350
400
450
500
0
500
1,000
1,500
2,000
2,500
3,000
3,500
1995
1996
1997
1998
1999
2000
2001
2002
2003
2004
2005
2006
2007
2008
2009
2010
2011
Total FX Reserves (LHS)
Annual Addition to FX Reserves (RHS)

54 | CHINESE DIRECT INVESTMENT IN CALIFORNIA
Figure 18: Estimated Wealth of China’s Top 1% Urban Households, 2010Trillions of U.S. dollars
Source: Rhodium Group, based on data from Shi (2011). Victor Shi estimates the wealth of the top 1% urban households in China based on data on household income (“Income Approach”), the Hurun Report (“Hurun Approach”) and offi cial statistics on fi nancial assets such as bank deposits and bond and equity holdings (“Financial Assets Approach”).
0
1
2
3
4
5
6
Income Approach Hurun Approach Financial Assets Approach
High
Medium
Low

Y | 55
F or more than a century, the United States has been the premier global destination for direct
investment, with little need for self-promotion.36 However, maintaining this premier status
requires tremendous eff ort. Th e United States is still the world’s largest economy, but it is no longer
the unparalleled destination for investment that it once was. Household consumption growth—the
biggest attraction of the past 100 years—is moderating, and America’s technological lead, while still
considerable, is narrowing.
California needs to redouble its eff orts, too. Th e Golden State is at the forefront of the Chinese
investment boom in the United States, and it attracts more deals than any other state with its unri-
valled market size, geographic position, ethnic diversity, and advanced industry mix. But with smaller
average investments, California is only fi fth among U.S. states for Chinese investment by value—
respectable, but far from impressive for an economy that is 60% bigger than the next-largest state
(Texas). California will be increasingly attractive as Chinese investors become more sophisticated, but
competition from other states is intensifying at least as quickly. It is clear that in order for California
to maintain its position—let alone move up the ranks—a wide group of stakeholders will have to
work together to build a long-term strategy and implement it eff ectively.
Th e stakes are signifi cant. If California can marshal its assets and sustain current investor interest, we
estimate that it can land $20 billion in new Chinese infl ows by 2020; if strategy and execution elevate
state performance to its full potential, infl ows could reach as high as $60 billion. Creating that strategy
will require coordination and teamwork. Private sector business leaders, investment facilitators, value
chain partners, the research and academic communities, and nongovernmental organizations need to
work together with leadership from Sacramento. Th at foundation of stakeholder collaboration is irre-
placeable. From an analysis of California’s share in 547 Chinese investments in the United States since
2000, this study provides the data and perspective to formulate a coherent strategy. We identify the
following four initial steps toward a long-term strategy to sustain investment from China in California.
1. Understand China’s needs and California’s value.Amid tough competition for Chinese capital, a thorough understanding of both Chinese motives
and what California has to off er is the cornerstone of a strategy to promote Chinese investment. Th is
report lays out the push and pull factors compelling Chinese fi rms to consider a U.S. presence.37
Conclusions: Working Together to Maximize Benefi ts
36 See Wilkins (1989).37 For a more extensive analysis, see Rosen and Hanemann (2011) and Hanemann and Rosen (2012).
56 | CHINESE DIRECT INVESTMENT IN CALIFORNIA
Firms are seeking to grow profi ts, defend existing market shares, and enhance operations to combat
eroding profi t margins back home. Th ey will take advantage of state support when available, but they
will not cross the ocean unless the market opportunity is clear. Understanding these characteristics is
vital to developing a relationship with Chinese investors. Th ough not all considerations apply to any
one Chinese potential investor, based on our extensive research on the motives for Chinese overseas
investment and an analysis of more than 500 U.S. deals, we believe that California should focus on
fi ve value propositions to market the state to Chinese investors:
First, Chinese fi rms, especially those in higher-value segments, need access to large, sophisticated
foreign markets. California has the largest state market in the country, and it is the principal gateway
to the rest of the U.S. marketplace. Th ese market opportunities apply to all of the fi rms currently
serving the United States through the export model. But there are also massive long-term investment
opportunities for China’s institutional investors and infrastructure services fi rms. Th e United States
needs investment in infrastructure and long-term projects, and California in particular, with its strong
economy, is ideal for long-term investors from China.
Second, China’s storied manufacturers are under heavy pressure to advance their process and produc-
tion methods or else risk bankruptcy, takeover, or a drawn-out hemorrhage of money. California
is world beating in high-value-added manufacturing, and it is a national leader in many of the high-
technology industries Chinese policy and fi rms target. Th e state has a clear comparative advantage in
aircraft, medical devices and instruments, as well as high-end foodstuff s and other agriculture. With
its clusters of capital, higher education, hard and soft intellectual property, and production facilities,
California is the place for Chinese fi rms to learn how to manage quality-intensive manufacturing
processes that will distinguish them from their competition at home and abroad. China-based export-
ers to the United States are increasingly aware that competitors closer to American customers can
provide better value, for the same reasons that U.S. fi rms with operations in China typically do better
than those that stay at home.
Th ird, a similar urgency exists in the services sector, where California is also in a globally strong position.
Th ere are two components of service sector deepening that are important to China. As newcomers
to the era of consumption-heavy economic growth, China’s fi rms are playing catch-up in producing
high-value services for fi nal consumption by middle-income and higher households—services rang-
ing from health care to entertainment to hospitality. Second, driven by the intensifying competition
of domestic markets, fi rms are belatedly rushing to absorb intermediate services capabilities into their
traditional primary and secondary sector (agriculture and manufacturing) activities. More advanced
advertising, marketing, customer relations, design, engineering, and myriad other business service
inputs are as underdeveloped in most of China as they are abundant and world-class in California,
and this is a major potential draw for Chinese interest.
A fourth driver is the weakness of human resources at home and the need to recruit talented and
experienced staff overseas. California possesses a deep endowment of human talent available to join
with foreign ventures and, moreover, a legacy of cultural familiarity and diversity. With the nation’s
largest ethnic Chinese population and the largest number of successful Chinese investments to date,
California has a trove of valuable experience to tap into to help new entrants feel more comfortable
with an unfamiliar investment environment. Th ese precursor fl ows of people and deals are powerful
evidence of the value proposition which California presents to China.
Fifth and fi nally, California’s quality of life is a signifi cant attraction to Chinese investors. Th e Golden
State has a reputation for its lifestyle, environmental quality, great public and private education, reli-
able legal protections, and due process for property, as well as many other intangible assets. More
than being just the biggest marketplace among American states, California can proudly proclaim itself
the most welcoming U.S. destination for China’s private and entrepreneurial businesses, the most
dynamic engine of growth for China’s future. Th at is part of the branding of California as a place of
opportunity. Understanding this value proposition leads directly to the right marketing strategy for
China.
It is also critical to consider several downside liabilities of California from the perspective of potential
Chinese investors. Th ere is a glaring disconnect between California’s high ranking in technology and
innovation and access to capital and its cost of doing business and perceived business friendliness.
On the latter criteria, California routinely ranks near the absolute bottom in independent surveys.38
Coming from very cost-conscious origins, fi rms from China may be particularly put off by the high
operating costs prevalent on the West Coast. Looking ahead, California’s looming fi scal instability
is another serious concern, and one not missed by potential Chinese investors, who must wonder
whether the public component of public–private partnerships can be fulfi lled, whether tax assess-
ments are likely to surge, or whether partners in the production chain will be tempted by other states
to decamp in pursuit of better operating environments.
2. Target the right Chinese fi rms. Th e analytics developed in this study provide the starting point for segmenting and prioritizing prospects
in a nation of almost 5 million businesses.39 Not all of the investors coming out of China will be
interested in California or serve the state’s long-term objectives. A proactive eff ort to reach fi rms that are
better suited to California’s conditions can be built based on evidence of previous successful investments.
For starters, California is the place to go for China’s private fi rms. Entrepreneurs and small and
medium-sized enterprises value California for its advanced legal structures, openness to new products
and partners, worldliness toward non-Americans, and strong business facilitation services, among
other advantages. Eff orts to recruit Chinese investors therefore should emphasize Shanghai, Zhejiang,
Guangdong, and other bastions of Chinese entrepreneurialism.
Within China’s nascent private sector, there is a considerable range of capabilities and sophistica-
tion. California is not the easiest or the cheapest state in which to run a business, and the fi rms
that see the value proposition will, by necessity, be more advanced. More mature fi rms with some
38 See, for example, CNBC’s “Top States” rankings, 2012, at http://www.cnbc.com/id/46414924. 39 Figure based on data from the 2008 National Economic Census, National Bureau of Statistics of China.
CONCLUSIONS: WORKING TOGETHER TO MAXIMIZE BENEFITS | 57

58 | CHINESE DIRECT INVESTMENT IN CALIFORNIA
international exposure are far less likely to be put off by California’s high costs. Higher-technology
but lower-maturity start-ups and innovative industry investors may be an exception, as they tend
to possess international exposure and familiarity with advanced economy operating costs at an early
stage of development.
California’s economy is larger than all but eight nations globally,40 and it has ample room for all
industries, but there are nonetheless clear sectoral patterns in Chinese investment. Table 2 in Section
3 of this report summarizes the top sectors for Chinese presence in California by value and number
of deals. In each of these sectors, state investment offi cials should be capitalizing on past successes
to make the case to the next generation of Chinese outbound investors; nothing motivates like the
knowledge that your competitor is already doing something.
At the same time, while working-level teams market based on past successes, California’s leaders must
not forget that we are at the earliest stage of Chinese OFDI in the United States, and at this low
baseline, one deal—such as the Unocal case—could rewrite expectations of what success looks like
overnight. China is dominated by large institutional investors, including wealth funds and industrial
conglomerates, and while investment promotion offi cials pursue a targeted approach, state leaders
should systematically maintain an open line to these investment giants regardless of industrial sector.
A personal outreach to China’s 100 largest fi rms is well within the capacity of the governor’s offi ce.
3. Overhaul the institutional setup for investment promotion. A successful outreach to promote foreign investment will require California (and the United States
as a whole) to adjust. Th e traditional hands-off approach to investment promotion is outdated, as of-
fi cials from the President to local mayors now agree. Not only is the United States no longer unrivaled
as a destination for FDI, but also the landscape of investors is changing. A new generation of investors
from China and other emerging markets needs local partners and facilitators more urgently than the
traditional investors from Europe and developed Asia. Chinese investors are less familiar with Western
culture and business practices, they are rooted in a diff erent regulatory environment (“capitalism with
Chinese characteristics”), and they have relatively little experience operating abroad. Active invest-
ment promotion can help overcome negative preconceptions of the U.S. investment environment
stemming from a handful of politicized past deals.
Steps to improve investment promotion at the federal level are already under way. Th e Obama ad-
ministration’s SelectUSA initiative, launched in 2011, is one example. Other steps include eff orts to
streamline burdensome visa processing and better Treasury Department outreach to clarify mispercep-
tions about national security screening. While Washington-based national security and immigration
policies are systemic impediments to Chinese fi rms and businessmen, a positive set of incentives must
come from state and local governments. Unlike China, in the United States, the central government
does not designate special economic zones or hand out privileges for inbound foreign investors; those
are state-level prerogatives. Th erefore, the battle for China’s investment dollars will be fought at the
40 Based on 2011 GDP statistics from the World Bank and U.S. Bureau of Economic Analysis.

state and municipal levels, where local infrastructure, industry clusters orbiting public goods such
as colleges, universities, and research laboratories, proximity to thriving markets, state and local tax
holidays, human resource pools, local union and labor laws, and other subnational operating variables
will defi ne the landscape for Chinese investment.
Actively crafting an effi cient mix of these variables (attractive enough to lure investors but not erosive
to the tax base, environmental quality, or other aspects of welfare) will require state and local institu-
tions to be proactive. Compared to other states, California has good institutions at the city level, but
it lags far behind at the state level (for details, see Box 3). Given the needs of Chinese investors and
other states’ experience, the following changes are intuitive:
First, California should establish a state-level agency to coordinate local eff orts to promote Chinese
investment. A handful of California’s local investment promotion institutions are among the best in
the nation, and yet they lack a strong state institution to unify their eff orts. Th is leaves considerable
synergistic potential untapped. A state institution responsible for coordinating investment promotion
eff orts would expand California’s investment promotion network and extend benefi ts to smaller mu-
nicipalities that lack the means to engage in their own signifi cant investment promotion eff orts. Such
an institution could serve as a one-stop shop for Chinese and other foreign investors, helping them
identify investment opportunities across the state and directing them to local investment promotion
agencies when appropriate. GO-Biz, created by Governor Jerry Brown’s administration earlier this
year, is a step in the right direction, but it needs to be given the necessary resources to take a leadership
role.
Second, California should create a local presence in China. Th e most eff ective state- and municipal-
level Chinese investment promotion eff orts tend to include a physical presence in one of China’s
major international cities. Th ese trade and investment offi ces help establish personal relationships
with potential investors, who can explore investment opportunities without the inconvenience of
lengthy travel. Successful trade offi ces tend not to be stand-alone institutions, but rather tools used
by investment promotion agencies that are part of their comprehensive strategy. California should
follow the example of other states that have staff ed their China offi ces with representatives fl uent in
Chinese and knowledgeable about Chinese culture and business. Th ese expenses are justifi ed, as they
will maximize effi ciency and positive return on investment.
Th e best geographic locations for investment offi ces are Beijing, Shanghai, and Guangzhou. Our
data show that these cities and the surrounding municipalities account for a large proportion of
total Chinese investment in California. Shanghai is geographically close to Zhejiang and Jiangsu
provinces; these three regions together account for more than one-third of all Chinese investment
deals in California. Similarly, Beijing accounts for the most investment deals of any Chinese province
or city, and an offi ce there may foster greater investment from surrounding areas such as Tianjin and
Liaoning. Guangzhou or another city in Guangdong Province would off er access to the Pearl River
Delta and the manufacturing hubs of southeastern China.
CONCLUSIONS: WORKING TOGETHER TO MAXIMIZE BENEFITS | 59

60 | CHINESE DIRECT INVESTMENT IN CALIFORNIA
Th ird, it makes sense to give local Chinese fi rms and other stakeholders a seat at the table. In many
ways, it should not be the sole burden of the government of California to determine the best ways to
facilitate greater Chinese investment. A multitude of Chinese fi rms and local investment promotion
agencies already operating in California likely have many useful insights into how the investment
promotion process might be most eff ectively facilitated. An advisory board and regular conference
of foreign multinationals that have invested in the state present two possible methods of involving
interested parties. Th ese individuals and organizations could advise the state on local investment
conditions and areas of special need among potential investors, providing the necessary information
to build dynamic investment promotion institutions.
Box 3: Investment Promotion: How California ComparesCalifornia’s largest municipalities and counties are among the most active in the United States in seeking Chinese investment, thanks to the efforts of regional eco-nomic development organizations, mayor’s offi ces, private sector initiatives, and public–private organizations. A prime example of this is ChinaSF, a public–private partnership in the Bay Area that provides one-stop-shop services for inbound Chinese companies in Mandarin.41 The Los Angeles County Economic Development Corporation promotes trade and investment with China through regular trips to China and other means.42 The port of Oakland has partnered with city government to send delegations to China to encourage investment.43 Mayors, including Los Angeles’s Antonio Villaraigosa, Oakland’s Jean Quan, and San Francisco’s Ed Lee, have also been very active in promoting Chinese investment.
On the state level, however, California is a laggard in foreign investment promotion. In 2003, California eliminated its Trade and Commerce Agency and closed its 12 foreign offi ces. From then until 2011, the state lacked a proper investment promotion institution. The California Governor’s Offi ce of Business and Economic Development (GO-Biz) was created earlier this year to provide the missing government investment promotion functions. It is a fl edgling organization with 28 employees and a total budget of $3.76 million for fi scal year 2012–2013.44 In September 2012, Governor Jerry Brown signed legislation that established GO-Biz as a central offi ce of contact for economic development and appointed a new executive team. The new law also paved the way for a partnership with the Bay Area Council to open a trade offi ce in Shanghai with private sector funds.45
41 See San Francisco Center for Economic Development (2009).42 See Sidhu (2011).43 See Laura Hautala, “Quan Plans Asia Trip to Encourage Oakland’s Trade with China,” Oakland North, February 17, 2011, http://oakland-north.net/2011/02/17/quan-plans-asia-trip-to-encourage-oaklands-trade-with-china/.44 California’s fi scal year 2012 enacted budget for GO-Biz and other state agencies can be found at http://www.ebudget.ca.gov/Enacted/Bud-getSummary/BSS/BSS.html.45 See “Governor Brown announces Appointments to GO-Biz Executive Team,” Imperial Valley News, September 26, 2012, http://www.impe- rialvalleynews.com/index.php/news/california-news/1610-governor-brown-announces-appointments-to-go-biz-executive-team.html; and Marc Lifsher, “Gov. Jerry Brown announces trade offi ce in China,” Los Angeles Times, September 11, 2012, http://www.latimes.com/business/money/la-fi -mo-trade-offi ce-china-20120911,0,1164743.story

Chinese investment promotion efforts in other states offer examples of how California might continue to improve. At least 30 states currently operate trade and invest-ment offi ces in the People’s Republic of China, and some states, such as Washington, Illinois, and Oregon, established such offi ces more than a decade ago.46 Many states organize regular investment conferences and governor-led trade and investment pro-motion missions, which can foster business connections in a culture in which personal relationships are especially important. For example, the governor of Maryland’s 2011 mission to China helped facilitate the largest direct investment to date by a Chinese company in Maryland.47 Many states also participate in and coordinate local private and academic initiatives aimed at strengthening ties with China. For example, the state treasurer of North Carolina sits on the board of the North Carolina China Center, a private organization that seeks to strengthen ties between North Carolina and China, including fostering greater cross-border investment.48 Other states have organized regional initiatives that aim to promote Chinese investment across states with similar interests in China. The Southern Governors’ Association’s American South–China Partnership Forum is an example of one such organization.49 Many successful state-level investment promotion agencies also seek to provide assistance tailored to the needs of Chinese investors. For example, South Carolina’s Department of Commerce has provided complimentary translation services for Chinese fi rms that it has recruited, allowing their Chinese-speaking employees to train American workers.50 Another focus of state-level activity is information and education. Virginia’s state economic develop-ment organization, the Virginia Economic Development Partnership, makes informa-tion available to Chinese investors on its Web site in Chinese. Both the South Carolina Department of Commerce51 and the Virginia Economic Development Partnership52 track the economic impact of Chinese investments and make this information publicly available to educate their own citizens and prospective investors.
4. Take a proactive stance on national anxieties.Growth in China’s U.S. direct investment has rekindled old arguments about foreign fi rms and the
national interest. Narrowly defi ned security screenings for foreign investments are imperative: Chinese
investment raises plenty of normal, legitimate concerns given the general considerations around foreign
ownership and the special characteristics of China. However, security concerns can be misapplied in
situations that present no real threat because of simple overreaction or—more worrying—as a back-door
46 See Kristi E. Swartz, “Georgia to Open Second Trade Offi ce in China,” Atlanta Journal-Constitution, October 20, 2011, http://www.ajc.com/busi-ness/georgia-to-open-second-1205999.html.47 See “O’Malley Asia Trip Was Worth the Cost,” Baltimore Sun, June 19, 2011, http://articles.baltimoresun.com/2011-06-19/news/bs-ed-omalley-asia-trip-2011061848 More information on the organization can be found at http://www.ncchinacenter.org/.49 See http://www.southerngovernors.org/MediaGallery/Events/AmericanSouthChinaPartnershipForum.aspx.50 See Trevor Williams, “Exploring China’s Investment Frontier,” China Daily, July 20, 2012, http://usa.chinadaily.com.cn/weekly/2012-07/20/con-tent_15601771.htm.51 South Carolina Department of Commerce investment-related publications can be found at http://sccommerce.com/data-resources/publications.52 The Virginia Economic Development Partnership maintains an interactive online graphic tracking foreign investment activities in the state, including Chinese investment activities. This tool can be found at http://www.yesvirginia.org/international/foreign_direct_investment/default.aspx.
CONCLUSIONS: WORKING TOGETHER TO MAXIMIZE BENEFITS | 61
62 | CHINESE DIRECT INVESTMENT IN CALIFORNIA
route to stifl e competition.53 Th e politicization of deals on national security grounds has already im-
pacted the fl ow of Chinese capital into California, with the most prominent example being CNOOC’s
failed attempt to acquire California-based oil producer Unocal in 2005.
As a leader in attracting Chinese investors, California will suff er disproportionately in the future
if deals are politicized and infl ows are rejected arbitrarily. Th is is especially true given the sectoral
mix of California’s economy, which is weighted toward industries most likely to require particular
scrutiny—for example, telecommunications equipment, information technology, and agriculture. In
addition to lost FDI infl ows, Californian fi rms could be exposed to retaliatory treatment in China if
these issues are mishandled.
Rather than wait to see whether Washington strikes the right balance between caution and com-
merce, California should step forward and contribute to the solution. In no way does this mean
papering over concerns that cannot be mitigated. But with fi rms in computing, telecommunications,
energy, agriculture, and other sectors at the forefront of the security debate and a disproportionate
number of politicized deals in the past decade, California has more experience than any state to build
models for avoiding politicization. Exploring such options would demonstrate to Chinese suitors
that California is willing to step up for them and press for sensible solutions. In the signature case
of OFDI politicization to date, CNOOC’s bid for Unocal, California politicians actually played the
opposite role, actively rousing national anxiety by initiating an exceptional, drawn-out investigation
of China’s energy needs separate from the normal process of the Committee on Foreign Investment in
the United States. Taking a positive stance on the issue today would go a long way towards fi xing the
state’s reputation, and a strong public commitment to combating investment protectionism is aligned
with California’s image and its long-term economic interests.
Th e fi ndings of our report and the policy recommendations presented here are far from comprehen-
sive, but we hope that they will contribute to a better understanding of growing Chinese investment
in California and help inform the policy debate on how to maximize the state’s benefi ts from this
new trend. Although the growth in recent years is impressive, many chapters in the story of Chinese
overseas investment have yet to be written. Securing the appropriate policy response is crucial, given
the potential for future investment fl ows and China’s role as test case for a wider range of emerging
market investors in the future.
53 For an in-depth discussion of national security risks and the politics of Chinese investment, see Rosen and Hanemann (2011).
Y | 63
Anderson, Th omas. 2009. “Foreign Direct Investment in the United States: New Investment in
2008.” U.S. Bureau of Economic Analysis, Survey of Current Business. June. http://www.bea.gov/
scb/pdf/2009/06%20June/0609_fdius.pdf.
Barefoot, Kevin B., and Raymond J. Mataloni, Jr. 2011. “Operations of U.S. Affi liates of
Foreign Companies.” U.S. Bureau of Economic Analysis. November. http://www.bea.gov/scb/
pdf/2011/11%20November/1111_mnc.pdf.
Bay Area Council Economic Institute. 2012. “Innovation and Investment: Building
Tomorrow’s Economy in the Bay Area.” http://www.bayareaeconomy.org/media/fi les/pdf/
BayAreaEconomicProfi le2012Web.pdf.
CalChamber. 2012. “Creating Certainty in an Uncertain Economy: 2012 Business Issues
and Legislative Guide.” http://www.calchamber.com/governmentrelations/issuereports/
pages/2012businessissues.aspx.
China Council for the Promotion of International Trade. 2011. “Survey on Current Conditions
and Intention of Outbound Investment by Chinese Enterprises.” http://www.ccpit.org/yewu/
docs/Survey_on_Current_Conditions_and_Intention_of_Outbound_Investment_by_Chinese_
Enterprises_2011.en.pdf.
Committee on Foreign Investment in the United States. “Annual Reports to Congress, 2007–2010.”
http://www.treasury.gov/resource-center/international/foreign-investment/Pages/cfi us-reports.aspx.
Competition Policy Review Panel. 2007. “Sharpening Canada’s Competitive Edge.” October. http://
www.ic.gc.ca/eic/site/cprp-gepmc.nsf/vwapj/sharpening_e.pdf/$FILE/sharpening_e.pdf.
Corr, Christopher F. 1994. “A Survey of United States Controls on Foreign Investment and
Operations: How Much Is Enough?” American University Journal of International Law and Policy
9(2): 417–63. http://www.auilr.org/pdf/9/9-2-1.pdf.
Dunning, John H. 1981. “Explaining the International Direct Investment Position of Countries:
Towards a Dynamic or Developmental Approach.” Review of World Economics 117(1): 30–64.
References
64 | CHINESE DIRECT INVESTMENT IN CALIFORNIA
Dunning, John H., Changsu Kim, and Donghyun Park. 2008. “Old Wine in New Bottles: A
Comparison of Emerging-Market TNCs Today and Developed-Country TNCs Th irty Years Ago.”
In Th e Rise of Transnational Corporations from Emerging Markets: Th reat or Opportunity? edited by
Karl P. Sauvant, 158–180. Northampton, MA: Edward Elgar. http://www3.qeh.ox.ac.uk/pdf/ptmd/
SLPTMD-WP-011.pdf.
Dunning, John H., and Sarianna M. Lundan. 2008. Multinational Enterprises and the Global
Economy. 2nd ed. Northampton, MA: Edward Elgar.
Fagan, David N. 2010. “Th e U.S. Regulatory and Institutional Framework for FDI.” In Investing
in the United States: Is the U.S. Ready for FDI from China? edited by Karl P. Sauvant, 45–84.
Northampton, MA: Edward Elgar.
Freeman, Charles W., III. 2009. “Remember the Magnequench: An Object Lesson in Globalization.”
Washington Quarterly 32(1): 61–76.
Globerman, Steven, and Daniel Shapiro. 2007. “Is the U.S. Ready for FDI From China? Economic
Considerations.” http://www.cbe.wwu.edu/CIB-NEW/docs/Is%20Th e%20US%20Ready%20
for%20FDI%20From%20China%20Economic%20Considerations.pdf.
California Governor’s Offi ce of Business and Economic Development. 2012. “California Investment
Guide.” June. http://business.ca.gov/Portals/0/RelocateExpand/Docs/%5BCalBIS%5D%20
Investment%20Guide%206-12.pdf.
Graham, Edward M., and Paul R. Krugman. 1995. Foreign Direct Investment in the United States.
3rd ed. Washington, DC: Peterson Institute for International Economics.
Graham, Edward M., and David M. Marchick. 2006. U.S. National Security and Foreign Direct
Investment. Washington, DC: Institute for International Economics.
Hanemann, Th ilo. 2011. “Chinese FDI in the United States and Europe: Implications and
Opportunities for Transatlantic Cooperation.” Stockholm China Forum, German Marshall Fund
of the United States, June. http://www.gmfus.org/archives/chinese-fdi-in-the-united-states-and-
europe-implications-and-opportunities-for-transatlantic-cooperation.
Hanemann, Th ilo and Daniel H. Rosen. 2012. “China Invests in Europe.” Rhodium Group, June.
http://rhgroup.net/wp-content/uploads/2012/06/RHG_ChinaInvestsInEurope_June2012.pdf.
Hufbauer, Gary, Th omas Moll, and Luca Rubini. 2008. “Investment Subsidies for Cross-Border
M&A: Trends and Policy Implications.” Occasional Paper, United States Council Foundation.
http://www.uscib.org/docs/usc_foundation_investment_subsidies.pdf.
Ibarra-Caton, Marilyn. 2010. “Direct Investment Positions for 2009: Country and Industry Detail.”
U.S. Bureau of Economic Analysis, Survey of Current Business. July. http://www.bea.gov/scb/
pdf/2010/07%20July/0710_dip.pdf.
International Monetary Fund (IMF). 2010a. “People’s Republic of China: 2010 Article IV
Consultation—Staff Report; Staff Statement; Public Information Notice on the Executive Board
Discussion.” IMF Country Report no. 10/238. http://www.imf.org/external/pubs/ft/scr/2010/
cr10238.pdf.
———. 2010b. Balance of Payments and International Investment Position Manual. 6th ed. http://
www.imf.org/external/pubs/ft/bop/2007/bopman6.htm.
Jackson, James K. 2010. “Th e Committee on Foreign Investment in the United States (CFIUS).”
Report no. RL33388, Congressional Research Service. http://www.fas.org/sgp/crs/natsec/RL33388.pdf.
Kan, Shirley A. 1998. “Long Beach: Proposed Lease by China Ocean Shipping Co. (COSCO) at
Former Naval Base.” Report no. 97-476F, Congressional Research Service. http://www.policyarchive.
org/handle/10207/bitstreams/393.pdf.
Kyser Center for Economic Research. 2012. “2012–2013 Economic Forecast and Industrial
Outlook.” February. http://laedc.org/reports/forecastreport_online.pdf.
Lardy, Nicholas R. 2012. Sustaining China’s Economic Growth after the Global Financial Crisis.
Washington, DC: Peterson Institute for International Economics.
Ministry of Commerce, People’s Republic of China. 2010. “2009 Statistical Bulletin of
China’s Outward Foreign Direct Investment.” September. http://hzs.mofcom.gov.cn/acces-
sory/201009/1284339524515.pdf.
Moran, Th eodore H. 2009. Th ree Th reats: An Analytical Framework for the CFIUS Process:
Identifying Genuine National Security Risks and Th reats, Dismissing Implausible Allegations.
Washington, DC: Peterson Institute for International Economics.
Nanto, Dick K., James K. Jackson, Wayne M. Morrison, and Lawrence Kumins. 2005. “China and
the CNOOC Bid for Unocal: Issues for Congress.” Report no. RL33093, Congressional Research
Service. http://www.policyarchive.org/handle/10207/bitstreams/2571.pdf.
National Association of Realtors. 2012. “2012 Profi le of International Home Buying Activity.”
June. http://www.realtor.org/sites/default/fi les/2012-profi le-international-home-buying-activity-
2012-06-highlights.pdf.
REFERENCES | 65
66 | CHINESE DIRECT INVESTMENT IN CALIFORNIA
Naughton, Barry. 1995. Growing Out of the Plan: Chinese Economic Reform, 1978–1993. New York:
Cambridge University Press.
Organisation for Economic Co-operation and Development (OECD). 2008a. “Benchmark
Defi nition of Foreign Direct Investment, 4th Edition.” http://www.oecd.org/document/33/0,3343,
en_2649_33763_33742497_1_1_1_1,00.html.
———. 2008b. “Proportionality of Security-Related Investment Instruments: A Survey of Practices.”
http://www.oecd.org/dataoecd/2/25/40699890.pdf.
———. 2008c. “Transparency and Predictability for Investment Policies Addressing National
Security Concerns: A Survey of Practices.” http://www.oecd.org/dataoecd/2/20/40700254.pdf.
———. 2010. “OECD Code of Liberalization of Capital Movements.” http://www.oecd.org/
dataoecd/10/62/39664826.pdf.
Organisation for Economic Co-operation and Development (OECD), and United Nations
Conference on Trade and Development (UNCTAD). 2010. “Fourth Report on G20 Investment
Measures.” http://www.oecd.org/dataoecd/20/53/46319056.pdf.
Pinto, Pablo M., and Timothy Frye. 2010. “Th e Politics of Chinese Investment in the U.S.” In
Investing in the United States: Is the US Ready for FDI from China? edited by Karl P. Sauvant,
85–121. Northampton, MA: Edward Elgar.
Reich, Robert B. 1990. “Who Is Us?” Harvard Business Review, January/February, 53–64.
Rosen, Daniel H. 1999. Behind the Open Door: Foreign Enterprises in the Chinese Marketplace.
Washington, DC: Peterson Institute for International Economics.
Rosen, Daniel H., and Th ilo Hanemann. 2009. “China’s Changing Outbound Foreign Direct
Investment Profi le: Drivers and Policy Implications.” Policy Brief no. PB09-14, Peterson Institute
for International Economics. http://www.iie.com/publications/pb/pb09-14.pdf.
———. 2011. An American Open Door? Maximizing the Benefi ts of Chinese Foreign Direct Investment.
New York: Asia Society. http://asiasociety.org/policy/center-us-china-relations/american-open-door.
Semiconductor Industry Association. 2012. “Th e U.S. Semiconductor Industry: Building
Breakthroughs to Move America Forward.” July. http://www.sia-online.org/clientuploads/One%20
Pagers%20July%202012/Semiconductor_Overview_July%202012.pdf.
San Francisco Center for Economic Development. 2009. “ChinaSF 2008–2009 Year End Report.”
http://sfced.org/chinasf-docs/ChinaSF_2009YER.pdf.

Sauvant, Karl P., ed. 2010. Investing in the United States: Is the US Ready for FDI from China?
Northampton, MA: Edward Elgar.
Setser, Brad W., and Arpana Pandey. 2009. “China’s $1.7 Trillion Bet: China’s External Portfolio
and Dollar Reserves.” Working Paper, Council on Foreign Relations. http://www.cfr.org/china/
chinas-15-trillion-bet-understanding-chinas-external-portfolio/p18149.
Shih, Victor. 2011. “High Wealth Concentration, Porous Exchange Control, and Shocks to Relative
Return: Th e Fragile State of China’s Foreign Exchange Reserve.” Presentation at the Institute of New
Economic Th inking Meeting, Bretton Woods, April. http://ineteconomics.org/sites/inet.civicactions.
net/fi les/BWpaper_SHIH_040811.pdf.
Sidhu, Nancy D., Ferdinando Guerra, Kimberly Ritter, and Jack Kyser. 2011. “Growing Together:
China and Los Angeles County.” Los Angeles County Economic Development Corporation. http://
laedc.org/reports/GrowingTogether_China_and_LA_Report_2011.pdf.
Starr, Kevin. 2007. California: A History. New York: Random House Digital, 2007.
Tyson, Laura D’Andrea. 1991. “Th ey Are Not Us: Why American Ownership Still Matters.” Th e
American Prospect, no. 4: 37–49. http://www.prospect.org/cs/articles?article=they_are_not_us_why_
american_ownership_still_matters.
U.S. Bureau of Economic Analysis. 1960–2010. “International Transactions Data.” http://www.bea.
gov/international/index.htm.
———. 1977–2008. “Data on Operations of Foreign Affi liates in the U.S.” http://www.bea.gov/
international/index.htm.
Weddle, Rick. 2009. “Funding for Invest in America to Attract Investment, Create Jobs and
Stimulate Growth Industries: A Comparative Review of the Structure, Funding and Program Focus
of Competitor Nation Investment Promotion Agencies.” Supplemental Report to Testimony before
the Subcommittee on Economic Policy, U.S. Senate Committee on Banking, Housing, and Urban
Aff airs, December 18. http://strengtheningbrandamerica.com/docs/Weddle_Supplemental%20
Report_Invest%20in%20America_Final.pdf.
Wen, Jiabao. 2012. “Report on the Work of the Government. Delivered at the Fifth Session of the
Eleventh National People’s Congress on March 5, 2012.”
http://online.wsj.com/public/resources/documents/2012NPC_GovtWorkReport_English.pdf.
Wilkins, Mira. 1989. Th e History of Foreign Investment in the United States to 1914. Cambridge,
MA: Harvard University Press.
REFERENCES | 67

68 | CHINESE DIRECT INVESTMENT IN CALIFORNIA
———. 2004. Th e History of Foreign Investment in the United States, 1914–1945. Cambridge, MA:
Harvard University Press.
Y | 69
F or the analysis of direct investment fl ows from China to the United States, we rely on three sets
of data: (1) offi cial data from U.S. statistical authorities, (2) mirror data from the Chinese side,
(3) and our own data set on Chinese investment in greenfi eld projects and acquisitions in the United
States. Th e three data sets are not directly comparable, as they diff er with regard to compilation
methods, underlying defi nitions, quality, and timeliness. But each is helpful for describing diff erent
aspects of Chinese investment in the United States.
Chinese authorities publish two data sets that include information on outward FDI fl ows and stocks:
fi rst, the balance of payments and international investment position statistics compiled by the People’s
Bank of China (China’s central bank) and its foreign exchange regulator, the State Administration of
Foreign Exchange; second, the annual statistical bulletin on outward FDI published by the Chinese
Ministry of Commerce.54 Th e balance of payments and international investment position statistics
record annual outward FDI fl ows and stocks based on the principles outlined in the fi fth edition
of the IMF’s Balance of Payments and International Investment Position Manual. However, compa-
rable Chinese statistics only provide aggregate numbers for outward FDI to the world and do not
contain any detailed breakdowns by country or industry. Such details can be found in the Ministry
of Commerce’s annual OFDI report, which has been published since 2004. Th e reports provide
OFDI fl ows and stocks in current cost terms, including breakdowns by industry and geographic
distribution.
Although the collection and dissemination of data on OFDI have improved markedly in recent years,
there are still signifi cant concerns about the accuracy and reliability of the data from China. Not sur-
prisingly, Chinese authorities have very little experience in compiling statistics on outward investment
fl ows. Furthermore, the Ministry of Commerce collects data based on information submitted by
fi rms as part of the mandatory approval process instead of through surveys, which is the international
standard. Firms often submit incomplete information or fi nd ways to completely avoid bureaucratic
screening, which distorts the statistics.55 Because of this and other problems with data collection, the
Ministry of Commerce’s statistics on outward FDI are of questionable quality, with regard to both
aggregate data and especially key metrics such as distribution by industry or country.
Appendix: Data on Chinese FDI in The United States
54 China’s balance of payments and international investment position statistics can be found at http://www.safe.gov.cn; the Ministry of Commerce’s 2009 OFDI report can be found at http://hzs.mofcom.gov.cn/accessory/201009/1284339524515.pdf (in Mandarin, but an English summary can be found beginning on p. 73).55 For a detailed discussion of some of the shortcomings and problems, see Rosen and Hanemann (2009).
70 | CHINESE DIRECT INVESTMENT IN CALIFORNIA
57 The data sets and documentation can be found at http://www.bea.gov/international/index.htm.58 See Anderson (2009) for a summary of data on new direct investment of foreign investors in 2008 and corresponding technical notes.
On the U.S. side, the Bureau of Economic Analysis is responsible for collecting and disseminating
data on FDI.56 Based on surveys that fi rms are required to submit by law, the BEA publishes three dis-
tinct data sets that include relevant information for the analysis of direct investment: (1) international
transactions and investment position data, (2) data on new foreign direct investment in the United
States, and (3) data on the operations of multinational enterprises.57
Th e international transactions and investment position data track FDI fl ows and stocks to the world
on a balance of payments basis and to individual countries on a historical cost basis (meaning that the
stock numbers might underestimate the current value of assets). Within this data set, the numbers
for the geographic distribution of FDI are presented from two diff erent perspectives: country of
direct foreign parent, which attributes each investment to the direct parent company, and country of
ultimate benefi ciary owner (UBO), which tracks the investment to the country of the ultimate owner.
Th e latter perspective generally is considered more accurate, as a large share of FDI transactions today
are conducted through special-purpose vehicles in third countries for tax optimization and other
reasons. Th e stark diff erences between the two measures for fl ows and stock of Chinese FDI in the
United States illustrate that this is especially true for investment from places such as China, where in-
vestors still face extensive capital control and restricted access to legal and fi nancial services. Th at said,
it is very likely that even the UBO numbers do not fully capture the investment fl ows from certain
regions, given the complicated deal structures and limited resources in tracking such deals. Th e data
set on new direct investment captures the gross initial investment by foreigners for new greenfi eld
establishments in the United States or the acquisition of existing U.S. companies. Compared to the
international transactions data, this data set does not track fl ows on a balance of payments basis but
rather in terms of actual investment outlays, regardless of the source of fi nancing.58 Unfortunately,
this series was discontinued after 2008 and will not be replaced by a similar data set anytime soon.
Finally, the data set on the operations of multinational enterprises provides the basic characteristics
of foreign subsidiaries of U.S. fi rms and U.S. affi liates of foreign fi rms, including total assets, value
added, jobs created, payroll, and exports and imports.
Given that the BEA has considerably more experience with compiling data on cross-border invest-
ment and that it relies on fi rm-level surveys to collect data, the BEA data must be considered generally
superior in quality to the data from the Chinese side. However, there are also considerable weaknesses
and shortcomings in the data provided by the BEA. First, the high-frequency data released every
quarter are not compiled based on the UBO principle, so these data fail to capture fl ows from China
that go through third countries (based on past patterns, those account for more than two-thirds of
fl ows). And, as mentioned earlier, even the UBO data, which are published with a signifi cant time
lag, almost certainly do not catch all transactions. In addition, the BEA’s transactions statistics record
fl ows on a balance of payments basis, which means that capital that does not originate in China
(i.e., loans from a bank in Hong Kong or the United States) is not counted as FDI from China, and
reverse fl ows such as intracompany loans from U.S. affi liates to Chinese parents or disinvestments
are netted against the infl ows. Th is is technically correct, according to the principles outlined in the

59 The authors are grateful to Jacob Funk Kirkegaard at the Peterson Institute for International Economics for valuable discussions regarding global FDI data and our alternative compilation methodology.
IMF’s Balance of Payments and International Investment Position Manual, but it defl ates the aggregate
number and is not helpful for some of the analytical work (for an American worker employed by a
U.S. affi liate of a mainland company, it does not matter too much whether the capital comes from
Hong Kong or the mainland). Th e series that circumvents some of these problems—direct investment
outlays for establishment and acquisitions in the United States—was discontinued after 2008.
Another more general problem with the BEA data is that the agency is required to hide data points for
confi dentiality reasons, and in the case of Chinese FDI, a lot of data points are suppressed to protect
investors. Finally, the BEA data do not catch important metrics such as the distribution of FDI from
single countries by state, the choice of entry mode between greenfi eld projects and acquisitions, and
important attributes of the investing parent fi rm such as ownership and other characteristics. Th us,
while the BEA data should be more reliable than those generated by China’s Ministry of Commerce to
describe aggregate patterns of Chinese FDI in the United States, neither side’s data are ideally suited
for an in-depth, real-time analysis of Chinese investment patterns.
Th erefore, we compiled our own data set on Chinese direct investment in the United States based on a
bottom-up collection of investment projects and deals to overcome some of the diffi culties associated
with the traditional process of collecting FDI data.59 Our data set captures investment expenses by
ultimately Chinese-owned fi rms for mergers and acquisitions and greenfi eld projects in the United
States that qualify as direct investment (i.e., a greenfi eld FDI project or the acquisition of a stake in an
existing company that exceeds 10% of voting rights), and therefore it is probably closest to the BEA’s
discontinued series on investment outlays for acquisitions and establishment.
Bloomberg data served as a starting point for compiling our data set, providing information on
M&A transactions, and was supplemented by other sources. Information on greenfi eld projects was
primarily gathered by means of a proprietary news monitoring system consisting of fi nely tuned
search algorithms through news services such as Nexis, Factiva, and Google. Specialized fi nancial
data providers such as Bloomberg, Nexis, and Zoominfo off ered additional information on Chinese
companies’ U.S. operations. Offi cial documents such as Securities and Exchange Commission fi l-
ings or annual reports, business registries, information from investment promotion agencies, and
industry-specifi c lists of investment projects from business associations and industry research fi rms
complemented our data collection strategy.
After collection, we refi ned our data set by excluding deals that were announced but never commenced
or that did not qualify as direct investment. We applied a minimum investment threshold value of $1
million to exclude small-scale deals such as family restaurants or smaller businesses from the database.
Qualifying M&A deals were counted at the date of completion, and greenfi eld projects at the date of
announcement. Each deal was assigned a value based on the offi cially announced fi gure or the most
convincing analyst estimate. If no estimate was available or possible, acquisitions were listed in the
APPENDIX: DATA ON CHINESE FDI IN THE UNITED STATES | 71
72 | CHINESE DIRECT INVESTMENT IN CALIFORNIA
database with a zero value. We estimated the value of smaller-scale greenfi eld operations with missing
investment fi gures based on similar projects in similar locations with known values.
As a fi nal step, we added additional metrics not available in offi cial data, such as the ownership of
the ultimate parent of the investing company, and coded each of the deals accordingly. For publicly
traded companies to qualify as “private,” more than 80% of total outstanding shares had to be held
by non-government-related investors. Each deal was also coded with the destination city, as well as
industry categories based on Standard Industrial Classifi cation (SIC) codes according to the main
activity of the investment target. Table A-1 summarizes these categories and the associated SIC codes.
Our approach to FDI data collection has strengths and weaknesses. First, it does not comply with
international balance of payments norms for compiling direct investment data. Unless specifi cally
announced as a separate investment, our data set does not capture any follow-up fl ows, such as
reinvested earnings or intracompany transfers. It also does not exclude investments of capital from
non-Chinese sources, for example, fi nancing from local U.S. banks. Hence, our data are not directly
comparable with balance of payments data from offi cial sources and cannot be used to analyze bal-
ance of payments–related questions. Second, the bottom-up approach does not capture all Chinese
investments in California. Our database includes most deals with an investment value of $1 million
or more, but there are many small-scale transactions every year that are impossible to accurately
track down—for example, small trading offi ces or private investment in real estate and other assets.
Finally, some of our fi gures are based on estimates. For a small number of deals, even estimates are not
possible, so the data set includes a number of transactions with blank values.
However, the bottom-up method avoids common problems with balance of payments data. Offi cial
statistics on FDI and other cross-border capital fl ows are heavily distorted by transfer pricing and
other tax optimization strategies and thus often do not refl ect economic realities. By tracking gross
investment expenses of fi rms based on sources outside of national statistics offi ces, RHG avoids such
distortions. Furthermore, the China Investment Monitor data set off ers more variables and a greater
level of disaggregation, which makes it superior for analyzing certain aspects of Chinese investment
that are pertinent to the current policy debate. Finally, this approach allows for a nearly real-time
assessment of investment fl ows, bypassing the signifi cant time lags with offi cial data.

Table A-1: Rhodium Group Database Industries and Corresponding SIC CodesIndustry categories and SIC codes
Source: Rhodium Group.
Aerospace, space, and defense 372, 376, 3812
Automotive OEM and components 3711, 3713, 3714, 551, 552, 553, 501, 75
Other transport equipment 3715, 3716, 373, 374, 375, 379, 555, 556, 557, 558, 559, 5088
Consumer electronics 363, 365, 386, 5045, 5064
Consumer products and services 387, 391, 393, 394, 395, 396, 399, 509, 523, 525, 526, 527, 53, 563, 569, 57, 59, 76
Food, tobacco, and beverages 01, 02, 07, 08, 09, 201, 202, 203, 204, 205, 206, 207, 208, 209, 21, 54, 514, 515, 518
Furniture and wood products 24, 25, 5031
Textiles and apparel 22, 23, 31, 513, 561, 562, 564, 565, 566
Communications equipment and services 366, 481, 482, 483, 484, 489
Electronic equipment and components 357, 362, 364, 3671, 3672, 3677, 3678, 3679, 369, 5063, 5065
Semiconductors 3674, 3675, 3676
Software and IT services 737
Business services 731, 732, 733, 734, 735, 736, 738, 81, 82, 86, 871, 872, 8732, 8733, 874, 89
Financial services and insurance 60, 61, 62, 63, 64, 67
Chemicals, plastics, and rubber 281, 282, 2833, 284, 285, 286, 287, 289, 30, 8731
Coal, oil, and gas 12, 13, 29, 517, 554
Utility and sanitary services 49
Biotechnology 2836, 8731
Health care and medical devices 80, 83, 384, 385
Pharmaceuticals 2834, 2835, 5122, 5047, 8731, 8734
Construction services 17
Leisure and entertainment 58, 70, 78, 79, 84
Real estate 15, 16, 65
Engines and turbines 351
Industrial machinery, equipment 352, 353, 354, 355, 356, 358, 359, 361, and tools 382, 508 (except 5088)
Paper, printing, and packaging 26, 27
Transportation services 40, 41, 4212, 4213, 4214, 4215, 422, 423, 43, 44, 45, 46, 47
Metals mining and processing 10, 33, 34, 5051
Minerals mining and processing 14, 321, 322, 323, 324, 325, 326, 327, 328, 329, 5032, 5033, 5039, 5211
Alternative/renewable energy 2819, 2869
Sector Industry SIC codes
Aerospace, automobiles, and transportation
Consumer products
Electronics and IT
Financial, insurance, and business services
Fossil fuels and chemicals
Health care, biotech, and pharmaceuticals
Hospitality, entertainment, and real estate
Industrial machinery
Logistics
Metals and minerals
Renewable energy
APPENDIX: DATA ON CHINESE FDI IN THE UNITED STATES | 73

Recently Released Asia Society ReportsStabilizing Pakistan Through Police Reform
Advancing Myanmar’s Transition: A Way Forward for U.S. Policy
Central Asia’s Crisis of Governance
Pakistan 2020: A Vision for Building a Better Future
An American Open Door? Maximizing the Benefi ts of Chinese Foreign Direct Investment
Never an Empty Bowl: Sustaining Food Security in Asia
Preparing Asians and Americans for a Shared Future Asia Society is the leading global and pan-Asian organization working to strengthen relationships and promote understanding among the people, leaders, and institutions of Asia and the United States.
We seek to increase knowledge and enhance dialogue, encourage creative expression, and generate new ideas across the fi elds of policy, business, education, arts and culture. Founded in 1956, Asia Society is a nonpartisan, nonprofi t educational institution with offi ces in Hong Kong, Houston, Los Angeles, Manila, Mumbai, New York, San Francisco, Seoul, Shanghai, Sydney, and Washington D.C.
For more information, visit AsiaSociety.org/ChinaCAInvestment