chinese dairy farm performance and policy implications in the new
TRANSCRIPT

1
Chinese Dairy Farm Performance and Policy Implications in the New
Millennium
Hengyun Ma a* Les Oxleyb Shanmin Guoa Huacang Tanga Yiping Wua Jikun Huangc Allan Raed Scott Rozelle
e
a
College of Economics and Management, Henan Agricultural University, Zhengzhou, China
b
Department of Economics and Finance, University of Canterbury, Christchurch, New Zealand
c
Center for Chinese Agricultural Policy, IGSNRR, Chinese Academy of Sciences, Beijing, China
d
Department of Economics and Finance, Massey University, Palmerston North, New Zealand
e
S-ARARC, Freeman Spogli Institute, Stanford University, California, USA
Financial support from National Natural Science Foundation of China (NO: 70773037) is gratefully acknowledged.
* Corresponding author. College of Economics and Management, Henan Agricultural University, 95 Wenhua Road, Zhengzhou 450002, China. Tel.: +86 371 63579691; Fax:+86 371 63555638; E-mail address: [email protected] (H. Ma).

2
Chinese Dairy Farm Performance and Policy Implications in the New
Millennium
Abstract
China has significantly expanded its dairy cow numbers and increased its dairy processing capacity over the last five year in an attempt to meet increased demand for dairy products. China’s net imports of dairy products, however, has expanded at a growth rate in excess of 30% during the same period. To consider why China is still struggling to meet rising dairy product demand in China in the new millennium, this paper employs a new set of farm-level survey data and stochastic input distance functions to empirically estimate Total factor Productivity (TFP) on China’s dairy farms. The results show that the TFP growth has been positive on and this rise in productivity has been mostly driven by technological change. However, the new results show that on average, the same farms have been behind the advancing technical frontier. We also find one of the drivers of the dairy farms’ productivity advances is the relatively robust rate of technological change. The results suggest that efforts to achieve increased adoption of new technologies and better advice on how to use the technologies and manage production and marketing within the dairy farm sector, will likely further increase TFP growth in China.
Keywords: Distance Function, Total Factor Productivity, Technical Inefficiency, Dairy Farms.
JEL Classification: D240, Q100, Q160.

3
Chinese Dairy Farm Performance and Policy Implications in the New
Millennium
1. Introduction
China has significantly expanded its dairy cow numbers and increased its dairy
processing capacity over the last five year in an attempt to meet increased demand for
dairy products. China’s net imports of dairy products, however, has expanded at a
growth rate in excess of 30% during the same period. Total dairy cow numbers have
increased by 40%, from 8.93 million in 2003 to 12.33 million in 2008 (CDSY, 2004,
2009). Correspondingly, China has also doubled its investment in the dairy processing
sector, from ¥450.96 billion in 2003 to ¥932.56 billion in 2008 since 2003. As a result,
total processed dried dairy products has doubled from 1.41 million metric tonnes in
2003 to 2.85 million metric tonnes in 2008, while total processed liquid dairy
products have nearly tripled from 5.85 million metric tonnes to 15.25 million metric
tonnes during the same period. However, domestic dairy product demand has
increased even more dramatically. With this increased domestic supply, however,
China’s net imports of dairy products has still expanded from US$295 million in 2003
to US$1120 million in 2008, an increase of US$825 million in the past five years,
representing a growth rate of over 30% (CDSY, 2004, 2009). It is an unanswered
question, however, how well China’s dairy farming sector performs, in a technical
sense, to meet its growing domestic demand for dairy products. In this paper we will
consider such a question by concentrating on the trends and drivers of Total Final
Productivity (TFP) growth using a new set of farm-level survey data and stochastic

4
input distance functions
During the same period, China’s dairy farm structure has experienced fundamental
changes in both production structure and farm sizes. For example, as the number of
backyard dairy farms has dramatically declined, the share of dairy cow herd numbers
from backyard dairy farms has decreased by 22.4%, from 55.3% in 2003 to 42.9% in
2008. However, the herd numbers of larger dairy farms have increased. In particular,
the share of dairy cow numbers from small dairy farms has risen by 18.8%, from 22.9%
in 2003 to 27.2 % in 2008; the share of dairy cow numbers from medium dairy farms
has risen by 22.2%, from 16.2% in 2003 to 19.8 % in 2008; but the share of dairy cow
numbers from large dairy farms has risen by 80.8%, from 5.6% in 2003 to 10.1 % in
2008. It is interesting, therefore, to consider whether there are significant differences
in production performance across dairy farms of varying size and scale.
One key feature of China’s dairy sector is that most of dairy farms are located
in cropping areas for example, in the major grain producing regions Heilongjiang,
Hebei, Henan, Shandong, Shanxi, Sichuan and Jiangsu provinces which produced 47%
of the total national cow milk output (14.3%, 14.2%, 7.8%, 6.5%, 4.2%, 1.9% and
1.7%, respectively) in 2008. It is also the case that, in 2008, the ratios of grain
consumption to fodder consumption are 4.48 on small size dairy farms in Hebei
provinces, but only 1.29 in Xinjiang. As a result, one may be curious to know whether
dairy farm performance is closely correlated with grain production - issue that has
never been satisfactorily addressed.
There now appears to be another opportunity to observe the evolution of dairy

5
farm herd sizes and investigate productivity performance over dairy herd farm sizes as
prior to 2004, the National Development and Reform Commission (NDRC) collected
dairy farm data for only specialized dairy farms and state-collective dairy farms.
However, this survey information system has recently been changed to provide
information on dairy farm production data by dairy farm herd sizes categorized as:
backyard dairy farms, small dairy farms, medium dairy farms, and large dairy farms.
In particular, the survey now provides information that allows us to investigate the
productivity performance of backyard dairy farms, which still account for more than
35% of cow milk production in 2008 (CDSY, 2009) and which have never been
reported in the English-language economics literature.
One of the major aims of this research therefore, is to provide accurate
information on the productivity performance of China’s dairy farms. In earlier work,
Peng (2008) estimates the technical efficiency for China’s dairy farms over the period
2004-2006. However, these estimates of production technical efficiencies may be
unhelpful to, say, policy-makers, as there is only one significant coefficient (except
for constant term) in the stochastic frontier production function model. Moreover, it is
unlikely that the average estimate of production technical efficiencies is as high as
91.1% over the period 2004-2006. In fact, by contrast we find that the average
concentrate feed-milk conversion coefficient is around 0.53 for various dairy farm
types over the period 2004-2008, while the minimum concentrate feed-milk
conversion coefficient ranges from 0.26-0.36 over the same period. This means that
the ratios of minimum to the average concentrate feed-milk conversion coefficients

6
range from 50% to 70% over the period 2004-2006. Therefore, an estimate of over 90%
for average technical efficiency seems to be too high given that the technical
efficiency is defined as the ratio of individual to minimum (alternatively called
frontier) input-output conversion coefficient.
In this research we will consider a number of specific questions. How have dairy
farm sizes evolved in China? Is the productivity performance on China’s dairy farms
following the same pattern today as it did before 2004? Are variations in productivity
growth patterns across various dairy farm herd sizes discernable? Are there significant
differences in factor inputs and productivity growth patterns on household dairy farms
compared to other large specialized dairy farms? Are there significant effects of crop
production and dairy processing capacity on production efficiency on the regional
dairy farms? In this research we seek to answer these and related questions.
In the next section we describe the new information system for China’s dairy farm
surveys and present some important descriptive statistics. We then use a stochastic
distance function methodology to estimate productivity growth, which is followed by
a discussion of these new results which are also compared with existing data. The
paper concludes with some policy implications from our new findings.
2. The new information system and some descriptive statistics
2.1 Dairy farm production cost data
The main source of information for examining the productivity of China’s dairy farms
is the National Agricultural Commodity Production Cost and Return Data (ACPCRD),
published by the National Development and Reform Commission (NDRC). The
7
ACPCRD provides detailed output and cost information for a range of farming sectors,
including dairy farms in China. While the NDRC’s data for crops have been widely
used (e.g., Huang and Rozelle, 1996; Tian and Wan, 2000; Jin et al., 2002, 2009), this
does not appear to be the case for the livestock data (exceptions include Rae et al.
(2006) and Ma et al. (2007)). It seems that the production cost data for dairy farms
have rarely been analysed especially for the new dairy farm classification system
introduced in 2003.
The NDRC survey of dairy farm production cost and return data covers nearly 20
major dairy producing provinces (municipal and autonomous regions), see Appendix
4 for details. Prior to publication the cost data are summarized in terms of cohorts, by
averaging similar farms in like areas for each observation. The diary farm production
and return cost information is an unbalanced panel of 331 observations for all dairy
farms from 2004 to 2008.
The dairy farm production data includes sufficient information to generate
detailed estimates of dairy inputs and outputs on a per cow basis. The data include
milk yield (Y1, kg), by-product value (Y2, yuan), labor inputs (X1, days), concentrate
feed (X2, kg), grain consumption (kg), fodder consumption (X3, yuan, deflated by the
feed price index), and capital inputs (X4
2.2 The new dairy farm survey classification
, yuan). For the capital inputs we used the
sum of depreciation, machinery maintenance and small tool purchases, deflated by the
agricultural machinery price index.
For the period 1992-2003, the ACPCRD classified dairy farms into only ‘specialized

8
household dairy farms’ and ‘state-collective dairy farms’ and did not produce any
production cost information for backyard dairy farms. However, after 2003 the NDRC
began to categorize dairy farms into backyard dairy farms (≤10 head), small dairy
farms (10<head≤50), medium dairy farms (50<head≤500), and large dairy farms
(>500 head) and to publish production cost data for each category of dairy farm in
China.
There are two points that should be noted. Firstly, production cost and returns
information for backyard dairy farms have only become available since 2003, which
allows us to explore a new research area for China’s dairy productivity performance.
This is important as backyard dairy farms still account for 30% of China’s total milk
production. Secondly, under the new survey classification system, we are now able to
observe how dairy farm productivity performs as herd size grow.
2.3 Herd size evolutions and structure change
Since 2002, the China Dairy Association has published China’s Dairy Statistic
Yearbook (CDSY). The CDSY provides information on both annual, regional dairy
sector investigation articles, and dairy sector statistics. These include dairy farm
production, dairy product consumption and dairy product trade, etc. For the dairy
farm production statistics, the CDSY provides information on dairy farm numbers,
dairy cow stock, and cow milk output categorized by five cohorts of farm herd sizes.
This will be considered in more detail below.
2.3.1 National level
Table 1, below, presents, at the national level, the shares of dairy cow numbers and

9
milk output across five cohorts of dairy farm sizes for the 2004-2008 period. As can
be seen, the share of dairy cow number was as high as 56.6% in 2004, for the dairy
farms whose herd is ≤10 heads (defined as backyard dairy farm). This share
declined to 42.9% in 2008, a 13.7% of net share reduction or aggregate share decline
of 24.2% from 2004 to 2008.
The share of dairy cow numbers were 23.5%, 15.0% and 4.9% for the dairy
farms whose herds were in 2004, respectively, ‘more than 10 and less than 50 head’
(defined as small size dairy farm), ‘more than 50 and less than 500 head’ (defined as
medium size dairy farm) and ‘more than 500 head’ (defined as large size dairy farm).
These shares of dairy cow numbers increased, from 2004-2008 to, 27.2%, 19.8% and
10.1% in 2008, respectively, with net share increases of 3.7%, 4.8% and 5.2% or
aggregate shares increases of 15.7%, 32.0% and 106.1% from 2004.
The same pattern can be observed for the share changes of cow milk output
across dairy farm types over time. For example, the share of total cow milk output
was almost 50% for backyard dairy farms in 2004, while it declined to 35.3% in 2008,
or 28.0%. At the same time, the share of cow milk output increased for all other types
of larger dairy farms, in particular, the share increased by more than 77% for the
‘large herd’ dairy farm.
Finally, from Table 1, the first three types of dairy farms now play a more
important role in China’s dairy farming sector, while large dairy farms contribute
little to cow milk production. For example, the first categories of dairy farms account
for 42.9%, 27.2% and 19.8% of total cow inventory and 35.3%, 28.3% and 23.0% of

10
total cow milk output, while large size dairy farms only account for 10.1% of total
cow inventory and 13.3% of total cow milk output in China.
2.3.2 Provincial level
Appendix 1 shows the distribution of cow milk output across five dairy farm herd
sizes in 2004 and 2008 and the changes in cow milk output across five dairy farm
herd sizes. As can be seen from Appendix 1, in 2004, the dairy farms (≤10 heads)
account for more than 75% of cow milk output in Shaanxi province, almost 64% in
Inner Mongolia, approximately 55% in Heilongjiang, Hebei and Xinjiang, and nearly
38% and 40% in Henan and Shandong. However, by 2008, the shares of cow milk
output for the dairy farms (≤10 heads) fell by 26.2% (from 75% to only 56%) in
Shaanxi province, fell by 27.9% (from 63.7% to 46%) in Inner Mongolia, fell by
25.7%, 40.2% and 19.9% (from 54.8% to 41%, from 54.5% to 33% and from 55.8%
44.7%, respectively) in Heilongjiang, Hebei and Xinjiang provinces, fell by 50.8%
and 38.7% (from 37.8% to 18.6% and from 39.8% to 24.4%, respectively) in Henan
and Shandong.
Correspondingly, the larger herd size dairy farms have expanded since 2004
across the regions. For example, for the Inner Mongolia and Shaanxi provinces
respectively, the shares of cow milk output for medium dairy farms (50<Heads≤500)
more than doubled increasing by 112% and 140%, from only 8.2% to 17.4% and from
only 9.6% to 23.0%,. The shares of milk output increased by 36.6% and 39.1% for the
same categories of dairy farms in Hebei and Shandong provinces, respectively. The
large dairy farms (>500 heads) expanded even faster for example, their output share
11
on large dairy farms at least doubled in Shaanxi and Xinjiang and even increased by
925% and 710% in Inner Mongolia and Hebei, respectively.
From these observations we can conclude that China’s dairy farm structure has
experienced fundamentally changes based both at the national and provincial levels.
The share of backyard dairy farms has declined, while the share of larger dairy farms
has expanded rapidly as the national total cow inventory has grown.
2.4 Changes to herd sizes, yields and inputs
2.4.1 At the national level
Table 2 below shows, at the national level, the average farm herd sizes, yields and
major inputs for four types of dairy farms (backyard, small herd size, medium herd
size and large herd size farms) during the study. Three general observations can be
made:
Firstly, all indicators in Table 2 are extremely stable, over time, within each dairy
farm herd sizes as the coefficients of variation (defined as the ratio of standard
deviation to average times 100) are very small. For example, most coefficients of
variation are below 5% and some even below 2%. The largest coefficient of variation
is found only 12% for fodder inputs on backyard dairy farms; the larger one is found
only 10% for labor input on both medium and large dairy farms.
Secondly, there are evident variations in yields and factor inputs across farm herd
size where it seems that yields and inputs apparently increase as farm herd sizes
expand. For example, milk yields are little different between backyard dairy farms
and small dairy farms where average yields are 4977 kg and 5160 kg, respectively.

12
However, as farm herd grows, milk yields rapidly increase for example, 5569 kg on
medium dairy farms and 6262 kg on large dairy farms. The difference in milk yields is
as large as 1285 kg or 21% when comparing backyard dairy farms with large dairy
farms. There is even a 409 kg or 7.3% difference in milk yield between small dairy
farms and medium dairy farms. The same can be observed for concentrate, grain,
fodder and capital inputs across farm types. However, the labor input displays a
completely opposite scenario. For example, the difference in labor input is as large as
25.6 working days or 72.1% when comparing large dairy farms with backyard dairy
farms. There is even a 4 working days or 10.0% difference in labor input between
small dairy farms and medium dairy farms.
Finally, there is significant difference in herd sizes across the four types of dairy
farms in China for example, herd sizes are on average around 3, 13 and 63 heads on
backyard dairy farms, small dairy farms, and medium dairy farms, respectively.
However, the herd size is as high as ‘more than 1000 head’ on the large dairy farms.
2.4.2 Provincial level
Appendix 2 presents the average farm herd sizes, yields and major inputs across for
four types of dairy farms for some major dairy farming areas in 2008. Two general
observations can also be made here:
Firstly, all indicators in Appendix 2 show clear variability within the group of
dairy farms in 2008 as their coefficients of variation vary significantly across regions.
For example, the coefficients of variation, across regions, range from 10% for milk on
small dairy farms to more than 55% for herd sizes on backyard dairy farms. In
13
addition, the coefficients of variation are all as high as 30% for fodder inputs for all
four types of dairy farms, while they are greater than 21% for concentrate, grain and
labor inputs on medium dairy farms, and capital input on backyard dairy farms and
small dairy farms, etc.
Secondly, the lowest coefficient of variation can be found for milk yields across
regions, ranging from 9.9% to 14.6%. For example, they are 12% on both backyard
dairy farms and medium dairy farms. It is 9.9% on small dairy farms, and no larger
than 15% (14.6%) on large dairy farms.
3. Methodology and estimation
Over the last twenty years, the literature on productivity measurement has developed
from the standard index-number calculation of total factor productivity (TFP) towards
more refined decomposition methods. In the simple TFP framework, the growth rate
of this index is usually interpreted as a measure of technical change, however, this
interpretation incorporates several restrictive assumptions, such as constant returns to
scale and allocative and technical efficiency. More recently, distance functions have
been used in attempts to overcome some of these shortcomings and to identify the
components of productivity change (Coelli and Perelman, 2000). This approach does
not require any behavioral assumptions, such as cost minimization or profit
maximization, to provide a valid representation of the underlying production
technology (Brümmer et al., 2002).
In the analysis of productivity performance on China’s dairy farms here we
employ the input distance function methodology as China’s economy is still in a state

14
of transition. Empirically, we assume that this input distance function can be
approximated by the translog functional form. The homogeneity restrictions are
imposed by choosing the quantity of one of inputs as numeraire (here it is assumed to
be the number of labor days). As discussed in the literature, first, we incorporate some
dummy variables into the distance production function to capture the differences
across farm types. Secondly, we also need to incorporate into the technical
inefficiency model, dairy farm type dummy variables, concentrate-fodder input ratios,
dairy farm sizes, grain production, dairy processing capacity, educational level, and
locational dummy variables to enable us to observe their significance. Finally, we also
incorporate a time variable into the model to capture the variations in technical
efficiency over time. Details of this type of model and its estimation can be found in
Coelli and Perelman (2000), Karagiannis et al. (2004) and Khumubakar and Lovell
(2000).
Due to some serious econometric issues with any two-stage formulation
estimation (Khumbakar and Lovell, 2000), we employ the FRONTIER 4.1 computer
program developed by Coelli (1996) to simultaneously estimate the stochastic
distance frontier function and technical inefficiency models as in Coelli and Perelman
(2000) and Paul et al. (2000). The input distance function is empirically estimated
using pooled panel data for the dairy sector as a whole as we do not have sufficient
observations for each type of dairy farms due to the short sample period (2004-2008).
We decompose productivity growth into technical change and efficiency components,
as in Karagiannis et al. (2004).

15
One concern that has been raised in relation to the use of distance functions is
that the normalized inputs appearing as regressors may not be exogenous. However,
Schmidt (1988) and Mundlak (1996) have also examined variables in ratio form and
found that the ratio of two input variables does not suffer from such endogeneity
issues if we assume profit maximization. Therefore, the ratio model used here is less
susceptible to input endogeneity bias than the normal model (Brümmer et al., 2002).
Another possible issue, not addressed, is that the model does not include
environmental variables, however, the majority of China’s dairy cows are farmed in
housed facilities, such that productivity performance may be little influenced by e.g.,
weather conditions to the extent that might occur in grazing-type systems.
4. Results and discussions
Model specification tests were used to consider e whether the translog functional form
is significantly different from a Cobb-Douglas specification of the production frontier.
Results show that the Likelihood ratio (236) is significant at the 1% level, suggesting
that the translog functional form dominates the Cobb-Douglas specification. The
estimated parameters of both production frontier and inefficiency model are presented
as Appendix 3. The estimated input distance functions for the pooled panel data were
found to be well-behaved in that, at the point of approximation, it is non-increasing in
outputs and non-decreasing in inputs. The estimated sigma square ( 2uσ =0.008) and
gamma (γ =0.291) are significant at the 1% level, indicating the presence of technical
inefficiency, and thus, a significant part of the output variability among dairy farms
can be explained by differences in the degree of technical efficiency (Karagiannis et

16
al., 2004).
Turning to the economic assumptions proposed previously, we found that: i) The
estimated coefficients of medium farms and large farms in both models are
significantly different from zero, suggesting that the production frontier and
inefficiency models are different for backyard farms and small farms from compared
to medium farms and large farms. ii) In particular, the positive sign for the medium
farm dummy in the frontier function model indicates that the production frontier is
larger for medium farms compared to backyard farms and small farms, while the
negative sign for the large farm dummy in the frontier function suggests that the
production frontier is smaller on large farms than on backyard farms and small farms;
iii) Similarly, the positive sign of medium farm dummy in the inefficiency model
indicates that the technical efficiency is higher on medium farms than on backyard
farms and small farms, while the negative sign of large farm dummy in the
inefficiency model suggests that the technical efficiency is lower for large farms than
for backyard farms and small farms; iv) China’s dairy farms have adopted
fodder-saving technology as the coefficient on tX3 (fodder input) is significantly
negative over time, while it suggests that China’s dairy farms are adopting
concentrate-using technology because of the positive coefficient on tX2 (concentrate
feed input) although it is insignificant over time. In fact, since 2004 fodder
consumption has decreased by 12.8% for small farms, 9.6% for medium farms and
11.9% for large farms, however, concentrate feed consumption has increased by 9.7%
for small farms and 7.6% for large farms (refer to Table 2). v) Other variables for

17
example, concentrate-fodder ratio, grain production, dairy processing capacity and
education level are also insignificant in the inefficiency model. We also found that the
grain input is still higher in Inner Mongolia (non-cropping area) than in Henan
(cropping area), see Appendix 2.
4.1 Backyard dairy farms
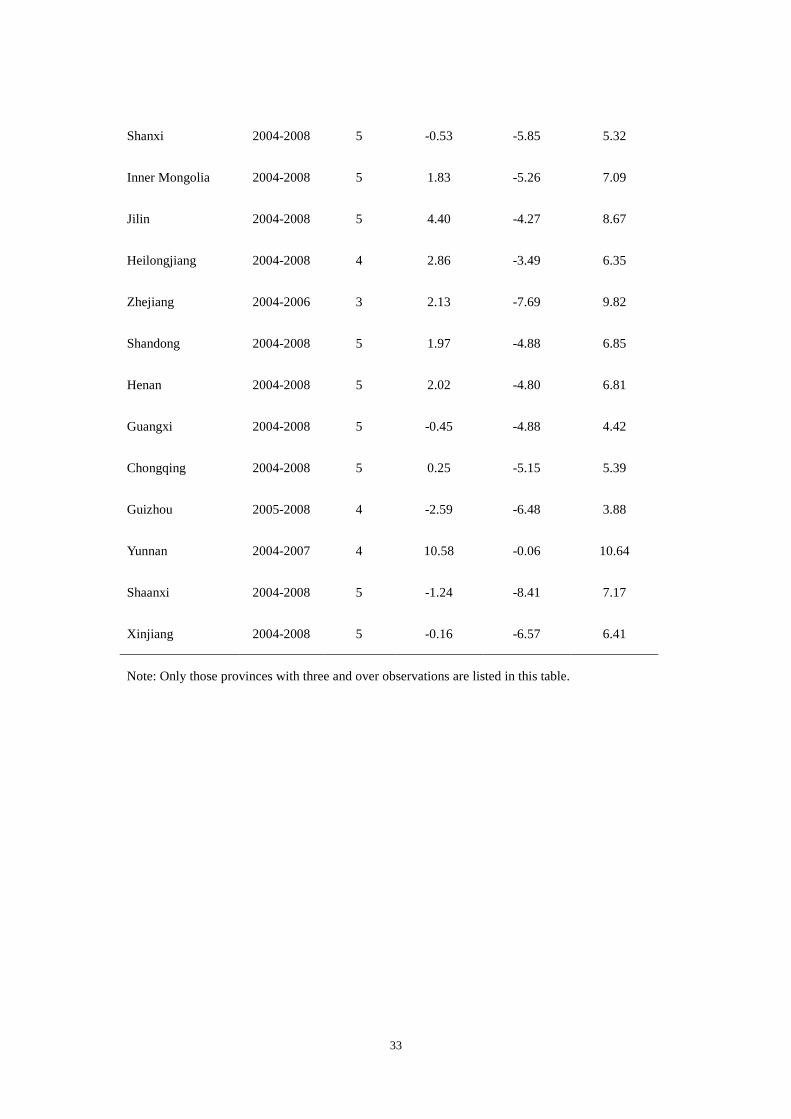
From Table 3, row 1, we can see that TFP growth was slow on backyard dairy farms,
rising only 1.07% annually. The decomposition analysis clearly shows that
technological change, not improvements to efficiency, has been the driver of the
increase in productivity. Technological change for backyard dairy farms increased
output by 6.34% annually (column 6). The adoption of new genetics, feeding regimes
and milking approaches has had a large impact on the backyard dairy farms. In
contrast, disruptions caused by fast growth or the lack of training and understanding
of changing dairy production and marketing processes, that might contribute to
inefficiencies, has caused technical efficiency to fall over time, by 5.27% annually
(column 5).
The results also suggest that all backyard dairy farms followed the same pattern of
TFP growth. For example, all growth rates of technological change were positive,
while all growth rates of technical efficiency were negative. Productivity performed
well in some provinces (Inner Mongolia, Jilin, Heilongjiang, Shandong, Henan,
Zhejiang and Yunnan) where TFP growth rates range from y 2% to 10%, while
productivity actually worsened in other provinces (Guizhou and Shaanxi) where TFP
growth rates are all negative (-2.59% and -1.24%, respectively). It is apparent that

18
technological change has enhanced TFP growth while falling technical efficiency has
significantly offset this effect on TFP growth.
Some dairy farming areas including Inner Mongolia, Heilongjiang, Shandong
and Henan provinces have enjoyed large positive TFP growth rate (1.83%, 4.40%,
1.97% and 2.02%, respectively), however, other major dairy farming areas, for
example, Shaanxi and Xinjiang have delivered negative TFP growth rates (-1.24%
and -0.16%, respectively). An extreme case can be found for Yunnan province where
technological change is as high as 10.64% annually while technical efficiency is close
to zero, giving TFP growth rates of 10.58% annually on backyard dairy farms in this
province. Finally, it can be observed that falling technical efficiency has in most cases
offset the effect of rapid technological change on TFP growth, resulting in very
modest TFP growth.
4.2 Small dairy farms
The small dairy farms experienced almost identical contours for TFP, technological
change and technical efficiency (Table 4, row 1). TFP growth was slower on small
dairy farms, rising only 0.10% annually. Like backyard dairy farms, this growth rate
was driven by technological change (5.88% annually). Similarly, TFP would have
been higher had whatever affects the efficiency of the production environment not
contributed to a 4.88% slowdown in productivity.
Although most small dairy farms followed almost the same pattern of TFP growth
as on backyard dairy farms, their TFP growth rates appear to vary across locations.
For instance, productivity performed well in Hebei, Jilin, Heilongjiang, Shandong,

19
and Sichuan provinces where TFP growth rates range from 1.53% to 3.21%, while
productivity worsened in Liaoning and Ningxia provinces, where TFP growth rates
are -3.36% and -3.78%, respectively.
Two extreme cases can be found in Hunan and Yunnan provinces where TFP
growth rates are as high as 5.57% and 8.92% on small dairy farms, which were driven
by a 10% of technological change. Small dairy farms in Hebei have a large positive
TFP growth rate (1.53%), while small dairy farms Inner Mongolia and Xinjiang have
a negative TFP growth rate, though they are not very large. It seems that, falling
technical efficiency has in part offset the effect of rapid technological change on TFP
growth, resulting in a very modest TFP growth for small dairy farms.
4.3 Medium dairy farms
Although the medium dairy farms experienced negative TFP, they followed almost the
same growth pattern of the typical small dairy farm types considered above (Table 5,
row 1). The TFP growth rate was negative for medium dairy farms, decreasing 1.12%
annually. Unlike smaller herd size dairy farms, this negative growth rate was driven
by technical efficiency change (-4.71%). Similarly, TFP would have been lower had
technological change not contributed to a 3.60% increase in productivity.
Similarly, all of the TFP growth for medium dairy farms followed the same
pattern, but their TFP growth rates vary across locations, where some are large and
positive, while others are a large and negative. For instance, the TFP growth rates are
2.71% in Jilin, 1.30% in Heilongjiang and 1.44% in Guangxi, all of which were
driven by technological change (over 5%). In contrast, the TFP growth rates are -1.08%

20
in Tianjin, -1.26% in Inner Mongolia, -2.33% in Zhejiang, -1.04% in Anhui, -3.78%
in Hunan, -1.62% in Chongqing, -2.46% in Gansu and -1.99% in Xinjiang, all of
which were driven by falling technical efficiency.
Two extreme negative cases can also be observed in Shanghai and Shaanxi
where TFP growth rates are -5.24% and -5.51%, respectively, which were almost
completely driven by falling technical efficiency. It is interesting to observe that
medium dairy farms in Heilongjiang have a large positive TFP growth rate (1.30%).
However, unfortunately, medium dairy farms in Inner Mongolia and Xinjiang are
found to have large negative TFP growth rates (-1.26% and -1.99%, respectively).
4.4 Large dairy farms
All large dairy farms experienced the same contours in TFP, technological change and
technical efficiency as those of medium dairy farms, albeit the rates of changes were
all somewhat intensified (Table 6, row 1). Here TFP growth dropped even faster on
large dairy farms, decreasing by as much as 2.28% annually as a whole, mainly driven
by falling technical efficiency (-4.31%). However, TFP would have been lower had
technological change not contributed to a 2.03% increase in productivity.
Although most TFP growth on large dairy farms followed a similar pattern, they
also showed variation across locations. Large dairy farms in Heilongjiang produced
large TFP growth (1.57%), however, the TFP growth for some large dairy farms fell
from 2% to 4% in some provinces (e.g., Zhejiang, Anhui, Shandong, Gansu and
Xinjiang). In three cases, Beijing, Tianjin and Jiangsu, TFP growth fell by more than
5.5%.

21
Based upon the analysis of Tables 3-6, several important observations can be
made. Firstly, here were some differences, but most of the trends for TFP and its two
component elements – technological change and efficiency—moved in the same
direction across locations. Secondly, however, there were apparent differences in both
technological change (TC) and technical efficiency (TE) across locations and across
the types of dairy farms. Thirdly, it seems that technical efficiency is worsening while
technological change declined as herd size increased. It seems that overall, smaller
herd size dairy farms have had more of an advantage than larger herd size dairy farms
in China.
4.5 Technical efficiency level
Turning to the technical efficiency level, Appendix 4 presents such data by types of
dairy farms and by location. As can be seen, the average level of efficiency of
backyard dairy farms falls from 0.81 in 2004 to 0.65 in 2008; those for small dairy
farms fell likewise from 0.85 to 0.70; those for medium dairy farms fell from 0.66 to
0.55; those for large dairy farms fell from 0.95 to 0.80. This evidence suggests that
falling efficiency, at least in part, is due to the rapid expansion of China’s dairy herd
size and that at least part of the inefficiency fall may tend to correct itself when recent
extreme growth abates. At the same time, it may be that the fall in efficiency occurred
at a time when China’s technology transfer system was at its worst (Hu et al., 2004).
As for the differences in technical efficiency levels across types of dairy farms and
across regions, we can see the following. In 2008 the lowest technical efficiency of
backyard farms was as low as 55% in Guangxi and as high as 73% in Xinjiang. For

22
small dairy farms, the lowest technical efficiency was in Tianjin (65%) and the
highest technical efficiency in Yunnan (99%). The lowest technical efficiency was in
Guangxi (only 47%) and the highest technical efficiency in Yunnan (96%) for medium
dairy farms, while for large dairy farms, the lowest technical efficiency was in Tianjin
(77%) and the highest in Xinjiang (90%).
As mentioned previously, we are concerned with the results of Peng (2008),
which suggest that the aggregate average of technical efficiency levels was
approximately, 91.1%. To consider this issue further, see Appendix 5, which shows
min, max and mean of the input-output conversion ratios for each group of dairy
farms. Technical efficiency may be approximated as a ratio of minimum input-output
conversion ratio (a type of frontier) to the individual input-output conversion ratio. As
a result, the ratios of minimum input-output conversion ratios to average input-output
conversion ratios range from 63.3% to 71.7% for total cost, concentrate feed and grain.
These descriptive efficiency statistics are much closer to our empirical estimates (77.4%
as a whole) than those estimated by Peng (2008). This descriptive test also suggests
that the TFP growth on dairy farms has been driven by technical change rather than
efficiency improvements.
4.6 Comparisons with previous estimates
Here, we firstly compare our TFP estimates with previous studies. Rae et al., (2006),
estimate that between 1992-2001, TFP growth was 11.33% on specialized household
dairy farms and 6.80% on state-collective dairy farms. However, between 1992-2003,
TFP growth was estimated to be 2.33% on suburban specialized household dairy

23
farms and 0.25% on suburban state-collective dairy farms (see Ma et al., 2007). Prior
to 2004 the TFP growth of China’s dairy farms showed gradual attenuation, however
recently, the TFP growth of medium and large dairy farms exhibits a rapidly declining
trend (Tables 5 and 6).
Secondly, before 2004 the TFP growth pattern was mixed on China’s dairy farms.
For example, it was driven only by efficiency improvement on specialized household
dairy farms but by both technical change and efficiency improvement on
state-collective dairy farms (Rae et al., 2006). Similarly, it was driven by both
technical change and efficiency improvement on suburban specialized household
dairy farms and by only technological change on suburban state-collective dairy farms
(Ma et al., 2007). Thirdly, however, the TFP growth was driven only by technological
change since 2003.
Finally, the estimates of technical efficiency levels are consistent with previous
results, for example, for the period 1998-2001, average levels of technical efficiency
were 65% and 57% on specialized household dairy farms and commercial dairy farms,
respectively (Rae et al., 2006); by 2003 they were 68% and 64% on suburban
specialized household and state-collective dairy farms, respectively (Ma et al., 2007);
by 2008 they were 65%, 70%, 55% and 80% on backyard, small, medium and large
dairy farms, respectively (see Appendix 4). However, as mentioned above, our
estimates of technical efficiency levels are quite different from those of Peng (2008),
which seem, empirically, to be too high.

24
5. Conclusions and implications
In this research we have used survey data based upon a new classification system of
dairy farms to study China’s dairy farm productivity performance. The new panel data
allow us to investigate how dairy farms perform across farm herd sizes. The core of
the paper uses the data in a stochastic production frontier framework to measure and
decompose productivity growth for China’s dairy farming sector.
The rapid growth in dairy product consumption and production in China is an
important issue. New dairy farm construction has involved considerable domestic and
international investment in modern facilities, technologies and high-performing
livestock. Therefore, given the current state of dairy farms in China, it is not
surprising that the dynamism of China’s dairy farm sector is apparent from our
analysis. When we track the recent trends in dairy herd cohorts, we can see what
appears to be a rapid shifting pattern in dairy farm structure. Instead of increasing
backyard farms, post-2003, new dairy herd growth has been occurring in the larger
dairy units. The rise of larger dairy farms is clearly occurring, although backyard
farms still account for approximately 35% of the total farm sector (see Table 1).
One of the findings of this research is that there are significant differences in
production frontier function and inefficiency model across backyard farms, small
farms, medium farms and large farms. It is medium farms that were at the production
frontier, followed by backyard and small farms, and then large farms. Technical
efficiency was highest on medium farms and lowest on large farms. This finding
suggests that medium or smaller farms may be more suitable to China’s current
25
management. Another finding is that China’s dairy farms have been adopting
fodder-saving and concentrate-using technology in the past half decade. This is
especially evident for larger herd dairy farms. This, however, suggests that the
development of China’s dairy farms may be inconsistent with domestic agricultural
production as the practice leads, potentially, to an inefficient use of agricultural
resources (e.g., the alternative potential use of various crop stalks for fodder feed).
One of our conclusions is that dairy farmers, on average, have not been able to
keep at the rapidly advancing production frontier. While dairy farms produced on
average at 66% - 95% of potential in 2004, this has fallen to 55%-80% by 2008. In
addition, it seems that the adoption of new technologies has not been evenly spread
throughout the dairy farm sector, with the slow- and non-adopters falling behind. The
low technical efficiency in this sector is more likely influenced by the fact that dairy
herds have been expanding rapidly during the study period. In such an environment of
new dairy farm developments and rapidly increasing factor inputs, much
experimentation and perhaps mistakes by new dairy farmers in the search for new
technologies might be expected. Finally, positive and often rapid technical change,
coupled with negative efficiency growth, was also a common finding across locations.
Such an observation may guide government priorities and policies to favor certain
localities and farm types over others for new investments (e.g., Shanghai in Table 5,
and Beijing and Tianjin in Table 6).
One likely reason for the low technical efficiency on China dairy, especially on
larger dairy farms, is insufficient feed. As discussed previously, as farm sizes increase,

26
the ratios of fine feed to total feed input apparently decreases for example, the ratios
of concentrate feed to total feed input (concentrate and fodder) are 77.3% on backyard
farms, 76.4% on small farms, but 65.7% on medium farms and 61.8% on large farms.
The same is true for the ratios of grains input to total feed input, which are 54.6% on
backyard farms, 53.9% on small farms, but only 45.8% on medium farms and 43.2%
on large farms. To consider whether this is likely to be responsible for the low
technical efficiency, we interviewed many animal and dairy farm experts from the
Chinese Academy of Agricultural Sciences and Agricultural University in China.1
There also appears to be considerable scope for improving productivity
performance by increasing the technical efficiency of dairy farmers. Attention to the
use of best practice techniques for given technologies and diffusion of modern
successful technologies would appear to be priorities, if average TFP growth is to
more closely approach the rate of growth in technical change. While part of the
inefficiency may be a function of the dynamism of the sector, more attention to
extension and the development of more appropriate techniques might help mitigate
some of the inefficiencies which could result in higher levels of TFP growth.
What they said is that China’s varieties of dairy cattle are the same as in other
countries, however, the yield from dairy cattle in China is much lower, perhaps as
much as 25-30% for the best varieties. Such low yields, they conclude are caused
by lower than optimal levels of fine feed input.
1 Two of the animal experts we interviewed were Dr. Junmin Zhang, from the Institute of Animal Sciences, Chinese Academy of Agricultural Sciences, and Dr. Qingdong Yin, from College of Animal Sciences, China Agricultural University.

27
Alternatively, apparently, increasing fine feed input, especially on large dairy units
will be another policy choice if China wants to significantly reduce its imports of
dairy products and increase farm gate prices of coarse grains.
There are more factors contributing to variations in TFP growth patterns across
herd sizes and across locations that we were unable to explicitly incorporate in our
models. These include information on the breed composition of dairy herds; the
influence of sectoral policies on credit and investment; local climatic conditions and
the nature of available roughage resources. Had data been available to construct
suitable variables, some of these could have been included in the efficiency model.
We should also emphasize that the omission of climatic variables could have resulted
in a downward bias in the technical efficiency estimates.

28
References:
1. ACPCRD [National Agricultural Commodity Production Cost and Return Data],
Beijing: China Statistical Publisher, 2005-2009.
2. Brümmer, B., Glauben, T., and Thijssen, G., 2002. Decomposition of productivity
growth using distance function: the case of dairy farms in three European
countries. American Journal of Agricultural Economics, 84, 628-644.
3. CDSY [China Dairy Statistical Yearbook], Beijing: China Agricultural Publisher,
2003-2009.
4. Coelli, T. J., and Perelman, S., 2000. Technical efficiency of European railway: a
distance function approach. Applied Economics, 32, 1967-1976.
5. Coelli, T., 1996. A guide to frontier version 4.1: a computer program for
stochastic frontier production and cost function estimation. CEPA working paper
96/07. University of New England, Armidale, Australia.
6. Hu, R. F., Huang, J. K., Qiu, L., 2004. Agricultural technology extension in China:
current issues, challenges and policies. Management World (in Chinese), 5,
50-57.
7. Huang, J. K., Rozelle, S., 1996. Technological change: rediscovering the engine
of productivity growth in China’s rural economy. Journal of Development
Economies, 49, 337-369.
8. Jin, S. Q., Huang, J. K., Hu, R. F., Rozelle, S., 2002. The creation and spread of
technology and total factor productivity in China’s agriculture. American
Journal of Agricultural Economics, 84, 916-930.

29
9. Jin, S. Q., Ma, H. Y., Huang, J. K., Hu, R. F., and Rozelle, S., 2010. Productivity,
efficiency and technical change: measuring the performance of China’s
transforming agriculture. Journal of Productivity Analysis, 33, 191-207.
10. Karagiannis, G., Midmore, P., and Tzouvelekas, V., 2004. Parametric
decomposition of output growth using a stochastic input distance function.
American Journal of Agricultural Economics, 86, 1044-1057.
11. Khumbakar, S. C., and Lovell, C. A. K., 2000. Stochastic frontier analysis.
Cambridge University Press.
12. Ma, H. Y., Rae, A. N., Huang, J. K., and Rozelle, S., 2007. Enhancing
productivity on suburban dairy farms in China. Agricultural Economics, 37,
29-42.
13. Mundlak, Y., 1996. Production function estimation: reviving the primal.
Econometrica, 64, 431-18.
14. Paul, C. J. M., Johnson, W., and Frengley, G., 2000. Efficiency in New Zealand
sheep and cattle farming: the impacts of regulatory reform. Review of Economics
and Statistic, 82, 325-337.
15. Peng, X. F., 2008. Analysis of technical efficiency on China’s dairy farms.
Journal of Agrotechnical Economics (in Chinese), 6, 23-29.
16. Rae, A. N., Ma, H. Y., Huang, J. K., and Rozelle, S., 2006. Livestock in China:
commodity-specific total factor productivity decomposition using new panel data.
American Journal of Agricultural Economics, 88, 680-695.
17. Schmidt, P., 1988. Estimation of a fixed-effect Cobb-Douglas system using panel

30
data. Journal of Econometrics, 37, 361-80.
18. Tian, W. M., and Wan, G. H., 2000. Technical efficiency and its determinants in
China’s grain production. Journal of Productivity Analysis, 13, 159-74.

31
Table 1. The evolution of cow numbers and milk output across China’s dairy farm sizes over time
Year ≤10 Heads 10<Heads≤50 50<Heads≤500 >500 Heads
Shares (%) of cow numbers over farm sizes:
2004 56.6 23.5 15.0 4.9
2005 52.6 25.0 17.4 5.0
2006 51.0 25.4 17.8 5.7
2007 49.0 24.6 19.0 7.4
2008 42.9 27.2 19.8 10.1
2008-2004 -13.7 3.7 4.8 5.2
Change % (2004-2008)
-24.2 15.7 32.0 106.1
Shares (%) of cow milk output over farm sizes:
2004 49.0 24.9 18.6 7.5
2005 44.2 27.5 20.3 7.9
2006 42.5 28.0 20.8 8.7
2007 40.2 26.8 22.2 10.8
2008 35.3 28.3 23.0 13.3
2008-2004 -13.7 3.4 4.4 5.8
Change % (2004-2008)
-28.0 13.7 23.7 77.3
Data source: China Dairy Statistical Yearbook, 2005-2009.
Table 2. Farm size, yields and major inputs across farm types over time in China
Year Farm size Yield Concentrat Grain Fodder Labor Capital

32
(head) (kg) e (kg) (kg) (kg) (day) (Yuan)
1. Backyard dairy farms (≤10 heads)
2004 3.1 5082 2791 1985 659 66.1 1340 2005 3.1 4820 2585 1816 747 62.6 1359 2006 3.2 4876 2680 1898 829 60.8 1262 2007 3.2 4967 2729 1944 898 57.2 1269 2008 3.1 5141 2781 1937 859 58.6 1186 Mean 3.1 4977 2713 1916 798 61.1 1283
2. Small dairy farms (>10 heads≤50)
2004 12.7 5159 2548 1810 927 47.1 1726 2005 13.9 5174 2642 1797 791 45.3 1243 2006 14.4 5149 2807 1994 862 43.9 1182 2007 11.6 5162 2740 1963 791 43.7 1173 2008 10.8 5156 2794 1989 808 40.6 1158 Mean 12.7 5160 2706 1910 836 44.1 1296
3. Medium dairy farms (>50 heads≤500)
2004 58.1 5492 2819 1939 1499 45.8 1426 2005 63.8 5578 3005 2074 1484 39.8 1338 2006 63.8 5571 2912 2043 1603 39.5 1335 2007 67.6 5648 2932 2049 1623 40.6 1493 2008 63.0 5556 2845 2000 1355 34.6 1396 Mean 63.3 5569 2903 2021 1513 40.1 1398
4. Large dairy farms (>500 heads)
2004 1023.6 6244 3142 2185 2096 39.5 1719 2005 947.8 6251 3090 2198 2101 38.8 1553 2006 1021.6 6153 3130 2201 2022 35.4 1655 2007 1003.9 6317 3304 2287 1838 31.6 1806 2008 1039.9 6346 3381 2321 1847 32.4 1894 Mean 1007.4 6262 3209 2238 1981 35.5 1725
Data source: ACPCRD, 2005-2009. Note: Capital includes depreciation, fixed asset repair and maintenance, small tool purchase and other equipment and is measured on 2000 price.
Table 3. Decomposition of total factor productivity (TFP) into technical efficiency (TE) and technological change (TC) on backyard dairy farm in China (≤10 heads)
Province Period Obs TFP decomposition (%)
TFP TE TC
National 2004-2008 5 1.07 -5.27 6.34
33
Shanxi 2004-2008 5 -0.53 -5.85 5.32
Inner Mongolia 2004-2008 5 1.83 -5.26 7.09
Jilin 2004-2008 5 4.40 -4.27 8.67
Heilongjiang 2004-2008 4 2.86 -3.49 6.35
Zhejiang 2004-2006 3 2.13 -7.69 9.82
Shandong 2004-2008 5 1.97 -4.88 6.85
Henan 2004-2008 5 2.02 -4.80 6.81
Guangxi 2004-2008 5 -0.45 -4.88 4.42
Chongqing 2004-2008 5 0.25 -5.15 5.39
Guizhou 2005-2008 4 -2.59 -6.48 3.88
Yunnan 2004-2007 4 10.58 -0.06 10.64
Shaanxi 2004-2008 5 -1.24 -8.41 7.17
Xinjiang 2004-2008 5 -0.16 -6.57 6.41
Note: Only those provinces with three and over observations are listed in this table.

34
Table 4. Decomposition of total factor productivity (TFP) into technical efficiency (TE) and technological change (TC) on small dairy farm in China (>10 heads≤50)
Province Period Obs TFP decomposition (%)
TFP TE TC
National 2004-2008 5 1.00 -4.88 5.88
Tianjin 2004-2008 5 -0.48 -6.63 6.14
Hebei 2004-2008 5 1.53 -4.56 6.09
Shanxi 2006-2008 3 -1.13 -5.78 4.65
Inner Mongolia 2004-2008 5 -0.16 -6.82 6.66
Liaoning 2004-2008 5 -3.36 -6.59 3.22
Jilin 2004-2008 5 3.21 -4.16 7.38
Heilongjiang 2004-2008 5 2.11 -3.52 5.62
Fujian 2004-2008 5 0.10 -4.50 4.60
Shandong 2004-2008 5 2.69 -4.19 6.87
Henan 2004-2008 5 0.32 -5.34 5.66
Hunan 2004-2008 5 5.57 -4.42 9.99
Guangxi 2004-2008 5 0.19 -4.45 4.64
Sichuan 2004-2008 5 1.55 -4.00 5.56
Yunnan 2004-2008 5 8.92 -0.13 9.05
Ningxia 2004-2008 4 -3.78 -7.37 3.59
Xinjiang 2004-2007 3 -0.28 -5.58 5.30
Note: Only those provinces with three and over observations are listed in this table.

35
Table 5. Decomposition of total factor productivity (TFP) into technical efficiency (TE) and technological change (TC) on medium dairy farm in China (>50 heads≤500)
Province Period Obs TFP decomposition (%)
TFP TE TC
National 2004-2008 5 -1.12 -4.71 3.60
Beijing 2004-2008 5 -0.19 -4.64 4.46
Tianjin 2004-2008 5 -1.08 -5.49 4.41
Shanxi 2006-2008 3 -0.34 -5.78 5.44
Inner Mongolia 2004-2008 5 -1.26 -6.84 5.58
Jilin 2004-2008 5 2.71 -1.95 4.66
Heilongjiang 2004-2008 5 1.30 -3.42 4.73
Shanghai 2004-2008 5 -5.24 -4.33 -0.90
Zhejiang 2004-2006 3 -2.33 -5.81 3.48
Anhui 2004-2008 5 -1.04 -5.10 4.06
Fujian 2004-2008 5 -0.78 -4.64 3.86
Henan 2004-2008 5 -0.47 -5.65 5.18
Hunan 2004-2008 4 -3.78 -6.87 3.09
Guangxi 2004-2008 5 1.44 -3.76 5.21
Hainan 2004-2006 3 0.14 -6.58 6.72
Chongqing 2004-2008 5 -1.62 -5.15 3.53
Shaanxi 2004-2008 5 -5.51 -5.24 -0.27
Gansu 2004-2008 5 -2.46 -6.45 3.98
Ningxia 2004-2008 5 0.28 -4.15 4.43
Xinjiang 2005-2008 4 -1.99 -5.62 3.63
Note: Only those provinces with three and over observations are listed in this table.

36
Table 6. Decomposition of total factor productivity (TFP) into technical efficiency (TE) and technological change (TC) on large dairy farm in China (>500 heads)
Province Period Obs TFP decomposition (%)
TFP TE TC
National 2004-2008 5 -2.28 -4.31 2.03
Beijing 2004-2008 3 -7.52 -5.35 -2.17
Tianjin 2004-2008 5 -5.62 -5.91 0.29
Liaoning 2004-2008 5 -0.46 -3.63 3.16
Heilongjiang 2004-2008 5 1.57 -3.45 5.02
Jiangsu 2004-2008 5 -5.40 -5.67 0.27
Zhejiang 2004-2008 5 -4.13 -4.65 0.52
Anhui 2004-2008 5 -2.18 -4.87 2.69
Fujian 2004-2007 4 -1.66 -4.93 3.27
Shandong 2004-2008 5 -3.17 -4.43 1.26
Henan 2004-2008 5 -0.53 -4.21 3.68
Hubei 2004-2008 5 -1.96 -4.82 2.86
Guangdong 2004-2008 5 -1.09 -5.43 4.34
Gansu 2004-2008 5 -3.62 -3.46 -0.16
Qinghai 2004-2008 5 -0.36 -5.09 4.73
Xinjiang 2004-2008 5 -2.72 -2.24 -0.49
Note: Only those provinces with three and over observations are listed in this table.

37
Appendix 1. The distribution of milk outputs across farm sizes for major milk producing provinces in China
Province ≤10 Heads 10<Heads≤50 50<Heads≤500 >500 Heads
Shares (%) of cow milk output by farm sizes in 2004:
Inner Mongolia 63.7 27.6 8.2 0.4 Heilongjiang 54.8 28.9 15.1 1.2 Hebei 54.5 25.2 18.3 2.0 Henan 37.8 23.5 26.9 11.8 Shandong 39.8 29.6 23.5 7.0 Shaanxi 75.3 12.9 9.6 2.3 Xinjiang 55.8 23.6 15.4 5.3
Shares (%) of cow milk output by farm sizes in 2008:
Inner Mongolia 45.9 32.6 17.4 4.1 Heilongjiang 40.7 39.4 16.4 3.4 Hebei 32.6 26.2 25.0 16.2 Henan 18.6 18.3 33.8 29.4 Shandong 24.4 25.7 32.7 17.2 Shaanxi 55.6 16.9 23.0 4.4 Xinjiang 44.7 28.0 17.0 10.3
Change % of milk output shares by farm sizes from 2004 to 2008:
Inner Mongolia -27.9 18.1 112.2 925.0 Heilongjiang -25.7 36.3 8.6 183.3 Hebei -40.2 4.0 36.6 710.0 Henan -50.8 -22.1 25.7 149.2 Shandong -38.7 -13.2 39.1 145.7 Shaanxi -26.2 31.1 139.9 92.3 Xinjiang -19.9 18.8 10.1 94.8
Data source: CDSY, 2005 and 2009. Note: The production shares of cow milk for seven major producing provinces are 25.7% (Inner Mongolia), 14.3% (Heilongjiang), 14.2% (Hebei), 7.8% (Henan), 6.5% (Shandong), 4.2% (Shaanxi) and 3.9% (Xinjiang) in 2008 (CDSY, 2009).

38
Appendix 2. Farm size, yields and inputs over farm types for some major dairy farming areas in 2008
Province Farm size (head)
Yield (kg)
Concentrate (kg)
Grain (kg)
Fodder (kg)
Labor (day)
Capital (Yuan)
1. Backyard dairy farms (≤10 heads)
Inner Mongolia 3.3 5160 3121 2185 573 51 1247 Liaoning 9.1 6051 2991 1994 555 74 1028 Heilongjiang 3.9 4782 2385 1669 845 60 1428 Shandong 3.8 5431 3053 2157 442 57 1076 Henan 3.3 4436 2381 1685 1066 70 1123 Shaanxi 2.7 4283 2665 1866 879 73 1720 Xinjiang 2.6 5040 2577 1699 871 50 1243
2. Small dairy farms (>10 heads ≤50)
Inner Mongolia 9.8 4891 2984 2089 654 47 1142 Liaoning 11.8 5990 3214 2250 974 39 1252 Heilongjiang 10.1 4777 2107 1466 889 54 1350 Hebei 11.6 5401 3040 2142 478 24 1467 Shandong 13.7 5275 2854 2112 513 38 833 Henan 12.6 4585 2535 1794 980 41 1380
3. Medium dairy farms (>50 heads≤500)
Inner Mongolia 52.9 5663 2651 1856 871 48 1170 Liaoning 55.5 6010 3071 2149 996 34 1507 Heilongjiang 51.0 5192 2488 1741 1030 55 1360 Henan 92.2 5161 2652 1881 1029 41 1487 Shaanxi 98.2 7018 3615 2531 1998 34 1819 Xinjiang 51.0 5500 1935 1355 1034 35 1727
4. Large dairy farms (>500 heads)
Liaoning 1061.9 5939 3353 2347 1383 40 1652 Heilongjiang 1046.4 5260 2527 1769 1181 38 1596 Shandong 1159.8 6788 3520 2429 2034 17 3230 Henan 1203.1 5295 2772 1979 1198 42 1577 Xinjiang 746.8 7243 3781 2647 2048 25 1401
Data source: ACPCRD, 2009.Note: Capital includes depreciation, fixed asset repair and maintenance, small tool purchase
and other equipment.
Appendix 3. The estimates of input distance production function and inefficient model for dairy farms

39
in China
Log variables Coefficient t-statistic Log variables Coefficient t-statistic
Input distance function model: tX -0.027 3 -3.49 Constant -3.972 -1.85 tX 0.008 4 0.63 Y 0.808 1 1.18 Dummy: Y -2.131 2 -2.99 Small farm 0.013 0.24 X -0.147 2 -0.16 Medium farm 0.222 4.06 X 2.352 3 3.86 Large farm -0.184 -2.75 X -0.278 4 -0.34 Y1Y1 -0.307 /2 -2.00 Inefficiency model: Y1Y 0.276 2 2.97 Constant -0.261 -0.63 Y2Y2 0.016 /2 0.41 t 0.048 3.60 X2X2 0.182 /2 1.83 Feed ratio -0.003 -0.30 X2X -0.109 3 -1.87 Farm sizes 0.000 -0.03 X2X -0.042 4 -1.08 Grain production 0.000 -0.63 X3X3 0.160 /2 3.67 Fixed assets 0.000 0.60 X3X -0.008 4 -0.22 Education 0.060 1.19 X4X4 0.023 /2 0.50 Dummy: Y1X 0.121 2 1.08 Small scale -0.069 -1.19 Y1X -0.190 3 -2.51 Medium scale 0.166 2.92 Y1X 0.004 4 0.04 Large scale -0.218 -1.94 Y2X -0.111 2 -1.72 Y2X -0.088 3 -2.94 Sigma-squared 0.008 13.76 Y2X 0.092 4 1.82 Gamma 0.291 6.45 T 0.961 4.20 tt/2 -0.006 -1.16 Log LF 340.4 - tY -0.107 1 -3.54 Observations 311 - tY 0.002 2 0.19 Parameters 30 - tX 0.017 2 1.29 Likelihood ratio 236 ***
Notes: Provincial dummy variables in the efficiency model are not displayed in this table. X1
*** indicates 1% significant level.
(labor) is used as numeraire. All are expressed on a per cow basis and t is a time trend.

40
Appendix 4. The changes of technical efficiency level across dairy farm types over time in China
Provinces 2004-2008
2004 2008 Provinces 2004-2
008 2004 2008
1. Backyard dairy farms: 2. Small dairy farms: National 73 81 65 National 78 85 70 Hebei 73 73 - Tianjin 73 84 65 Shanxi 70 79 63 Hebei 74 81 67 Inner Mongolia 74 82 66 Shanxi 70 0 67 Liaoning 70 - 70 Inner Mongolia 80 92 70 Jilin 77 84 71 Liaoning 84 96 74 Heilongjiang 75 78 67 Jilin 82 87 74 Zhejiang 82 89 - Heilongjiang 78 83 72 Shandong 74 81 66 Shandong 80 85 72 Henan 70 77 63 Henan 77 85 68 Guangxi 60 66 55 Sichuan 75 79 67 Yunnan 99 99 - Yunnan 99 100 99 Shaanxi 75 89 63 Ningxia 83 93 72 Ningxia 84 84 - Xinjiang 90 83 83 Xinjiang 83 94 73 3. Medium dairy farms: 4. Large dairy farms: National 61 66 55 National 88 95 80 Beijing 67 71 59 Beijing 91 98 84 Tianjin 58 66 53 Tianjin 87 97 77 Hebei 59 59 - Shanxi 81 - 78 Shanxi 56 - 53 Liaoning 92 98 85 Inner Mongolia 66 77 58 Heilongjiang 93 97 84 Liaoning 59 - 59 Jiangsu 75 83 66 Jilin 63 64 59 Zhejiang 89 97 81 Heilongjiang 62 65 57 Shandong 89 96 81 Zhejiang 66 70 - Henan 90 96 81 Henan 61 68 55 Sichuan 76 - - Guangxi 51 55 47 Yunnan 99 - 99 Sichuan 54 - 54 Gansu 88 94 82 Yunnan 97 98 96 Qinghai 88 97 79 Shaanxi 63 70 57 Xinjiang 96 98 90 Gansu 59 68 53 Ningxia 64 67 57 Xinjiang 68 75 63 Notes: 1) Dairy farm definitions refer to tables 3-6. 2) Only provinces accounting for over 1% of total cow milk output are listed.

41
Appendix 5. The input-output conversion coefficients across China’s dairy farm types in 2008
Year Total Cost (yuan)
Concentrate (kg)
Grain (kg)
Fodder (kg)
Labor (day)
Capital (Yuan)
1. Backyard dairy farms (≤10 heads)
Min 0.82 0.38 0.24 0.03 0.01 0.15 Max 1.89 0.76 0.53 0.35 0.03 0.47 Mean 1.29 0.55 0.39 0.17 0.01 0.25 Min/Max (%) 43.3 49.4 44.0 8.1 22.7 31.4 Min/Mean (%) 63.3 69.1 61.0 17.0 51.1 57.8
2. Small dairy farms (>10 heads≤50)
Min 0.90 0.26 0.18 0.05 0.00 0.09 Max 1.80 0.76 0.53 0.54 0.02 0.45 Mean 1.26 0.52 0.37 0.17 0.01 0.24 Min/Max (%) 50.2 34.9 34.9 8.8 20.9 20.4 Min/Mean (%) 71.7 50.3 49.9 28.3 40.6 38.0
3. Medium dairy farms (>50 heads≤500)
Min 1.00 0.30 0.21 0.05 0.00 0.04 Max 3.03 0.91 0.64 0.55 0.02 0.55 Mean 1.45 0.52 0.36 0.27 0.01 0.25 Min/Max (%) 33.2 32.8 32.8 8.8 16.5 6.9 Min/Mean (%) 69.1 57.3 57.6 17.8 36.1 15.1
4. Large dairy farms (>500 heads)
Min 1.07 0.29 0.17 0.11 0.00 0.13 Max 2.50 0.75 0.59 0.61 0.01 0.52 Mean 1.57 0.51 0.36 0.32 0.01 0.27 Min/Max (%) 42.7 38.7 29.1 17.2 13.4 24.3 Min/Mean (%) 68.1 56.3 48.1 33.3 26.5 47.1
Data source: ACPCRD, 2009. Note: Capital includes depreciation, fixed asset repair and maintenance, small tool purchase and other equipment.