china's unbalanced development, and what we can learn from it
TRANSCRIPT

Trinity College Trinity College
Trinity College Digital Repository Trinity College Digital Repository
Senior Theses and Projects Student Scholarship
Spring 2014
China's Unbalanced Development, And What We Can Learn From China's Unbalanced Development, And What We Can Learn From
It It
Manfredo F. Camperio Ciani Trinity College, [email protected]
Follow this and additional works at: https://digitalrepository.trincoll.edu/theses
Part of the Asian Studies Commons, Economic Theory Commons, Growth and Development
Commons, International Economics Commons, and the Public Administration Commons
Recommended Citation Recommended Citation Camperio Ciani, Manfredo F., "China's Unbalanced Development, And What We Can Learn From It". Senior Theses, Trinity College, Hartford, CT 2014. Trinity College Digital Repository, https://digitalrepository.trincoll.edu/theses/377

China’s Unbalanced Development and what we can learn from it
by Manfredo Camperio
China’s Unbalanced Development Manfredo Camperio
1
Abstract:
This paper argues that China’s development is unbalanced, and to see the
unbalance we must divide the concept of development into different categories
representing its different aspects, such as economic, urban, social, and sustainable. By
looking at the different characteristics of development through time, it is possible to see
where the unbalance lies. Furthermore, we learn that by categorizing the nature of
development, we can gain a more comprehensive insight into the development of
individual countries. In conclusion, this paper proposes the creation of a possible
Development Index, as it can provide greater understanding of each country’s
development.
Acknowledgment:
There are numerous people to whom I owe thanks: Dr. Xiangming Chen guided
me through the rough seas of statistics and the uncharted mountains of China. He steered
my passion towards a specific and realistic goal: something a dreamer such as I can only
dream of! Professor Anne-Marie Hanson helped me to realize that I was “talking, but not
saying”. What would I have done without her questions: “What do YOU think this
means? What do YOU want to accomplish?” I thank my partner Susan Puente-Matos, for
gracefully enduring long discussions and providing me with great feedback. And lastly, I
thank my parents, Filippo and Carolina: for believing in me, advising me, and for giving
me this opportunity.

China’s Unbalanced Development Manfredo Camperio
2
Content
Introduction: ....…………………………………………………….3
Literature Review: …………………………………………………5
Development: ……………………………………………………...7
Categorizing Development: …………………………………….....13
The National Imbalance: ………………………….………....…….16
The Regional Imbalance: ….……………………...……………….20
What do We Learn - The Development Index: ………………….…28
Bibliography: ………………………………………………………31
Appendix: ……………………………..……………………...……34

China’s Unbalanced Development Manfredo Camperio
3
Introduction
Over the past thirty-five years, China has undergone a rate of development
unprecedented in human history. At the same time, China has also experienced the
greatest human migration the world has ever known. But lately, China has experienced
something even more unusual. From 1978 to present, nearly 160 million people have
migrated from rural lands to urban areas1. And if that were not enough, the Chinese
Government is planning to actively relocate to urban areas another 250 million rural
residents in the next twelve years.2 Yet, recently China has experienced the beginning of
a small countermovement: some migrants have started seeking “a life back home.”3 As
Katie Hunt suggests, some rural migrants are starting to feel that the advantages of urban
life are being outweighed by the disadvantages, and returning home is the preferable
option. Even though the quantity of income is greater in urban areas than in rural lands,
the quality of life is not.
Countless literary works discuss China’s unbalance. Authors4 of these works
argue that China’s economic growth is not what it seems, but that our perception of it is
misguided due to various flaws in economic statistics and data collection. I, however, do
not argue that China’s economic development is unbalanced, as many people already
have, but that China’s overall development is unbalanced between quantity and quality: a
timeless human dilemma that affects all aspects of our lives.
1 "The Largest Migration in History: China's Migrant Workers." The Economist 2 Johnson, Ian. "China’s Great Uprooting: Moving 250 Million Into Cities." The New York Times. 3 Hunt, Katie. "China's Migrant Workers Seek a Life Back Home." CNN. 4 Dorrucci, Ettore, Gábor Pula, and Daniel Santabárbara. China's Economic Growth and Rebalancing; ecc.

China’s Unbalanced Development Manfredo Camperio
4
The development of a country is such a complicated process that humans cannot
possibly claim to have figured it all out. As Zachary Karabell writes in his work The
Leading Indicators, “no one number can measure our lives.”5 Development involves
uncountable factors from a plethora of different fields, and thus it is impossible to
accurately statistically measure. However, as Galileo Galilei once said, “measure what is
measurable, and make measurable what is not.” 6 As required by the limited knowledge
of humans, we must simplify as much as we can in order to make it measurable and start
to understand what stands before us.
So how does quality and quantity apply to development? It is easy to see how
these apply when carrying out one activity, such as building construction. Carrying out a
series of constructions rapidly and cheaply prioritizes quantity at the expense of quality.
However, when looking at a country as a whole, matters are not so simple. When a
country finds a new coal bed, it must organize a budget to be allocated for the building of
infrastructure capable of extracting and shipping the coal. A small town, typically called
a coal town or camp, will be built to house the coalmine workers, and roads and railroads
will be extended to reach the newly discovered resource. But if part of that initial budget
is not set aside to build schools, hospitals, and monitoring facilities in the coal town, the
next generation of workers will grow up uneducated, ill, and unsafe. This simplified
metaphor serves to explain what quality and quantity mean in regards to a country’s
development: in metaphorical words, urban and economic development can refer to the
quantity of development, and social and sustainable development can refer to quality of
it.
5 Karabell, Zachary. The Leading Indicators. (Page 247) 6 BrainyQuote, <http://www.brainyquote.com/quotes/quotes/g/galileogal381325.html>.

China’s Unbalanced Development Manfredo Camperio
5
Even so, it must be specified that development is an indivisible concept that is
essentially not divided into categories. Under the conventional definition, urban
development is essentially equal to social development, economic development, and
sustainable development: schools and hospitals are just as much a part of social and
sustainable development as they are a part of economic and urban development. At the
same time, railroads and markets are a part of urban and economic development just as
much as they are a part of social and sustainable development. But in order to see how
the development of China is unbalanced, we must try to look at different aspects of
development separately in order to pinpoint what is being neglected and what is being
over-emphasized. We must measure the immeasurable, and so lines must be drawn where
lines do not exist, allowing us to start measuring.
Literature Review
The literature on development and relating topics is immense, and the literature
on China’s situation specifically is rapidly increasing. I particularly focused on
evaluations of how the current ruling indicators of development came about, such as
Karabell’s The Leading Indicators and Peet’s Theories of Development; critiques on
those ruling indicators, such as Ferguson’s The Anti-Politics Machine and Lochner’s Are
GDP/GNP Appropriate Measures of Development?; proposals of new indexes, such as
Human Development Reports and Social Progress Index; and on evaluations of China’s
situation, such as Dorrucci’s China's Economic Growth and Rebalancing.
China’s Unbalanced Development Manfredo Camperio
6
Zachary Karabell argues in The Leading Indicators: A Short History of the
Numbers that Rule Our World that the world works extremely differently from how it
used to work merely a century ago, when today’s leading indicators were conceived;
because of this, the indicators are not accomplishing our intended goals anymore. In fact,
it is impossible to see China’s imbalance when looking at its GDP, unemployment, and
inflation. In his work The Anti-Politics Machine, by now a basis of the development
discussions, James Ferguson argues that even though the institutions that calculate
development do their job as best they can, development is far too complicated to
calculate, and so, the measurement of it should not even be attempted, as it will always be
wrong and misleading7. However strongly Galileo would have disagreed with this
argument, Ferguson has had great insight on the issue and attracted many followers to his
side.
Nevertheless, following Galileo’s belief, many people, such as Amartya Kumar
Sen and Mahbub-ul-Haq, have attempted to measure the immeasurable. The Human
Development Reports and the Social Progress Index are both innovative attempts at
measuring development. They both select important indicators for human livelihood and
attempt to summarize them quantitatively. The first, the Human Development Index,
includes economic indicators among others, while the Social Progress Index does not
include economic indicators at all. But before directly applying the lessons from this vast
literature to China, we must first grasp the basic concepts that surround the measurement
of development.
7 Ferguson, James. The Anti-politics Machine: "development," Depoliticization, and Bureaucratic Power in Lesotho. Cambridge, England: Cambridge UP, 1990.

China’s Unbalanced Development Manfredo Camperio
7
Development
de·vel·op·ment
noun \di-�ve-ləp-mənt, dē-\
: the act or process of growing or causing something to grow or become larger or more advanced
: the act or process of creating something over a period of time
: the state of being created or made more advanced
It is incredible to think that before a century ago statistics and indexes were
almost entirely irrelevant to government operations. Government-collected economic
data and calculated statistics grew increasingly important because of the Great
Depression and the consequent realization that governments were clueless about what
was happening in their country and why.8 The ancestors of today’s leading indicators
were born in a world in which nation-states still had fairly ‘enclosed’ economies, where it
was easy to pinpoint which country produced what; and governments knew nothing about
their country’s employment rate, cost of living, or even of their country’s gross domestic
product. As Karabell claims, these indicators were created simply to provide
governments with a general understanding of what was going on within their country, not
to determine whether the people of a country were doing well; or least of all created to
provide predictions of the future.9
Today, these same indicators are used as undisputed labels for a country’s rank in
the world. Many people have spoken out against giving such authoritative power to these
newborn statistics that are, at best, still in their trial stage. Robert Kennedy was of this
opinion, and he spoke of the issue at a campaign speech at the University of Kansas a few
8 Karabell, Zachary. The Leading Indicators: A Short History of the Numbers That Rule Our World. 9 Karabell, Zachary. The Leading Indicators: (Page 242)

China’s Unbalanced Development Manfredo Camperio
8
months before his assassination. He spoke such eloquent words that it would be unwise
not to quote them in their entirety:
“Too much and too long, we seem to have surrendered community excellence and
community values in the mere accumulation of material things. Our gross national
product… if we should judge America by that, counts air pollution and cigarette
advertising, and ambulances to clear our highways of carnage. It counts special locks for
our doors and the jails for those who break them. It counts the destruction of our redwoods
and the loss of our natural wonder in chaotic sprawl. It counts napalm and the cost of a
nuclear warhead, and armored cars for police who fight riots in our streets. It counts
Whitman’s rifle and Speck’s knife, and the television programs which glorify violence in
order to sell toys to our children.
Yet the gross national product does not allow for the health of our children, the
quality of their education, or the joy of their play. It does not include the beauty of our
poetry or the strength of our marriages; the intelligence of our public debate or the integrity
of our public officials. It measures neither our wit nor our courage; neither our wisdom nor
our learning; our devotion to our country. It measures everything, in short, except that
which makes life worthwhile. And it tells us everything about America except why we are
proud to be Americans.”10
These eloquent words point out the moral flaws these early economic indexes possessed.
They do not calculate the actual well being of people, but merely the material production
(regardless of the people’s well-being). As mentioned earlier, the same indexes that today
have the power to define nations and determine the future of entire populations were
originally created as simple measurements to provide governments with a general
understanding of what was being produced in their country, what was being imported,
and how many people were actively searching for a job. However, for some reason or
another, these indicators are now being interpreted as absolute representatives for the
well being of the people. Today, the mentality has become more than doubtful: the more
10 Karabell, Zachary. The Leading Indicators: (Page 48-49)

China’s Unbalanced Development Manfredo Camperio
9
a country produces, the better-off the people will be. Of course, this mentality has a
myriad of flaws and loopholes.
Even though these leading indicators have evolved, adapted, and become more
complex than their original predecessors, they still maintain their original skeleton to this
day. As Karabell argues, the world is not what it was a century ago: Iphones sold in the
US are assembled in China with parts that are produced in at least a dozen other countries
(and if we were to take into account the raw materials needed for the production of each
part, there would be many more than a dozen countries involved); each country taking a
share from the final price of the product.11 However, gross domestic product (GDP)
assumes that only China benefits from the sale of the Iphone, as it was finally assembled
in China.12 GDP does not take into account all the other countries involved in the
production. This is terribly flawed, and Karabell takes this argument all the way by
claiming that, in fact, there is no deficit between America and China, but we believe there
is because we are using indexes based on a mentality that is at least a century old.13
Today’s world is not one where one good is produced in one country, but one where
many countries with different skill-sets cooperate together in the production of a good.
The fact that China assembles the majority of the world’s products does not mean that it
will be the ruler of the world, as it would have meant a century ago and today’s indexes
still seem to suggest, but simply means that China has a specific role in the massive
industrial ‘conveyor belt’ of today’s global economy. The outsourcing of American jobs
to China does not mean the United States is on the decline, but rather that the United
States is taking up a new role in the ‘global conveyor belt’ and shedding its former role.
11 Karabell, Zachary. The Leading Indicators: (Page 174-176) 12 Karabell, Zachary. The Leading Indicators: (Page 172) 13 Karabell, Zachary. The Leading Indicators: (Page 170)

China’s Unbalanced Development Manfredo Camperio
10
America is becoming the exporter of ideas, capital, and services, all of which are barely
taken into account in today’s leading indicators.14
Even though indexes such as GDP are outdated and distort our view of the world
and the goals we strive towards, Karabell does not argue that indicators such as GDP are
irrelevant and must be discarded. Instead, he argues that such indicators should be used as
a part of a greater whole: “no one number can measure our lives.”15 Thanks to the works
of people like Ferguson, we have realized that the development of countries is a
complicated process that involves uncountable factors and many more variables.16
Because of this vast array of elements, methods of calculating development have to limit
themselves to selecting a handful of calculable factors used as representatives for their
category. From this mentality, the Human Development Index was created.
The Human Development Index (HDI) is a composite statistical index that
combines education, life expectancy, and income indices.17 It was created in the 1990’s
within the United Nations Development Program, planned and led by the Pakistani
economist Mahbub-ul-Haq. The central goal of the project was to shift focus of
development policies from “income accounting to people-centered policies.”18 Together
with his team and Nobel laureate Amartya Sen, Haq is credited with putting together the
HDI. This index sets minimum and maximum ‘goalposts’ for a country in each category,
14 Karabell, Zachary. The Leading Indicators: (Page 175-176) 15 Karabell, Zachary. The Leading Indicators. (Page 247) 16 Ferguson, James. The Anti-politics Machine: "development," Depoliticization, and Bureaucratic Power in Lesotho. Cambridge, England: Cambridge UP, 1990. 17 "Human Development Reports." Human Development Index (HDI). 18 Human Development Index (HDI). Human Development Index (HDI).

China’s Unbalanced Development Manfredo Camperio
11
and then calculates “where each country stands in relation to these goalposts, expressed
as a value between 0 and 1.”19
Over time the HDI has been changed, adapted, and diversified for different
purposes. Now, the HDI takes into account four factors: education, life expectancy,
wealth, and standard of living. The educational development factor is measured by taking
into account the “mean years of schooling for adults 25 years and expected years of
schooling for children of school entering age.”20 The life expectancy factor is calculated
“using a minimum value of 20 years and maximum value of 83.57 years.” For the wealth
factor, “the goalpost for minimum income is $100 (PPP) and the maximum is $87,478
(PPP)”21 The last factor, the standard of living, is measured by
“GNI per capita (PPP$) instead of GDP per capita (PPP$). The HDI uses the
logarithm of income to reflect the diminishing importance of income with
increasing GNI. The scores for the three HDI dimension indices are then
aggregated into a composite index using geometric mean.”22
By taking into account standard of living, wealth, education, and life expectancy,
the HDI essentially groups the four factors that are most important to humans, and
combines them into one number that shows where a country stands between 0 (which is
poor) and 1 (which is excellent). The latest HDI reports, calculated in 2013, show the
world’s leading country to be Norway, standing at 0.955, and the world’s lowest-ranked
country to be Niger, with 0.304. China is ranked 101st with an HDI of 0.69923.
The HDI has had great success and has received much positive feedback.
However, as development is so complex, the HDI also as many flaws. First of all, it
19 Human Development Index (HDI). Human Development Index (HDI). 20 Human Development Index (HDI). Human Development Index (HDI). 21 Human Development Index (HDI). Human Development Index (HDI). 22 Human Development Index (HDI). Human Development Index (HDI). 23 "Human Development Reports." United Nations Development Program.

China’s Unbalanced Development Manfredo Camperio
12
synthesizes all categories into one number, not allowing for the analysis of each
individual category represented. As we mentioned before, “no one number can measure
our lives.”24 That said, however, the HDI is still a leap forward from its predecessors. The
idea that economic output must be only one of many factors leading to a healthy
development, rather than the only factor, was a big innovation.
Like the HDI, the Social Progress Index, “builds upon an important legacy of
prior efforts to go beyond GDP in measuring national performance. […]It is based on a
holistic and rigorous framework for defining social progress based on 54 indicators of
social and environmental outcomes.”25 However, differently from the HDI, the Social
Progress Index does not include any economic indicators or factors at all. The fields this
index does consider are basic necessities, well-being, and opportunity. Interestingly
enough, the top three countries in terms of the Social Progress Index are New Zealand,
Switzerland, and Iceland; followed by the usual Northern European nations. The country
with the lowest Social Progress Index is Chad.26
This index is similar to the HDI in the way that it divides the world into different
categories that are deemed important, measures them, and summarizes them into one
number. However, it is a radical shift from the HDI in that it does not consider economic
factors as the objective of progress, but merely as a means for progress. Even thought this
mentality has much to be applauded for, it is not widely accepted.
Taking into consideration all the above-mentioned measuring methods, the next
step is to develop our own framework that will allow the world to clearly see the
circumstances within the development of a country, which in this particular case is China.
24 Karabell, Zachary. The Leading Indicators. (Page 247) 25 Porter, Michael E., Scott Stern, and Michael Green. Social Imperative Index. 26 Porter, Michael E., Scott Stern, and Michael Green. Social Imperative Index.

China’s Unbalanced Development Manfredo Camperio
13
From the old mantra of Galileo, we must make measurable the immeasurable to try and
make visible the imbalance in China’s development.
Categorizing Development
While today’s methods for looking at development provide a general overview of
the nature of a country’s development, it is possible to gain quite a different perspective
by looking at development in entirely separate categories. By doing so it is possible to see
each category in relation to one another and find out precisely if there are imbalances and
where they lie.
As discussed before, the Human Development Index takes into account the
economic and social aspects of development, while the Social Progress Index takes into
account social and environmental aspects of development. But to gain a more
comprehensive understanding, it is important to take more categories into account. For
the purpose of this research, categorizing development into economic, urban, sustainable,
and social development should be enough to see the Chinese imbalances between social
and economic development, and between sustainable and urban development;
figuratively speaking, the imbalance between quantity and quality.
First, as a representative factor for economic development, GDP per Capita
provides a nice compromise in the heated international discussions. It provides a
‘traditional’ GDP statistic, that will appease the GDP supporters and the international
system, and it provides a view of the lives of individuals, which will somewhat appease
China’s Unbalanced Development Manfredo Camperio
14
some of the GDP opponents. Needless to say, using any kind of GDP indicator comes
with all the flaws associated with GDP.
Second, as a representative factor for urban development, we will use the quantity
of rail lines (in kilometers). This can be considered to provide a good window on the state
of urban development, as rail lines are essential to the connectivity and prosperity of
cities, and are much more environmentally sustainable compared to highways, which
promote greater increases in pollution and fossil fuel consumption. However, if a country
for any reason decided to eliminate all rail lines and replace them with highways, this
indicator would become instantly useless and would have to be subject to change.
Third, as a representative for social development, public spending on education
(as a % of total expenditures) provides a good window to the social priorities of a
country. Education is a great indicator for social development because kindergartens,
school, universities, and so on, foster a fundamental social scene in which children will
grow up in, making it the future basis of that society. Furthermore, good education is
critical to a successful future: theoretically, the better the education, the brighter the
future. How much a country spends on education relative to how much they spend in total
will show how much a country cares about developing future generation.
Fourth, to measure sustainable development, we can use the amount of alternative
energy consumed as a percentage of total energy as a representative factor. Alternative
energy not only includes the four traditional renewable energy sources (geothermal, solar,
wind, and hydro), but also includes nuclear power. This is a good statistic for various
reasons: first, it does not represent how much alternative energy a country produces, as
that can be skewed by the amount it consumes. Second, a country might not produce any

China’s Unbalanced Development Manfredo Camperio
15
energy at all, in which case it will be importing it. Measuring how much alternative
energy a country consumes takes both possibilities into account. Third, this factor can
show how much a country is focusing on sustainability.
Taking into account the ‘sustainability’ of a country is essential to understanding
how healthy the future development of that country will be. As Filippo Camperio once
told me: “ you must not judge a marathon runner on his speed at the beginning of the race,
but on his capabilities of maintaining that speed throughout the race.” And just like a
marathon runner, a country must be judged on its capabilities to maintain its
development. Yes, China may have a rapidly increasing economic and urban
development, but is China’s development sustainable? Can it meet the need of the present
without compromising the ability of future generations to meet their own needs?
The idea of development can no longer exist without the concept of sustainability.
Only when human beings consumed a miniscule fraction of what we consume today
could we have the luxury of not placing much importance on the sustainability of our
development. According to the UN, the human population reached 7 billion people in
October of 2011.27 We can no longer afford not to take into account whether our
resources and lifestyles can sustain themselves and endure into the future.
Here is an overview of the indicators that we will use as a representative for each
development category:
Economic Development: GDP per Capita
Urban Development: Rail Lines (km)
Social Development: Gov. Spending on Education as % of Total Expenditure
Sustainable Development: % Alternative Energy Consumed 27 UN. "As World Passes 7 Billion Milestone, UN Urges Action to Meet Key Challenges."

China’s Unbalanced Development Manfredo Camperio
16
But however interesting and effective these representative are, they still have
many flaws. As stated before, development is immeasurable, and any method of
measuring it will prove to be flawed. Furthermore, the indicators selected above are basic
and can hardly stand-alone. Because of this project’s time, funding, and research
constraints, the indicators must be a few and basic in order to accomplish the goal of this
research in the allocated amount of time. This literary work is meant to initiate a new
chapter in the international development discussion, with the hopes to attract expert
research teams that can work on, adapt, and improve this method of measuring
development and its imbalances.
The National Imbalance
To gain maximum understanding on China’s development, we cannot simply look
at one moment in time, but must take into account a certain amount of precedence.
Analyzing a time span that is too large will make the results irrelevant, while analyzing a
time span that is too small will make the results superficial. In China’s particular case, a
30-year time span, from 1980 to 2010, seems to be appropriate to confidently defend the
argument on China’s unbalanced development.
Mao Zedong died on September 9, 1976.28 The infamous Gang of Four was
dismantled a month later for plotting the downfall of Mao’s successor, Hua Gofeng.29
The Cultural Revolution was coming to an end, with countless of skilled professionals
28 Reuters. "Mao Tse-Tung Dies In Peking At 82." 29 The Editors of Encyclopædia Britannica. "Gang of Four (Chinese Politicians)."

China’s Unbalanced Development Manfredo Camperio
17
unable to contribute to society and schools still shut down.30 Hua Gofeng proclaimed
“The Two Whatevers”: “we will resolutely uphold whatever policy decisions Chairman
Mao made, and unswervingly follow whatever instructions Chairman Mao gave.”31 In
1977 Deng Xiaoping, still in exile for “political mistakes,” was accepted back into
politics after expressing his support for Hua’s policies. By 1978, schools had reopened,
transition to “socialist modernization” was proclaimed, and the extreme aspects of Mao’s
personality cult were moderated.32 Nuclear weapon testing, missile, and space launches
still continued. In 1979 full diplomatic relations with the U.S.A. were finally established
and official diplomatic relations with Taiwan were officially terminated.33
These are the circumstances China found itself in during the 1980’s. The rest is
well known: “It does not matter whether a cat is black or white, so long as it catches
mice.”34 Deng Xiaoping became defacto leader and opened up China to international
markets.35 China’s communism transformed into “Socialism with Chinese
characteristics”36 and rapidly became the world’s largest manufacturer and one of the
world’s most powerful economies.37
Collecting the required data from 1980 to 2010 proved much harder than
expected. Thankfully, Trinity College provided me with the necessary research experts to
deal with such obstacles, and we were able to collect the required national data from the
World Bank’s database. To see China’s full national data collection on the indicators
30 "Cultural Revolution." History.com. 31 Xiaoping, Deng. "The "Two-Whatever" Policy Does Not Accord With Marxism -- Beijing Review." 32 Lamb, Stefanie. "SPICE." Introduction to the Cultural Revolution 33 "Exploring Chinese History Comprehensive." 34 Tyler, Patrick E. "Deng Xiaoping: A Political Wizard Who Put China on the Capitalist Road." The New York Times. 35 CNN. "Reformer with an Iron Fist." 36 Xiaoping, Deng. "Deng Xiaoping." Deng Xiaoping. Wellesley, 1984. 37 SIS International Research. "China since the 1980s and Moving forward”

China’s Unbalanced Development Manfredo Camperio
18
representing the four categories of development, please refer to appendix A (page 34).
Visualizing in graphs the data in Appendix A will clearly show the unbalanced
relationship shared by the four categories:
China's Economic & Urban Development
0500
100015002000250030003500400045005000
1980
1982
1984
1986
1988
1990
1992
1994
1996
1998
2000
2002
2004
2006
2008
2010
$
45,000
50,000
55,000
60,000
65,000
70,000
Economic
Urban
38
China's Social & Sustainable Development
0123456789
10
1980
1982
1984
1986
1988
1990
1992
1994
1996
1998
2000
2002
2004
2006
2008
2010
%
0
5
10
15
20
25
Sustainable
Social
39
The economic and urban development are clearly rapidly increasing, while the social and
sustainable development seem to be relatively stagnant, with only slight and fragmented
38 World Bank. "Indicators." Data World Bank. World Bank, Web. <http://data.worldbank.org/indicator>. 39 World Bank. "Indicators." Data World Bank. World Bank, Web. <http://data.worldbank.org/indicator>.

China’s Unbalanced Development Manfredo Camperio
19
China's Social & Sustainable Development
y = 0.1065x + 0.3019
y = 0.1948x + 15.435
0
1
2
3
4
5
6
7
8
9
10
1980
1982
1984
1986
1988
1990
1992
1994
1996
1998
2000
2002
2004
2006
2008
2010
%
0
5
10
15
20
25
Sustainable
Social
Linear (Sustainable)
Linear (Social)
increases. The next step is to add trend lines on each graph and calculate the respective
gradients to find out exactly what is the rate of increase of each category of development:
These gradients (which are the rate of increase) result to be 103.18 for economic
development, 506 for urban development, 0.195 for social development, and 0.106 for
sustainable development. The average gradient for conomic and urban development is
China's Economic & Urban Development
y = 506x + 48338
y = 103.18x - 617.95
-1000
0
1000
2000
3000
4000
500019
80
1982
1984
1986
1988
1990
1992
1994
1996
1998
2000
2002
2004
2006
2008
2010
$
45,000
50,000
55,000
60,000
65,000
70,000
Economic
Urban
Linear (Urban)
Linear (Economic)

China’s Unbalanced Development Manfredo Camperio
20
304.59, while the average gradient for social and sustainable development is 0.1505.
Divide one by the other, and you find out the exact relationship between the two: the rate
of increase of the urban and economic development is 2,023.85 times greater than the rate
of increase of social and sustainable development.
From these graphs and their respective gradients, we can easily deduce that China
is focusing too much on economic and urban development, and too little on social and
sustainable development. Figuratively speaking, China is focusing too much on the
quantity of their development, and too little on the quality of it. In order to reach a
balanced development that can continue in the future, China must drastically and rapidly
rebalance their focus.
It must be remembered that these conclusions are drawn from only four basic
indicators (GDP per capita, Rail Lines, Gov. Expenditure on Education as a % of Total
Expenditure, and % of Alternative Energy Consumed). In order to have an indubitable
and certain conclusion on the imbalances of development, many more indicators must be
included. This will provide more solid insight, which likely will suggest similar
conclusions to the graphs I have presented above, but surely will be much more
moderated and realistic. Hopefully, this method can be improved to the point that
international institutions can use it to study, analyze, and improve the development
process of all countries.
The Regional Imbalance
The process of development is a complicated one that is very hard to handle and
manage effectively. Furthermore, the imbalances of development do not stop at the

China’s Unbalanced Development Manfredo Camperio
21
national level at all, but can be very significant at the regional level as well. Many
countries provide a good example of this situation. Italy is strongly divided between the
wealthy economic north and the poorer agricultural south.40 Similarly, the United States
has deep socio-economic inequality among many of its states, such as Mississippi,
Arkansas, and Tennessee, which are incredibly poor relative to other states such as
Connecticut and New York41. But few countries exemplify regional development
imbalances as China does. The vast differences in development between Western and
Eastern China have sparked deep concerns among experts.42 In fact, the Chinese
government has acknowledged these concerns, and in 2000 enacted the “Go West”43
series of policies, aimed at developing its Western regions. Nonetheless, there is still
much to be achieved.
To begin analyzing the underlying developmental imbalance between Western
and Eastern China, we selected three regions from each area: Xinjiang, Gansu, and
Sichuan representing the Western regions, and Shanghai, Shangdong, and Zhejiang
representing the Eastern regions. Collecting the same data on the regional level proved to
be more arduous and very expensive compared to collecting the national data.
Thankfully, again, Trinity College provided me with an expert research team and
reasonable funds that aided me in this bureaucratic process. We collected the data directly
from the National Bureau of Statistics of China44. Because of the high cost and the lack
40 Bohlen, Celestine. "North-South Divide in Italy: A Problem for Europe, Too." 41 Sommeiller, Estelle, and Mark Price. "The Increasingly Unequal States of America: Income Inequality by State, 1917 to 2011." 42 Lu, Ding, and William A. W. Neilson. China's West Region Development = : Domestic Strategies and Global Implications ; Fan, Shenggen, Xiaobo Zhang, and Ravi Kanbur. "China's Regional Disparities: Experience and Policy." 43 Moody, Andrew, Hu Haiyan, and Ma Wei. "'Go West' Policy Is an Economic Milestone for Nation." 44 "Statistical Data." National Bureau of Statistics of China. Web. <http://www.stats.gov.cn/english/>.
China’s Unbalanced Development Manfredo Camperio
22
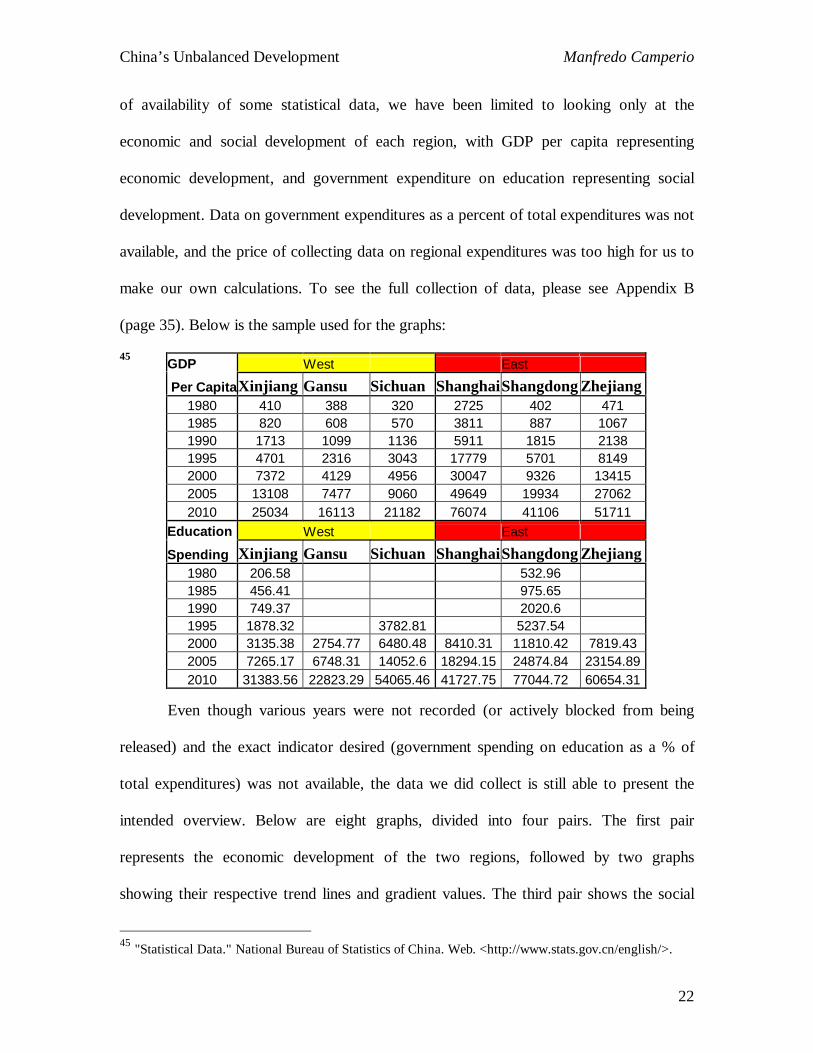
of availability of some statistical data, we have been limited to looking only at the
economic and social development of each region, with GDP per capita representing
economic development, and government expenditure on education representing social
development. Data on government expenditures as a percent of total expenditures was not
available, and the price of collecting data on regional expenditures was too high for us to
make our own calculations. To see the full collection of data, please see Appendix B
(page 35). Below is the sample used for the graphs:
45
Even though various years were not recorded (or actively blocked from being
released) and the exact indicator desired (government spending on education as a % of
total expenditures) was not available, the data we did collect is still able to present the
intended overview. Below are eight graphs, divided into four pairs. The first pair
represents the economic development of the two regions, followed by two graphs
showing their respective trend lines and gradient values. The third pair shows the social
45 "Statistical Data." National Bureau of Statistics of China. Web. <http://www.stats.gov.cn/english/>.
GDP West East
Per Capita Xinjiang Gansu Sichuan Shanghai Shangdong Zhejiang 1980 410 388 320 2725 402 471 1985 820 608 570 3811 887 1067 1990 1713 1099 1136 5911 1815 2138 1995 4701 2316 3043 17779 5701 8149 2000 7372 4129 4956 30047 9326 13415 2005 13108 7477 9060 49649 19934 27062 2010 25034 16113 21182 76074 41106 51711
Education West East
Spending Xinjiang Gansu Sichuan Shanghai Shangdong Zhejiang 1980 206.58 532.96 1985 456.41 975.65 1990 749.37 2020.6 1995 1878.32 3782.81 5237.54 2000 3135.38 2754.77 6480.48 8410.31 11810.42 7819.43 2005 7265.17 6748.31 14052.6 18294.15 24874.84 23154.89 2010 31383.56 22823.29 54065.46 41727.75 77044.72 60654.31

China’s Unbalanced Development Manfredo Camperio
23
development of the Western and Eastern regions, followed by two graphs showing their
respective trend lines and gradients.
Western Region Economic Development
0
10000
20000
30000
40000
50000
60000
70000
80000
1980 1985 1990 1995 2000 2005 2010
GD
P p
er C
apita
Xinjiamg
Gansu
Sichuan
Eastern Region Economic Development
0
10000
20000
30000
40000
50000
60000
70000
80000
1980 1985 1990 1995 2000 2005 2010
GD
P p
er C
apita
Shanghai
Shangdong
Zhejiang
46
As is clearly visible at a first glance, the Eastern regions have an economic development
that is increasing at a rate much greater than that of the Western regions. To put this in 46 "Statistical Data." National Bureau of Statistics of China. Web. <http://www.stats.gov.cn/english/>.
China’s Unbalanced Development Manfredo Camperio
24
numbers, as done earlier, we must see the actual values of the gradients and their
relationship:
Western Region Economic Development
y = 2283.7x - 4544.7
y = 3718.1x - 7278.4
y = 2978.1x - 6159.9
-10000
0
10000
20000
30000
40000
50000
60000
70000
80000
1980 1985 1990 1995 2000 2005 2010
GD
P p
er C
apita
Xinjiamg
Gansu
Sichuan
Linear (Gansu)
Linear (Xinjiamg)
Linear (Sichuan)
Eastern Region Economic Development
y = 11995x - 21409
y = 7749.5x - 16139
y = 5989.9x - 12649
-20000
-10000
0
10000
20000
30000
40000
50000
60000
70000
80000
90000
1980 1985 1990 1995 2000 2005 2010
GD
P p
er C
apita
Shanghai
Shangdong
Zhejiang
Linear (Shanghai)
Linear (Zhejiang)
Linear (Shangdong)
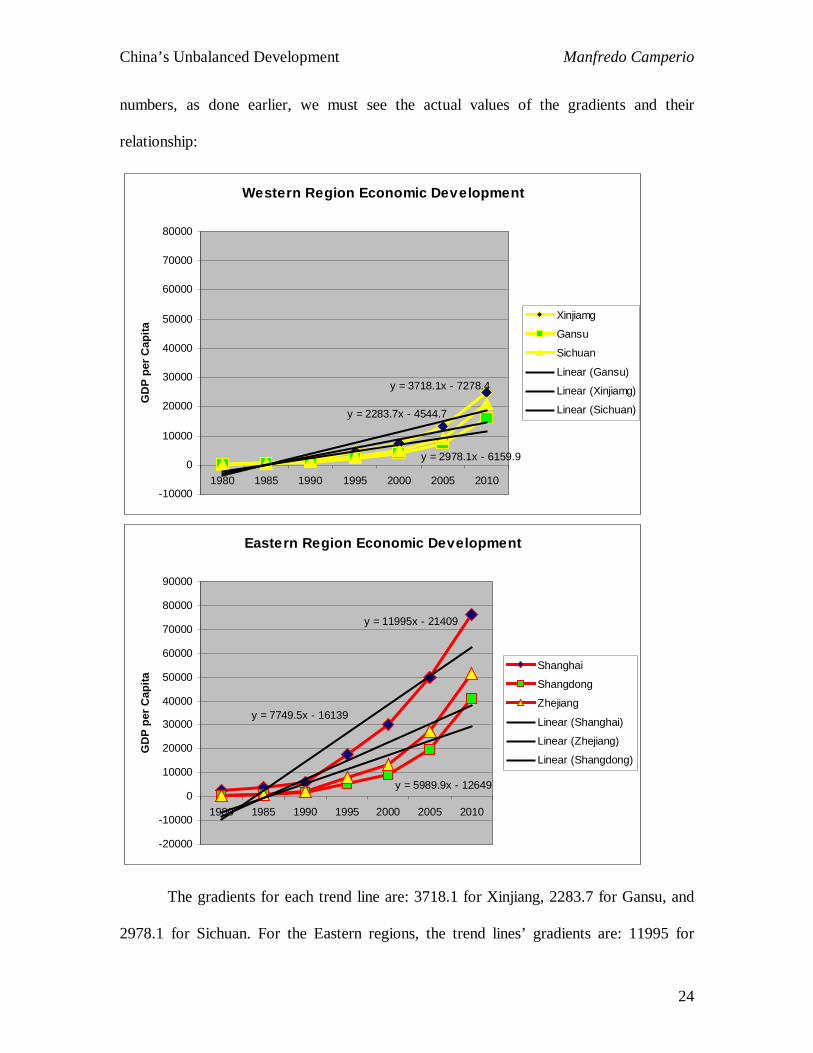
The gradients for each trend line are: 3718.1 for Xinjiang, 2283.7 for Gansu, and
2978.1 for Sichuan. For the Eastern regions, the trend lines’ gradients are: 11995 for

China’s Unbalanced Development Manfredo Camperio
25
Shanghai, 7749.5 for Zhejiang, and 5989.9 for Shangdong. The Western regions average
together to 2993.3, while the Eastern regions average to 8578.13. Again, there is a clear
imbalance, which amounts to the Eastern regions’ economic development increasing at a
rate 2.86 times greater than that of the Western regions.
At the same time, there is an imbalance between the two regions’ social
development, as can be seen by the two graphs below.
47
47 "Statistical Data." National Bureau of Statistics of China. Web. <http://www.stats.gov.cn/english/>.
Western Region Social Development
0
10000
20000
30000
40000
50000
60000
70000
80000
1980 1985 1990 1995 2000 2005 2010
Gov
. Spe
ndin
g on
Edu
catio
n
Xinjiang
Gansu
Sichuan
China’s Unbalanced Development Manfredo Camperio
26
Eastern Region Social Development
0
10000
20000
30000
40000
50000
60000
70000
80000
1980 1985 1990 1995 2000 2005 2010
Gov
. Spe
ndin
g on
Edu
catio
n
Shangdong
Zhejiang
Shanghai
48
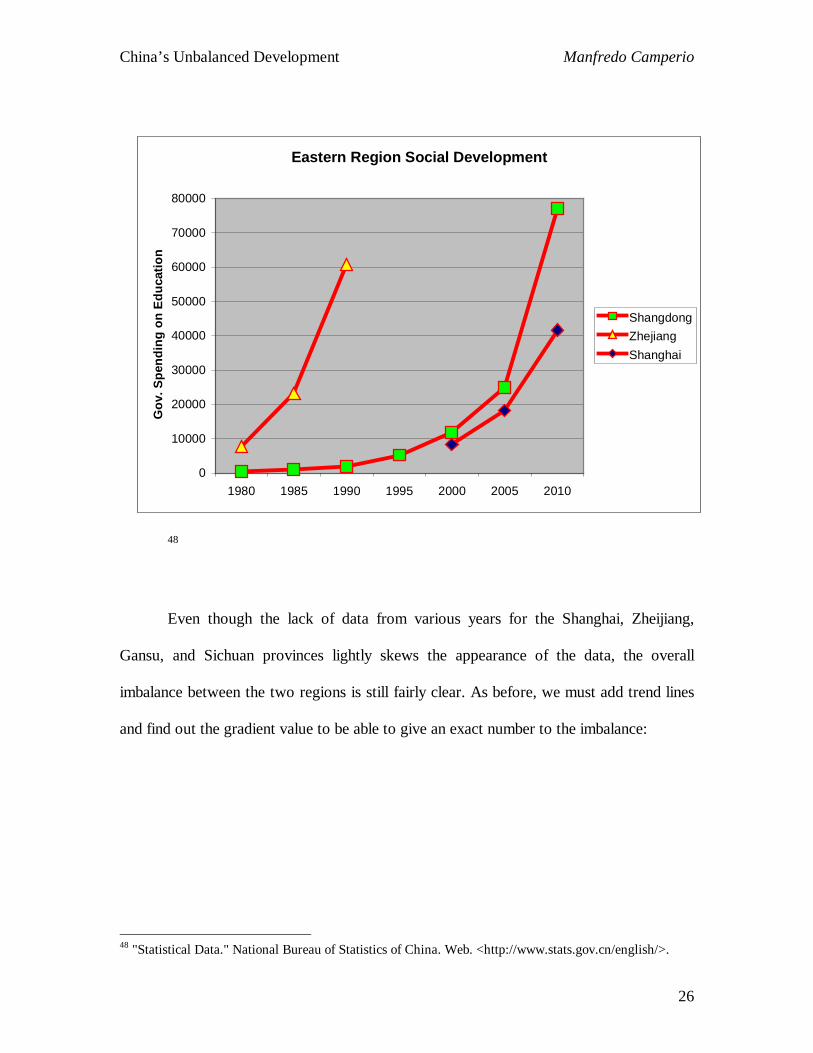
Even though the lack of data from various years for the Shanghai, Zheijiang,
Gansu, and Sichuan provinces lightly skews the appearance of the data, the overall
imbalance between the two regions is still fairly clear. As before, we must add trend lines
and find out the gradient value to be able to give an exact number to the imbalance:
48 "Statistical Data." National Bureau of Statistics of China. Web. <http://www.stats.gov.cn/english/>.

China’s Unbalanced Development Manfredo Camperio
27
Western Region Social Development
y = 3911.9x - 9208.5
y = 15842x - 67536
y = 10034x - 49430
0
10000
20000
30000
40000
50000
60000
70000
80000
1980 1985 1990 1995 2000 2005 2010
Gov
. Spe
ndin
g on
Edu
catio
n
Xinjiang
Gansu
Sichuan
Linear (Xinjiang)
Linear (Sichuan)
Linear (Gansu)
Eastern Region Social Development
y = 26417x - 22292
y = 10254x - 23518
y = 16659x - 771420
10000
20000
30000
40000
50000
60000
70000
80000
1980 1985 1990 1995 2000 2005 2010
Gov
. Spe
ndin
g on
Edu
catio
n
Shangdong
Zhejiang
Shanghai
Linear (Zhejiang)
Linear (Shangdong)
Linear (Shanghai)
The gradients for the Western region are: 15842 for Sichuan, 10034 for Gansu,
and 3911.9 for Xinjiang; while the gradients for the Eastern regions are: 16659 for
Shanghai, 10254 for Shangdong, 26417 Zhejiang. The averages result to be 9929.3 for
the Western regions, and 17776.67 for the Eastern regions; amounting to the Eastern

China’s Unbalanced Development Manfredo Camperio
28
Regions’ social development increasing at a rate 1.79 greater than that of the Western
Regions.
All together these graphs and their respective gradients tell us that the economic
and social development of the Eastern Regions are increasing at a rate 2.86 and 1.79
times greater than that of the Western regions, respectively. However, as said before,
these numbers are drawn from few and basic indicators, and are summarized in a very
simplified manner. Even so, the numbers do show that an imbalance lies between the
developments of the two regions.
What do We Learn The Development Index
To summarize, the results show that China’s economic and urban development
(figuratively speaking, the quantity of development) is increasing at a rate 2,023.85
greater than the rate of increase of the sustainable and social development (figuratively
speaking, the quality of development). Furthermore, there is also an imbalance within
between the Western and Eastern Regions of China. This imbalance amounts to the
Eastern Regions having an economic and social development increasing at a rate of 2.86
and 1.79 times greater than its Western counterpart, respectively.
Using such a methodology, various implications arise. First, we know exactly
how great the imbalances are, and where they lie. This allows the institutions involved in
development (from the Chinese government itself and its various bureaus, to the World
Bank, IMF, and UN, or any other interested international institution) to be able to
actively and precisely rebalance the country’s development, both at the national and

China’s Unbalanced Development Manfredo Camperio
29
regional levels. This will allow these institutions to truly help countries achieve a healthy
balance in their development process, ensuring a lasting future of increasing prosperity
and social harmony.
Second, the fundamental concept that some countries are ‘developed’ and some
are still ‘developing’ becomes irrelevant. Instead, through this method, all countries are
perceived as constantly developing, with each country having a different balance between
the various aspects of development. The goal becomes to create a healthy development
process within each country, rather than focusing on solely increasing a country’s GDP to
compete according to today’s international standards.
Lastly, following an evaluation and critique of current international standards
based on published academic works, I propose that the international community should
work on a comprehensive index following the above methodology, which could be
referred to as the ‘Development Index.’ This will correspond to the average of separate
aggregate indexes, which measure the various categories of development.
The categories of development should not necessarily be limited to the four used
in this work (economic, urban, social, and sustainable). But they should include a broader
range of aspects of development in an attempt to mirror as much as possible the true
complicated nature of the process of development.
In doing so, an analyst can gain many different insights: general overviews,
specific information, and comparative insights. By looking at the Development Index
value for a specified country (the summarized value of all categories) an analyst gains a
general understanding of a country’s overall development. At the same time, by looking
at the value of the separate indexes of each individual category of development, an

China’s Unbalanced Development Manfredo Camperio
30
analyst will understand precisely were a country’s strengths and weaknesses lie, and
where the imbalances lie (if there are any at all).
Furthermore, an analyst can then compare between countries. This provides the
analyst with examples of different countries’ strengths and weaknesses, consequently
providing the analyst with examples of successful and unsuccessful policies for a specific
aspect of development. The intended goal would be, for example, that if Norway had the
world’s highest value for Social Development, policy makers could take Norway’s
successful policies related to that field of development and apply them to countries that
had low Social Development values.
This is an appeal to all the dedicated people around the world to adopt this
method, adapt it, improve it, and make the Development Index a reality. My hope is that
this Development Index can help create a future in which countries will no longer forsake
the well being of their citizens and environment in favor of economic and urban output.
Hopefully, one day, humans will be living in a balanced world.

China’s Unbalanced Development Manfredo Camperio
31
Bibliography:
Bohlen, Celestine. "North-South Divide in Italy: A Problem for Europe, Too." The New York Times. 14 Nov. 1996. Web. <http://www.nytimes.com/1996/11/15/world/north-south-divide-in-italy-a- problem-for-europe-too.html>. China Statistical Press. Urban Statistical Yearbook of China. Beijing: Zhongguo Tongji, 1999. CNN. "Reformer with an Iron Fist." CNN. Cable News Network, 2001. Web. <http://www.cnn.com/SPECIALS/1999/china.50/inside.china/profiles/deng.xiaoping/>. "Cultural Revolution." History.com. A&E Television Networks, Web. <http://www.history.com/topics/cultural-revolution>. Dorrucci, Ettore, Gábor Pula, and Daniel Santabárbara. China's Economic Growth and Rebalancing. Frankfurt Am Main: Europ. Central Bank, 2013. Print. "Exploring Chinese History Comprehensive." Web. <http://www.ibiblio.org/chinesehistory/contents/01his/c05s03.html>. Fan, Shenggen, Xiaobo Zhang, and Ravi Kanbur. "China's Regional Disparities: Experience and Policy." Science Direct. Elsevier B.V., 2010. <http://www.sciencedirect.com/science/article/pii/S1879933710000023>. Ferguson, James. The Anti-politics Machine: "development," Depoliticization, and Bureaucratic Power in Lesotho. Cambridge, England: Cambridge UP, 1990. "Galileo Galilei Quote." BrainyQuote. Xplore, n.d. Web. <http://www.brainyquote.com/quotes/quotes/g/galileogal381325.html>. Hamilton, Kirk, and Giles Atkinson. Wealth, Welfare and Sustainability: Advances in Measuring Sustainable Development. Cheltenham, UK: Edward Elgar, 2006. "Human Development Reports." Human Development Index (HDI). Web. <http://hdr.undp.org/en/statistics/hdi>. "Human Development Reports." United Nations Development Program. United Nations, 2013. Web. <http://hdr.undp.org/en/countries/profiles/CHN>. Hunt, Katie. "China's Migrant Workers Seek a Life Back Home." CNN. Cable News Network, 29 Aug. 2013. Web. <http://www.cnn.com/2013/08/29/world/asia/china-village-silversmith/>. Lamb, Stefanie. "SPICE." Introduction to the Cultural Revolution -. Stanford Program on International and Cross-Cultural Education, 2005. Web. <http://spice.stanford.edu/docs/115>. Lochner, Martin. Are GDP/GNP Appropriate Measures of Development? GRIN Verlag, 2011. Lu, Ding, and William A. W. Neilson. China's West Region Development = : Domestic Strategies and Global Implications. Singapore: World Scientific, 2004.

China’s Unbalanced Development Manfredo Camperio
32
Moody, Andrew, Hu Haiyan, and Ma Wei. "'Go West' Policy Is an Economic Milestone for Nation." China Daily. 2011. <http://www.chinadaily.com.cn/cndy/2011-12/09/content_14236090.htm>. Johnson, Ian. "China’s Great Uprooting: Moving 250 Million Into Cities." The New York Times. The New York Times, 15 June 2013. Web. <http://www.nytimes.com/2013/06/16/world/asia/chinas-great- uprooting-moving-250-million- into-cities.html?pagewanted=all&_r=0>. Karabell, Zachary. The Leading Indicators: A Short History of the Numbers That Rule Our World. Simon & Schuster, 2014. Organization for Economic Co-operation and Development. Measuring Sustainable Development: Integrated Economic, Environmental and Social Frameworks. Paris: OECD, 2004. Peet, Richard, and Elaine R. Hartwick. Theories of Development. New York: Guilford, 1999. Porter, Michael E., Scott Stern, and Michael Green. Social Imperative Index. <http://observatorio.competitividad.edu.uy/files/Social%20Progress%20Index%202014%20Repor t.pdf>. Reuters. "Mao Tse-Tung Dies In Peking At 82." The New York Times. 1949. Web. <https%3A%2F%2Fwww.nytimes.com%2Flearning%2Fgeneral%2Fonthisday%2Fbig%2F0909.h tml>. Rostow, W. W. The Stages of Economic Growth: A Non-communist Manifesto. Cambridge, England: Cambridge UP, 1990. Sen, Amartya Kumar. Development as Freedom. Oxford: Oxford UP, 1999. SIS International Research. "China since the 1980s and Moving forward” China since the 1980s and Moving forward - The SIS Asia Business Journal - The Market Intelligence Journal. SIS, 2012. <http://thoughtleadership.sismarketresearch.com/the-sis-asia-business-journal/2012/11/13/china- since-the-1980s-and-moving-forward.html>. Sommeiller, Estelle, and Mark Price. "The Increasingly Unequal States of America: Income Inequality by State, 1917 to 2011." Economic Policy Institute. Economic Policy Institute, 2014. Web. <http://www.epi.org/publication/unequal-states/>. "Statistical Data." National Bureau of Statistics of China. Web. <http://www.stats.gov.cn/english/>. Tyler, Patrick E. "Deng Xiaoping: A Political Wizard Who Put China on the Capitalist Road." The New York Times. The New York Times, 1997. <http://www.nytimes.com/learning/general/onthisday/bday/0822.html>. Yeung, Ophelia M., and John A. Mathieson. Global Benchmarks: Comprehensive Measures of Development. Washington, D.C.: Brookings Institution, 1998. Urban Social and Economic Survey Organization of the State Statistical Bureau, the People's Republic of China. China: The Forty Years of Urban Development. Beijing: China Statistical Information and Consultancy Service Center, 1990. The Editors of Encyclopædia Britannica. "Gang of Four (Chinese Politicians)."Encyclopedia Britannica Online. Encyclopedia Britannica, Web. <http://www.britannica.com/EBchecked/topic/225316/Gang-of-Four>.
China’s Unbalanced Development Manfredo Camperio
33
"The Largest Migration in History: China's Migrant Workers." YouTube. The Economist, 01 Mar. 2012. Web. <http://www.youtube.com/watch?v=KNXg-kYk-LU>. UN. "As World Passes 7 Billion Milestone, UN Urges Action to Meet Key Challenges." UN News Center. UN, 31 Oct. 2011. Web. <http://www.un.org/apps/news/story.asp?NewsID=40257#.U2B82IF5OSo>. World Bank. "Indicators." Data World Bank. World Bank, Web. <http://data.worldbank.org/indicator>. Xiaoping, Deng. "Deng Xiaoping." Deng Xiaoping. Wellesley, 1984. <http://academics.wellesley.edu/Polisci/wj/China/Deng/Building.htm>.\ Xiaoping, Deng. "The "Two-Whatever" Policy Does Not Accord With Marxism -- Beijing Review." Beijing Review. Beijing Review, 1977. <http://www.bjreview.com.cn/nation/txt/2009- 05/26/content_197547.htm>.

China’s Unbalanced Development Manfredo Camperio
34
Appendix A National Data
From: World Bank. "Indicators." Data World Bank. World Bank, Web.
<http://data.worldbank.org/indicator>.
China Economic Urban Social Sustainable
1980 193 49,940 14 0.8
1981 195 50,182 14.71 1
1982 201 50,591 15.14 1
1983 223 51,604 16.51 1
1984 248 51,604 16.28 1
1985 292 52,119 16.57 1
1986 279 52,487 16.45 1
1987 249 52,611 16.54 1
1988 281 52,767 17.27 1
1989 307 53,187 17.39 1
1990 314 53,378 17.47 1.3
1991 330 53,416 17.77 1.3
1992 363 53,566 17.86 1.3
1993 374 53,802 18.43 1.4
1994 469 53,992 18.58 2
1995 604 54,616 19.36 2
1996 703 56,000 22.11 2
1997 774 57,566 22.40 2
1998 821 57,584 21.61 2
1999 865 57,923 22.10 2
2000 949 58,656 17.75 2.2
China’s Unbalanced Development Manfredo Camperio
35
2001 1,042 59,079 17.91 3
2002 1,135 59,530 19.72 3
2003 1,274 60,446 19.17 3
2004 1,490 61,015 19.65 3
2005 1,731 62,200 19.95 3
2006 2,069 63,412 21.2 3
2007 2,651 63,637 20.82 3
2008 3,414 60,809 20.53 4
2009 3,749 65,491 19.93 3.9
2010 4,433 66,239 19.91 4
Appendix B Regional Data
GDP per Capita Xinjiang Gansu Shanghai Shandong Sichuan Zhejiang
1980 410 388 2725 402 320 471 1981 450 367 2800 472 337 531 1982 488 393 2864 531 379 599 1983 583 462 2947 611 425 650 1984 661 515 3232 765 487 810 1985 820 608 3811 887 570 1067 1986 924 684 3956 956 614 1237 1987 1053 764 4340 1131 702 1478 1988 1347 905 5080 1395 861 1853 1989 1493 1007 5362 1595 960 2023 1990 1713 1099 5911 1815 1136 2138 1991 2101 1204 6661 2122 1283 2558 1992 2477 1384 8208 2556 1477 3212 1993 2964 1600 11061 3212 1854 4469 1994 3888 1921 14328 4441 2338 6201 1995 4701 2316 17779 5701 3043 8149 1996 5102 2946 20647 6746 3550 9552 1997 5848 3199 23397 7461 4032 10624 1998 6174 3541 25206 7968 4294 11394 1999 6443 3778 27071 8483 4540 12214 2000 7372 4129 30047 9326 4956 13415 2001 7945 4386 31799 10195 5376 14664 2002 8457 4768 33958 11340 5890 16841

China’s Unbalanced Development Manfredo Camperio
36
2003 9828 5429 38486 13268 6623 20149 2004 11337 6566 44839 16413 7895 23817 2005 13108 7477 49649 19934 9060 27062 2006 15000 8945 54858 23603 10613 31241 2007 16999 10614 62041 27604 12963 36676 2008 19797 12421 66932 32936 15495 41045 2009 19942 13269 69164 35894 17339 43842 2010 25034 16113 76074 41106 21182 51711
Govt Expen Edu (Mil.RMB) Xinjiang Gansu Shanghai Shandong Sichuan Zhejiang 1980 206.58 #N/A #N/A 532.96 #N/A #N/A 1981 #N/A #N/A #N/A 544.53 #N/A #N/A 1982 #N/A #N/A #N/A 628.04 #N/A #N/A 1983 #N/A #N/A #N/A 676.56 #N/A #N/A 1984 #N/A #N/A #N/A 775.33 #N/A #N/A 1985 456.41 #N/A #N/A 975.65 #N/A #N/A 1986 #N/A #N/A #N/A 1147.57 #N/A #N/A 1987 #N/A #N/A #N/A 1254.65 #N/A #N/A 1988 #N/A #N/A #N/A 1618.89 #N/A #N/A 1989 #N/A #N/A #N/A 1878.94 #N/A #N/A 1990 749.37 #N/A #N/A 2020.6 #N/A #N/A 1991 #N/A #N/A #N/A 2251.18 #N/A #N/A 1992 #N/A #N/A #N/A 2716.81 #N/A #N/A 1993 #N/A #N/A #N/A 3370.52 #N/A #N/A 1994 #N/A #N/A #N/A 4643.3 3431.66 #N/A 1995 1878.3 #N/A #N/A 5237.54 3782.81 #N/A 1996 #N/A #N/A #N/A 6707.21 4144.92 #N/A 1997 2529.6 2011 #N/A 9077.92 5005.57 #N/A 1998 2512.1 1937 #N/A 8862.08 4830.56 #N/A 1999 2764.7 2360 7503.19 9999.02 5488.66 6379.56 2000 3135.4 2755 8410.31 11810.42 6480.48 7819.43 2001 4284.9 3598 9973.92 13775.29 8523.67 10829.8 2002 5013.4 4221 11606.59 16277.61 10225.9 13693.9 2003 5302.6 4757 13137.24 17914.84 10890.4 16420.8 2004 6139.4 5366 15535 20482.84 12252.2 20008 2005 7265.2 6748 18294.15 24874.84 14052.6 23154.9 2006 8927.9 8748 23517 29228.39 18187 31077 2007 14277 12397 28333.35 45335.74 29286 38388.9 2008 19921 18293 32606.28 55099.29 36928.1 45399 2009 24015 20636 34695.18 61348.64 45144.3 51933 2010 31384 22823 41727.75 77044.72 54065.5 60654.3