china’s new cooperative medical scheme and equity in ...eprints.lse.ac.uk/56398/1/yang,...
TRANSCRIPT

Yang, Wei China’s new cooperative medical scheme and equity in access to health care: evidence from a longitudinal household survey Article (Accepted version) (Refereed)
Original citation: Yang, Wei (2013) China’s new cooperative medical scheme and equity in access to health care: evidence from a longitudinal household survey. International Journal for Equity in Health, 12 (1). p. 20. ISSN 1475-9276 DOI: 10.1186/1475-9276-12-20 © 2013 The Author © CC-BY-2.0 This version available at: http://eprints.lse.ac.uk/56398/ Available in LSE Research Online: April 2014 LSE has developed LSE Research Online so that users may access research output of the School. Copyright © and Moral Rights for the papers on this site are retained by the individual authors and/or other copyright owners. Users may download and/or print one copy of any article(s) in LSE Research Online to facilitate their private study or for non-commercial research. You may not engage in further distribution of the material or use it for any profit-making activities or any commercial gain. You may freely distribute the URL (http://eprints.lse.ac.uk) of the LSE Research Online website. This document is the author’s final accepted version of the journal article. There may be differences between this version and the published version. You are advised to consult the publisher’s version if you wish to cite from it.

Yang International Journal for Equity in Health 2013, 12:20http://www.equityhealthj.com/content/12/1/20
RESEARCH Open Access
China’s new cooperative medical scheme andequity in access to health care: evidence from alongitudinal household surveyWei Yang
Abstract
Introduction: China's New Cooperative Medical Scheme (NCMS) was brought to life in 2003 in response to thedeterioration in access to health services in rural areas. Despite its fast expansion, the scheme’s impacts on accessto health care have raised growing concerns, in particular regarding whether and to what extent the scheme hasreduced inequity in access to health care in rural China.
Methods: This study examines income-related inequity in access to health care from 2004 (before the nationalrollout of NCMS) to 2009 (after the expansion of NCMS across the rural China) by estimating Concentration Indicesover both formal health care (outpatient care, prevention care) and informal health care use (folk doctor care). Datawere drawn from a longitudinal household survey dataset - China Health and Nutrition Survey (CHNS).
Results: The study suggested that the level of inequity remained the same for outpatient care, and an increasedfavouring-poor gap in terms of folk doctor care was observed. In terms of preventive care, a favouring-rich inequitywas observed both in 2004 and 2009, but the effects of inequity were narrowed. The NCMS had some effects inreducing income-related health inequity in folk doctor care and preventive care, but the contribution was rathersmall. The study also found that the rural better-off had started to seek for commercial insurance to cover possiblefinancial risks from the burden of diseases.
Conclusion: The study concludes that the impacts of the NCMS on improving access to formal care for the poorare limited. Without a more comprehensive insurance package that effectively targets the rural poor, the intendedequity goals expected from the scheme will be difficult to realize.
Keywords: The NCMS, Insurance, Access to health care, Inequity, The rural population, China
IntroductionCountries across the world are looking to health insur-ance as a means of ensuring access to health care andprotecting patients from financial risks. Health insurancehas the potential to lower financial barriers of access tohealth care, since the financial risk of health care isshared among insurance participants and health cost willbe reduced at the point of health care use [1]. One com-mon way to organise insurance is to target its funds toeither a group of the population, such as the vulnerable/disadvantaged socioeconomic population, or specific ser-vices that are most cost-effective and/or preferentially
Correspondence: [email protected] of Social Policy, LSE Health, The London School of Economicsand Political Science, Houghton Street, London WC2A 2AE, UK
© 2013 Yang; licensee BioMed Central Ltd. ThCommons Attribution License (http://creativecreproduction in any medium, provided the or
benefit the target population, such as primary care oroutpatient care [1].In China, a focus on health care for the rural popula-
tion is gaining increased governmental attention in re-cent years. The government targets its public funds forhealth insurance by focusing on the rural populationthrough the New Rural Cooperative Health Scheme(NCMS). Since “equitable access” has been officially de-clared by the State Council to be the principal aim ofthe rural health insurance reform [2], the main objectiveof the NCMS is to provide universal coverage and to im-prove equity and access to health care to the rural popu-lation regardless of individual characteristics such as jobstatus, education, pre-existing condition, and level ofwealth. For the past few decades, the state and enterprise
is is an Open Access article distributed under the terms of the Creativeommons.org/licenses/by/2.0), which permits unrestricted use, distribution, andiginal work is properly cited.

Yang International Journal for Equity in Health 2013, 12:20 Page 2 of 13http://www.equityhealthj.com/content/12/1/20
funded health insurance only covered well-off urban em-ployees, leaving the majority of the rural residents un-protected from health risks [3], the launch of the NCMSin 2003 is considered as a crucial step in closing the in-surance gap and reducing inequity in access to healthcare for the rural population.However, the real world experience actually tells us little
about how far public health insurance can improve accessto health care [3-7]. One major concern is whether theinsurance is able to reach vulnerable/disadvantaged so-cioeconomic groups [3-5]. Evidence from developingcountries also suggest that public voluntary insuranceprogrammes, especially the ones that require substantialpremiums and patient cost-sharing, may have little effecton improving the use of public financed health services ofthe poor. In Iran, despite the decent development of a fewgovernment health insurance schemes targeting the poorand catastrophic inpatient care in the last decades, co-payments still count for 58% of the health expenditures,and the proportion of people facing catastrophic healthpayment remained high even after the insurance reform[8]. In India, the newly developed insurance - RashtriyaSwasthya Beema Yojna(RSBY) which aimed to target thepoor only allowed a limited rate of reimbursement for in-patient care. Studies found that expenditures on drugsclaims which constituted around 75% of OOP paymentsand 80% of the spending on outpatient visits were notcovered, and the impacts of the RSBY on protecting thepoor against health payment-induced impoverishmentwere limited [9].The launch of the New Rural Cooperative Medical
Scheme (NCMS) in 2003 represents a major step of theChinese government to move towards a more equitableand efficient rural health financing system, but it is notclear that the is sufficient enough to deliver equitable ac-cess in different types of health care. One major concernis that, under the NCMS, health care is provided in pub-lic health facilities through a fee-for-service reimburse-ment, and the reimbursement rates vary by differenttypes of care and at different health facilities. Althoughthe NCMS has extended its coverage to outpatient caresince 2007, its emphasis is mainly on “catastrophic out-patient cost", and reimbursement is made either throughparticipants' Medical Saving Account or pooled fundswhich requires substantial cost-sharing [10]. Further, thescheme only reimburses drugs listed on the NationalEssential Drug Reimbursement List, services covered bythe insurance package, and care sought at state-ownedpublic health facilities. The claimed reimbursement ratesare the highest for care delivered at village/townshiphealth centres and the lowest at city/provincial hospitals,while care sought at the high level health facilities isusually associated with severe illness and high medicalexpenditures [11,12]. Consequently, as argued by many
scholars, despite the broad coverage, co-payments forthe NCMS participants in general remained high evenafter the insurance claims were made, and this may im-pede a subpopulation of the rural poor from seekingcare [13-16]. In terms of outpatient care, scholars arguedthat the NCMS increased the use of outpatient careamong the poor at village clinics, whereas the increaseduse in inpatient care overall and at the higher levelhealth facilities was concentrated disproportionately onlyamong people who were rich [17]. Liu et al. [3] and Yuet al. [18] also found that the NCMS only increased theuse of inpatient care for the better-off, whereas it had nosignificant impact on outpatient use.While the previous work is important, the investiga-
tion on how the NCMS impacts inequity in health use issubjected to little updated empirical research, which isthe setting for this paper. Previous studies either limittheir investigations to a given point in time [15,17,19],or a specific health service [16]. The NCMS has beenimplemented for a few years, but it is still not clear ifthe scheme has any impact on utilisation. If it were, asthe reimbursement rates of the NCMS are set at diffe-rent levels for different services, it is worth investigatinghow much it may influence the utilisation for differentsocioeconomic groups, and whether variations in use isa generalised phenomenon, or are observed only forsome services. For instance, little information is availableon the characteristics of the users of preventive care andfolk doctors, consequently, how the NCMS impacts theuse.Another issue that is largely neglected in previous
studies, but is central to the measurements of equity inuse is that studies tend to overlook the association be-tween health use and health needs. Inequity in healthuse may be driven by factors as legitimate/fair inequity,such as health needs, and illegitimate/unfair inequitythat arise from circumstances beyond individual’s con-trol, such as per capita income. Policy may concern lesswith legitimate inequities because inequity arising fromlegitimate factors, e.g. health needs, is usually reasonableand acceptable. Therefore, a measure of socioeconomicrelated health inequality should control for legitimatedifferences, in this case, factors associated with healthneeds [20].To shed light to above issues, this paper measures the
extent to which the NCMS affects health care utilisationon the rural population in China, considering two typesof formal health care (outpatient care and preventioncare), and one type of informal health care (folk doctorcare [1]). This paper first compares the magnitude of in-equities in health use in 2004 (before the national rolloutof NCMS) and 2009 (after the expansion of NCMSacross the rural China). The Concentration Indices forutilisation, which compares the cumulative distribution

Yang International Journal for Equity in Health 2013, 12:20 Page 3 of 13http://www.equityhealthj.com/content/12/1/20
of health use with the cumulative distribution of thepopulation ranked by individual wealth, is used [21,22].It then investigates the determinants of patterns ofhealth care use and the characteristics of the users fordifferent services, taking into account the contributionof the NCMS to equity in health use. Data are drawnfrom China Health and Nutrition Survey 2004 and 2009.The empirical findings derived from the study are
expected to feed back into the policy making process. Inparticular, we are concerned that the expansion of theNCMS does not necessarily lead to equal access to care.Drawing from the literatures discussed above, this paperidentifies situations in which at least one of them isexpected to dominate. First, the launch of the NCMS is ameans of improving the equitable access to formal careand discouraging the use of informal care/folk doctor care.Folk doctor care is not covered by the insurance scheme,whereas outpatient and inpatient care are included in theinsurance package. Since the reimbursement rate set forformal care is relatively low, co-payments is likely to be-come one of the barriers to impede access to formal careamong the poor. The NCMS may have positive impacts inreducing the use of informal care; however, the impact maybe limited since unmet health need may still lead to in-creased use of informal care, which is less costly and widelyaccessible compared with formal care. Second, the NCMSmay also exert some positive influence on use of preventivecare, which historically required more cost-sharing and isnow partially covered by the NCMS (e.g. general physicalexamination, blood pressure screening, and prenatal exam-ination). As the co-payments are still high, preventive careuse may still appear concentrated among the rich, but thelevel of inequity may become less pronounced.In the subsequent sections, a background of the NCMS
is provided; followed by methods, results, and a discussionof the policy implications.
The New rural cooperative medical schemeIn rural China, a traditional rural cooperative medicalinsurance scheme was established in the 1950s. Therewas no real premium transfer in the rural system. Such ascheme was based on the People’s Commune system [2].Folk doctors provided primary care free of charge to therural population most of the time, although individuals oc-casionally needed to pay a limited amount of out-of-pocketfee for medicines [23].Following the collapse of the People’s Commune Sys-
tem in the early 1980s, the Cooperative Medical Scheme(CMS) virtually disappeared. Within two decades, theproportion of rural residents covered by health insur-ance shrank from 90% at the end of the 1970s to lessthan 5% in the late 1990s, and rural residents were ontheir own in paying for health care (Ooi, 2005). The bur-den of disease was exacerbating poverty across the rural
China - average per episode inpatient cost in rural areashad increased from 613RMB (US$98.35) in 1993 to2,649RMB (US$425.02) in 2003, and the percentage ofrural populations did not seek care when recommendedwas 63.7% in 1998 and 75.4% in 2003 [2,24].In response to the dire need for affordable health care,
the New Cooperative Medical Scheme (NCMS) wasbrought to life in China in 2003. The scheme was ini-tially proposed by the National Rural Health Conferencein 1996, and formally adopted during the 16th Natio-nal Congress of the Communist Party of China in 2002[3,25]. According to the scheme, the premium waslargely subsidized by local and central government, andindividual’s contribution to the premium was relativelylow. In the western and central China, where the level ofeconomic development was low, the central governmentassisted with the local government to provide financingsources for the scheme. In the more affluent eastern andcoastal region, financing the premium was mainly throughlocal government. According to the official governmentstatistics, from 2003 to 2008, the coverage of the schemeexpanded dramatically. By the end of 2008, 726 millionrural residents in 2448 counties were covered by thescheme [2]. According to the 2012 Report on the Work ofthe Chinese Government, the scheme had covered 832million rural residents, or 97.5% of Chinese farmers by2012; government contribution to insurance premiumincreased from 10 RMB(US$1.60) in 2003 to 240 RMB(US$38.51) in 2012; Insurance packaged had expandedfrom covering mainly catastrophic illness to outpatientand prevention care [26]. The Chinese Health MinisterChen Zhu regarded NCMS as one of the largest medicalsecurity scheme in the world [27]. Table 1 shows the maincharacteristics of the NCMS.
MethodsIncome-related inequity in health is estimated by pooledProbit Model and well-established methods based on theConcentration Indices [21,28]. The method involvesthree basic steps: (1) estimate pooled Probit Models onthe determinants of health use, and predict need (indi-rectly) standardized health for each health variable, andfor each year separately; the computation of varianceinflation factors (VIF) indicates that multicollinearity isnot a problem. Ramsy RESET tests are performed, andresults show the models have no specification problems;(2) calculate the Concentration Indices for actual use EI(the inequity driven by the actual health care utilisation),the horizontal equity indices HI (the inequity driven bysocioeconomic factors); (3) decompose the socioeco-nomic factors that contribute to the inequities for theeach year to see whether contributions have changedover time.

Table 1 Features of the NCMS
NCMS
Date started 2003 (Pilot scheme was initiated in four provinces)
Enrollment Voluntary at household level
Coverage 94.3% in 2009
Guideline General guidelines are issued by the central government, local governments retain considerable discretion over the details
Administration County government sets the reimbursement rate, ceilings, medical saving account, etc.
Risk pooling County level
Target population Rural residents (840 million)
Financing mechanism In the western and central China, the central government assisted the local government in providing financing for thescheme. In the more affluent eastern and coastal region, financing the premium was mainly through local government.
Designated healthfacilities
All levels of health facilities
Covered services Inpatient series, catastrophic outpatient services, some prevention care services
Yang International Journal for Equity in Health 2013, 12:20 Page 4 of 13http://www.equityhealthj.com/content/12/1/20
The multivariate regression models of health variablesfor step (1) and (2) above are central to the methods.The nature of the health use variables (binary variables)formally calls for a non-linear estimation. However, thedisadvantage of this procedure is that the certain com-ponents of the equity analysis, such as decompositionanalysis are difficult to implement and interpret. Studieshave shown that equity measurements calculated by Lin-ear Probability Model (LPM) do not differ importantlyfrom the non-linear estimation [28,29]. Therefore, thepaper will use LPM instead of non-linear regression tostandardize the health variables and to decompose theConcentration Indices. Results from Probit Model arenonetheless presented in the appendices for comparisons.Instead of using the Concentration Indices, Erreygers’sConcentration Index, which has been recently developedand has proved to be a better estimation for binary varia-ble, will be used [30-33].
Statistical analysisNeed standardizationThe standardized health (ŷi
X) is obtained by a regressionof actual health use (ŷi) as the following:
yi ¼ αþXj
βjxji þXk
γkzzi þ εi ð1Þ
Where xj are the health need variables, i.e., age, sexand health needs, Zk are non-need/socioeconomic vari-ables, i.e., (the logarithm of) income, education, job sta-tus, provinces of residence, urban/rural,,marital status,α,β, and γ are the parameter vectors, and ε is the errorterm.The coefficients from Linear Probability Model estima-
tions are obtained with actual values of the xj variables,i.e. health needs, that are to be standardized for, and thesample mean for Zk variables that are not to be stan-
dardized but to be controlled for. The predicted valuesof the health indicator yi
X are then obtained.
yiX ¼ α þ
Xj
βjxji þXk
γ k�zzi ð2Þ
Assuming a linear model, estimates of indirectly stan-dardized health, ŷi
IS can be obtained by calculating thedifference between actual health (yi) and standardizedhealth (ŷi
X), plus the sample mean (�y)
yiIS ¼ yi � yi
X þ �y ð3ÞRearranging the equation (2.3),
yiIS ¼ yi �
Xj
βj xji � �xj� � ð4Þ
Equation (4) shows that the standardization is to sub-tract the variation of health use driven by health needfactors from actual health use. Therefore, the distribu-tion of yIS across income can be interpreted as thehealth use that an individual would expect to be ob-served, irrespective of differences in the distribution ofthe characteristics associated with health needs.
Concentration indicesThe Concentration Index has been used in many studiesto quantify the degree of socioeconomic related inequal-ity in health variables [22,34-36]. Concentration indicesquantify the degree of socioeconomic related inequalityin a health variable. There are many ways to express theConcentration Index, however, the one utilised here is:
CI ¼ 2μcov hit ;R
ti
� � ð5Þ
Where i represents the individual, hi is the health vari-able, R is the individual’s living standard rank, μ is the

Yang International Journal for Equity in Health 2013, 12:20 Page 5 of 13http://www.equityhealthj.com/content/12/1/20
mean of the health variable in the population, and t isthe year. If there is no socioeconomic-related inequality,the index is zero. A positive value indicates a pro-richinequality, and a negative value indicates a pro-poorinequality.However, recent studies suggest there are some limita-
tions to the Concentration Index. Wagstaff [37] has foundthat if the health variable of interest is binary (thus takesthe value of 0 or 1), then the bounds of the ConcentrationIndex depend on the mean of the health variable. Thebounds turn out to be wider for populations with a lowmean (i.e. close to 0) than for populations with a highmean (i.e. close to 1) [30,31]. Therefore, this paper usesErreygers’s Concentration Index [30], which is recently in-troduced to take the above concerns this into account:
E hð Þ ¼ 4μbn � anð ÞC hð Þ ð6Þ
Where bn and an represent the maximum and mini-mum of the health variable (h), μ is the mean of thehealth variable in the population, and C (h) representsthe Concentration Index specified in (5).The range of the Erreygers’s Concentration Index is
from −1 to 1. A positive value indicates pro-rich inequal-ity, meaning that health use is more concentrated amongthe better-off. A negative value indicates pro-poor in-equality, meaning that health service is more concen-trated among the poor.The study also provides variance estimates or confi-
dence intervals. Confidence intervals were calculatedusing bootstrapping methods [38,39]. The numbers ofreplication were set at 1000.
Decomposition analysisDecomposition analysis helps to capture the contribu-tion of each individual factor to income-related healthinequality [21:159, 40].The decomposition of Erreygers’s Concentration Index
is carried out by transforming the health variable hi =(hi − ah)/(bh − ah). Therefore, the Erreygers’s index differsfrom the decomposition of C by the multiplication by 4and μh. The equation is as follows.
E ¼ 4 βμyCy þXj
γ jμzjCzj þXk
δkμxkCxk
" #ð7Þ
Where μ is the mean, j represents a vector of a set ofvariables zj, k represents a vector of variables xk, γ repre-sents the coefficient of the variable z, δ represents thecoefficient of the variable x, C is the Concentration Indexfor x.Another critical problem arises from calculation of the
Concentration Index is the ranking indicator of the
income measurements. Studies have found that repeti-tive values of the ranking variables, i.e. two of more ob-servations have the same values of the living standardvariables, may bring instability for the calculation[40,41]. In this paper, we have sorted the data both in as-cending and descending order to test the consistency ofthe Erreygers’s Index, and to obtain the boundaries ofErreygers’s Index. Results suggest that no change is ob-served in terms of the value of the indices.
Data source and variable specificationCHNS, the data source for the paper, is an ongoing opencohort, international collaborative project between theCarolina Population Center at the University of NorthCarolina at Chapel Hill and the National Institute of Nu-trition and Food Safety at the Chinese Center for DiseaseControl and Preventions. Data from CHNS 2004 and2009 are used. A multistage, random cluster samplingprocess was used to draw the sample in nine provinces inChina, e.g. Liaoning, Heilongjiang, Jiangsu, Shandong,Henan, Hubei, Hunan, Guangxi, and Guizhou. Countiesin the nine provinces were stratified by income (low, mid-dle, and high), and a weighted sampling scheme was usedto randomly select four counties in each province. Inaddition, the provincial capital and a lower income citywere selected when feasible. Villages and townships withinthe counties and urban and suburban neighbourhoodswithin the cities were selected randomly. In the most re-cent survey conducted in 2009, a total of 4400 householdswith a total of 26,000 individuals were included in thesample. The survey was designed to examine the effects ofthe health, nutrition, and family planning policies and pro-grams implemented by national and local governmentsand to see how the social and economic transformation ofChinese society is affecting the health and nutritional sta-tus of its population.CHNS is a representative sample for population dwel-
ling in the surveyed provinces. The rural sample totals5,361 observations in 2004 and 5,232 observations in2009. The analysis included 4,351 observations in 2004and 3,919 observations in 2009 after dropping observa-tions under 18 and with missing data.
Dependent variablesFormal (outpatient care, prevention care) and informalhealth care use (folk doctor care) are analysed for the like-lihood of a visit (no visits versus one or more visits). Spe-cific questions are as follows: for outpatient care variable,respondents were asked: “Have you sought outpatient careduring the past 4 weeks? 0 No, 1 Yes, and 9 Unknown”.For the prevention care variable, respondents were asked:“During the past 4 weeks, did you receive any preventivehealth service, such as health examination, eye exami-nation, blood test, blood pressure screening, tumour

Yang International Journal for Equity in Health 2013, 12:20 Page 6 of 13http://www.equityhealthj.com/content/12/1/20
screening? 0 No, 1 Yes, and 9 Unknown”. For the folkdoctor care variable, respondents were asked: “Did youvisit a folk doctor last year? 0 No, 1 Yes, and 9 Unknown”.
Independent variablesPer capita income data are used as the measurement ofliving standard. Although using household expenditureas a measurement of living standard are suggested in anumber of studies on health equity in developing coun-tries [42,43]. Scholars argue that household expendituremay not be a reliable indicator for living standard mea-surement in the context of China [44]. China has thehighest saving rate in the world; expenditure data aredistorted by the propensity to save for emergencies andthus may not be a good proxy as living standard indica-tors [45-47]. Therefore, this study uses income variablesinstead of expenditure variable as the indicator for livingstandard measurements. Household income data aremeasured as gross annual household income aggregatedfrom all sources including: gardening, farming, livestock/poultry, fishing, handicraft and small commercial house-hold business inflated to 2009 (the last wave of the sur-vey). As this paper examines individual level of healthcare use, it is important to adjust household estimates ofaggregate income to reflect household size and compo-sition. This is done by Equivalence Scale, which isconstructed as some function of the household size anddemographic composition provided estimates are avail-able for household economies of scale and the cost ofchildren: AE = (A + αK)θ [48]. A represents the numberof adults in the household, Κ represents the number ofchildren, α is the “costs of children”, and θ is the degreeof economies of scale. The value of α should be highwhen most goods are private and low when most of thehousehold expenditure is on shared goods. A value of0.75 to 1.0 is suggested when food expenditures accountfor a large proportion of total household income, whichmeans that the economies of scale are limited [21:77]. Inthis paper, α is set as 0.3, and θ is set as 0.75.Need variables are age, split into four categories (18 to
29, 30 to 44, 45 to 64, and 65 and above), gender, andmorbidity types split into two categories (major illness,minor illness and others) [28,49]. Need variables are alsomeasured by asking whether the respondent has been illor injured during the past 4 weeks.Non-need/socioeconomic variables included are educa-
tion, occupations, marital status, insurance types, urban/rural residency, and provinces of residency. Education iscategorized into four groups: no education, primary andsecondary education, high school and technical schooleducation, and university education and above. Universityeducation and above is used as the reference group. Occu-pations are categorized into four groups: white collars/professionals, unskilled workers/agricultures, unemployed,
and other. For the province variable, province Guizhou isset as the reference group. Whether the respondent isclassed as urban or rural is based on his/her registrationstatus as on his/her Hukou [3] booklet. Finally, insu-rance coverage is included as a non-need/socioeconomicvariable.A summary of dependent and independent variables
are listed in Table 2.
Empirical resultsDescriptive statisticsSome differences in health care use are observed acrossyears. Table 2 compares the share of health care use byyears. Results show that the use of outpatient careremained the same between 2004 and 2009, while theuse of folk doctor care had increased and the use of pre-ventive care had decreased.A significant increase in insurance coverage was ob-
served. In 2004, 88.8% of the rural Chinese were notcovered by any insurance; the percentage decreased to6.7% in 2009. In the meantime, a significant increase interms of the coverage of NCMS was observed from 2004to 2009. In 2004, only 4.0% of the rural Chinese werecovered by NCMS, the percentage increased to 87.5% in2009. The probability of participating in commercial in-surance also increased from 1.3% to 2.9%. Those whoreported to be covered by “other insurance” were mostlikely to be retired military or government officials, andfamily members of deceased military and/or governmentofficials. These reimbursement rates for these insuranceswere much higher compared with other public health in-surances in China.
Determinats of individual health care useTable 3 presents the estimations of the determinants: themaximum-liklihood marginal effects of Probit Model.Results of the probit regiression (Table 3) suggest that,
ceteris paribus, the use of outpatient care was found tobe associated with need factors and place of residence.Female, those who were with major illness or had beenill or injuried for the past 4 weeks were more likely touse outpatient care.Folk doctor care was associated with people aged 30
and above, as well as people with major illness. It is alsoworth pointing out that those who were covered by theNCMS and other insurance were less likely to use folkdoctor care compared with the uninsured.In terms of preventive care, female, those with major
and minor illness were more likely to use outpatientcare. Income was significantly associated with the use ofpreventive care. Unskilled and agricultural workers wereless likely to use preventive care compared with whitecollars and skill workers. People with no education,

Table 2 Descriptive statistics for the study population (mean/standard deviation)
2004(N = 4351) 2009(N = 3919)
Variable Definition Mean S.D. Mean S.D.
Health use variables
Outpatient use Dummy variable: 1, outpatient use; 0 otherwise 0.111 0.314 0.116 0.320
Folk doctor use Dummy variable: 1, folk doctor use; 0 otherwise 0.033 0.179 0.050 0.218
Preventive care use Dummy variable: 1, Preventive care use; 0 otherwise 0.030 0.170 0.035 0.184
Health needs variables
18-29 Dummy variable: 1, aged between 18–29; 0 otherwise. 0.122 0.328 0.098 0.297
30-44 Dummy variable: 1, aged between 30–44; 0 otherwise. 0.333 0.471 0.310 0.462
45-64 Dummy variable: 1, aged between 45–64; 0 otherwise. 0.447 0.497 0.469 0.499
65 and above Dummy variable: 1, aged between 65 and above; 0 otherwise. 0.097 0.296 0.124 0.329
Gender Dummy variable: 1, male; 0 female 0.499 0.500 0.506 0.500
No symptoms Dummy variable: 1, no symtons; 0 otherwise 0.784 0.412 0.801 0.400
Minor Illness Dummy variable: 1, minor illness; 0 otherwise 0.152 0.359 0.137 0.344
Major illness Dummy variable: 1, major illness; 0 otherwise 0.064 0.245 0.062 0.242
4 week illness Dummy variable: 1, having been illness for the past 4 weeks; 0 otherwise 0.153 0.360 0.148 0.355
Socioeconomic variables
Per capita income Per capita household income inflated to 2009 4787.057 5004.990 9996.772 11817.190
No insurance Dummy variable: 1, no insurance; 0 otherwise 0.888 0.315 0.067 0.250
NCMS Dummy variable: 1, NCMS; 0 otherwise 0.041 0.197 0.875 0.331
Commercial insurance Dummy variable: 1, commercial insurance; 0 otherwise 0.013 0.112 0.029 0.167
Other insurance Dummy variable: 1, other insurance; 0 otherwise 0.059 0.235 0.030 0.170
Marital Status Dummy variable: 1 married, 0 otherwise 0.874 0.332 0.883 0.321
White collar/skilled Dummy variable: 1 white collar or skilled worker, 0 otherwise 0.065 0.246 0.072 0.258
Unskilled/farmer Dummy variable: 1 unskilled worker or farmer, 0 otherwise 0.617 0.486 0.691 0.462
Other job Dummy variable: 1 other jobs, 0 otherwise 0.021 0.143 0.029 0.169
Unemployed Dummy variable: 1 Unemployed, 0 otherwise 0.225 0.418 0.207 0.405
No edu Dummy variable: 1 no education; 0 otherwise 0.216 0.412 0.240 0.427
Pri and sec edu Dummy variable: 1 primary and secondary education; 0 otherwise 0.628 0.483 0.604 0.489
High school Dummy variable: 1 high school and technical school education; 0 otherwise 0.139 0.346 0.128 0.334
Uni and above Dummy variable: 1 university education and above; 0 otherwise 0.017 0.129 0.028 0.164
Province Liaoning Dummy variable: 1 Liaoning, 0 otherwise 0.123 0.329 0.119 0.323
Province Heilongjiang Dummy variable: 1 Heilongjiang, 0 otherwise 0.099 0.299 0.110 0.312
Province Jiangsu Dummy variable: 1 Jiangsu, 0 otherwise 0.126 0.332 0.121 0.326
Province Shandong Dummy variable: 1 Shandong, 0 otherwise 0.108 0.310 0.111 0.315
Province Henan Dummy variable: 1 Henan, 0 otherwise 0.099 0.298 0.100 0.300
Province Hubei Dummy variable: 1 Hubei, 0 otherwise 0.103 0.304 0.107 0.310
Province Hunan Dummy variable: 1 Hunan, 0 otherwise 0.085 0.279 0.090 0.286
Province Guangxi Dummy variable: 1 Guangxi, 0 otherwise 0.124 0.330 0.133 0.339
Province Guizhou Dummy variable: 1 Guizhou, 0 otherwise 0.132 0.339 0.110 0.312
Yang International Journal for Equity in Health 2013, 12:20 Page 7 of 13http://www.equityhealthj.com/content/12/1/20
primary and secondary education, and high school edu-cation were less likely to use preventive care comparedwith people with university education or above. No sig-nificant association was observed in terms of the NCMSand preventive care use.
Those who participated in commercial insurance had asignificantly lower level of outpatient use and a higherlevel of preventive care use compared with the unin-sured. This may suggest that the rural Chinese hadstarted to participate in commercial insurances on top of

Table 3 Determinants of health service use (probit model)
Outpatient Folk doctor Preventive care
Coefficient S.E. Coefficient S.E. Coefficient S.E.
Need variables
Age group (ref = 18–29)
30-44 −0.036 0.128 0.328*** 0.115 −0.097 0.381
45-64 0.043 0.123 0.285** 0.114 −0.182 0.1
65 and above 0.116 0.144 0.352*** 0.134 −0.123 0.399
Gender (1 = male) −0.115* 0.063 −0.009 0.055 −0.147** 0.026
Morbidity types (ref = Major illness)
No symptoms −2.373*** 0.109 −0.487*** 0.118 −0.658*** 0
Minor Illness 0.02 0.073 −0.091 0.097 −0.282*** 0.009
4 week illness 0.715*** 0.068 0.183* 0.096 0.149 0.179
Non-need/socioeconomic variables
Per capita income (lg) 0.049 0.037 −0.009 0.034 0.087** 0.033
Insurance type (ref = no insurance)
NCMS −0.021 0.118 −0.199* 0.107 0.163 0.152
Commercial insurance −0.511** 0.225 −0.216 0.234 0.413** 0.017
Other insurance −0.024 0.139 −0.378** 0.17 0.48*** 0
Marital Status (1 = married) −0.033 0.092 0.113 0.089 0.084 0.407
Occupation (ref = white collar and skilled worker)
Unskilled and agriculture −0.158 0.119 0.123 0.125 −0.198* 0.073
Other job −0.091 0.229 0.01 0.218 −0.189 0.388
Unemployed −0.217* 0.126 0.211 0.131 −0.008 0.945
Education level (ref = uni and above)
No edu 0.033 0.254 0.569 0.422 −0.568*** 0.004
Pri and sec edu 0.057 0.244 0.472 0.418 −0.491*** 0.006
High school −0.145 0.247 0.502 0.42 −0.504*** 0.005
Region (ref = Province Guizhou)
Province Liaoning −0.236* 0.122 −0.468*** 0.115 0.159 0.288
Province Heilongjiang −0.222 0.147 −0.904*** 0.168 −0.247 0.199
Province Jiangsu 0.009 0.133 −0.424*** 0.132 0.605*** 0
Province Shandong 0.178 0.137 −0.084 0.105 0.61*** 0
Province Henan 0.333*** 0.119 0.108 0.09 0.151 0.327
Province Hubei 0.082 0.12 −0.506*** 0.115 0.489*** 0
Province Hunan −0.199 0.136 −0.137 0.107 −0.03 0.863
Province Guangxi 0.265** 0.114 0.136 0.088 0.271* 0.06
2009 0.173 0.116 0.38*** 0.107 −0.058 0.586
Constant −0.789* 0.454 −2.249*** 0.554 −1.896*** 0
N 8270 N 8270 N 8270
LR chi2(27) 3376.57 LR chi2(27) 301.96 LR chi2(27) 272.87
Prob > chi2 0 Prob > chi2 0 Prob > chi2 0
Pseudo R2 0.5845 Pseudo R2 0.1016 Pseudo R2 0.1294
Note: Per capita household income is inflated to year 2009 using consumer price index. *** p < 0.01, ** p < 0.05, * p < 0.1.
Yang International Journal for Equity in Health 2013, 12:20 Page 8 of 13http://www.equityhealthj.com/content/12/1/20
Yang International Journal for Equity in Health 2013, 12:20 Page 9 of 13http://www.equityhealthj.com/content/12/1/20
the NCMS to avoid potential financial risks and to im-prove access.
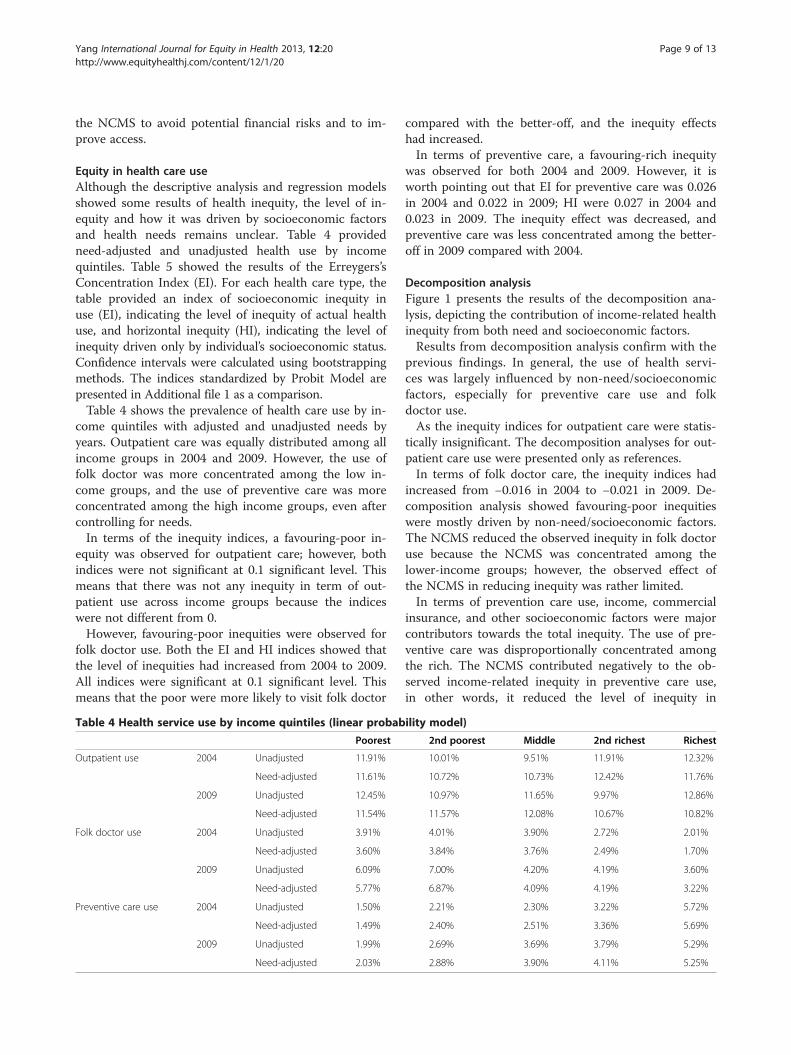
Equity in health care useAlthough the descriptive analysis and regression modelsshowed some results of health inequity, the level of in-equity and how it was driven by socioeconomic factorsand health needs remains unclear. Table 4 providedneed-adjusted and unadjusted health use by incomequintiles. Table 5 showed the results of the Erreygers’sConcentration Index (EI). For each health care type, thetable provided an index of socioeconomic inequity inuse (EI), indicating the level of inequity of actual healthuse, and horizontal inequity (HI), indicating the level ofinequity driven only by individual’s socioeconomic status.Confidence intervals were calculated using bootstrappingmethods. The indices standardized by Probit Model arepresented in Additional file 1 as a comparison.Table 4 shows the prevalence of health care use by in-
come quintiles with adjusted and unadjusted needs byyears. Outpatient care was equally distributed among allincome groups in 2004 and 2009. However, the use offolk doctor was more concentrated among the low in-come groups, and the use of preventive care was moreconcentrated among the high income groups, even aftercontrolling for needs.In terms of the inequity indices, a favouring-poor in-
equity was observed for outpatient care; however, bothindices were not significant at 0.1 significant level. Thismeans that there was not any inequity in term of out-patient use across income groups because the indiceswere not different from 0.However, favouring-poor inequities were observed for
folk doctor use. Both the EI and HI indices showed thatthe level of inequities had increased from 2004 to 2009.All indices were significant at 0.1 significant level. Thismeans that the poor were more likely to visit folk doctor
Table 4 Health service use by income quintiles (linear probab
Poorest
Outpatient use 2004 Unadjusted 11.91%
Need-adjusted 11.61%
2009 Unadjusted 12.45%
Need-adjusted 11.54%
Folk doctor use 2004 Unadjusted 3.91%
Need-adjusted 3.60%
2009 Unadjusted 6.09%
Need-adjusted 5.77%
Preventive care use 2004 Unadjusted 1.50%
Need-adjusted 1.49%
2009 Unadjusted 1.99%
Need-adjusted 2.03%
compared with the better-off, and the inequity effectshad increased.In terms of preventive care, a favouring-rich inequity
was observed for both 2004 and 2009. However, it isworth pointing out that EI for preventive care was 0.026in 2004 and 0.022 in 2009; HI were 0.027 in 2004 and0.023 in 2009. The inequity effect was decreased, andpreventive care was less concentrated among the better-off in 2009 compared with 2004.
Decomposition analysisFigure 1 presents the results of the decomposition ana-lysis, depicting the contribution of income-related healthinequity from both need and socioeconomic factors.Results from decomposition analysis confirm with the
previous findings. In general, the use of health servi-ces was largely influenced by non-need/socioeconomicfactors, especially for preventive care use and folkdoctor use.As the inequity indices for outpatient care were statis-
tically insignificant. The decomposition analyses for out-patient care use were presented only as references.In terms of folk doctor care, the inequity indices had
increased from −0.016 in 2004 to −0.021 in 2009. De-composition analysis showed favouring-poor inequitieswere mostly driven by non-need/socioeconomic factors.The NCMS reduced the observed inequity in folk doctoruse because the NCMS was concentrated among thelower-income groups; however, the observed effect ofthe NCMS in reducing inequity was rather limited.In terms of prevention care use, income, commercial
insurance, and other socioeconomic factors were majorcontributors towards the total inequity. The use of pre-ventive care was disproportionally concentrated amongthe rich. The NCMS contributed negatively to the ob-served income-related inequity in preventive care use,in other words, it reduced the level of inequity in
ility model)
2nd poorest Middle 2nd richest Richest
10.01% 9.51% 11.91% 12.32%
10.72% 10.73% 12.42% 11.76%
10.97% 11.65% 9.97% 12.86%
11.57% 12.08% 10.67% 10.82%
4.01% 3.90% 2.72% 2.01%
3.84% 3.76% 2.49% 1.70%
7.00% 4.20% 4.19% 3.60%
6.87% 4.09% 4.19% 3.22%
2.21% 2.30% 3.22% 5.72%
2.40% 2.51% 3.36% 5.69%
2.69% 3.69% 3.79% 5.29%
2.88% 3.90% 4.11% 5.25%
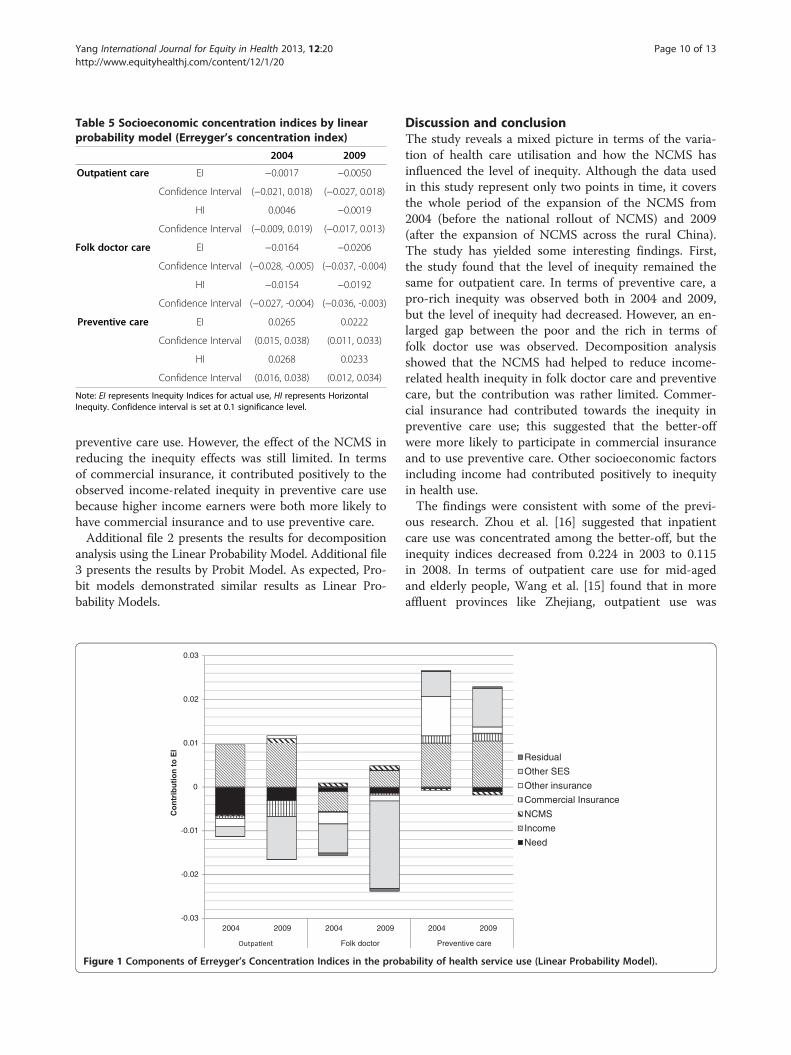
Table 5 Socioeconomic concentration indices by linearprobability model (Erreyger’s concentration index)
2004 2009
Outpatient care EI −0.0017 −0.0050
Confidence Interval (−0.021, 0.018) (−0.027, 0.018)
HI 0.0046 −0.0019
Confidence Interval (−0.009, 0.019) (−0.017, 0.013)
Folk doctor care EI −0.0164 −0.0206
Confidence Interval (−0.028, -0.005) (−0.037, -0.004)
HI −0.0154 −0.0192
Confidence Interval (−0.027, -0.004) (−0.036, -0.003)
Preventive care EI 0.0265 0.0222
Confidence Interval (0.015, 0.038) (0.011, 0.033)
HI 0.0268 0.0233
Confidence Interval (0.016, 0.038) (0.012, 0.034)
Note: EI represents Inequity Indices for actual use, HI represents HorizontalInequity. Confidence interval is set at 0.1 significance level.
Yang International Journal for Equity in Health 2013, 12:20 Page 10 of 13http://www.equityhealthj.com/content/12/1/20
preventive care use. However, the effect of the NCMS inreducing the inequity effects was still limited. In termsof commercial insurance, it contributed positively to theobserved income-related inequity in preventive care usebecause higher income earners were both more likely tohave commercial insurance and to use preventive care.Additional file 2 presents the results for decomposition
analysis using the Linear Probability Model. Additional file3 presents the results by Probit Model. As expected, Pro-bit models demonstrated similar results as Linear Pro-bability Models.
0.03
0.02
0.01
0
0.01
0.02
0.03
2004 2009 2004 2009
t Folk doctor
Co
ntr
ibu
tio
n t
o E
I
Figure 1 Components of Erreyger’s Concentration Indices in the prob
Discussion and conclusionThe study reveals a mixed picture in terms of the varia-tion of health care utilisation and how the NCMS hasinfluenced the level of inequity. Although the data usedin this study represent only two points in time, it coversthe whole period of the expansion of the NCMS from2004 (before the national rollout of NCMS) and 2009(after the expansion of NCMS across the rural China).The study has yielded some interesting findings. First,the study found that the level of inequity remained thesame for outpatient care. In terms of preventive care, apro-rich inequity was observed both in 2004 and 2009,but the level of inequity had decreased. However, an en-larged gap between the poor and the rich in terms offolk doctor use was observed. Decomposition analysisshowed that the NCMS had helped to reduce income-related health inequity in folk doctor care and preventivecare, but the contribution was rather limited. Commer-cial insurance had contributed towards the inequity inpreventive care use; this suggested that the better-offwere more likely to participate in commercial insuranceand to use preventive care. Other socioeconomic factorsincluding income had contributed positively to inequityin health use.The findings were consistent with some of the previ-
ous research. Zhou et al. [16] suggested that inpatientcare use was concentrated among the better-off, but theinequity indices decreased from 0.224 in 2003 to 0.115in 2008. In terms of outpatient care use for mid-agedand elderly people, Wang et al. [15] found that in moreaffluent provinces like Zhejiang, outpatient use was
2004 2009
Preventive care
Residual
Other SES
Other insurance
Commercial Insurance
NCMS
Income
Need
ability of health service use (Linear Probability Model).

Yang International Journal for Equity in Health 2013, 12:20 Page 11 of 13http://www.equityhealthj.com/content/12/1/20
concentrated among the better-off, while in provinceswith low economic development, such as Gansu, use ofhealth care was equally distributed across incomegroups. The study also suggested that this may be be-cause of the difference in terms of health care provisionand coverage of insurance between these two provinces.In terms of folk doctor care, the growing inequity bet-ween the rich and the poor is troubling, and such aproblem is particularly severe for low income groups.Similar findings were demonstrated in studies conductedin other developing countries. These studies suggestedthat demand of lower social classes for care was highlyprice-elastic and usually exceeded that of the rich[50-52]. Hence, the poor were more likely to use moreinformal and less qualified providers, or resorted to self-treatment when they were ill [53].To compare the level of inequity in health use of China
with other countries, Van de Poel et al. [54] showed thatthe Erregyers’ Concentration Indices of all health careuse was 0.1 in India, 0.018 in Malaysia and 0.018 inBangladesh, which seemed comparable with the indicesfrom China. This suggested that, in a comparative sense,China was in a similar level of equity in health utilisationas other low- and middle-income countries.The study has a few policy implications. The extension
of the NCMS coverage reduces inequitable access in for-mal care, but does not eliminate them. One importantconstraint of the NCMS is the low reimbursement rateand the high co-payment at visit. Reported average reim-bursement rate for outpatient care under the NCMS wasonly approximately 10% [10]; it is argued that eventhough out-of-pocket payments for outpatient care maybe easy to cope with in a short term, a large amount ofoutpatient costs in aggregate may still be excessivelyhigh from a social standpoint and may have substantialeffects on household [9]. Similarly, the use of preventivecare is unequally distributed and related to the unequaldistribution of income level. A more comprehensivecoverage in terms of outpatient care and preventive careis needed because outpatient care is the most commonlyused for effective and efficient treatment for many healthproblems, especially chronic diseases, and preventivecare is equally important in terms of allowing for earlydetection of diseases.The NCMS aimed to achieve equity in the contribution
through co-payments regardless of income levels of theparticipants; however, among the NCMS participants,there existed a wide gap in financial status. Low incomeparticipants are already burdened with a premium, whilesubstantial co-payments due to the limited coverage fur-ther aggravate HI in health care access [55]. A possible so-lution is to implement well-designed and regulated healthinsurance with comprehensive coverage to provide thelow income participants with better financial protection.
Successful examples include - Universal Coverage schemeof Thailand and Seguro Popular of Mexico for the poorand uninsured [56-58].It is also worth mentioning that more and more rural
Chinese, especially the better-off, are seeking for finan-cial protection from participating in commercial insur-ance. The NCMS with the objective of protecting thevulnerable groups from financial barriers to care had aslightly favouringpoor effect, whereas commercial insur-ance contributed to the favouring-rich distribution ofhealth use. The movements towards a more generousbenefit package of the public funded insurance - theNCMS - is crucial in improving access to care and tobetter align health use with need. For services not beingcovered by the NCMS, as exemplified by the study re-sults, resorting to commercial insurance to improveequity in access might be one option for the ruralChinese.The study has a few limitations. The first concern is
the dataset. The dataset used is probably by far the mostcomprehensive ever used in studying health inequality inthe Chinese context; however, only nine provinces areincluded. Most of these provinces are situated in theeastern and coastal part of China, where the levels ofeconomic development are high. Hence, any furthergeneralization should be made with caution. As all thesurvey information is self-reported, this can be biasedbecause of problems in reporting (e.g. inaccurate recall,misreporting). However, these are the limitations ofusing self-assessed morbidity measurements in the ab-sence of other possible objective variables, such as bio-marker. Second, the difference between what is officiallycalled informal care and what happens in practice needsfurther refinement in future studies. In this dataset, allinformal care providers are evaluated at the same stand-ard, and are specified as “folk doctor care”; however, it ispossible that folk doctor use may relate to the use oftraditional Chinese medicines and healer, which arewidely accepted and even recommended in some med-ical settings [59-61]. Therefore, the dataset needs furtherrefinement in the definition of folk doctor care in orderto make inference on equity of use.
Additional files
Additional file 1: Socioeconomic Concentration Indices by ProbitModel (Erreygers’s Concentration Index).
Additional file 2: Decomposition results by Linear ProbabilityModel (Components of Erreyger’s Concentration Indices).
Additional file 3: Decomposition results by Probit Model(Components of Erreyger’s Concentration Indices).
AbbreviationsCHNS: China health and nutrition survey; LPM: Linear probability model;EI: Erreygers’s concentration index; HI: Horizontal inequity.

Yang International Journal for Equity in Health 2013, 12:20 Page 12 of 13http://www.equityhealthj.com/content/12/1/20
Competing interestsThe author declared that she has no competing interest.
AcknowledgementI thank Azusa Sato and two reviewers for their insightful comments. I thankthe Carolina Population Centre, University of North Carolina at Chapel Hill forproviding the data.
Received: 25 September 2012 Accepted: 25 February 2013Published: 23 March 2013
References1. Yip W, Berman P: Targeted health insurance in a low income country and
its impact on access and equity in access: Egypt's school healthinsurance. Health Econ 2001, 10(3):207–220.
2. You X, Kobayashi Y: The new cooperative medical scheme in China.Health Policy 2009, 91(1):1–9.
3. Yip W, Hsiao WC: The Chinese Health System At A Crossroads. Health Aff2008, 27(2):460–468.
4. Watanabe R, Hashimoto H: Horizontal inequity in healthcare access underthe universal coverage in Japan; 1986–2007. Soc Sci Med 2012,75(8):1372–1378.
5. Jehu-Appiah C, et al: Equity aspects of the national health insurancescheme in Ghana: Who is enrolling, who is not and why? Soc Sci Med2011, 72(2):157–165.
6. Van Doorslaer E, et al: Horizontal inequities in Australia's mixed public/private health care system. Health Policy 2008, 86(1):97–108.
7. van Doorslaer E, Masseria C: Income-Related Inequality in the Use of MedicalCare in 21 OECD Countries. Paris: OECD Health Equity Research Group; 2004.
8. Kavosi Z, et al: Inequality in household catastrophic health careexpenditure in a low-income society of Iran. Health Policy Plan 2012,27(7):613–623.
9. Shahrawat R, Rao KD: Insured yet vulnerable: out-of-pocket payments andIndia's poor. Health Policy Plan 2012, 27(3):213–221.
10. Barber SL, Yao L: Development and status of health insurance systems inChina. Int J Health Plann Manage 2011, 26(4):339–356.
11. Babiarz KS, et al: China's New cooperative medical scheme improvedfinances Of township health centers But Not The number Of patientsserved. Health Aff 2012, 31(5):1065–1074.
12. Babiarz KS, et al: New evidence on the impact of China's New ruralcooperative medical scheme and its implications for rural primaryhealthcare: multivariate difference-in-difference analysis. Br Med J 2010,341:c5617.
13. Liu J, et al: Income-related inequality in health insurance coverage:analysis of China Health and Nutrition Survey of 2006 and 2009.Int J Equity Health 2012, 11(42):42.
14. Wang J, et al: Financial protection under the New rural cooperativemedical schemes in China. Med Care 2012, 50(8):700–704.
15. Wang Y, et al: Growing old before growing rich: inequality in healthservice utilization among the mid-aged and elderly in Gansu andZhejiang Provinces, China. BMC Health Serv Res 2012, 12(1):302.
16. Zhou Z, et al: Measuring the equity of inpatient utilization in Chineserural areas. BMC Health Serv Res 2011, 11(1):201.
17. Wang H, et al: Health insurance benefit design and healthcare utilizationin northern rural china. PLoS One 2012, 7(11):e50395.
18. Yu B, et al: How does the New cooperative medical scheme influencehealth service utilization? A study in two provinces in rural China.BMC Health Serv Res 2010, 10(1):116.
19. Mou J, et al: Health care utilisation amongst Shenzhen migrant workers:does being insured make a difference?. BMC Health Serv Res 2009,9(1):214.
20. O'Donnell O, Van Doorslaer E, Wagstaff A: Decomposition of inequalities inhealth and health care. In The Elgar companion to health economics. xviithedition. Edited by Andrew M, Jones A, Jones M. Cheltenham: Edward Elgar;2006:565.
21. O'Donnell O: Analyzing health equity using household survey data: a guide totechniques and their implementation. xith edition. Washington, D.C: WorldBank; 2008:220.
22. Kakwani N, Wagstaff A, van Doorslaer E: Socioeconomic inequalities inhealth: measurement, computation, and statistical inference.J Econometrics 1997, 77(1):87–103.
23. Dong KY: Medical insurance system evolution in China. China Econ Rev2009, 20(4):591–597.
24. Chen L, et al: Addressing vulnerability in an emerging economy: China'sNew cooperative medical scheme (NCMS). Can J Dev Stud-Rev Can DEtudes Du Dev 2011, 32(4):399–413.
25. WHO: W.H.O., Implementing the New Cooperative Medical Schemes in rapidlychanging China. Beijing, China: O.o.t.W.H.O.R.i. China; 2004.
26. Xinhua: Report on the Work of the Chinese Government in Xinhua News2012.Beijing: Xinhua News; 2012.
27. China Daily: China calls for universal healthcare, in China Daily2012. Geneva:China Daily; 2012.
28. Hernandez Quevedo C, Jimenez Rubio D: Socioeconomic differences inhealth between the Spanish and immigrant population: evidence fromthe National Health Survey. Gac Sanit 2009, 23(Suppl 1):47–52.
29. Allin S, Hurley J: Inequity in publicly funded physician care: what is therole of private prescription drug insurance? Health Econ 2009,18(10):1218–1232.
30. Erreygers G: Correcting the Concentration Index. J Health Econ 2009,28(2):504–515.
31. Wagstaff A: Correcting the concentration index: A comment. J HealthEcon 2009, 28(2):516–520.
32. Costa-Font J, Gil J:What lies behind socio-economic inequalities in obesityin Spain? A decomposition approach. Food Policy 2008, 33(1):61–73.
33. Van de Poel E, O'Donnell O, Van Doorslaer E: Are urban children reallyhealthier? Evidence from 47 developing countries. Soc Sci Med 2007,65(10):1986–2003.
34. Wagstaff A, Rutten F, Doorslaer EKAv: Equity in the finance and delivery ofhealth care: an international perspective. Oxford medical publications. Oxford:Oxford University Press; 1993:416.
35. O'Donnell O, World Bank: Analyzing health equity using household surveydata: a guide to techniques and their implementation. xith edition.Washington, D.C: World Bank; 220.
36. Allin S, Hernández-Quevedo C, Masseria C: Measuring equity of access tohealth care. In Performance measurement for health system improvement:experiences, challenges and prospects. xxiith edition. Edited by Smith P.Cambridge: Cambridge University Press; 2009:726.
37. Wagstaff A: The bounds of the concentration index when the variable ofinterest is binary, with an application to immunization inequality. HealthEcon 2005, 14(4):429–432.
38. Chen Z, Roy K, Gotway Crawford CA: Evaluation of variance estimators forthe concentration and health achievement indices: a monte carlosimulation. Health Econ 2012, 21(11):1375–1381.
39. Mills JA, Zandvakili S: Statistical inference via bootstrapping for measuresof inequality. J Appl Econometrics 1997, 12(2):133–150.
40. Chen Z, Roy K: Calculating concentration index with repetitive values ofindicators of economic welfare. J Health Econ 2009, 28(1):169–175.
41. Van Ourti T: Measuring horizontal inequity in Belgian health care using aGaussian random effects two part count data model. Health Econ 2004,13(7):705–724.
42. Wagstaff A, van Doorslaer E, Watanabe N: On decomposing the causes ofhealth sector inequalities with an application to malnutrition inequalitiesin Vietnam. J Econometrics 2003, 112(1):207–223.
43. Wagstaff A: Reranking and Pro-poor growth: decompositions for Chinaand Vietnam. J Dev Stud 2009, 45(9):1403–1425.
44. Sun X, et al: Health payment-induced poverty under China's Newcooperative medical scheme in rural Shandong. Health Policy Plan 2010,25(5):419–426.
45. Qian Y: Urban and rural household saving in China. Int Monetary FundStaff Papers 1988, 35(4):592–627.
46. Kraay A: Household saving in China. World Bank Econ Rev 2000, 14(3):545–570.47. Wu Q: Research on the necessity of building a medical protection system for
the poor population in China. Harbin Medical University: Harbin; 2001.48. Citro CF, et al: Measuring poverty: a new approach. Washington, D.C:
National Academy Press; 1995.49. Gravelle H, Morris S, Sutton M: Economic studies of equity in the
consumption of health care. In The Elgar companion to health economics.xviith edition. Edited by Andrew M, Jones A, Jones M. Cheltenham: EdwardElgar; 2006:565.
50. James CD, et al: To retain or remove user fees?: reflections on the currentdebate in low- and middle-income countries. Appl Health Econ HealthPolicy 2006, 5(3):137–153.

Yang International Journal for Equity in Health 2013, 12:20 Page 13 of 13http://www.equityhealthj.com/content/12/1/20
51. Pokhrel S, et al: Modelling the effectiveness of financing policies toaddress underutilization on of children's health services in Nepal.Bull World Health Organ 2005, 83(5):338–344.
52. Sauerborn R, Nougtara A, Latimer E: The elasticity of demand forhealthcare in Burkina Faso - differences across age and income groups.Health Policy Plan 1994, 9(2):185–192.
53. Okeke TA, Okeibunor JC: Rural–urban differences in health-seeking forthe treatment of childhood malaria in south-east Nigeria. Health Policy2010, 95(1):62–68.
54. Van de Poel E, Van Doorslaer E, O'Donnell O: Measurement of inequity inhealth care with heterogeneous response of use to need. J Health Econ2012, 31(4):676–689.
55. Zhang L, et al: How effectively can the New Cooperative Medical Schemereduce catastrophic health expenditure for the poor and non-poor inrural China? Trop Med Int Health 2010, 15(4):468–475.
56. Somkotra T, Lagrada LP: Payments for health care and its effect oncatastrophe and impoverishment: experience from the transition touniversal coverage in Thailand. Soc Sci Med 2008, 67(12):2027–2035.
57. Li C, et al: Moving towards universal health insurance in China:performance, issues and lessons from Thailand. Soc Sci Med 2011,73(3):359–366.
58. Knaul FM, Frenk J: Health insurance in Mexico: achieving universalcoverage through structural reform. Health Aff 2005, 24(6):1467–1476.
59. Harmsworth K, Lewith GT: Attitudes to traditional Chinese medicineamongst Western trained doctors in the People's Republic of China.Soc Sci Med 2001, 52(1):149–153.
60. Howes MJR, Houghton PJ: Plants used in Chinese and Indian traditionalmedicine for improvement of memory and cognitive function. PharmacolBiochem Behav 2003, 75(3):513–527.
61. Xu W, et al: Traditional Chinese medicine in cancer care: perspectivesand experiences of patients and professionals in China. Eur J Cancer Care2006, 15(4):397–403.
doi:10.1186/1475-9276-12-20Cite this article as: Yang: China’s new cooperative medical scheme andequity in access to health care: evidence from a longitudinal householdsurvey. International Journal for Equity in Health 2013 12:20.
Submit your next manuscript to BioMed Centraland take full advantage of:
• Convenient online submission
• Thorough peer review
• No space constraints or color figure charges
• Immediate publication on acceptance
• Inclusion in PubMed, CAS, Scopus and Google Scholar
• Research which is freely available for redistribution
Submit your manuscript at www.biomedcentral.com/submit