chinas’ cotton sector - usda · chinas’ cotton sector . outlook and new policy regime . dale...
TRANSCRIPT
Chinas’ Cotton Sector Outlook and New Policy Regime Dale Cougot | 20 February 2015
TRANSCENDING BOUNDRIES
FOR 25 YEARS
Creating value is our business
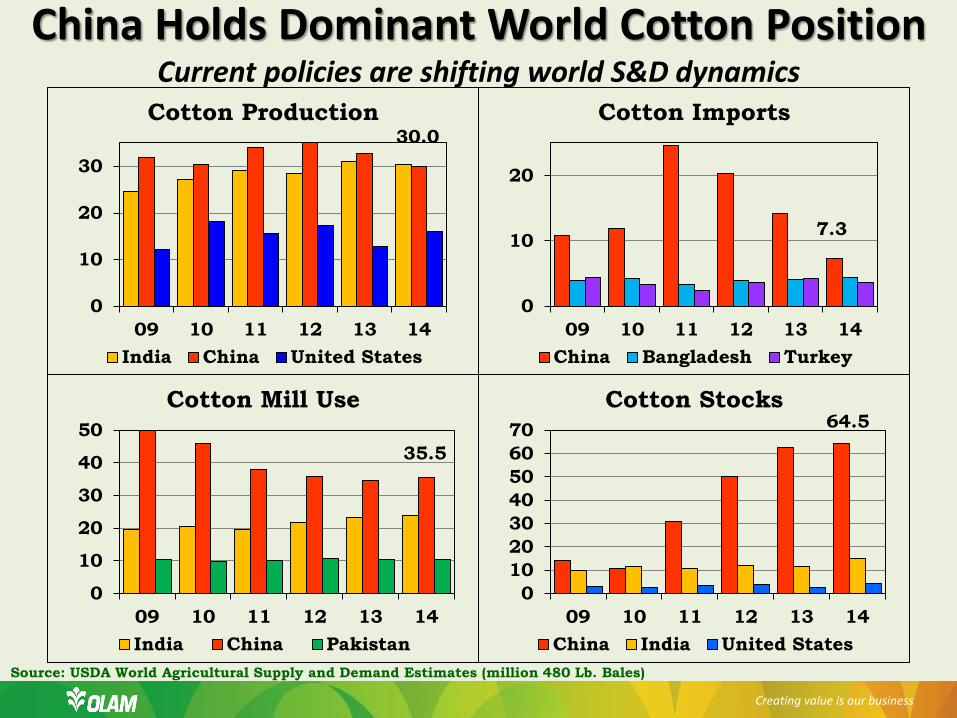
30.0
0
10
20
30
09 10 11 12 13 14
Cotton Production
India China United States
35.5
0
10
20
30
40
50
09 10 11 12 13 14
Cotton Mill Use
India China Pakistan
7.3
0
10
20
09 10 11 12 13 14
Cotton Imports
China Bangladesh Turkey
Creating value is our business
64.5
010203040506070
09 10 11 12 13 14
Cotton Stocks
China India United States
China Holds Dominant World Cotton Position Current policies are shifting world S&D dynamics
Source: USDA World Agricultural Supply and Demand Estimates (million 480 Lb. Bales)
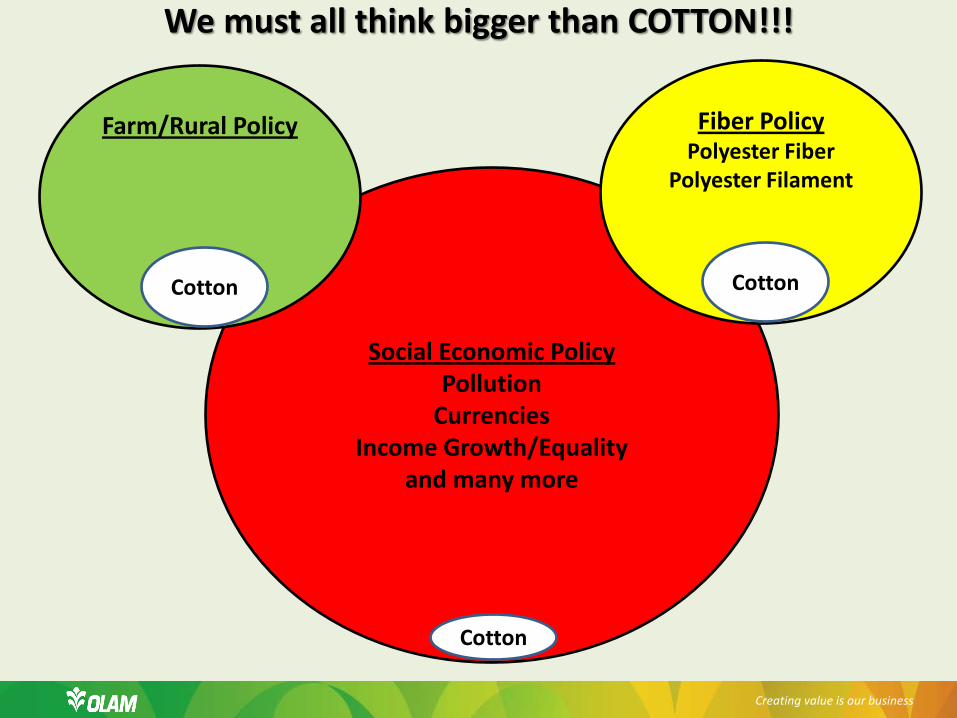
We must all think bigger than COTTON!!!
Creating value is our business
Social Economic Policy Pollution
Currencies Income Growth/Equality
and many more
Farm/Rural Policy
Cotton
Fiber Policy Polyester Fiber
Polyester Filament
Cotton
Cotton
Creating value is our business
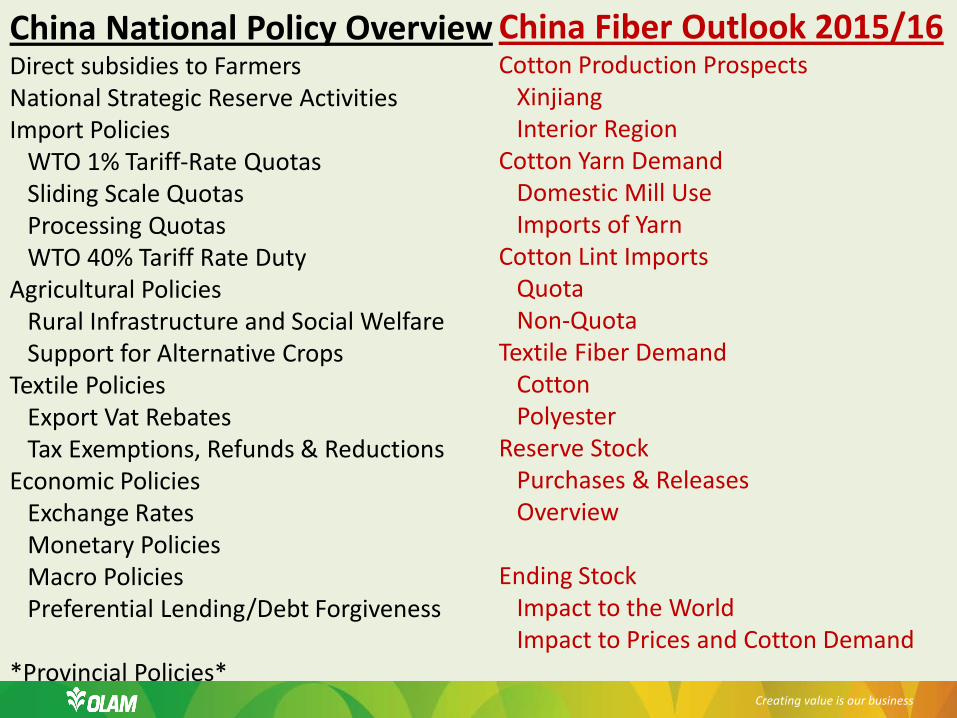
China National Policy Overview Direct subsidies to Farmers National Strategic Reserve Activities Import Policies WTO 1% Tariff-Rate Quotas Sliding Scale Quotas Processing Quotas WTO 40% Tariff Rate Duty Agricultural Policies Rural Infrastructure and Social Welfare Support for Alternative Crops Textile Policies Export Vat Rebates Tax Exemptions, Refunds & Reductions Economic Policies Exchange Rates Monetary Policies Macro Policies Preferential Lending/Debt Forgiveness *Provincial Policies*
China Fiber Outlook 2015/16 Cotton Production Prospects Xinjiang Interior Region Cotton Yarn Demand Domestic Mill Use Imports of Yarn Cotton Lint Imports Quota Non-Quota Textile Fiber Demand Cotton Polyester Reserve Stock Purchases & Releases Overview Ending Stock Impact to the World Impact to Prices and Cotton Demand
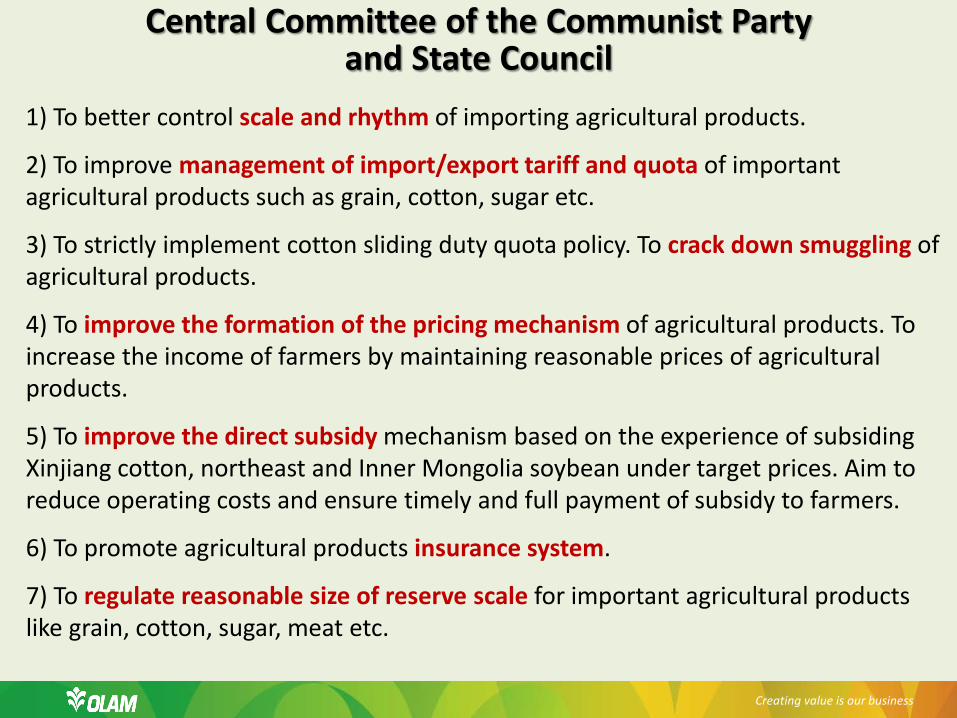
Central Committee of the Communist Party and State Council
Creating value is our business
1) To better control scale and rhythm of importing agricultural products.
2) To improve management of import/export tariff and quota of important agricultural products such as grain, cotton, sugar etc.
3) To strictly implement cotton sliding duty quota policy. To crack down smuggling of agricultural products.
4) To improve the formation of the pricing mechanism of agricultural products. To increase the income of farmers by maintaining reasonable prices of agricultural products.
5) To improve the direct subsidy mechanism based on the experience of subsiding Xinjiang cotton, northeast and Inner Mongolia soybean under target prices. Aim to reduce operating costs and ensure timely and full payment of subsidy to farmers.
6) To promote agricultural products insurance system.
7) To regulate reasonable size of reserve scale for important agricultural products like grain, cotton, sugar, meat etc.

0
50
100
150
200
250
09 10 11 12 13 14
Cents per Lb
China Cotton Price A Index
Fiber Prices China’s current situation stems from 2010/11, spike to over $2.00!
Creating value is our business
Creating value is our business
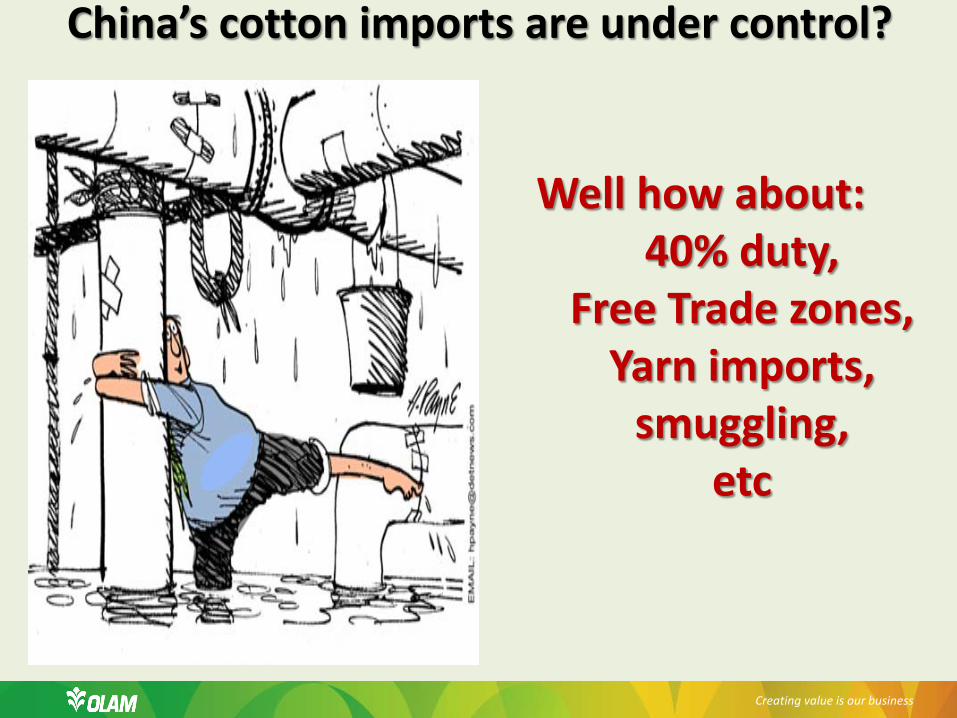
China’s cotton imports are under control?
Well how about: 40% duty,
Free Trade zones, Yarn imports,
smuggling, etc
Creating value is our business
Million Bales
Beginning Stocks
Reserve Domestic Purchase
Reserve Import
Purchase
Release Local
Cotton
Release Import Cotton
Reserve Ending Stocks
Total China Stocks
Target Price
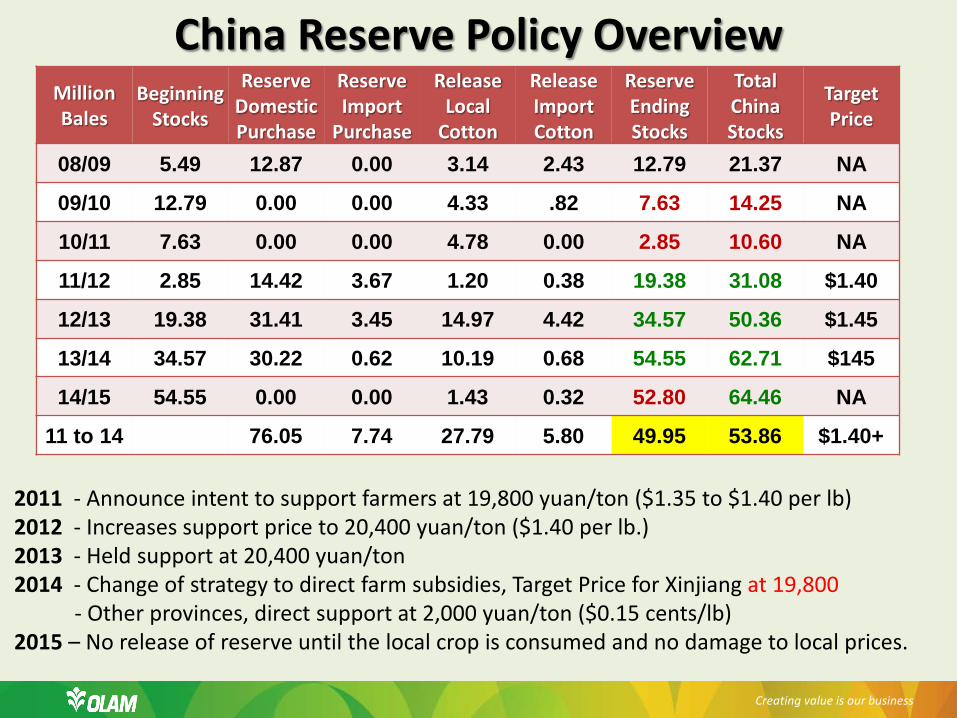
08/09 5.49 12.87 0.00 3.14 2.43 12.79 21.37 NA
09/10 12.79 0.00 0.00 4.33 .82 7.63 14.25 NA
10/11 7.63 0.00 0.00 4.78 0.00 2.85 10.60 NA
11/12 2.85 14.42 3.67 1.20 0.38 19.38 31.08 $1.40
12/13 19.38 31.41 3.45 14.97 4.42 34.57 50.36 $1.45
13/14 34.57 30.22 0.62 10.19 0.68 54.55 62.71 $145
14/15 54.55 0.00 0.00 1.43 0.32 52.80 64.46 NA
11 to 14 76.05 7.74 27.79 5.80 49.95 53.86 $1.40+
China Reserve Policy Overview
2011 - Announce intent to support farmers at 19,800 yuan/ton ($1.35 to $1.40 per lb) 2012 - Increases support price to 20,400 yuan/ton ($1.40 per lb.) 2013 - Held support at 20,400 yuan/ton 2014 - Change of strategy to direct farm subsidies, Target Price for Xinjiang at 19,800 - Other provinces, direct support at 2,000 yuan/ton ($0.15 cents/lb) 2015 – No release of reserve until the local crop is consumed and no damage to local prices.
Creating value is our business
China’s price support structure have derailed several times over the last several years.
-20
-10
0
10
20
30
40
50
60
0
50
100
150
200
250
09 10 11 12 13 14
Cents per Lb
Variance (R-Axis)China Cotton PriceA Index
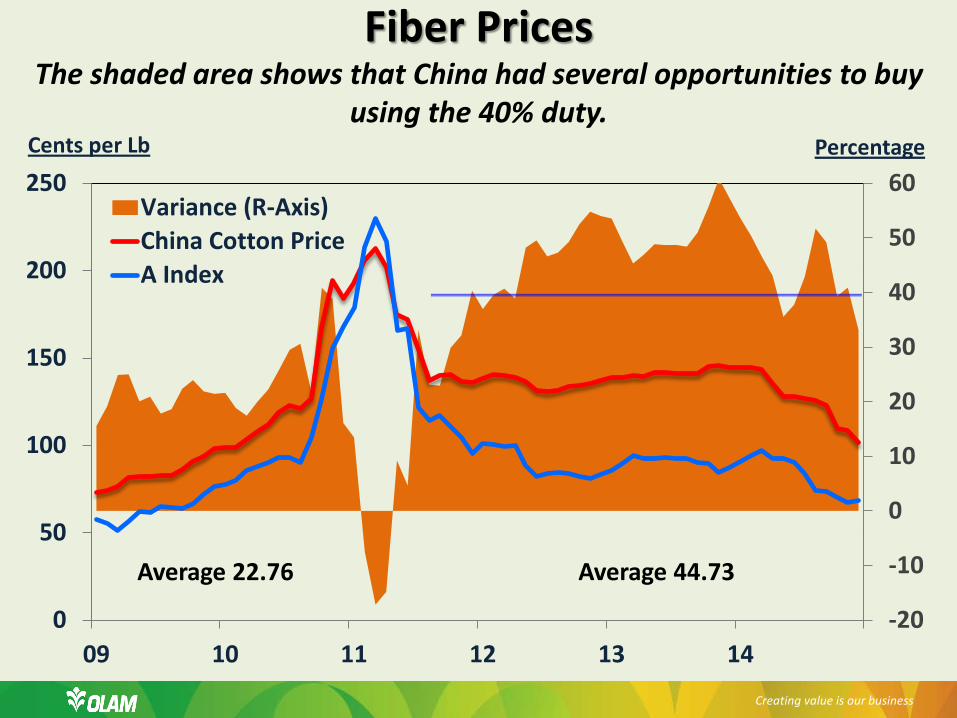
Average 44.73
Percentage
Fiber Prices The shaded area shows that China had several opportunities to buy
using the 40% duty.
Average 22.76
Creating value is our business

Crop less Use
Outside China
China’s Imports
Change in China’s Stocks
Change in Stocks
Outside China
SUR Outside
China
Annual A-Index
2009/10 1.53 10.90 -7.12 -7.73 47% 78
2010/11 17.31 11.98 -3.64 6.85 57% 164
2011/12 27.44 24.53 20.49 2.75 65% 100
2012/13 16.80 20.33 19.28 -3.11 55% 88
2013/14 13.09 14.12 12.35 -0.66 52% 91
2014/15 13.616 7.30 1.75 6.42 60% 70
2015/16 7.40 7.00 -2.60 -0.40 57% ??
Creating value is our business
Supplies Around the Globe React 2014/15 China stocks flat, rest of world rising!
Creating value is our business
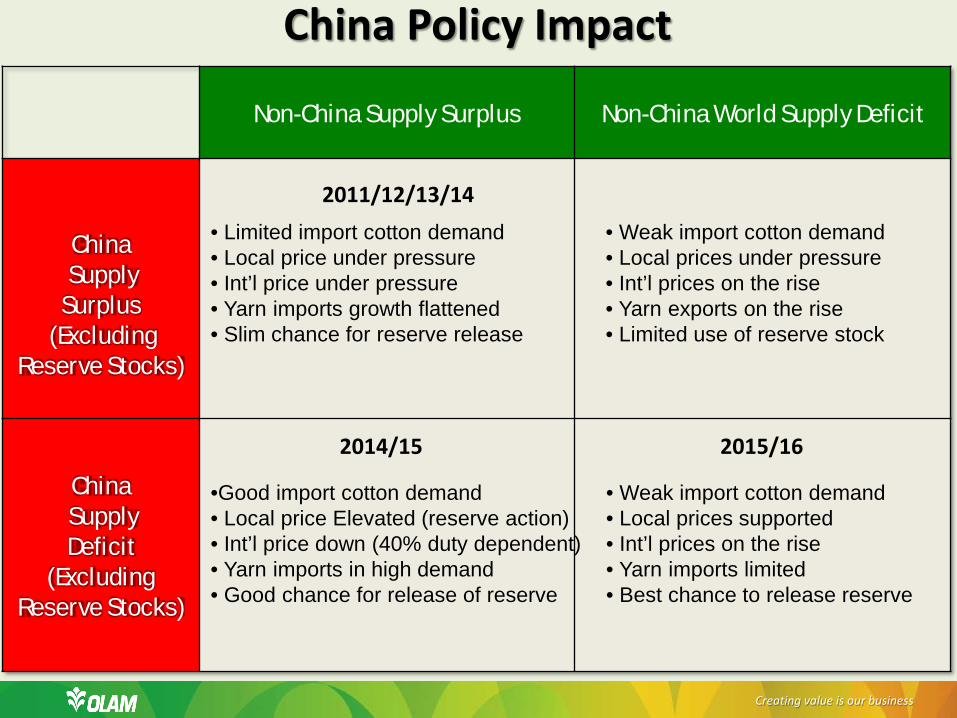
Non-China Supply Surplus Non-China World Supply Deficit
China
Supply Surplus
(Excluding Reserve Stocks)
China Supply Deficit
(Excluding Reserve Stocks)
China Policy Impact
• Limited import cotton demand • Local price under pressure • Int’l price under pressure • Yarn imports growth flattened • Slim chance for reserve release
• Weak import cotton demand • Local prices under pressure • Int’l prices on the rise • Yarn exports on the rise • Limited use of reserve stock
•Good import cotton demand • Local price Elevated (reserve action) • Int’l price down (40% duty dependent) • Yarn imports in high demand • Good chance for release of reserve
• Weak import cotton demand • Local prices supported • Int’l prices on the rise • Yarn imports limited • Best chance to release reserve
2015/16 2014/15
2011/12/13/14

The reserve may be able to release in 15/16…..
Creating value is our business

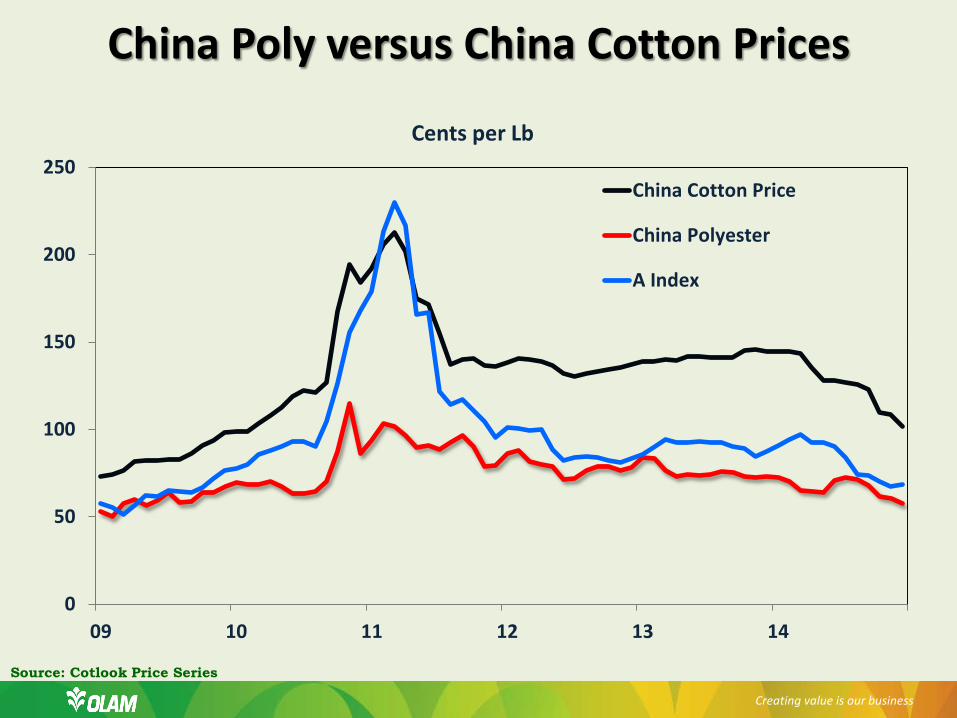
BUT, wait did anyone think about polyester…
0
50
100
150
200
250
09 10 11 12 13 14
Cents per Lb
China Cotton Price
China Polyester
A Index
China Poly versus China Cotton Prices
Creating value is our business
Source: Cotlook Price Series
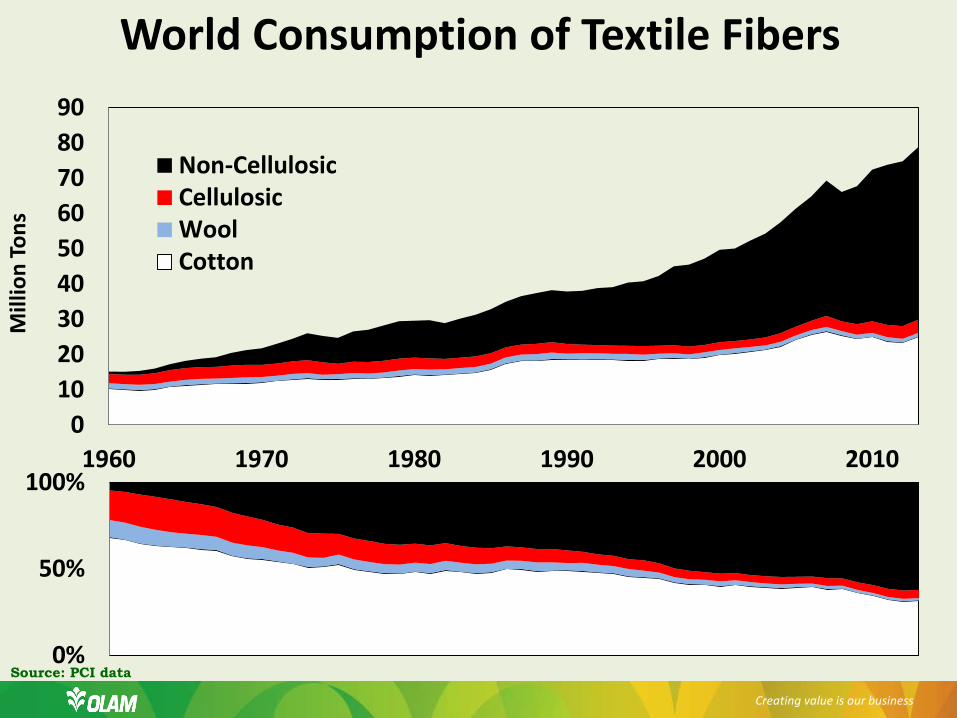
0102030405060708090
1960 1970 1980 1990 2000 2010
Mill
ion
Tons
Non-CellulosicCellulosicWoolCotton
World Consumption of Textile Fibers
0%
50%
100%
Creating value is our business
Source: PCI data
Creating value is our business
Wait the China Economy will build demand
Creating value is our business
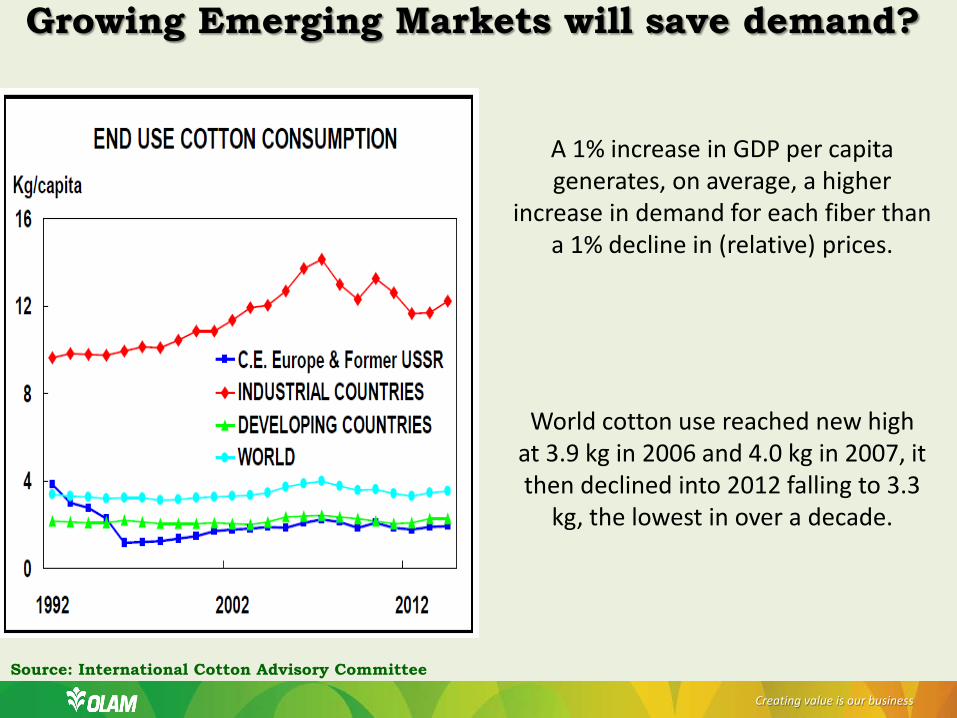
A 1% increase in GDP per capita generates, on average, a higher
increase in demand for each fiber than a 1% decline in (relative) prices.
World cotton use reached new high at 3.9 kg in 2006 and 4.0 kg in 2007, it then declined into 2012 falling to 3.3
kg, the lowest in over a decade.
Growing Emerging Markets will save demand?
Source: International Cotton Advisory Committee
Creating value is our business
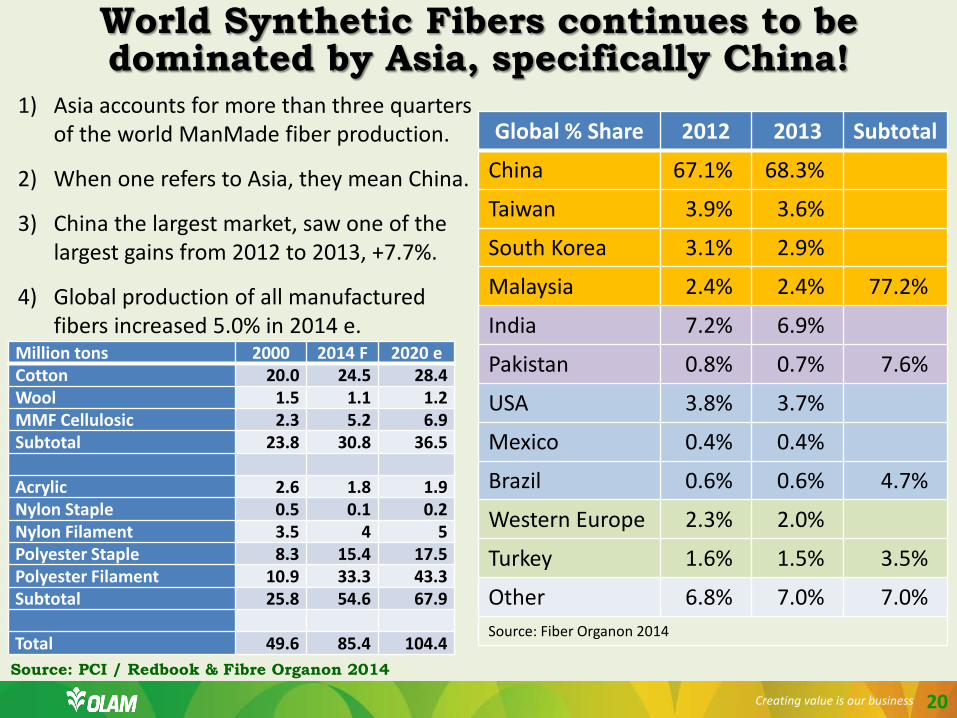
World Synthetic Fibers continues to be dominated by Asia, specifically China!
Global % Share 2012 2013 Subtotal
China 67.1% 68.3%
Taiwan 3.9% 3.6%
South Korea 3.1% 2.9%
Malaysia 2.4% 2.4% 77.2%
India 7.2% 6.9%
Pakistan 0.8% 0.7% 7.6%
USA 3.8% 3.7%
Mexico 0.4% 0.4%
Brazil 0.6% 0.6% 4.7%
Western Europe 2.3% 2.0%
Turkey 1.6% 1.5% 3.5%
Other 6.8% 7.0% 7.0% Source: Fiber Organon 2014
1) Asia accounts for more than three quarters of the world ManMade fiber production.
2) When one refers to Asia, they mean China.
3) China the largest market, saw one of the largest gains from 2012 to 2013, +7.7%.
4) Global production of all manufactured fibers increased 5.0% in 2014 e.
Source: PCI / Redbook & Fibre Organon 2014
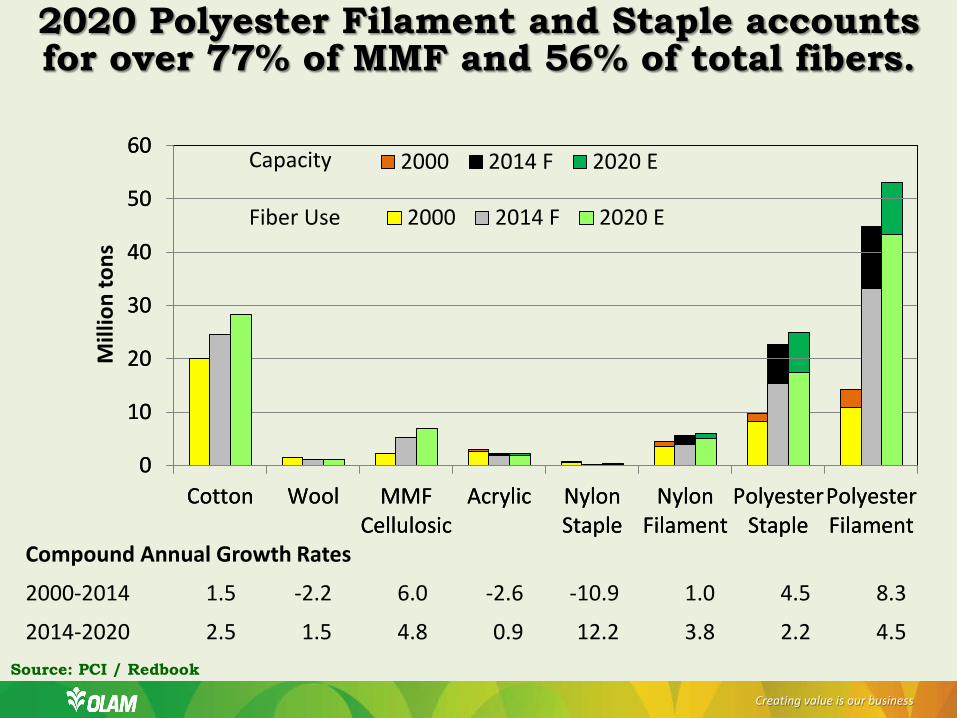
20
Million tons 2000 2014 F 2020 e Cotton 20.0 24.5 28.4 Wool 1.5 1.1 1.2 MMF Cellulosic 2.3 5.2 6.9 Subtotal 23.8 30.8 36.5 Acrylic 2.6 1.8 1.9 Nylon Staple 0.5 0.1 0.2 Nylon Filament 3.5 4 5 Polyester Staple 8.3 15.4 17.5 Polyester Filament 10.9 33.3 43.3 Subtotal 25.8 54.6 67.9 Total 49.6 85.4 104.4
0
10
20
30
40
50
60
Cotton Wool MMFCellulosic
Acrylic NylonStaple
NylonFilament
PolyesterStaple
PolyesterFilament
Mill
ion
tons
2000 2014 F 2020 E
0
10
20
30
40
50
60
Cotton Wool MMFCellulosic
Acrylic NylonStaple
NylonFilament
PolyesterStaple
PolyesterFilament
2000 2014 F 2020 E
Compound Annual Growth Rates
2000-2014 1.5 -2.2 6.0 -2.6 -10.9 1.0 4.5 8.3
2014-2020 2.5 1.5 4.8 0.9 12.2 3.8 2.2 4.5
Creating value is our business
2020 Polyester Filament and Staple accounts for over 77% of MMF and 56% of total fibers.
Source: PCI / Redbook
Capacity Fiber Use
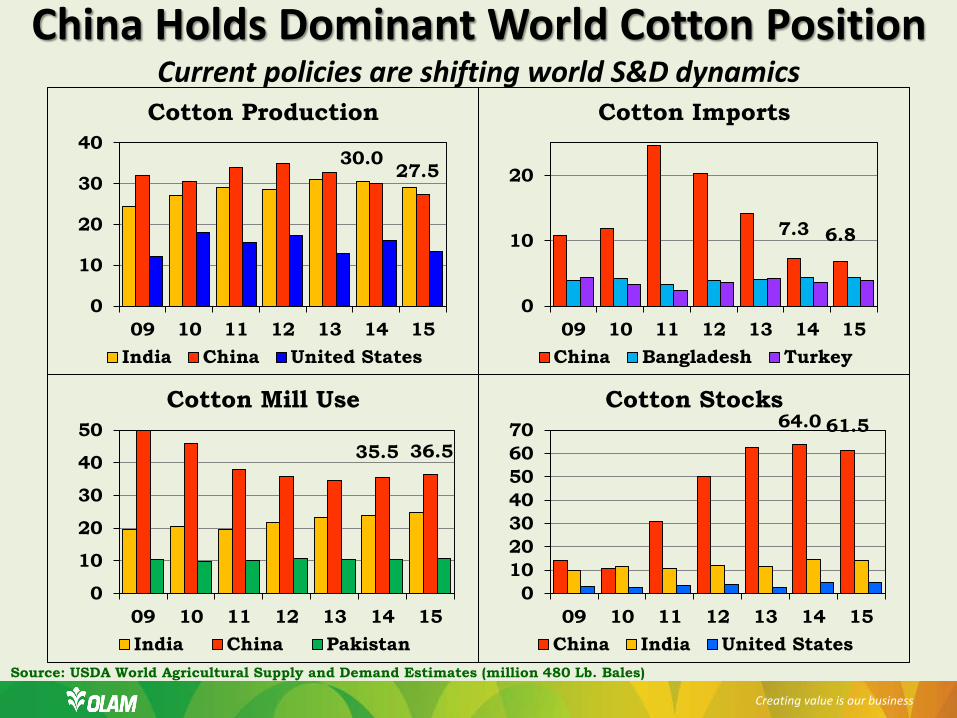
30.0 27.5
0
10
20
30
40
09 10 11 12 13 14 15
Cotton Production
India China United States
35.5 36.5
0
10
20
30
40
50
09 10 11 12 13 14 15
Cotton Mill Use
India China Pakistan
7.3 6.8
0
10
20
09 10 11 12 13 14 15
Cotton Imports
China Bangladesh Turkey
Creating value is our business
64.0 61.5
010203040506070
09 10 11 12 13 14 15
Cotton Stocks
China India United States
China Holds Dominant World Cotton Position Current policies are shifting world S&D dynamics
Source: USDA World Agricultural Supply and Demand Estimates (million 480 Lb. Bales)

Conclusions
Creating value is our business
China cotton production down (8 to 9%) in the interior and flat in XJ. China farm subsidy tested again in 2015/16 on a wider basis China crop insurance programs are tested in 2015/16 China cotton consumption grows (3%) modestly in the coming years. Chin imports exceed the WTO level by 2 to 3 million bales China yarn imports grow (investment in neighboring markets) China cotton per capita continues to fade to new MMF materials World cotton demand returns to long-term growth rate (2.5 to 3.0%). Non-China cotton demand returns back to pre WTO markets Non-China cotton supplies falls (specifically US, Australia and Brazil) Cotton supplies are destined to remain high for several years. China reserves fall modestly by 2 million bales Cotton prices influenced by the large stocks, and limits growths. Biggest cotton price influencer, China’s Policy changes. - Short-term India’s stock policy.
Chinas’ Cotton Sector Outlook and New Policy Regime Dale Cougot | 20 February 2015
TRANSCENDING BOUNDRIES
FOR 25 YEARS
Thank you