china’s solar, wind and energy storage...
TRANSCRIPT

Accelerating Innovation in
China’s Solar, Wind and Energy
Storage Sectors
Smita Kuriakose, Joanna Lewis, Jeremy Tamanini and Shahid Yusuf Trade and Competitiveness Global Practice
Pub
lic D
iscl
osur
e A
utho
rized
Pub
lic D
iscl
osur
e A
utho
rized
Pub
lic D
iscl
osur
e A
utho
rized
Pub
lic D
iscl
osur
e A
utho
rized
1
Contents
Acknowledgements .................................................................................................................... 4
Executive Summary .................................................................................................................... 5 Role of Government and Policy Recommendations .................................................................................. 5 Increase support for early-stage innovation .......................................................................................... 6 Design the domestic venture capital market to avoid pitfalls experienced by foreign peers ............... 6 Further leverage strong record at commercializing cleantech innovations ......................................... 7 Continue to focus on dynamic cost innovation ....................................................................................... 7 Take a more comprehensive approach to measuring innovation ......................................................... 7 Strengthen the political, regulatory and business environment for innovators ................................... 8 Connect China with global innovation networks .................................................................................... 8
1. Introduction .................................................................................................................... 11 China’s Energy Challenge .......................................................................................................................... 12 The Environmental Challenge .................................................................................................................. 15 The Role of Innovation for Green Growth ............................................................................................... 15 Government Policy Framework ............................................................................................................... 18
Energy efficiency and greening starting with the 11th Five-Year Plan ................................................... 20
2. Regulatory and Policy Frameworks for Renewable Energy in China .................. 22 Policy Rationale for Promoting Renewable Energy................................................................................ 22
Deployment Policies ................................................................................................................................ 22 Industrial Policies .................................................................................................................................... 24
Where Does China Stand Globally in Regulatory Framework for Renewable Energy? ....................... 26 Best Practices in Promoting Renewable Energy Deployment and Technology Innovation ................ 28
Supporting Early-Stage Technologies ..................................................................................................... 28 Supporting Advanced Innovation ........................................................................................................... 28 Supporting Large-Scale Commercialization and Deployment ................................................................ 29
Supporting Renewable Energy in China .................................................................................................. 29 Supporting Indigenous Innovation through Technological Catch-Up ..................................................... 31 Inefficiencies in the Policy Framework .................................................................................................... 32
Innovation in China’s Renewables Sector ............................................................................................... 33 Global Innovation Index .......................................................................................................................... 34 Global Cleantech Innovation Index ......................................................................................................... 37
3. China’s Wind Power Technology Sector .................................................................... 41 Leaders in China’s Wind Power Technology Sector ............................................................................... 42 Research and Development ........................................................................................................................ 43 Venture Activity .......................................................................................................................................... 43 Case Study: Goldwind ................................................................................................................................. 44
Technology Acquisition ........................................................................................................................... 44 Technology Innovation ........................................................................................................................... 46
Case Study: Guodian United ..................................................................................................................... 47 Technology Acquisition ........................................................................................................................... 47 Technology Innovation ........................................................................................................................... 48
China’s Role in Global Wind Power Technology Innovation.................................................................. 48 Assessing Technological Sophistication .................................................................................................. 49
2
Patenting Activity ................................................................................................................................... 49 Patent Citation Likelihood....................................................................................................................... 53 Other Measures ...................................................................................................................................... 54 Assessing Learning and Cost Declines..................................................................................................... 55 Assessing Quality .................................................................................................................................... 57
Case Study: Wind Turbine Test Centers (Denmark) .............................................................................. 59 Government Policy Support ........................................................................................................................ 60
Pricing and Subsidies .............................................................................................................................. 60 Technology Transfer and Localization Mandates ................................................................................... 61 Research and Development Programs ................................................................................................... 63 Industrial and Trade Policies ................................................................................................................... 63
Course Corrections and Lessons Learned ................................................................................................... 64 Electricity versus Capacity ...................................................................................................................... 64 Curtailment Woes ................................................................................................................................... 65 Technology Transfers in China’s Wind Industry ...................................................................................... 66 Technology Networks ............................................................................................................................. 67
Case Study: Siemens (Germany) ................................................................................................................. 69 Looking Ahead ........................................................................................................................................... 69
4. China’s Solar Power Technology Sector .................................................................... 70 Solar Power Development .......................................................................................................................... 71
Research and Development .................................................................................................................... 73 Venture Activity ...................................................................................................................................... 73 Case Study: First Solar (United States) ................................................................................................. 74
Leaders in China’s Solar Power Technology Sector ................................................................................ 75 Suntech: A Case Study ............................................................................................................................. 75 JA Solar and Innovalight: A Case Study ................................................................................................... 77
Assessing Technological Sophistication ...................................................................................................... 78 Patenting Activity ................................................................................................................................... 78 Patent Citation ........................................................................................................................................ 78 Assessing Learning and Cost Declines..................................................................................................... 79 Assessing Quality .................................................................................................................................... 80
Government Policy Support ........................................................................................................................ 80 Looking Ahead ........................................................................................................................................... 83 Innovations in Wind and Solar Compared .................................................................................................. 83
Role of State Support .............................................................................................................................. 83 Role of International Technology Transfer ............................................................................................. 84 Wind versus Solar Innovation Processes Compared ............................................................................... 84
Limitations to Innovation ............................................................................................................................ 85
5. China’ Energy Storage Technologies Sector .............................................................. 87 The Global Energy Storage Market and China’s Role ................................................................................. 89 Venture Activity .......................................................................................................................................... 93 Case Study: Aquion Energy (United States) ................................................................................................ 94 Case Study: BYD—Leader in China’s Storage Technology Sector ............................................................... 95 Assessing Technological Sophistication ...................................................................................................... 96
Patenting Activity ................................................................................................................................... 96 Level of Co-Invention .............................................................................................................................. 99
Overview of China’s Regulatory and Policy Framework for Energy Storage ............................................ 101

3
Energy Storage in Government Plans ................................................................................................... 102 Central Level ........................................................................................................................................ 102
Energy Storage Demonstration Projects ................................................................................................... 104 International Policy Comparison ............................................................................................................... 105
Policy Experience in the United States .................................................................................................. 106 Federal Policy ....................................................................................................................................... 106 State Policy ........................................................................................................................................... 108
Smart Grid Technology ............................................................................................................................. 109 Case Study: Tesla: Examining an Innovative Energy Storage Company.................................................... 110 Looking Ahead ........................................................................................................................................... 111
6. Role of Government: Policy Recommendations ........................................................... 113 Priority Areas for New Policies and Programs .......................................................................................... 115 Increase support for early-stage innovation ............................................................................................. 115 Take a more comprehensive approach to measuring innovation ............................................................ 116
Increase International Collaboration and Access to Global Learning Networks .................................. 116 Improve Market Design to Allow Renewable Energy to Compete ........................................................ 118 Focus on performance, not just capacity expansion ............................................................................. 119 Increased Development and Demonstration of Energy Storage Technologies .................................... 120
References ................................................................................................................................... 122
[A]Annex to Chapter 5 ................................................................................................................. 149

4
Acknowledgements
This study was prepared by a core team led by Smita Kuriakose (Senior Economist and Task Team
Leader, Trade and Competitiveness GP) and comprising Joanna Lewis (Professor, Georgetown
University and Consultant T&C GP), Jeremy Tamanini (Consultant T&C GP), and Shahid Yusuf
(Consultant, T&C GP). Significant inputs were received from Lee Branstetter (Professor, Carnegie
Mellon University and Consultant T&C GP), and Ron Wu (Private Sector Development Specialist,
T&C GP).
Specific inputs were also received from Antione Coste (Young Professional), Michael Ehst (Senior Private Sector Development Specialist, T&C GP), Radu Tatucu (Young Professional), Yao Zhao (Consultant), and Dominique Van Der-Mensbrugghe (Consultant). A background note on energy storage trends was also produced by Carnegie Mellon University students Benjamin Silliman, Evan Leibowitz, Wenli Xie, Ziwen Song, Rodolfo Scannone, Long Lam and Guangwei Li.
The team has greatly benefited from constructive comments from peer reviewers Jean Louis Racine (Senior Private Sector Development Specialist, T&C GP), Bekele Debele Negewo (Program Leader, China) as well as extensive comments from Hoon Sahib Soh (Program Leader, China).
The work has been produced under the overall guidance of Bert Hofman, World Bank Country Director for China; and Mona Haddad, Practice Manager for Trade and Competitiveness GP for East Asia.

5
Executive Summary
China is keen to prioritize green development to spur growth and to reduce the environmental
impact of growth. China also wants to transition to a growth model driven more by innovation. The
13th Five-Year Plan (FYP) (2016–20) refers to innovation as “the first driver of growth,”
emphasizing that innovation must occupy the core position in China’s overall development. Green
energy innovations promise large returns over the longer term and need to be pursued with vigor.
How China can go beyond catching up and begin to push the technology frontier—possibly by
increasing the share of R&D allocated for green research (which covers subfields, including
cybersecurity for energy infrastructures) and by modifying its policy environment for
commercialization and other forms of innovation—is an issue that deserves closer analysis, which
this study will provide.
Green innovation can become a new driver of growth. It can spur economic growth by (a)
enhancing productivity in traditional industries by reducing the energy use and lessening the
environmental impact; (b) expanding new green industries, such as renewable energy, clean cars,
and waste management; and (c) leapfrogging current technology to give rise to new industries. In
addition, green innovation can contribute to growth by enlarging the service sector that underpins
green development, such as contract energy management or clean public transport. The Chinese
government is hopeful that green innovation will substantially enhance growth, and this study
explores that potential.
The study analyzes a few specific sectors in which China has varying levels of advancement: wind,
solar, and energy storage. These sectors have been chosen on the basis of (a) their central role in
China’s ability to meet its green growth and greenhouse gas (GHG) reduction goals, (b) China’s
continuing large public investment into innovation in these sectors, and (c) the expected
availability of data to use in the analysis, including outputs such as patenting and inputs such as
public and private investment in research and development (R&D). They also offer interesting
comparisons because the maturity of each sector varies, and China’s own innovation prowess
varies within these sectors.
China must accelerate green innovation to achieve ambitious emission reduction targets and to
promote continued economic development. While innovation can be a more central driver of
China’s growth and competitiveness, there is limited research on how to realize this
transformation. This study takes a data-driven approach to filling this research gap. It assesses
where China currently stands compared to its global peers, how policies can be introduced (or
retooled) to foster greater innovation in these three sectors, and what learning and insight
international case studies can offer to Chinese policy makers.
Role of Government and Policy Recommendations
The government plays an essential role in establishing a conducive environment for green
innovation. Given the high fixed costs associated, green sectors are even more dependent on the
public sectors and favorable regulatory regimes. This study has reviewed China’s domestic strategy
to support wind, solar, and energy storage technology development and China’s position globally in
each of these sectors’ innovation.
The recommendations provided in this study aim to provide China with more comprehensive
support for select green sectors. The key recommendations from the study include:

6
Increase support for early-stage innovation
Government support for strategic industries may include access to dedicated state industrial funds,
increased access to private capital, or industrial policy support through access to preferential loans
or R&D funds. However, such funds should be allocated strategically, without picking winners.
While integration of an industry can improve efficiency, it can simultaneously stifle innovation. For
example, as China has consolidated the entire upstream solar supply chain, some have argued that
this integration can stifle disruptive innovation, and therefore we are unlikely to see the emergence of new, innovative solar technologies from China.
Overall R&D dollars have been increasing for early-stage research in China's quest to become a
more innovative economy that is less reliant on foreign technology. The Ministry of Science and
Technology (MOST) is completely overhauling its science and technology support system, including
for clean energy, so the previous programs that have benefited wind and solar technology
companies are being redirected and restructured. Much of past R&D support has been criticized for
being given to the large state-owned enterprises rather than to smaller, more innovative firms and
for allocating and spending much of the money inefficiently. Rectifying that situation will surely not
be easy, but MOST is working to more competitively allocate funding, which in theory could be good
for more innovative firms. Although China has clearly succeeded in bringing commercial
technologies to scale and in reducing costs with incremental innovations, it is not yet well
positioned to develop the next generation of innovative wind and solar technologies. Therefore,
these areas would benefit from targeted government R&D support.
To improve the innovation impact of government resources, the following improvements are
suggested:
• Support should be more competitively allocated.
• Be strategic about government support at all stages of technology development, particularly early stage support.
ARPA-E in the United States provides one such example of targeting high-risk, high-reward clean
energy innovations. Government loan guarantees then provide later stage support for many clean
energy startup companies. These early stage support programs are highly competitive and help
prepare fledging technology companies for larger-scale technology demonstrations.
Design the domestic venture capital market to avoid pitfalls experienced by foreign peers
Globally, venture capital and green start-ups have not always been well matched. The most
common reason for this is that many cleantech start-ups take too long to reach commercial
viability, putting strain on the shorter timelines for returns required by venture capital investors.
This “Valley of Death” is particularly pronounced for science-based technologies that require
lengthy product development cycles. Newer energy storage products not built with lithium-ion
battery types are realizing similar limits as some of the most promising and well-funded energy
storage start-ups today are simply running out of cash (see Aquion case study). Chinese policy makers should re-design the domestic venture capital market which is increasingly dominated by
government-guided venture funds, keeping these principles in mind. There is a possibility that

7
continued local government support is stymieing competition and not leading to enough exits in the
Chinese market.
Further leverage strong record at commercializing cleantech innovations
China scores quite well on factor D of the Global Cleantech Innovation Index (Evidence of
Commercialized Cleantech Innovation), surpassed only by New Zealand and Denmark among the
high-income countries that score higher than China overall. This strong result is due to the heavy
weighting of two subcomponents: Value Added from Cleantech Manufacturing and Renewables as
percentage of Primary Energy Consumption. In both areas, China should continue to improve in
subsequent editions of the GCII as large solar and wind manufacturers maintain their global market
share and new renewable energy capacity continues to expand. And although China’s strength on
this factor could be viewed as merely the result of being such a large, rapidly growing market, it is
important to note that innovation does not exist only in early-stage companies or academic
research environments. Innovation can take place along different points of the value chain. In the
instance of renewable energy technologies, Chinese manufacturers have been leaders in process
innovation and have been using it to improve production efficiencies. But because process
innovation is so integrated into industrial supply chains, it can be difficult to quantify through
indicators like the ones referenced in the GCII. As a result, it is important to look more specifically
at the solar, wind, and energy storage sectors in China to better understand the dynamics of
innovation within them and the opportunities for expanding them in the future.
Continue to focus on dynamic cost innovation
Some scholars have examined the sustained decline in product prices in the Chinese alternative
energy hardware industries and have interpreted this as prima facie evidence of dynamic “cost
innovation”—intentional, cumulative refinement of the manufacturing process, coupled with small
changes in the product itself (Nahm and Steinfeld 2014). These changes are individually too minor
to merit a patent but, collectively, result in steady, sustained, significant cost reductions. However, sustained price reductions could also emerge from a process of gradual absorption of Western best
practice and its application in a context in which factor and input prices are lower than in the
Western locations where the technology was originally invented. Prices and costs could fall even in
the absence of a meaningful capability on the part of Chinese firms to refine, improve, and change
production processes in significant ways.
Take a more comprehensive approach to measuring innovation
The dominant model of innovation indicators is based on a linear model of innovation, and includes
such factors as R&D expenditures, human resources qualification, and patents. These indicators are
not as effective at measuring what actually happens between the inputs to innovation (like R&D)
and the outputs of innovation (like patents), and therefore they arguably provide only a partial
view of innovation. That may be especially prejudicial for firms in emerging economies, where
fewer financial resources are available for everything from patent registration and maintenance to
R&D support (Marins 2008).
As a result, taking a more comprehensive approach to measuring innovation may be more suitable
for a context such as China. That approach would include measuring progress in innovation in
relation to higher-performing technology or measuring cutting-edge innovations in a specific sector

8
against a global benchmark. Examples include overall efficiency, size, or other performance metrics.
A deeper exploration of the dynamics of innovation in the solar, wind, and stationary storage
sectors in China starts with understanding how innovation is measured in a comparative way
between countries. Simple patent counts do not account for the differences in commercial values of
various patents nor do they indicate whether the patented technology is being adopted.
To better understand metrics that are suitable for assessing innovation in the Chinese context, the
following are recommended:
• Develop more transparent metrics to track innovation inputs including R&D expenditures by technology.
• Develop more transparent metrics to track innovation outputs including patent quantity and quality both inside and outside of China.
Strengthen the political, regulatory and business environment for innovators
Of the seven main factors defining the Global Innovation Index (GII), China’s weakest result is on
Institutions (Innovation Input), in which it ranks 79th of the 128 countries covered. Low scores
across the Political, Regulatory, and Business Environment subcomponents drive this negative
result. China scores particularly poorly on the Cost of Redundancy Dismissal, Salary Weeks (107th),
and Ease of Starting a Business (103rd). This uniform weakness across institutions suggests that
according to the GII framework, one principal pathway for fostering innovation in China is fine-
tuning the overarching political, regulatory, and business environments that entrepreneurs must
interact with there. Some specific approaches to improvement include:
• Continuing to ease the process of establishing a business and accessing credit. The most recent World Bank Doing Business 2017 reports that China introduced a single form to
obtain a business license and improved access to credit information in Beijing and Shanghai.
• Strengthen IP regimes in China and communicate these improvements to foreign investors
with the goal of increasing FDI flows.
Connect China with global innovation networks
The review of the Global Innovation Index pointed to China scoring quite low on
University/Industry Research Collaboration (31st), State of Cluster Development (23rd), Gross domestic expenditure for R&D financed by abroad by percentage (90th), and Joint Venture Strategic
Alliance Deals per billion $PPP GDP (49th). In addition, the patent analysis showed that Chinese
patent citations were lower than its peers and the number of patents filed by Chinese inventors in
USPTO and EPO are also lower than those of its peers. These are all signs of limited international
collaboration to promote domestic innovation capabilities. In the wind industry, we see further
signs of this. For example, Chinese turbine manufacturers increasingly rely on R&D centers outside
of China to generate international patents. Envision Energy, a Jiangsu producer, established its
Global Innovation Center in Denmark, and all of its EPO, USPTO, and PCT patents were assigned to
its Danish counterpart, Envision Energy (Denmark) ApS. Likewise, all of XEMC’s patents were
assigned to its Dutch subsidiary, XEMC Darwind, and all of the listed inventors have Dutch
nationality. Goldwind in 2008 acquired the majority stake in Vensys, a German firm, and since then,

9
Vensys and its German inventors have obtained four USPTO patents and four EPO patents.
Goldwind and Vensys also jointly filed for one EPO application.
Reforms to the IP system including how patents are incentivized and granted, is also important,
both to encourage international collaborations and to ensure that the most innovative Chinese
firms do not leave China in search of better IP protection. Currently, energy storage research
centers are more developed outside China. Chinese researchers can improve their efficiency and
knowledge by collaborating with those foreign centers of excellence.
As a result, it is recommended that the government aim to:
• Encourage international collaboration in clean energy innovation by opening early-stage
demonstration projects to foreign partnerships.
• Encourage the development of industrial clusters to foster innovation and shared knowledge in strategic sectors with both foreign and domestic researchers and firms.
• Undertake broader reform to the intellectual property (IP) system.
• Communicate these reforms to foreign joint venture partners with the goal of more closely linking their frontier innovations with partners in the China market.
Improve Market Design to Allow Renewable Energy to Compete
Policies aimed at increasing demand are struggling to continue to grow the wind and solar sectors
because of overcapacity in the power sector and widespread curtailment. Broader power sector
reform is on the horizon, but the rollout has been incremental. Therefore, in the absence of policies
driving market growth and innovation indirectly, it will be more important for the government to
strategically implement policies that directly support innovation. The Chinese national government
is keenly aware of the problem of renewable curtailment and has acknowledged as much. A set of
policies and regulations has been unleashed, to a large extent, to address this curtailment problem.
The key policy issue is how to bring about the change from using coal, oil, and gas sources of energy
to using renewables. Underlying that problem, is the constraint on renewables, such as wind power
and solar energy—China is the world’s largest generator of both—because of the problems of
transmitting energy from provinces that generate excess power to provinces where the demand is
highest. Distances are too great, local grids are not connected nationally, and the storage of energy is a problem. An additional policy problem is that “provincial governments are incentivized to
dispatch power locally to support their tax base and oppose importing renewable energy from
wind-rich provinces to protect the financial health of local fossil fuel generators” (Vest 2017). The
result is, “According to China’s Renewable Energy Industries Association (CREIA), the country’s
average wind curtailment rate stood at a record high of 15% in 2015” (Ying 2016). The lack of a
spot market for energy supplies is another policy issue that has been raised in the debates in China
(Vest 2017). Such problems clearly subvert green policies nationally.
Green energy policy, therefore, would best focus on the following:
• Create the right incentives for industries and households that burn coal to switch to
renewables using low-energy-consuming ICTs as machine tools and as home appliances.

10
• Introduce smart grid measures that on the technology side allow for interconnecting networks and high-speed low-attenuation of transmissions, and on the business side
incentivize energy exchanges, spot markets, and discounts for storage and off-peak
consumption.
• Research more cost-efficient green means of energy generation and storage.
The design of China’s power markets makes it very difficult for renewable energy to compete.
Thermal power plants are assigned a set number of full load hours every year, and interprovincial
trading volumes are decided usually as much as a year in advance. Although some financial
incentives maximize local production, the variability of renewable sources such as wind power
interferes with the long-standing practice of allocating full load hours and trading far in advance.
Power sector reforms that could be taken to improve the ability of renewable energy to compete
include:
• Develop competitive wholesale markets to reduce allocation of operating hours to coal-
based generators and increase hours allocated to more efficient, cleaner plants.
• Give renewable energy priority dispatch status to address widespread curtailment.
• Increase overall power system flexibility through improvements such as coordination of the electricity and heating sectors, greater coordination between balancing areas, more
electricity transfers between regions, implementation of market mechanisms and other
incentives to support resource flexibility, incorporation of wind and solar into system
dispatch, and better use of wind and solar forecasts.
• Increase incentives for grid companies to experiment with new regulatory models so they are encouraged to dispatch generation most efficiently and cleanly, including through
demand side management.
• Increase the use of energy storage applications as part of a more comprehensive strategy to
optimize China’s power system, including by improving the overall stability of the
electricity grid.
Focus on performance, not just capacity expansion
Too often there is insufficient learning from demonstration projects applied to larger scale
deployment mechanisms. This has been true in early wind farm development, in distributed solar
development, and most recently in energy storage projects. Policy in China still targets capacity
expansion at the expense of performance. Wind is a great example where capacity targets are
regularly met or exceeded while performance and capacity factors are far below global averages. As
a result, it is recommended that successes and failures be better examined and lessons learned
incorporated in the design of future projects and policy incentives.
This includes:
• Review and examine existing energy storage demonstration projects, including with
different technology configurations.
• Emphasis to be laid on performance and not entirely on capacity expansion for future
initiatives.

11
1. Introduction
This chapter provides the rationale and background for Government policy intervention for Green
Innovation. It describes the economic, energy and environment challenges that China faces and the
inherent need for policies to foster greater innovation in the green economy.
China has achieved well-known success in economic growth and development in the past 35 years.
It has registered sustained rapid growth of close to 10 percent with a sharp rise in per capita
income and living standards. More than 500 million people have been lifted from poverty.
China now wants to transition to a growth model driven more by innovation. The 13th Five-Year
Plan (FYP) (2016–20) refers to innovation as “the first driver of growth,” emphasizing that
innovation must occupy the core position in China’s overall development. Given the diminishing
returns to investment, declining growth rate in labor supply, and gradual exhaustion of “easy”
structural reforms, the Chinese authorities realize that the country must increasingly rely on
innovation as the leading driver for productivity-led growth. In short, it wants to move from “Made
in China” to “Created in China.”
China is also keen to prioritize green development to spur growth and to reduce the environmental
impact of growth.1 As argued in the China 2030 report (World Bank 2013), green development is
likely to (a) enhance China’s global competitiveness in quickly growing new industries; (b) reduce
the costs of environmental degradation, which are estimated at 10 percent of gross domestic
product (GDP); and (c) lower the energy import bill, enhance urban livability, and reduce
infrastructure constraints. In addition, green development may increase productivity by lowering
production’s resource intensity and by reducing the negative impact of climate change on China.
Finally, given that China is the largest global polluter, with more than 25 percent of total global
carbon dioxide (CO2) emissions, green development could help mitigate climate change and
enhance global welfare.
Along with innovation, green growth is emphasized in the 13th FYP as one of the five pillars for
development. China’s green innovation ambition stems from the alignment of this industrial
strategy with other key national priorities, namely, meeting growing energy demand, reducing air
pollution, and developing new high-tech industries. The plan has a clear objective of pursuing green
and low-carbon development to cut China’s climate footprint and to meet its commitments under
the 2016 meeting of the Conference of the Parties to the Paris Agreement. The FYP focuses on the
intersection between innovation and green growth and pledges to support innovation in
environmental equipment and service models, promote environmentally friendly products, and
enhance the capacity to manufacture, research, and develop leading environmental technologies.
The FYP also calls for an expansion of basic infrastructures for technologies in such sectors as
energy, earth system science, environment, and materials.
This study aims to help provide China with more comprehensive support for select green sectors.
The study analyzes a few specific sectors in which China has varying levels of advancement: wind,

12
solar, and energy storage. These sectors have been chosen on the basis of (a) their central role in
China’s ability to meet its green growth and greenhouse gas (GHG) reduction goals, (b) China’s
continuing large public investment into innovation in these sectors, and (c) the expected
availability of data to use in the analysis, including outputs such as patenting and inputs such as
public and private investment in research and development (R&D). They also offer interesting
comparisons because the maturity of each sector varies, and China’s own innovation prowess
varies within these sectors.
China has been catching up with the technological leaders in wind and solar power, energy storage,
and grid technologies. Thus far, it has made few significant innovations. However, the opportunities
are vast, especially in the further improvement of solar panels (for example, by using graphene and
nanomaterial, stacking photovoltaic (PV) material to tap a broader segment of the light spectrum,
and applying solar film to a wide range of surfaces).2 Ample opportunities also exist to advance
storage (and fuel cell) technologies—which have been a major stumbling block.3 Although China
has mastered the lead acid, lithium ion, and flow technologies, the challenge is to move beyond to
develop and perfect other options. Integrating the increased supply of renewable energy (and the
proliferation of prosumers who both consume and produce electricity) into the national grid and
developing microgrids with the help of storage systems will be another challenge for China’s
researchers, firms, and policy makers. The scope for innovation in products, software, and pricing
strategies is substantial. As the Economist (2014, 12) notes, “The Internet has made it possible for
its users to generate, store and manage data efficiently. Now processing power and algorithms will
do the same for electricity.”
Green energy innovations promise large returns over the longer term and need to be pursued with
vigor. How China can go beyond catching up and begin to push the technology frontier—possibly by
increasing the share of R&D allocated for green research (which covers subfields, including
cybersecurity for energy infrastructures) and by modifying its policy environment for
commercialization and other forms of innovation—is an issue that deserves closer analysis, which
this study will provide.
China’s Energy Challenge
China’s science and technology priorities in the energy sector have changed over time with evolving
domestic energy needs. The decade that preceded the 12th Five-Year Plan period (2000–2010)
brought new challenges to the relationship among energy consumption, emissions, and economic
growth in China. Increasing concerns among China’s leadership about national energy security also
shape China’s domestic energy policy agenda. From 2002 to 2005, two decades of declining energy
intensity reversed, with energy growth surpassing economic growth. That reversal has had
dramatic implications for energy security and GHG emissions growth trends in China during the
latter part of the past decade. By 2007, China was the largest national emitter of CO2 in the world,
and by 2010, China became the world’s largest energy consumer and producer.
The push to develop nonfossil sources of energy is enshrined in the most recent Five-Year Plans.
The 12th FYP included a target to increase nonfossil energy sources (including hydropower,

13
nuclear energy, and renewable energy) to 11.4 percent of total energy use—up from about 8.3
percent in 2010, which was achieved and was increased to 15 percent by 2020 in the 13th FYP
(People.com.cn 2011; Seligsohn and Hsu 2016). Other relevant 13th FYP clean energy targets
include 200 gigawatts of wind power and 100 gigawatts of solar by 2020, along with the other
targets listed in table 1.1. China also has carbon-intensity targets that aim to reduce CO2 emissions
per unit of GDP. These carbon targets have been a cornerstone of the country’s climate policy and
the pledges made to the United Nations Framework Convention on Climate Change, first in
Copenhagen in 2009 and then in Paris in 2015. China’s Nationally Determined Contribution
submitted in advance of the Paris Agreement aims to reduce carbon intensity 60–65 percent from
2005 levels by 2030, to peak total CO2 emissions by around 2030, “making best efforts to peak
early,” and it extends the nonfossil energy target to 20 percent by 2030, reaching into the next two
FYP periods (NDRC 2015).
Table 1.1: Clean Energy Targets in China’s 12th and 13th Five-Year Plans
Target Type
12th FYP Target (2010–15)
Actual Level Achieved by 2015
13th FYP Target (2015–20)
Hydropower 260 GW 319 GW 350 GW
Wind power 100 GW 129 GW 200 GW
Solar power 35 GW 43 GW 100 GW (150 GW)
Nuclear 40 GW 26 GW 58 GW
Carbon intensity 17% from 2010
20% from 2010 18% from 2015
Energy intensity 16% from 2010
18.2 % from 2010 15% from 2015
Nonfossil share of primary energy
11.4% 12% 15%
Sources: Government of China 2011; National Climate Strategy Center 2014; NDRC 2014; Seligsohn and Hsu 2016; Su 2010.
Note: FYP = Five-Year Plan; GW = gigawatt.
China’s renewable energy growth over the past decade has been extremely impressive, particularly
considering many of the challenges the country faces in this sector. By 2015, China had become the
largest investor in renewable energy in the world (figure 1.1). Much of the country has mediocre
renewable energy resources, and the geographic distribution of those resources is not well matched
with the location of demand. Many of China’s renewable resources are in the northern and western
parts of the country, far from population centers. The relative remoteness actually facilitates large-
scale infrastructure development that could be difficult to get approved closer to large population
centers. This model of building capacity far from load requires large-scale transmission planning.
Development in the north and the west is in alignment with many of the country’s air pollution
control programs, which now discourage high-emitting power plants close to large urban centers in

14
eastern China. As a result, total ultra-high-voltage transmission grid capacity is projected to
increase to 200 gigawatts of electricity by 2020, or about 15 percent of current total generation
capacity (Polaris Smart Grid Online News 2013).
Figure 1.1: Annual Renewable Energy Investments by Country or Region
Source: McCrone 2016. Note: ME = Middle East; ROW = rest of world; US = United States.
China has made minimal investment in storage technologies to balance variable renewable
resources. The structure of the current electricity market offers no opportunity for arbitrage,
making it less economical to invest in storage unless some form of price flexibility is introduced in
electricity sector market reforms. Although some discussion of smart grid development in China has
taken place, this term refers to fundamental transmission networks rather than demand-side or
distributed generation models, which are commonly part of smart grid discussions in the United
States and the European Union.
Increasing shale gas expansion, as well as conventional gas use, could have both positive and
negative consequences for continued renewable energy development in China. If further
development of unconventional gas resources reduces gas prices in the Chinese market, gas could
eventually be used for electricity generation far more than it is currently. That result could be
positive for renewables, in that natural gas combined-cycle power plants can be more
complementary to variable renewable generation than are large-scale baseload coal plants.
Conversely, gas is viewed as environmentally superior to coal, even though it is a fossil fuel.
Therefore, should gas resources become more available and more economically competitive in the
near term, they could actually slow renewable energy development within China in the coming
years.
0
50
100
150
200
250
300
350
2004 2005 2006 2007 2008 2009 2010 2011 2012 2013 2014 2015
Bil
lion
Dol
lars
China ROW Europe USA ME&Africa India Brazil

15
Although renewable energy has been growing quite rapidly over the past decade in China, key
technologies are facing serious obstacles. Continued curtailment of wind and solar power and
consolidation among technology manufacturers have affected the growth of the industry. Although
widespread curtailment of wind and solar power is in part a technical issue driven by insufficient
peak capacity, distribution congestion, and transmission capacity limits, political and institutional
factors play an even larger role. Curtailment is caused by the incentive structure created by
fragmented transmission authorities and local taxation structures, as well as by the way electricity
is priced in a still predominately regulated power sector. National curtailment rates have been
increasing for the past few years, with the National Energy Administration (2016) reporting an all-
time high curtailment rate of 19 percent in the first three quarters of 2016. Despite these challenges
facing the renewables sector, growth is still impressive. The share of non-fossil energy in China’s
total capacity additions has increased every year since 2013.
The Environmental Challenge
China’s rapidly growing economy, population, and energy consumption are all threatening its
future environmental sustainability. China faces many environmental challenges, and its reliance on
coal is at the heart of most of the country’s environmental troubles. Most of China’s air pollution
emissions come from the industrial and electricity sectors, and the human health costs of China’s
air pollution are very high. Conservative estimates of illness and premature death associated with
ambient air pollution in China cost about 6.5 percent of the nation’s GDP per year (World Bank
2013).
The long-term effects of China’s transitioning to a greener growth model have been the object of
many debates in recent years. Of note have been the concerns regarding the compatibility and potential trade-offs between the two key objectives of sustaining economic growth while lowering
GHG emissions. Numerous studies have assessed the economic impacts of climate policies, often
using computable general equilibrium (CGE) models. The models’ capacity to simulate long-term
and economywide effects makes them particularly appropriate for such analysis, given the large
and growing energy needs in most economic sectors.4 The long-term predictions of different
models should not be taken at face value because they are sensitive to assumptions and input data.
Nonetheless, they can inform policy making by highlighting the channels through which various
policies might positively or negatively affect different sectors of the economy.5 Studies using CGE
models for China have generally found that price- or quantity-based policy interventions are
needed to reduce GHG emissions (see box 1.1). All else being equal, such policies result in a
negative but relatively small effect on GDP compared with a business-as-usual scenario.
The Role of Innovation for Green Growth
Since the early 2010s, green growth has become one of the main elements of the global policy
agenda. The need for a radical shift toward a greener model of development and the direction such
a shift could take were notably analyzed in several major reports by the Organization for Economic
Co-operation and Development (OECD 2011a), the United Nations Environment Program (UNEP
2011, 2015), and the World Bank (2012).6 Those reports contain some key messages: (a) current
carbon-intensive models of development are not sustainable and will have increasingly negative

16
impacts on climate change, pollution, and health, among others; (b) green growth is key to
achieving sustainable development in its social, environmental, and economic dimensions; (c) the
transition to green growth is challenging, but it also represents major opportunities; and (d)
decisive policy action adapted to local contexts is required in all countries to put them on a green
development trajectory.
Innovation, of both the frontier and catch-up types,7 has been identified as a key dimension of the
green growth agenda. The global consensus is that the green transition will not be manageable
without large-scale invention and diffusion of green technologies. For instance, following the
adoption of its green growth strategy and building on earlier work on innovation, the OECD
published a detailed complementary report on the role of innovation for green growth and how it
can be fostered (OECD 2011b).
The public sector plays an essential role in establishing a conducive environment for green
innovation. However, the combination of knowledge and environmental externalities, path
dependency from the current dominance of carbon-intensive technologies in sectors such as energy
and transport, and the high up-front capital requirements and risk level compared with traditional
sectors drives a wedge between private and social returns to investment in green technologies and
generates a financing gap. All those barriers prevent markets alone from ensuring sufficient
creation and use of clean technologies. (See, for instance, Dutz and Sharma [2012]; Popp, Newell,
and Jaffe [2010]; and World Bank [2012] for detailed discussions of market failures in green
innovation). Using a growth model with substitutable dirty and clean inputs, Acemoglu and
coauthors (2012) conclude that, without policy intervention to foster green innovation,
environmental externalities, market size effect, and the initial productivity advantage of dirty
inputs would direct innovation and production to that sector, leading to an environmental disaster.

17
Green innovation can become a new driver of growth. It can spur economic growth by (a)
enhancing productivity in traditional industries by reducing the energy use and lessening the
environmental impact; (b) expanding new green industries, such as renewable energy, clean cars,
and waste management; and (c) leapfrogging current technology to give rise to new industries. In
Box 1.1: Studies Modeling China’s Reduction of Greenhouse Gases
Hübler, Voigt, and Löschel (2014) assess the effect of an emissions trading scheme (ETS) designed to reduce China’s
emissions intensity by 45 percent by 2020—compared with 2005—and find a welfare loss of about 2 percent in
2030. The authors insist on the crucial importance of program design to reduce economic costs—for instance, linking
the Chinese ETS with the European ETS. The study also emphasizes that the ETS is likely to affect various sectors
differently. Using a computable general equilibrium (CGE) model, the China report of the Global Commission on the
Economy and Climate (GCEC 2014) finds that accelerated efforts to curb emissions through a carbon tax—the
revenue from which is used in a revenue-neutral way to offset preexisting taxes—would reduce gross domestic
product (GDP) by about 1 percent in 2030 compared with the baseline scenario.
McKibbin and coauthors (2015) use a CGE framework to model the effects on both the Chinese and global economies
of different national ETS programs compatible with the mitigation objectives set by China in its Nationally
Determined Contribution under the Paris Agreement with regard to carbon intensity and share of renewables in
primary energy. The study finds that ETS programs that sharply cut emissions to allow them to peak in 2030 would,
among other effects relative to business as usual, result in (a) a slightly reduced GDP by around 1.5 percent in 2030
and 2.5 percent in 2050, (b) a higher trade surplus and currency appreciation, (c) a small and temporary drop in
employment, (d) slower growth of real wages, and (e) a minor GDP decrease in other regions but no carbon leakage.
The models that have been discussed focus on emission curbing through price-based and quantity-based carbon
pricing instruments and seem to yield consistent predictions regarding the economic costs of mitigation. However,
they do not provide a full picture of the possible paths for a low-carbon energy transition in China. For instance, they
generally do not factor in the positive environmental benefits and related economic and social externalities from
lower emissions and pollution. Importantly for the purpose of the present study, they also do not emphasize the role
of technological progress, despite the consensus in the literature and among policy makers, including in China, that
technological change and policies to support innovation are key to reducing the economic cost of climate change
mitigation. Following a trend in the broader climate-energy-economy CGE literature, several studies have included
the role of endogenous technological change in models for China.
Wang, Wang, and Chen (2009) provide an analysis of China’s climate policy options featuring endogenous induced
technological change. The paper finds that technological change induced by research and development (R&D)
incentives can play a major role in reducing marginal abatement costs and related GDP losses from mitigation. Jin
(2012) also uses a CGE model to analyze the links between GHG emission curbing and endogenous technological
change in China. The authors find that carbon taxation is indispensable to achieving China’s climate targets, because
technological change alone would be insufficient. R&D–induced technological change is nonetheless found to play a
significant role in curbing emissions, particularly in fossil fuel–dependent sectors, such as utility electricity and
transport. Further, carbon taxation comes at the cost of economic losses that can be partly offset by induced technical
change, including innovation policies to foster green R&D (for example, subsidies and intellectual property
protection).
Sources: Conte, Andrea, Ariane Labat, Janos Varga, and Ziga Zarnic. 2010. “What Is the Growth Potential of Green Innovation? An
Assessment of EU Climate Policy Options.” Economic Paper 413, European Commission.
http://ec.europa.eu/economy_finance/publications/economic_paper/2010/pdf/ecp413_en.pdf.
Covert, Thomas, Michael Greenstone, and Christopher R. Knittel. 2016. “Will We Ever Stop Using Fossil Fuels?” Journal of Economic
Perspectives 30 (1): 117–38.

18
addition, green innovation can contribute to growth by enlarging the service sector that underpins
green development, such as contract energy management or clean public transport. Finally, green
innovation can also reduce climate-related risks and impacts, including floods, excessive
temperatures, and other extreme weather events, thus increasing environmental sustainability of
growth (World Bank 2013). The Chinese government is hopeful that green innovation will
substantially enhance growth, and this study explores that potential.
China has significant scope to expand its global market share in green industries. According to a
World Bank study on building competitive green industries, an estimated $6.4 trillion will be
invested over the next decade to develop clean technologies in the developing world alone, and
China accounts for $1.56 trillion of that total (World Bank 2014). Together with developed
countries, the investment in clean technologies is likely to exceed $10 trillion. China is interested in
securing a strong position in this burgeoning market. Its 12th Five-Year Plan identified seven
strategic industries (energy saving and environmental protection, new energy, clean-energy
vehicles, next-generation information technology, biotechnology, high-end manufacturing, and new
materials) as primary priorities for public support to position the country at the forefront of green
growth. China’s goal is for the green industries to achieve a 15 percent share of the economy by
2020, compared with 3 percent in 2010 (Stern 2010).
Government Policy Framework
Recognizing the urgent need to rein in air pollution and greenhouse gas emissions, China has
embarked on a costly program to increase the share of energy derived from renewable sources,
principally hydro, wind, and solar power. China’s economic growth since the early 1980s has been
greatly facilitated by the energy obtained from abundant supplies of fossil fuel, initially sourced
from domestic mines and oil fields and more recently supplemented by imports. Close to two-thirds
of this energy comes from burning coal.8 Although it has amply underpinned industrialization, coal
and other fossil fuels are also responsible for the steep increase in environmental pollution that is
eating into China’s economic gains and is contributing to the surge in pollution-related morbidity
and the deaths of approximately 1.6 million people each year (Rohde and Muller 2015). Moreover,
since 2006, China has emerged as the leading emitter of GHGs because it is the foremost industrial
nation, it relies on coal, its production system is energy intensive, and it has invested immensely in
transport and urban infrastructures.9 By 2012, China was the leading market for wind energy,
having installed more capacity than the United States and leading European countries; by 2015, it
had surpassed Germany as the largest producer of solar power (Myllyvirta 2016).
In December 2012, China released its first comprehensive plan to address air pollution, the 12th
Five-Year Plan on Air Pollution Prevention and Control in Key Regions (MEP/NDRD/MOF 2012).
Even stronger policy measures followed in 2013 in response to the very bad air pollution
experienced early that year. Those measures included new constraints on total national coal
consumption and banning of the construction of new coal-fired power plants in the regions with the
worst air pollution. The key challenge with environmental laws and regulations in China is their
implementation. Many environmental regulations are top-down in nature, meaning they come from

19
the central government, but their implementation must take place at the local level, where
incentives for enforcement are often weak.
Concern about climate change and China’s role is one driver of clean energy technology
development, particularly as the country expands regulation of carbon emissions. In addition to the
carbon-intensity targets mentioned, China has announced its plans to launch a national carbon
emissions trading system in 2017. Seven of China’s provinces and municipalities have already been
experimenting with pilot cap-and-trade programs to regulate CO2. However, because of the current structure of China’s electricity market, implementing any true carbon price signals is extremely
difficult. Under the current pilot system, utilities have no way to pass through the price of
complying with a carbon target because prices are fixed. So the system was designed such that the
price is artificially passed through to the end user by requiring both the utility and the end user to
acquire permits.
It is estimated that China’s future carbon market could regulate 3–4 billion metric tons of CO2 a year
by 2020, which would make it twice as large as the European Union Emissions Trading System,
with permits estimated to be worth up to 400 billion yuan (US$65 billion) (Reuters Beijing 2015).
The first stage of the national program is expected to be modest in its reduction goals while serving
as a trial period to allow covered entities to become familiar with carbon accounting and
compliance systems. By 2019, however, the program will be used to facilitate more aggressive
carbon reductions by including more companies and tightening the caps (Kai 2015).
Covering China’s power sector in a national carbon cap-and-trade program could certainly have
positive implications, not just for increasing renewable energy deployment but also for electricity
market pricing reforms, which will be required to facilitate smooth carbon price signals and
interfacility trading. Interactions between renewable energy support policies and carbon control
policies are not always smooth, as international experience has shown. As a result, this area is
certainly worthy of careful attention and strategic intervention to ensure that the transition to a
national market supports continued renewable electricity deployment.
Many Chinese government policies aim to promote growth in service industries because of their
higher value added to the economy and the potential energy saving and environmental quality
benefits associated with a shift away from heavy manufacturing. To facilitate this industrial shift,
the government explicitly identified a new set of high-value strategic industries as essential to the
future of the Chinese economy in the 12th FYP. They include the nuclear, solar, wind, and biomass
energy technology industries, as well as hybrid and electric vehicles and the energy savings and
environmental protection technology industries (Government of China 2010, 2011). These
“strategic and emerging” industries are being promoted to replace former strategic industries such
as coal and telecommunications, often referred to as China’s pillar industries, which are heavily
state owned and have long benefited from government support.
This move to rebrand China’s strategic industries likely signals the start of a new wave of industrial
policy support for the new strategic industries. Such support may include access to dedicated state
industrial funds, increased access to private capital, or industrial policy support through access to
preferential loans or R&D funds. Other targets encourage increased innovative activity, including a
target for R&D expenditure to account for 2.2 percent of GDP, and for 3.3 patents per 10,000 people.
During the 11th FYP period, an estimated 15.3 percent of government stimulus funding was

20
directed toward innovation, energy conservation, ecological improvements, and industrial
restructuring (HSBC 2010).
The Chinese government’s broader reform agenda includes large-scale restructuring of science and
technology funding, including the 863 High-Tech Research Program, which has supported
numerous renewable energy demonstration and deployment projects over the past few decades
(Larson 2014). Many of these reforms are driven by reports of inefficient allocation of R&D funds
across the country, as well as limited competition in printmaking. Additionally, in the context of a
national quest to become a more innovative society, the government is shifting science and
technology funding away from pure demonstration to include more R&D funding, including funding
for early-stage and high-risk new energy technologies. If done effectively, the net result of these
reforms could have transformative potential and could significantly increase China’s global
competitiveness in the renewable energy technology sectors.
Energy efficiency and greening starting with the 11th Five-Year Plan
Energy efficiency and the use of renewable sources to limit CO2 emissions were minor concerns as
recently as the 10th FYP. However, starting with the 11th FYP and continuing through the 13th FYP,
those concerns have acquired greater prominence (Hong et al. 2013). The 13th FYP (2016–20) calls
for a reduction in carbon intensity and energy intensity of 18 percent and 15 percent,
respectively.10 By the end of 2015, China had installed 146 gigawatts of wind power capacity, and
its solar power capacity equaled 43 gigawatts.11 During 2016, China installed 23.3 gigawatts of
wind turbine capacity, bringing the total to 169 gigawatts. An additional 34.54 gigawatts of
photovoltaic (PV) capacity was also installed (increasing the total to 77.5 gigawatts, which is
greater than the entire capacity of Switzerland’s electrical system), and employment in the
renewables sector reached 3.5 million jobs.12 China expects to increase the share of renewables in
primary energy consumption from 12 percent in 2015 to 15 percent in 2020 (Nakano and Wu
2016). To achieve these objectives, solar capacity will rise to 110 gigawatts and wind power will
reach 210 gigawatts (Spegele 2016).
These targets are ambitious. Achieving them will call for (a) massive investment in wind- and solar-
based generating capacity, (b) parallel investment in storage capacity, and (c) a smart nationwide
system of grids to fully exploit the potential of intermittent (and distributed) sources of power, its
effective transmission across the country, and its efficient use downstream. In principle, China is
well positioned to undertake green development on such a scale, having built up the manufacturing
capacity and the skills needed to construct green infrastructure in a handful of years. It is also
capable of mobilizing the necessary capital from domestic sources. However, before renewable
energy sources can compete with traditional fossil-fueled power-generating facilities, innovation
and learning must bring down costs per kilowatt-hour. Furthermore, advances in storage
technologies are needed to cope adequately with intermittency. As Dieter Helm (2016, 203) rightly
notes, “New technologies are essential to decarbonization. Yet the main characteristics of existing
carbon policies is that they devote large-scale subsidies to existing technologies and trivial amounts
to R&D. This imbalance is at best inefficient.”
China intends tackling past neglect of research on renewable technologies. Its Energy Innovation
Action Plan for 2016–30—which was released on April 18, 2016—aims to spur innovation in 15

21
areas, which include solar and wind power and storage technologies, as well as grid modernization,
energy Internet, and energy-saving techniques. Innovation that can be speedily commercialized
could tip the scales in favor of renewables, especially if it is matched by an accelerating shift to an
economy that is largely reliant on electricity.
It is impossible to overemphasize the importance of innovation in multiple areas to pave the way
for the greening of economic growth. For example, if electric vehicles (EVs) are to reduce carbon
emissions, then the electricity fueling them must come from generating facilities that produce low or no emissions. For EVs to compete with gasoline-powered vehicles on the basis of discounted cost
of operation truly dramatic improvements in battery technology are necessary to bring these
technologies into cost parity” (Covert, Greenstone, and Knittel 2016, 131). Battery costs for EVs
were in the region of $325 per kilowatt-hour in 2014–15. They would need to fall steeply for EVs to
compete with gasoline if oil prices continue to hover around $50 per barrel, which is likely if
producers ramp up the production of what might become a stranded asset. Nykvist and Nilsson
(2015)13 project battery costs leveling out somewhere between $150 and $300 per kilowatt-hour.
Were they to drop as low as $125 per kilowatt-hour as projected by the U.S. Department of Energy,
EVs could compete only if oil prices were to rise to $125 per barrel.14 However, with oil selling at
$55 per barrel, battery costs would need to settle at just $64 per kilowatt-hour before EVs could be
competitive (Covert, Greenstone, and Knittel 2016).15
The multiplier effects of increased consumption and investment spending will drive growth.16
Moreover, a smarter urban economy relying on a cleaner, more efficient power source should
benefit from higher rates of productivity. Needless to say, all of this assumes a steady pace of
innovation that increases the penetration of electricity and also of innovation that lowers the cost of
generating electricity from renewable sources, storing it as needed, and transmitting it via a smart
grid.
This context on China’s unique energy and environmental challenges helps to clarify the types of
policies and regulatory frameworks needed to spur greater green innovation. The next chapter
takes a closer look at the policies used to promote renewable energy, how China’s policy framework
compares to other countries, and how innovation there stacks up globally.

22
2. Regulatory and Policy Frameworks for Renewable Energy in
China
The chapter takes a closer look at the policies used to promote renewable energy in China; how China’s
policy framework compares to other countries, and how innovation in China stacks up globally. Now a
US$244 billion industry globally, renewable energy has been identified as a strategic industry for
promoting economic development in many countries around the world. Yet even with rapidly declining
costs, renewables often cannot compete with fossil fuels. This chapter explores the rationale for
supporting renewable energy and the types of policy mechanisms used by different countries,
depending on their status as a first mover or latecomer in the wind and solar power technology
industries.
Policy Rationale for Promoting Renewable Energy Governments around the world have prioritized the development of renewable energy technologies with a range of policies and incentives. Policy tools can be used to adjust relative prices to encourage the adoption of alternative energy technologies through subsidies or other forms of public support. To garner such public support, however, supporters of renewable energy, carbon mitigation, and improvements to local air pollution increasingly are directly linking the political rationale for those policies to the economic rationale, namely job creation and technological leadership. Although the carbon mitigation benefits of renewable energy may be global, economic development impacts are a benefit of renewable energy use that can be captured locally, and they are therefore extremely important to local and national governments. The recent global economic slowdown has made it even more difficult than before for governments to justify extending the costs associated with renewable energy to ratepayers unless governments can also make the case for other direct economic benefits from promoting renewables, such as job creation and long-term economic competitiveness (Lewis 2014).
Deployment Policies
The countries that were among the first to pursue the large-scale deployment of wind and solar
power technologies have used a variety of policies that target expanded deployment through
subsidies or other market interventions. Although the specific measures being implemented in any
domestic context may change from year to year, the types of support mechanisms that most
countries have relied on to support this industry have remained relatively constant over time. Such
policies are implemented at various levels of government, including the central and subnational
levels.
The current version of the International Energy Agency (IEA) and the International Renewable
Energy Agency’s (IRENA) Database of Global Renewable Energy Policies and Measures divides the
most commonly used renewable energy policy tools into six broad categories: (a) economic
instruments; (b) information and education; (c) policy support; (d) regulatory instruments; (e)
research, development, and deployment; and (f) voluntary approaches. The subcategories of
policies that fall under each heading are listed in table 2.1

23
Table 2.1: Types of Policy Instruments Used to Support Renewable Energy Deployment
Policy Instrument type Specific instrument
Economic instruments Direct investment Funds to subnational
governments
Infrastructure investments
Procurement rules
RD&D funding
Fiscal/financial incentives Feed-in tariffs or premiums
Grants and subsidies
Loans
Tax relief
Taxes
User charges
Market-based instruments Greenhouse gas emissions
allowances
Green certificates
White certificates
Information and education Advice or aid in implementation
Information provision
Performance label Comparison label
Endorsement label
Professional training and qualification
Policy support Institutional creation
Strategic planning
Regulatory instruments Auditing
Codes and standards Building codes and standards
Product standards
Sectoral standards
Vehicle fuel-economy and

24
emissions standards
Monitoring
Obligation schemes
Other mandatory requirements
Research, development, and
deployment (RD&D)
Demonstration project
Research program Technology deployment and
diffusion
Technology development
Voluntary approaches Negotiated agreements (public-private sector)
Public voluntary schemes
Unilateral commitments (private sector)
Source: Based on IEA/IRENA 2016.
Fiscal and financial incentives are among the most popular and most effective ways to promote
wind and solar power development. A feed-in tariff provides a fixed price for power generated from
a renewable energy source over a set time period (often 20 years). The payment is usually
administered by the utility company or the grid operator and is derived from an additional per-
kilowatt-hour charge for electricity. By 2016, 56 counties had implemented feed-in tariffs
(IEA/IRENA 2016). Another popular incentive is a renewable portfolio standard (RPS), also
referred to as a renewable purchase obligation (RPO) or renewable energy quota. Currently, the
Islamic Republic of Iran, Chile, Poland, Spain, the United Kingdom, and 29 U.S. states have
renewable energy obligations in place (IEA/IRENA 2016; Durkay 2016).
Industrial Policies
Countries that were not part of the group of early wind and solar technology innovators have
commonly used different strategies to protect their industries against competition from industry
leaders and to foster the development of their own industries. However, even countries with
established technology industries still use industrial policy to give domestic manufacturers an edge
against foreign competition.
Even traditional subsidy policies may have an industrial policy element. For example, a country
may adopt a national subsidy policy—such as a feed-in tariff or a tender program with a local
content requirement—that is designed to promote local industry growth. Local content
requirements (LCR) aim to encourage local over imported renewable energy technologies. Policies
that encourage domestic manufacturing and technology transfers may create a particular problem
with respect to international trade law that explicitly prohibits differential support to domestic
over foreign technology.
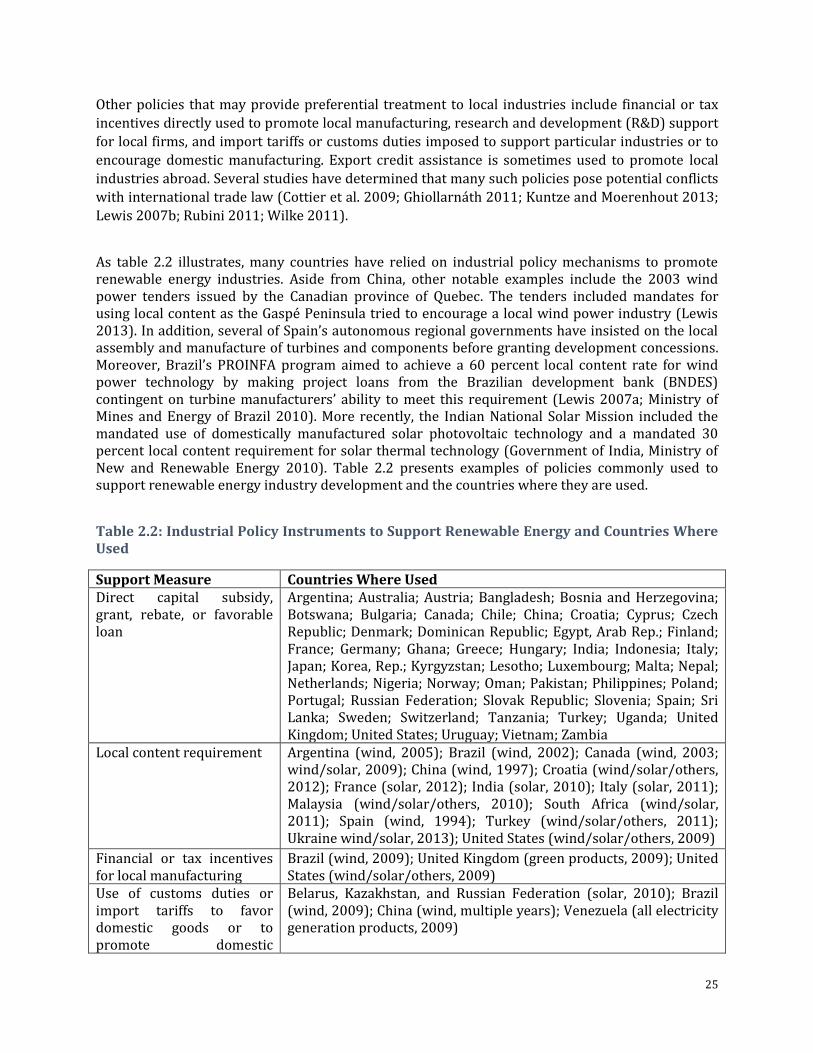
25
Other policies that may provide preferential treatment to local industries include financial or tax
incentives directly used to promote local manufacturing, research and development (R&D) support
for local firms, and import tariffs or customs duties imposed to support particular industries or to
encourage domestic manufacturing. Export credit assistance is sometimes used to promote local
industries abroad. Several studies have determined that many such policies pose potential conflicts
with international trade law (Cottier et al. 2009; Ghiollarnáth 2011; Kuntze and Moerenhout 2013;
Lewis 2007b; Rubini 2011; Wilke 2011).
As table 2.2 illustrates, many countries have relied on industrial policy mechanisms to promote renewable energy industries. Aside from China, other notable examples include the 2003 wind power tenders issued by the Canadian province of Quebec. The tenders included mandates for using local content as the Gaspé Peninsula tried to encourage a local wind power industry (Lewis 2013). In addition, several of Spain’s autonomous regional governments have insisted on the local assembly and manufacture of turbines and components before granting development concessions. Moreover, Brazil’s PROINFA program aimed to achieve a 60 percent local content rate for wind power technology by making project loans from the Brazilian development bank (BNDES) contingent on turbine manufacturers’ ability to meet this requirement (Lewis 2007a; Ministry of Mines and Energy of Brazil 2010). More recently, the Indian National Solar Mission included the mandated use of domestically manufactured solar photovoltaic technology and a mandated 30 percent local content requirement for solar thermal technology (Government of India, Ministry of New and Renewable Energy 2010). Table 2.2 presents examples of policies commonly used to support renewable energy industry development and the countries where they are used.
Table 2.2: Industrial Policy Instruments to Support Renewable Energy and Countries Where Used
Support Measure Countries Where Used Direct capital subsidy, grant, rebate, or favorable loan
Argentina; Australia; Austria; Bangladesh; Bosnia and Herzegovina; Botswana; Bulgaria; Canada; Chile; China; Croatia; Cyprus; Czech Republic; Denmark; Dominican Republic; Egypt, Arab Rep.; Finland; France; Germany; Ghana; Greece; Hungary; India; Indonesia; Italy; Japan; Korea, Rep.; Kyrgyzstan; Lesotho; Luxembourg; Malta; Nepal; Netherlands; Nigeria; Norway; Oman; Pakistan; Philippines; Poland; Portugal; Russian Federation; Slovak Republic; Slovenia; Spain; Sri Lanka; Sweden; Switzerland; Tanzania; Turkey; Uganda; United Kingdom; United States; Uruguay; Vietnam; Zambia
Local content requirement Argentina (wind, 2005); Brazil (wind, 2002); Canada (wind, 2003; wind/solar, 2009); China (wind, 1997); Croatia (wind/solar/others, 2012); France (solar, 2012); India (solar, 2010); Italy (solar, 2011); Malaysia (wind/solar/others, 2010); South Africa (wind/solar, 2011); Spain (wind, 1994); Turkey (wind/solar/others, 2011); Ukraine wind/solar, 2013); United States (wind/solar/others, 2009)
Financial or tax incentives for local manufacturing
Brazil (wind, 2009); United Kingdom (green products, 2009); United States (wind/solar/others, 2009)
Use of customs duties or import tariffs to favor domestic goods or to promote domestic
Belarus, Kazakhstan, and Russian Federation (solar, 2010); Brazil (wind, 2009); China (wind, multiple years); Venezuela (all electricity generation products, 2009)

26
manufacturing
Export credit assistance Denmark (wind, various years); United States (green products to Korea Rep., 2009; renewable energy to Abu Dhabi, 2013; others); Organisation for Economic Co-operation and Development (All renewable energy, 2012)
Research, development and demonstration support exclusively for domestic companies
China (wind, solar, various years); Denmark (wind, various years); Germany (wind, solar, various years); United States (solar, offshore wind; 2011/2013)
Source: Modified from Lewis 2014.
Where Does China Stand Globally in Regulatory Framework for Renewable
Energy?
Primary legislation providing a clear and well-designed legal framework for renewable energy is a
fundamental signal of a government’s commitment to harnessing its renewable resources.
Importantly, such a framework provides legally binding authorization to develop the sector and
often provides guidance on how such development will be undertaken and the steps the
government will take to support that development. The legal framework can be part of a broader
energy or power sector law or a stand-alone measure, but it must enshrine the vision for renewable
energy and allow public institutions and private actors to understand their roles.
The new World Bank report titled Regulatory Indicators for Sustainable Energy (RISE) (2017)
assesses government support for sustainable energy investments required to achieve sustainable
energy for all goals in renewable energy, energy efficiency, and energy access in 111 countries. RISE designed a set of indicators to help compare national policy and regulatory frameworks for
sustainable energy. This set provides a reference point to help policy makers benchmark their
sector policy and regulatory framework against those of regional and global peers, and it can be a
powerful tool to help develop policies and regulations that advance sustainable energy goals.
Each indicator targets an element of the policy or regulatory regime important to mobilizing
investment. Examples include establishing planning processes and institutions, introducing
dedicated incentives or support programs, and ensuring financially sound utilities. China has been
identified as the regional and global leader in renewable energy regulatory policy. When RISE
methodology is applied, China ranks no. 22 among 111 surveyed countries, no. 1 in East Asia and
Pacific, and no. 3 in upper-middle income countries.
Private ownership refers to any arrangement in which a private operator retains revenue from
power sales, such as build-own-operate or build-own-operate-transfer arrangements. It does not
refer to private participation limited to project operation, such as engineering, procurement, and construction, or management contracts. Ideally, the private sector’s right to own and operate plants
should be stated explicitly in the primary legislation, thereby communicating to private developers
their expected role in the sector, minimizing regulatory risk, and ultimately reducing financing
costs. But other instruments that demonstrate equivalent de facto legal approval, such as

27
regulations or permits designed specifically for private projects, also can provide potential
investors with sufficient certainty to proceed.
Setting a concrete renewable energy target and communicating that target publicly will signal to
the public and potential investors that the government is committed to developing renewable
energy that will support critical developmental objectives, including energy security, energy access,
environmental sustainability, and economic development.
A target itself, however, typically is not enough, because even the most ambitious goals have little
meaning without a realistic plan for implementation or at least a clear understanding of what needs
to be done. Thus, it is more desirable that the government communicate how the target will be
met—for example, through a strategy or action plan—so it can define the required investment to
meet the target; and to track progress toward the target.
China has invested more in renewable energy than has any other country in the world. During 2010
to 2015, investment (including solar, wind, geothermal, small hydro, and biomass) reached US$377
billion (Bloomberg New Energy Finance), more than the next two countries combined: the United
States and Germany. China has the second-largest economy in the world, with dramatically
expanding power demand that creates opportunities for new generation. A large and skilled labor
force and supply chain allow cost-effective wind turbines or solar plants to be built locally. The
government also has taken steps to mobilize private investment across the economy.
Some elements of the policy framework might, if strengthened, lead to even greater use of the
country’s renewable energy resources. Many renewable energy projects have seen lower revenues
than expected because of widespread generation curtailment. Because China does not transparently
integrate renewable energy into its generation and transmission planning, the network
infrastructure is not always adequate to offtake power from renewable energy projects.
China’s performance in renewable energy is well above the world average. However, indicators for
planning and incentives are relatively weak in China (see figure 2.1). Those two indicators include
questions about transmission planning and compensation for curtailment, respectively. This
weakness explains China’s serious curtailment problem in the past few years.
Figure 2.1: China’s Renewable Energy Policy Framework in Comparison to Global Average
Source: RISE, World Bank, 2017.

28
Best Practices in Promoting Renewable Energy Deployment and Technology
Innovation
Best practices in supporting innovation in clean energy technology at various stages of
development have been identified in studies such as the Global Energy Assessment led by the
International Institute for Applied Systems Analysis (IIASA). The institute’s recommendations are
technology specific, with extensive focus on wind power technology. The study identifies three
innovation stages and corresponding innovation strategies. The stages began with (a) the early
technology experimentation in the 1970s–1980s in countries including Denmark, Germany, Great
Britain, the Netherlands, Sweden, and the United States; continued with (b) the first large-scale
markets, which took off in the 1990s primarily on the basis of the successful Danish innovation path
of the 1980s; and developed to (c) the emerging markets that entered the industry in the 1990s and
2000s, such as China, India, and the Republic of Korea. The study identifies common key elements
in governmental policy strategies in each of the three periods that were essential for a sustainable
and successful innovation process in different countries, as described in the following discussion
(Grubler et al. 2012). Although their findings were specific to wind energy, some commonalities can
be applied to all technologies.
Supporting Early-Stage Technologies
In the early stage of technology development, policy makers must support a diverse set of actors
and inventions and not “pick winners” for assistance, which is to the detriment of supporting a wide
range of technology options. Policy makers are often not able to foresee the drivers and trends of
any given technology at an early stage of market development. In addition, although support in
research, development, and demonstration is necessary, government support alone is not sufficient,
particularly if the innovation process is not a linear one (Grubler et al. 2012).
Supporting Advanced Innovation
Once innovations move into a more advanced stage, support is vital not just for R&D but also for the
development of learning networks that facilitate interaction and knowledge exchange. Although
such knowledge transfer often happens informally, for example in the case of the Chinese wind
industry (Lewis 2013), other times governments play a concerted role to establish such networks
or hubs for innovation with different design characteristics in different places (Grubler et al. 2012).
Supporting the development of a wide range of actors and institutions that can, in turn, support the
overall technology industry is also particularly important at this stage, often referred to as the
national innovation system (Freeman 1995; Connor 2003).
Another important element at this stage is a means to conduct quality testing, for example
technology certification. Certification by a trusted, independent authority can be very important to
give certainty to early-stage investors about technology quality (Grubler et al. 2012). It should be
noted, however, that certification processes might be political in their own right and could lead to

29
protectionism. For example, if a certification by a foreign entity is not recognized in a certain
country and instead a technology manufacturer has to undergo another certification process, this
inconvenience can be a barrier to market entry. Likewise, expensive international certifications can
sometimes be cost prohibitive for innovators in developing countries.
Supporting Large-Scale Commercialization and Deployment
At this stage, deployment policy is key. Even more important than the type of the incentive is its
duration and its consistency. Many studies have shown that policy support needs to be stable and
continuous in order to create sufficient market demand over a long enough investment horizon so
the support manufacturing scale can be established.
In the wind industry, a clear relationship exists between a manufacturer’s success in its home
country market and its eventual success in the global wind power market, and the success in the
home market is driven by the annual size and stability of that market. As a result, policies that
support a sizable, stable market for wind power—in conjunction with policies that specifically
provided incentives for wind power technology to be manufactured locally—were most likely to
result in the establishment of an internationally competitive wind industry (Lewis and Wiser 2007).
Studies have found many examples of places where local success was not cultivated well and where
renewable energy technology industries suffered. For example, Brazil has been trying to encourage
the development of a local wind industry for a long time without success, despite significant
subsidies. Local content requirements were so stringent that they restricted access to favorable
loans that were intended to help the industry (Nielsen 2013). The on-again, off-again nature of the
U.S. Production Tax Credit has caused great instability in the U.S. wind industry, as well as being a
factor in many early bankruptcies, but the size of the U.S. market has kept manufacturers involved.
The instability of the U.S. wind power market that has been caused by policy uncertainty is
illustrated in figure 2.2.
Supporting Renewable Energy in China
China’s promotion of renewable energy was kick-started with the passage of the Renewable Energy
Law of the People’s Republic of China that became effective on January 1, 2006 (National People’s
Congress 2005). The law created a framework for regulating renewable energy and was hailed at
the time as a breakthrough in the development of renewable energy in China. It created four
mechanisms to promote the growth of China’s renewable energy supply: (a) a national renewable
energy target, (b) a mandatory connection and purchase policy, (c) a feed-in tariff system, and (d) a
cost-sharing mechanism, including a special fund for renewable energy development (Schuman
2010).
Several additional regulations were issued to implement the goals of the Renewable Energy Law,
including pricing measures that established a surcharge on electricity rates to help pay for the cost
of renewable electricity, plus revenue allocation measures to help equalize the costs of generating
renewable electricity among provinces. In December 2009, amendments to the Renewable Energy
Law were passed, further strengthening the process through which renewable electricity projects
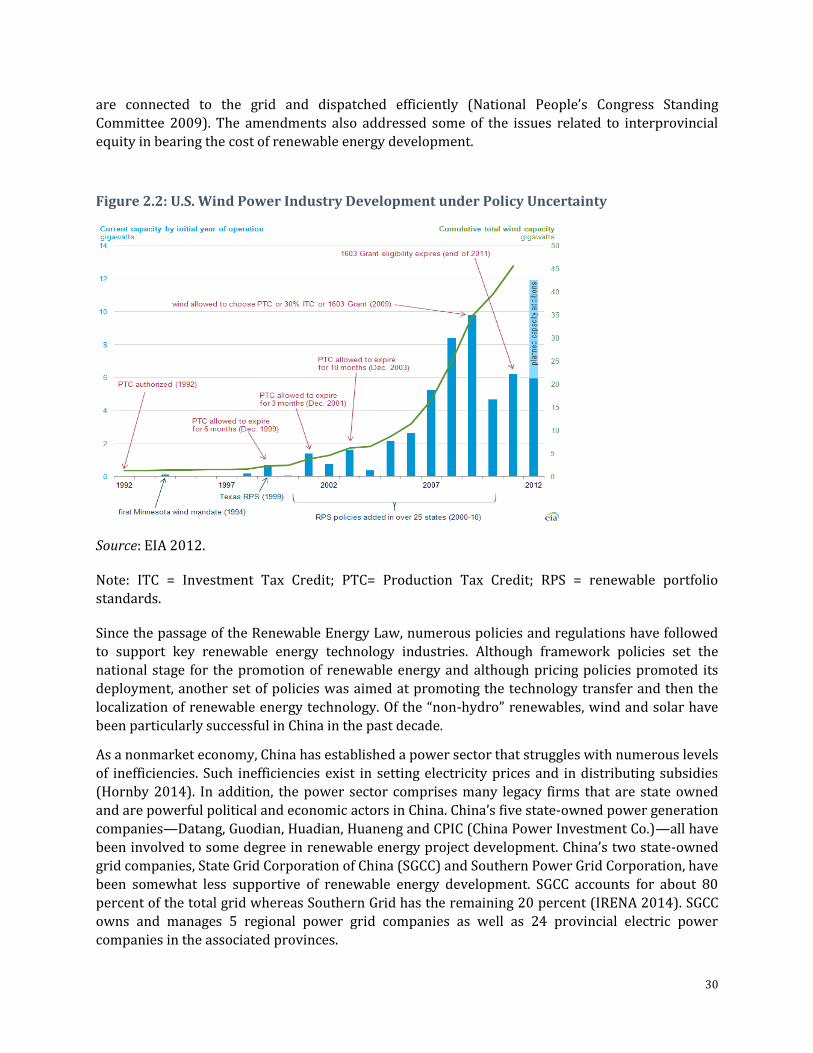
30
are connected to the grid and dispatched efficiently (National People’s Congress Standing
Committee 2009). The amendments also addressed some of the issues related to interprovincial
equity in bearing the cost of renewable energy development.
Figure 2.2: U.S. Wind Power Industry Development under Policy Uncertainty
Source: EIA 2012.
Note: ITC = Investment Tax Credit; PTC= Production Tax Credit; RPS = renewable portfolio
standards.
Since the passage of the Renewable Energy Law, numerous policies and regulations have followed
to support key renewable energy technology industries. Although framework policies set the
national stage for the promotion of renewable energy and although pricing policies promoted its
deployment, another set of policies was aimed at promoting the technology transfer and then the
localization of renewable energy technology. Of the “non-hydro” renewables, wind and solar have
been particularly successful in China in the past decade.
As a nonmarket economy, China has established a power sector that struggles with numerous levels
of inefficiencies. Such inefficiencies exist in setting electricity prices and in distributing subsidies
(Hornby 2014). In addition, the power sector comprises many legacy firms that are state owned
and are powerful political and economic actors in China. China’s five state-owned power generation
companies—Datang, Guodian, Huadian, Huaneng and CPIC (China Power Investment Co.)—all have
been involved to some degree in renewable energy project development. China’s two state-owned
grid companies, State Grid Corporation of China (SGCC) and Southern Power Grid Corporation, have
been somewhat less supportive of renewable energy development. SGCC accounts for about 80
percent of the total grid whereas Southern Grid has the remaining 20 percent (IRENA 2014). SGCC
owns and manages 5 regional power grid companies as well as 24 provincial electric power
companies in the associated provinces.

31
Southern Grid’s coverage area is smaller than SGCC’s (it includes just five provinces). Its location in
the south spans a powerful economic center and is far from Beijing. Thus the company is a
somewhat more constructive actor in new and renewable energy technology development. In
addition, China’s southern provinces have a more diverse power supply that includes hydropower
and nuclear power and that contrasts with China’s northern provinces, which are more heavily
reliant on coal. Hence, Southern Grid possesses somewhat more technical flexibility in integrating
renewable resources.
The Energy Technology Revolution Innovation Action Plan (2016–30) (“Energy Technology
Innovation Plan”) is a long-term planning document issued by the National Development and
Reform Commission (NDRC) and the National Energy Administration (NEA) in early 2016. The
Energy Technology Innovation Plan is meant to cover a 15-year time period that spans from 2016
to 2030, well beyond the 13th five-year-plan period. Overall, the Energy Technology Innovation
Plan is structured to include (a) an overview of the energy technology development trends, (b)
guiding principles, (c) priority work, (d) policy mechanisms, and (e) an implementation institution.
The plan states that China shall approach the energy revolution on the basis of the strategic needs
of China, which include solutions and technological support for energy security, socioeconomic
development, structural transformation, climate change, and environmental qualities. The effort
translates into providing suitable technology for energy security, clean energy, low-carbon
development, smart energy, and advanced materials and equipment.
The Energy Technology Innovation Plan sets out long-term development objectives and the
associated timeline. By 2020, China shall have greatly improved its autonomous innovation
abilities; realized important breakthroughs in key technology; reduced external reliance for key
equipment, parts, and materials; achieved an obvious increase in competitiveness in energy
industry; and created a preliminary system for energy technology innovation. By 2030, China shall
have developed an energy technology innovation system appropriate for China’s context, with
comprehensive improvements in autonomous innovation abilities. The country’s overall energy
technology level shall reach the top international level to support China’s energy sector
development as well as China’s sustainable development, with China emerging as a major
international power for energy technology.
Supporting Indigenous Innovation through Technological Catch-Up
Indigenous innovation is a term China uses to describe its own strategy for technological self-
reliance. As described in China’s Medium- and Long-Term Development Plan for Science and
Technology (MLP), “Indigenous innovation refers to enhancing original innovation, integrated
innovation, and re-innovation based on assimilation and absorption of imported technology, in
order to improve our national innovation capability” (State Council of the PRC 2006). Although it
does not restrict foreign involvement in the innovation process, China’s MLP emphasizes domestic
inputs to the R&D process as well as on developing locally owned intellectual property (Ernst and
Naughton 2012).
The policy stemmed from experience with international technology transfer in the prior decades,
when China learned that developed countries were often unwilling to transfer core technologies to
China, for a variety of reasons. However, alongside this push for indigenous innovation, Chinese
firms have also become globalized, and Chinese technology multinationals are conducting R&D

32
around the world. As a result, researchers have pointed out that a turn toward indigenous
innovation represents a rejection of the globalized technology development path and the belief that
only domestic efforts can lead to the development of core technologies, even if this shift risks
weakening international links (Ernst and Naughton 2012).
Since the move toward indigenous innovation a decade ago, more recent reforms have targeted the
way innovation support is funded in China. Major changes have been implemented at the Chinese
Ministry of Science and Technology (MOST) and the Chinese Academy of Sciences (CAS), in part
because of reports of widespread corruption. An increased role is being played by institutions, such
as the National Natural Science Foundation of China, which are viewed as more independent (NSF
Beijing Office 2016).
In periodic science and technology (S&T) plans, as well as the five-year plans, the Chinese government has identified several renewable energy industries as strategic national priorities for S&T investment, and it has established a constant and increasing stream of government support for R&D and technology demonstration. Other forms of industry support have been given through more informal channels, such as low-interest loans or other favorable loan terms given by central and local governments and state-controlled banks, low-cost land grants, or expedited permitting (Lewis 2014). China’s policies to promote renewable energy have always included mandates and incentives to support the development of domestic technologies and industries.
Inefficiencies in the Policy Framework
Policy making that affects the renewable energy sector in China is often inefficient because of
overlapping ministerial responsibilities and interagency tensions.17 Numerous government
ministries (NDRC, NEA) have a stake in renewable energy policy making as well as in technology
development and innovation support (MOST), industry regulation (MIIT), project financing (MOF,
Central Bank), and trade (MOFCOM). Specific types of renewable energy technologies involve
specialized ministries, including the State Oceanic Administration in the case of offshore wind and
the Ministry of Housing and Urban-Rural Development in the case of building integrated
photovoltaic systems. In particular, often interaction and coordination are insufficient between
ministries that have key roles in supporting the renewable energy sector. For example, although
MOST supports much of the innovation support for project demonstrations, there is little
coordination with NDRC on broader pricing strategy, or with MIIT regarding regulations that
directly affect industry competition. There is no one unifying technology roadmap strategy that
would require interventions from multiple agencies at different points along the technology
development continuum.
One key challenge to renewable energy integration in China is the lack of an interconnected
national power grid. China’s power system consists of six regional grids with weak
interconnections. Although there is some trading across regions, the grid is not well designed for
cross-regional balancing. Also relevant when looking at the potential for renewable energy
development on the current grid is the extent to which excess installed capacity is in place. For
example, northeastern China’s installed capacity is over double its peak load. In contrast, northern
China, including western Inner Mongolia, possesses an installed capacity that is much closer to its
peak load, as are central and eastern China’s installed capacity (IRENA 2014).

33
The design of China’s power markets makes it very difficult for renewable energy to compete.
Thermal power plants are assigned a set number of full load hours every year, and interprovincial
trading volumes are decided usually as much as a year in advance. Although some financial
incentives maximize local production, the variability of renewable sources such as wind power
interferes with the long-standing practice of allocating full load hours and trading far in advance.
Innovation in China’s Renewables Sector
Although Chinese firms are playing increasingly significant roles in renewable energy markets
around the world, many have questioned how innovative these firms are, or whether they care
about contributing to the global knowledge base in these technologies, creating knowledge that is
spread to other countries. Part of the challenge in answering this question stems from the fact that it is difficult to measure innovative activity in nonmarket and emerging economies.
The dominant model of innovation indicators is based on a linear model of innovation and includes
such factors as R&D expenditures, human resources qualification, and patents. These indicators are
not as effective at measuring what actually happens between the inputs to innovation (like R&D)
and the outputs of innovation (like patents), and therefore they arguably provide only a partial
view of innovation. That may be especially prejudicial for firms in emerging economies, where
fewer financial resources are available for everything from patent registration and maintenance to
R&D support (Marins 2008).
As a result, taking a more comprehensive approach to measuring innovation may be more suitable
for a context such as China. That approach would include measuring progress in innovation in
relation to higher-performing technology or measuring cutting-edge innovations in a specific sector
against a global benchmark. Examples include overall efficiency, size, or other performance metrics.
In addition, royalty payments can serve as a reflection of innovative activity versus reliance on
foreign technology and capacity, complemented by information on technology licenses and other
arrangements.
A deeper exploration of the dynamics of innovation in the solar, wind, and stationary storage
sectors in China starts with understanding how innovation is measured in a comparative way
between countries. Innovation is influenced by a variety of factors; some are more tangible and
measurable (for example, basic R&D or patent filing), and others are subtle and difficult to quantify
(for example, entrepreneurial support or cultural appetite for risk). Global indexes are useful at
unifying these diverse factors into a comprehensive framework that can be applied consistently to a
wide range of countries. Thus, a good starting point for understanding green innovation in the
Chinese market is two relevant indexes: the Global Innovation Index (GII) and the Global Cleantech
Innovation Index (GCII).18
The structure and methodological approach of the GII and GCII are generally quite similar, with a
few distinguishing characteristics. Both indexes reference primarily external, third-party indicators
to serve as the measurement for the key topics they cover. Both indexes approach the innovation
topic through two areas: (a) inputs to innovation, referring to the strength of the overall conditions
in a market that are necessary to “enable” innovation; and (b) outputs of innovation, referring to
evidence that innovation is in fact occurring in a given market. Examples of inputs to innovation
include the strength of the domestic business environment and infrastructure, the educational

34
system, and market characteristics like access to credit or investment. Examples of outputs of
innovation include early-stage private investment, knowledge creation, and creative goods and
services.
Although sharing similar methodological approaches, the GII and GCII differ in their respective
focus on green industries and innovation within them. The GII is the leading global index measuring
a country’s overall capacity for innovation and knowledge creation and does not have a sector
focus. So although the GII includes Ecological Sustainability as a factor defining the strength of a country’s infrastructure to enable innovation, it is useful for obtaining a general perspective on the
extent to which different countries provide enabling conditions for innovation and evidence that it
is actually occurring. The GCII, instead, looks specifically at clean technology and references
indicators to define both the inputs and outputs of innovation that relate more directly to green
sectors. Put in more practical terms, the GII might look at total R&D spending or patents filed,
whereas the GCII looks more narrowly at R&D spending targeting clean technology or green
patents filed.
The following sections present the most recent results for China on these two indexes relative to
the results for five peer countries: the United States, the United Kingdom, Germany, Japan, and
Denmark. Those peer countries were selected because they are have demonstrated success at
promoting both general and green innovation. Those countries will also be referenced later on in
the context of analyzing the dynamics of innovation in the solar, wind, and stationary energy
storage sectors in China. The following pages include a summary table presenting the country rank
and the positive and negative factors driving the result on each index, the indicators included in
each index, and a summary of China’s results.
Global Innovation Index
China ranked 25th in the latest 2016 edition of the GII, the top-performing middle-income country
(table and figure 2.3). All of the countries ranked higher than China are high-income countries with
an established history of domestic innovation and a high ranking on the GII (this includes Hong
Kong, SAR, China, which the GII categorizes as a country and ranks 14th). The GII authors highlight
that the top-performing countries tend to have a well-calibrated balance between government
policy interventions to promote innovation and a more organic, bottom-up culture of innovation
that naturally persists and builds on itself. China finds itself in a delicate position in this respect: it
is a middle-income nation rapidly scaling up R&D funding and policies to support innovation while
simultaneously not wanting to “pick winners” in new sectors, effectively continuing the model of
state-owned enterprises already established there.
Table 2.3 Global Innovation Index (GII)
Country
Overall rank
(128 total)
Factor (+)
Factor (−)
China 25th Knowledge and technology
outputs (6th) Institutions (79th)
United States 4th Market sophistication (1st) Institutions (17th)

35
United Kingdom 3rd Creative outputs (3rd) Business sophistication
(14th)
Germany 10th Creative outputs (7th) Infrastructure (22nd)
Japan 16th Infrastructure (7th) Creative outputs (36th)
Denmark 8th Human capital and research
(4th) Infrastructure (21st)
Note: The Global Innovation Index is defined by 82 indicators across the seven main categories listed. The full 2016 report can be obtained at https://www.globalinnovationindex.org/gii-2016-report.
Figure 2.3 Global Innovation Index and its Sub-indices
Note: ICT = information and communication technology.
The following are key takeaways from the GII for China:
• Of the seven main factors defining the GII, China’s strongest result is on Knowledge &
Technology Outputs (Innovation Output) where it ranks 6th of the 128 countries covered.
This positive result is driven by very high scores in Patents by Origin per billion $PPP
[public-private partnership] GDP, Utility Models by Origin per billion $PPP GDP,19 and high-
tech exports less re-exports. Yet amid these positive results, China also performed poorly in
other areas of Knowledge and Technology Outputs, mostly notably Intellectual Property

36
Receipts per percentage of total trade (72nd), ICT [information and communication
technology] Services Exports per percentage of total trade (85th), and FDI [foreign direct
investment] Net Outflows per percentage of GDP (36th). This divergence suggests that
although China’s high-tech export markets and new patent volumes are quite strong, they
still have room to grow with regard to embedding native intellectual property and ICT
services in these exports.
• Of the seven main factors defining the GII, China’s weakest result is on Institutions
(Innovation Input), in which it ranks 79th of the 128 countries covered. Low scores across
the Political, Regulatory, and Business Environment subcomponents drive this negative
result. China scores particularly poorly on the Cost of Redundancy Dismissal, Salary Weeks
(107th), and Ease of Starting a Business (103rd). This uniform weakness across institutions
suggests that according to the GII framework, one principal pathway for fostering
innovation in China is fine-tuning the overarching political, regulatory, and business
environments that entrepreneurs must interact with there.
• In a similar vein, China could improve in multiple areas in Market Sophistication
(Innovation Input) and in the process better facilitate the conditions for innovation.
Although the United States scores 1st in Market Sophistication, China ranks 21st and would
be much lower were it not for the sheer size of the Chinese market, which drives up its
results around Total Value of Stocks Traded per percentage of GDP (1st) and Domestic
Market Scale per billion PPP$ (1st). In other areas highly relevant to entrepreneurs and
innovators—including Ease of Getting Credit (69th) and Ease of Protecting Minority
Investors (104th)—China’s very low scores imply another area in which the underlying
enabling conditions for innovation could be improved.
• Just as in Knowledge and Technology Outputs, China performs well in Business
Sophistication (Innovation Input), in which it ranks 7th overall of the 128 countries
evaluated. But the three subcomponents that define this factor—Knowledge Workers,
Innovation Linkages, and Knowledge Absorption—reveal another case of strikingly
divergent results. Although China ranks 1st globally for Knowledge Workers and a
respectable 14th for Knowledge Absorption, it ranks a concerning 67th for Innovation
Linkages. The reason is that China scores quite low on University/Industry Research
Collaboration (31st), State of Cluster Development (23rd), GERD [gross domestic
expenditure for R&D] Financed by Abroad by percentage (90th), and JV [joint venture]
Strategic Alliance Deals per billion $PPP GDP (49th). These results suggest that innovation
links through public-private partnerships and clusters should be nurtured in the future as
another approach for promoting broader market innovation in China.
• Quality is an element of innovation that is as important as quantity. The GII measures the
quality of innovation through factors such as (a) quality of local universities, (b)
internationalization of local inventions, and (c) the number of citations that local research
documents receive abroad. Although the United States, Japan, the United Kingdom, and

37
Germany remain the top-ranked countries in this regard, China tops middle-income
countries in the quality of local universities and number of citations. So although China
exhibits weakness on the political, regulatory, and business environment factors defining
institutions in the GII, it exhibits strength in other types of institutions like universities that
are critical to fostering innovation.
Global Cleantech Innovation Index
China ranked 19th in the latest 2014 edition of the GCII covering 40 countries, again the top-
performing middle-income nation (table and figure 2.4). As in the GII, all of the countries ranked
above China are high-income countries with an established history of domestic innovation and
often a consistent policy commitment to green growth. Israel, Finland, Sweden, and Denmark all
rank in the top five of the GCII along with the United States, demonstrating how a large domestic
market is not a precondition for embedding green innovation in a given country. These smaller
markets outperform their GII results because they have made green innovation a strategic priority,
resulting in disproportionately high levels of early-stage investment, high-impact companies, and
environmental patents relative to the overall size of their economies.
Table 2.4: Global Cleantech Innovation Index (GCII)
Country
Overall Rank
(40 total)
Factors (+)
Factors (−)
China 19th D C
United States 3rd C D
United Kingdom 6th C D
Germany 9th C A
Japan 12th C A
Denmark 5th D B
Note: The Global Cleantech Innovation Index is defined by 15 indicators across the four main categories. The 2014 GCII report can be obtained at http://www.cleantech.com/wp-content/uploads/2014/08/Global_Cleantech_Innov_Index_2014.pdf. Note: The letters here signify the factors that the countries’ fared well and poorly in (from the figure below)
Figure 2.4: Global Cleantech Innovation Index (GCII) and its Components

38
Note: R&D = research and development.
China’s GCII results and the underlying reason for them provide clarity on where China stands
today in green innovation, compared with the global leaders. Although many of these smaller, high-
performing countries in the GCII rank very well on factor C (Evidence of Emerging Cleantech
Innovation), that is actually China’s weakest factor by far. In contrast, China’s strongest
performance is on factor D (Evidence of Commercialized Cleantech Innovation), whereas factor D is
often the weakest factor among the top-performing GCII countries. This result is telling, because it
highlights what can be understood as a core challenge facing the Chinese market: it is functioning
well as a market for bringing cleantech innovations to scale, but it is less successful at developing
those high-impact technologies domestically. Further key takeaways for China from the GCII
include the following:
• China’s solid score on factor A of the GCII (General Innovation Drivers) is driven equally by
the overall results from the GII (presented in the previous section), in addition to those
from the Global Entrepreneurship Monitor (GEM).20 The GEM is a useful complement to the
GII in that it explores some of the more subtle aspects of different markets and their cultural
characteristics that may affect their propensity for innovation and entrepreneurship. Some
relevant insights from the GEM for China include low results on the Self-Perceptions about
Entrepreneurship factor because of a low level of perceived entrepreneurial opportunities

39
and capabilities, but a much higher score on the Undeterred by Fear of Failure
subcomponent. Those results, coupled with strong results on the Societal Value about
Entrepreneurship factor, suggest that the underlying attraction to entrepreneurship and
innovation in China may exceed the perceived opportunities and capabilities in the market
to realize these aspirations.
• China’s solid score on factor B of the GCII (Cleantech-Specific Innovation Drivers) is driven
by the strength of domestic policies to support green innovation, R&D spending targeted to
clean energy, green investments, and the attractiveness of the market for renewable energy
development. Unlike on factor A, in which China’s score is noticeably lower than most of the
top-performing GCII countries, China’s score on factor B is basically equal to the high-
income countries ranked higher. This result implies that China is outperforming its overall
support for innovation in the green space, and that it may enjoy advantages in this sector by
promoting innovation within it compared with other sectors of the economy.
• China’s very low score on factor C of the GCII (Evidence of Emerging Cleantech Innovation)
underlines the central challenge for leadership with regard to promoting innovation and
echoes observations from the GII regarding low levels of R&D spending for basic research.
Patents in Cleantech Sectors, Early-Stage Private Investment, and High-Impact Cleantech
Start-Ups are the three subcomponents that define this factor of the GCII. China continues to
increase the volume of patents filed that are linked to green sectors. Yet it has lower levels
of early-stage investments, and green start-ups in China do not feature prominently on
global monitors of the most promising new cleantech companies such as the annual
Cleantech 100 report published by the CTG (formerly Cleantech Group). A link appears to
exist between such low levels of R&D support for basic research and the vitality of this
early-stage sector in the Chinese market. Although some reasons for this link relate to the
unique way Chinese firms acquire and integrate learning through acquisitions, China’s
continued low performance in producing new and promising companies and products
domestically may limit the extent to which green innovation can prosper there.
• In sharp contrast to factor C, China scores quite well on factor D of the GCII (Evidence of
Commercialized Cleantech Innovation), surpassed only by New Zealand and Denmark
among the high-income countries that score higher than China overall. This strong result is
due to the heavy weighting of two subcomponents: Value Added from Cleantech
Manufacturing and Renewables as percentage of Primary Energy Consumption. In both
areas, China should continue to improve in subsequent editions of the GCII as large solar
and wind manufacturers maintain their global market share and new renewable energy
capacity continues to expand. And although China’s strength on this factor could be viewed
as merely the result of being such a large, rapidly growing market, it is important to note
that innovation does not exist only in early-stage companies or academic research
environments. Innovation can take place along different points of the value chain. In the
instance of renewable energy technologies, Chinese manufacturers have been leaders in
process innovation and have been using it to improve production efficiencies. But because

40
process innovation is so integrated into industrial supply chains, it can be difficult to
quantify through indicators like the ones referenced in the GCII. As a result, it is important
to look more specifically at the solar, wind, and energy storage sectors in China to better
understand the dynamics of innovation within them and the opportunities for expanding
them in the future.
In less than 10 years, China’s wind-generating capacity grew more than a hundredfold. In 2015,
fully one-third of the world’s total solar PV installation occurred in China, making it the world’s
largest single market for solar PV. In addition to its rapid rise to global leadership in wind and solar
energy installation, China has also rapidly emerged as a leading global manufacturer of wind
turbines and solar PV equipment. The ability of Chinese firms to achieve a position of global cost
leadership in just a few years seems to point to an impressive capability within China for
alternative energy innovation.

41
3. China’s Wind Power Technology Sector
Venture Activity
Private VC activity in China’s wind sector from 2014-
2016 was significantly lower than in the United
States, with no early stage (Seed, Series A)
investments recorded during this period. This low
level of private venture activity in the Chinese market
suggests that the domestic wind industry in China
lacks innovative capacity at present.
With China’s largest wind turbine manufacturers
have limited experience selling globally, they could
form joint ventures to combine market access with
the R&D capabilities of non-Chinese firms. One such
partnership appears to be emerging between China’s
Sewind and Germany’s Siemens, focused on the
offshore wind market. These partnerships could also
“spin off” ventures that could be targets for VC
funding from private or government-guided sources.
R&D
Much like public R&D overall, government R&D
levels to the Chinese wind sector were healthy in
2016 and on par with high- income countries like the
United States. This confirms that China is delivering
on commitments to increase overall government
spending on R&D and that this spending is reaching
the wind sector.
Yet corporate R&D spending in China’s wind sector
was extremely low in 2016, raising a serious red flag.
While there have been some examples of Chinese
wind firms investing in research facilities abroad,
there is limited evidence that these companies are
seriously investing in native R&D.
Patents
Our analysis of patent production among China-
based wind companies revealed that these
companies were only slightly behind those based in
peer countries, with about 5% of these Chinese firms
having filed patents, compared with an average of
7.5% for China plus the five peer countries.
Offshore wind will be more dependent upon
innovation and cost reductions to grow in the next
five years, compared to onshore wind. Chinese wind
turbine manufacturers have limited experience in
this offshore space and may be well served to focus
patent filing and new innovations there, particularly
amidst the relative health of the Chinese wind sector
financially. Ultimately, offshore wind has the
potential to address some of China’s curtailment
problems as well. The results also indicate that
Chinese turbine manufacturers increasingly rely on
R&D centers outside of China to generate
international patents.
Learning & Cost Declines
Chinese wind turbine producers may not be
generating internationally patented product or
process innovations, but they have dramatically
reduced costs in a relatively short period of time.

42
A late adopter of wind power technology, China has quickly risen to become the largest wind power
market in the world, and Chinese firms are now among the leading manufacturers of wind turbine
technology globally. By the end of 2015, China had constructed 145 gigawatts (GW) of wind power,
more than all of the European Union (EU) countries combined, and almost twice as much as the
second largest installer of wind power capacity, the United States (GWEC 2016). Wind energy
generated accounted for 3.3 percent of China’s total electricity generation in 2015, up from 2.8
percent in 2014 (REN21 2016).
Leaders in China’s Wind Power Technology Sector
In 2015, Goldwind was the largest wind turbine manufacturer with 19 percent of the global market
share, larger than Vestas (18 percent) and GE (14 percent). Goldwind dominated the Chinese
market with 25 percent of market share, with the next largest company being Guodian United with
10 percent of market share, followed by Envision and Ming Yang with 8 percent of market share.
Market shares are illustrated in figure 3.1.
Figure 3.1: Wind Turbine Market Shares: Global and Chinese Market
a. Global b. Chinese Market
Source: GWEC 2016; Shankleman 2016.
Exports of wind turbines outside the Chinese market are still relatively low compared with
domestic sales; exports increased from 2008 to 2013, but then declined in 2014 and 2015. Exports
of wind turbines likely decreased because of increased trade tensions over legal challenges to
subsidization of the wind industry, market protectionism, and overall downturns in demand for
wind outside China. Wind power exports are reported in figure 3.2.
Goldwind19%
Vestas18%
GE
14% Siemens
8%
Gamesa8%
Enercon7%
Guodian7%
MingYang7%
Envison7%
CSIC
5% Goldwind25%
GuodianUnited10%
Envision8%Mingyang
8%
CSIC
7%
ShanghaiElectric6%
XEMC
5%
DongFangElectric5%
Windey4%
Sany
3%
Others19%

43
Figure 3.2: China’s Wind Power Exports
Source: GWEC 2016.
Research and Development In China’s wind sector, the 2016 public research and development (R&D) expenditure was
US$263.9million, and spending had increased about 5 percent to 10 percent annually since 2010.
The 2016 figure is higher in absolute terms than any of China’s peer countries, illustrating the
progress China’s leadership has made in delivering R&D spending on par with many high-income
countries. Considered on a weighted basis, China’s public spending is about the same as most peer
countries’ spending, with the exception of Denmark, where much higher R&D spending reflects the
strategic importance of the Danish wind industry to the country’s overall economy and green
growth plans.
However, the same trend does not exist when comparing corporate R&D spending. Corporate R&D
spending for wind companies was a mere US$100,000 in 2016, much lower than the corporate R&D
spending of all five peer countries—Denmark, Germany, Japan, the United Kingdom, and the United
States. On a gross domestic product (GDP)-weighted basis, China’s corporate R&D spending was
just US$4,996 compared with Denmark’s US$107,782,101. Although it appears China’s government
is making progress in increasing R&D support, much like in the solar photovoltaic (PV) sector, there
is limited evidence that this trend is mirrored on the corporate side.
While Goldwind and Guodian United are the top two wind turbine manufacturers (WTM) in China,
they have very different stories about how they developed their wind turbine technology. These
stories are examined later in the chapter.
Venture Activity Private venture investments associated with start-ups and innovation have been practically
nonexistent in recent years in China’s wind sector. Between 2014 and 2016, no investments were
recorded in China’s wind sector with Seed and Series A funding—the two investment types most
closely associated with innovative activity in a market. Just like with solar PV, venture capital
funding overall has declined in recent years in clean energy sectors. Wind is now a mature sector,
implying that it is less likely to be a target for venture capital in a way that a more nascent industry may be. But wind investments in the form of Seed or Series A capital have not disappeared in peer
countries, most notably in the United States, where between 2014 and 2016, there were 21 deals
0
500
1000
1500
2000
2500
2008 2009 2010 2011 2012 2013 2014 2015
MW
annual cumulative
44
valued at approximately US$59,935,030. These data imply that innovation in the wind sector
continues to be vital to other large markets. In fact, in an earlier three-year period, from 2011 to
2013, there were 36 deals in the United States involving Seed or Series A funding, valued at
approximately US$55,572,708. Thus although the U.S. deal volume has declined, the volume of
capital has remained basically constant.21 These data do not account for any investments from
government-guided venture funds recently established in the Chinese market.
If the type of companies receiving Seed and Series A private funding is any guide, it appears that
innovation in the wind sector outside China has moved beyond turbines and their components. The
recipients of the largest volumes of funding in the past three years are each developing new types
of wind-based products, many with links to unmanned transportation. Salidrone—a San Francisco–
based start-up and the recipient of more than US$16 million in Seed and Series A funding in the
past year—is developing wind- and solar-powered unmanned surface vehicles that travel on the
ocean’s surface, providing a new way to capture data while relying on renewable energy for power.
Altaeros Energies—a Massachusetts-based start-up and the recipient of US$7 million in Series A
funding in 2014—is developing an airborne wind turbine to harness the stronger, more consistent
winds found at higher altitudes. Prenav—a Santa Carlo, California-based start-up and the recipient
of US$6.5 million in Seed capital in 2016—is developing an automated system of small aerial robots
to capture 3-D imagery of vertical structures like wind turbines to allow operators to monitor the
performance of and inspect any component damage to these vertical structures. Much of the
innovation in the wind sector is linked to new products to improve turbine efficiency, wind systems, or novel types of transportation.
Case Study: Goldwind
Goldwind was China’s first leading wind turbine manufacturer, the first to produce a successful
wind turbine design, and the first in the industry to rise to the coveted position of being number
one in the world. Listed in Hong Kong SAR, China, and in Shenzhen, the company is backed by the
large state-owned enterprise (SOE) China Three Gorges Corporation and the insurance company
Anbang Insurance Group.
Goldwind has developed a reputation for independent technology innovation. The origin of the
Goldwind Science and Technology Company Limited was in the Xinjiang Wind Energy Company
(XWEC), which was established in northwestern China in 1986, the same year that Danish industry
leader Vestas installed the first utility-scale wind turbine in China. Goldwind’s chairman and chief
executive officer, Wu Gang, is a longtime scholar of wind power technology. He grew up as an
engineer in China’s Xinjiang Autonomous Region, a place of minimal opportunity but with excellent
wind resources. After learning about wind power, he helped to bring some of the first modern wind
turbines to China, and he worked alongside the Danes as they constructed the first demonstration
wind farms in Xinjiang. Goldwind has used a variety of strategies to develop its technology and has
benefited from Chinese government support since its early days.
Technology Acquisition
Since 1996, Goldwind has pursued a business model that allows it to implement modern foreign

45
technologies while promoting its own technological advancement, with the goal of creating new
ideas and eventually benefit from its own products and from the results of its research and
development (W. M. Yu and Wu 2004). In 1989, XWEC helped to import and install 13 Bonus 150
kilowatt turbines from Denmark at the Dabancheng wind farm in Xinjiang to form the largest wind
farm in China at that time. In 1996, XWEC bought a license from Jacobs Energie, a small German
wind turbine manufacturer, to manufacture 600 kilowatt wind turbines in China (W. M. Yu and Wu
2004). In 2001, Jacobs Energie merged with another company to form the REpower Systems Group
(REPower 2010). That same year, Goldwind obtained a license from REpower for a 750-kilowatt
turbine. In 2003, Goldwind acquired a technology license from another German company, Vensys
Energiesysteme GmbH, for the Vensys 62 1.2-megawatt turbine. Also, in 2003, Vensys erected its
first 1.2-megawatt prototype in Germany. Vensys’s direct-drive turbine technology was then
somewhat uncommon in wind turbine designs, but it was thought to have many advantages over
the traditional gearbox design. When Vensys developed a low-wind-speed version of its turbine
with a larger 64-meter diameter rotor that increased output to 1.5 megawatt, Goldwind acquired
the license for that turbine as well (Lewis 2013).
In early 2008, when several other firms made a bid to purchase Vensys, Goldwind opted to
purchase a 70 percent stake in the company outright so that it could continue its partnership.
Becoming the controlling owner of the company gave Goldwind more power over the direction of
Vensys’s R&D activities as well as fewer constraints over access to its intellectual property. It is also
likely that Goldwind was concerned about relying exclusively on its licensing agreements with
REpower because that company had been purchased by Indian wind turbine manufacturer Suzlon,
one of Goldwind’s competitors in the Chinese market, just the year before (World Wind Energy
Association 2007). After its acquisition of Vensys, Goldwind began to jointly develop several new
wind turbine designs in partnership with the company. Work began on the development of 2.5-MW
and 3-MW turbines, as well as on 5-MW and 6-MW turbines with a view toward off shore
applications.
Goldwind now has R&D facilities in Beijing, in Urumqi, and at the Vensys facility in Neunkirchen,
Germany. Goldwind has also helped to establish majors in wind power engineering at 13 colleges
across China to train potential future employees. Many of its staff members have been sent abroad
to obtain advanced training by foreign companies or institutes, and several high-level managers
have been sent abroad for master of business administration programs. Also, Goldwind has built up
its R&D capacity through collaborations with universities and research institutes in China and
overseas, including the Xinjiang Agriculture University, Delft University of Technology in the
Netherlands, and international companies Garrad Hassan and Aerodyn (Mah and Hills 2010). In
September 2011, Goldwind announced the founding of Goldwind University, the first corporate
university within China’s wind turbine manufacturing industry.
Goldwind collaborates with wind turbine component suppliers from around the world, including
Timken, LM, and SKF. On technology and standards, it has worked with DNV-GL, TUV Nord, IEC, and
Intertek. Its finance and insurance partners include HSBC, IDB, IFC, JP Morgan, CITI, and other
global major financial institutions (Wu 2015). While the vast majority of its sales are still within

46
China, Goldwind has been trying to grow its global brand and presence, particularly as growth in
the Chinese market slows and is hampered by curtailment.
The company’s cumulative overseas installations reached 864 MW by the end of 2015, selling to
markets last year as diverse as France, Panama, and Thailand. Its largest market outside of China is
Latin America, mainly because Latin America does not have a local wind turbine manufacturer to
protect and it relies exclusively on technology from foreign firms, even though much of it is
manufactured locally. Goldwind’s second largest market is Asia (excluding China), followed by
Austria, then North America. International revenue was 8 percent of total revenue in 2015 (Wu
2015).
In December 2016, Goldwind announced it would be cooperating with U.S. technology company
Apple on wind projects in China by selling partial ownership in several of its wind project
development companies. Goldwind’s wholly owned subsidiary Beijing Tianrun New Energy
Investment Co. Ltd. will transfer to Apple 30 percent equity share of several of its project
development companies for four different wind projects totaling 285 MW. The project companies
include Nanyang Runtang New Energy Co. Ltd. in Henan Province; Zibo Runchuan New Energy Co.
Ltd. in Shandong Province; Shuozhou Pinglu Sineng Wind Power Co. Ltd. in Shanxi Province; and
Qiaojia Tianqiao Wind Power Co. Ltd. in Yunnan Province. All will be operated as cooperative joint
ventures between Goldwind and Apple. This move is part of Apple’s goal to power all of its plants
around the world with 100 percent renewable energy. It has also announced that it will be building
170 MW of solar capacity in China (Ng 2016).
Technology Innovation Goldwind’s turbines primarily are based on the original Vensys designs but have benefited from
R&D conducted since that acquisition. Many of the innovations Goldwind has brought to the
industry are variations of the original designs and include high-altitude models, low-wind-speed
and low-temperature models, and onshore and offshore models.
An example of an innovation developed by Goldwind is a hybrid cement and steel tower for large
wind turbines installed in low-wind-speed areas. The product is believed to be the first of its kind in
China and has been certified by the China General Certification Center. Another tower type
developed by Goldwind has a flexible foundation for wind turbines with hub heights of 120 meters
or higher that uses about two-thirds of the amount of steel used in other towers (Yang 2015).
Although Goldwind’s innovations could be described as incremental, the company has been able to
deliver performance. According to the company, by increasing the rotor diameter as well as
optimizing equipment and wind farm operations to improve power output, Goldwind’s wind farms
have seen a theoretical increase in power output of almost 5 percent. For example, Goldwind’s 1.5-
megawatt turbine using an 87-meter rotor diameter (launched in 2010) produces nearly 5 percent
more power than the 82-meter unit it launched in 2008. Goldwind’s overall wind farm utilization
hours are higher than the national average, which it argues is attributable to superior equipment
and to wind farm siting.

47
Case Study: Guodian United
Guodian United Power Corporation (Guodian United) has grown to be the second largest wind
turbine manufacturer in China since its restructuring and establishment in 2007 and is now one of
the fastest growing companies in wind power. Guodian United had its origins in the company
Longwei Power Generation Technology Service Co. Ltd., which was a joint venture with U.S. firm
Westinghouse starting in 1994. From 1998 to 2006, it became a joint venture with German firm
Siemens. Then, in 2007, it was restructured to be a SOE wholly owned by China Guodian
Corporation Group.
Guodian United’s parent company, China Guodian Corporation, is one of the “big-five” power
generation companies in China. It is engaged in the development, investment, construction,
operation, and management of power plants and power generation across China and Myanmar.
China Guodian Corporation’s subsidiary Longyuan Power is one of China’s leading wind farm
developers. Longyuan Power is the largest wind power producer in Asia. Because all the big power
companies in China are subject to renewable energy quotas (described earlier), Guodian United has
built-in demand from its parent company, with projects developed by Longyuan (Kirkegaard 2015;
Yeh and Lewis 2004). According to one study, 60 percent of China Guodian Corporation’s wind
projects used Guodian United wind turbines (Hu, Skea, and Hannon 2016).
Guodian United is based in Beijing but owns five subsidiaries, three holding companies, and six
manufacturing and R&D bases in six cities across China—Baoding, Lianyungang, Chifeng, Baotou,
Yixing, and Changchun. Its business activities include design and research, manufacturing, and sales
and services of large wind turbine generators.
Technology Acquisition
Despite early partnerships with Westinghouse and Siemens, the company’s flagship 1.5-megawatt
turbine came from a licensing arrangement with German company Aerodyn. The license was a way
for Guodian United to build on its broader power systems expertise and to gain access to modern
wind turbine designs. The model transferred was a gearbox-driven turbine. (Aerodyn is one of the
common sources of intellectual property discussed later in this chapter.) Aerodyn has licensed or
otherwise shared its technology with at least five Chinese wind companies other than Guodian
United—Dongfang, Sewind, CSIC Haizhuang, HeWind, and Ming Yang.
Although Guodian United, a Chinese SOE, does not have to disclose its technology-related risks,
Ming Yang, listed on the New York Stock Exchange, did have to disclose to the U.S. Securities and
Exchange Commission the details of its licensing agreement with Aerodyn for its 2.5-megawatt, 3-
megawatt and 6-megawatt wind turbines. Ming Yang had downplayed its reliance on Aerodyn in
the past in an attempt to demonstrate its technological self-reliance (for example when it opened an
R&D center at North Carolina State University). Aerodyn disclosed the terms of its license with
Ming Yang, which is likely similar to Guodian United’s. First, Aerodyn’s licenses are all nonexclusive,
meaning any single licensee, such as Guodian United or Ming Yang, cannot prevent it from selling its
technology to competitors. Second, Aerodyn restricts the further use of its technology, so that its
Chinese partners are not permitted to enter into any collaborations to manufacture the licensed

48
technology with other companies. Third, Aerodyn collects up-front royalty payments regardless of
the eventual market demand for the turbines (Quilter 2012).
Technology Innovation
Guodian United has received direct support from the Chinese government as well as the Beijing municipal government. It was selected as a government-backed “State Key Lab of Wind Power
Equipment and System Technology” that conducts R&D and provides technical support for the
company. Its Beijing-based location has given it access to a variety of government accolades. For
example, the company’s Operations and maintenance service arm, Company Star, has received the
national high-tech enterprise certification, as well as certifications from the Beijing Science and
Technology Commission, the Beijing Municipal Finance Bureau, and the Beijing Local Taxation
Bureau.
Guodian United was one of three companies selected by China’s Ministry of Science and Technology
to be eligible for access to 16.3 million yuan in R&D support to develop 10-megawatt turbine
designs, which were prioritized for the 12th Five-Year Plan Period (Qi 2012); however, a 10-
megawatt prototype is yet to be constructed. Guodian United’s portfolio includes 1.5-megawatt
wind turbines tailored for normal, high-altitude, tideland/coastal, and low-temperature conditions.
Guodian United also has independently developed “double-fed” offshore wind turbines with a rated
capacity of 3 megawatt. Doubly fed electrical generators can run at speeds slightly above or below
their natural synchronous speed, a capability that is useful for large variable-speed wind turbines.
Guodian United also developed a 3-megawatt permanent magnet direct drive wind turbine as an
alternative technology to its gearbox-based design. Its large wind turbines, rated around 6
megawatt, use its own proprietary technology that complies with China’s low voltage ride through
(LVRT) technology standards. The blades are made up of a carbon fiber composite material rather
than the traditional fiberglass, which the company says provides better stability as well as
efficiency. A prototype of the 6-MW offshore turbine was installed on Weifang beach in Shandong
Province in 2012, also using the double-fed variable speed design. Guodian United is also
developing a second generation of its 6-megawatt offshore turbine with a larger rotor. It is also
working on a design for a 12-megawatt turbine, but in 2014 the company said that it was still at the
concept stage with no concrete plans to produce a prototype (Smith 2014), and as of 2016 it was
not clear where things stood.
China’s Role in Global Wind Power Technology Innovation
Despite being a mature technology, wind turbines still offer the potential for innovation. Innovation
is expected to consist of efficiency improvements, for example because of larger designs, and this
will result in lower power generation costs (GWEC and IRENA 2012; Grubler et al. 2012). China’s
relative progress in global wind power technology innovation trends is discussed in the following
sections, which include an assessment of the technological sophistication of Chinese designs, a
discussion of the learning and cost declines achieved to date, and a discussion of the overall quality
of the technology based on performance and certification.

49
Assessing Technological Sophistication
Patenting Activity
This section of our report draws upon the work of Lam, Branstetter, and Azevedo (2017), and our exposition in the next several paragraphs closely follows their analysis. These researchers start by
counting all the wind patents in the worldwide patent statistical (PATSTAT) database published by
patenting offices in China and in other regions with the most activity in wind turbine invention,
manufacturing, and deployment, including the European Patent Office (EPO), the EU15 nations,
Canada, Japan, Republic of Korea, the Russian Federation, and the United States. Figure 3.3
illustrates the total number of patents granted by the respective patent offices (only priority
patents are tracked to avoid double counting).
As shown in panel b in figure 3.3, patenting activities started in the early 1980s and accelerated in
the 2000s. The most recent burst of inventive activities began in the late 1990s. At this point, a
number of European countries accelerated their efforts to curb carbon emissions. The ratification of
the Kyoto Protocol by Western Europe's industrial states, coupled with incentives such as feed-in
tariffs in several European countries, sent a clear signal to the industry (Dechezleprêtre et al. 2011).
One can note the impressive growth in patents in the Chinese Patenting Office, which grew from no
patents in the 1980s to about 3,500 patents cumulatively by 2014, the vast majority of which were
granted in the past few years. This growth in domestic patents is consistent with previous findings
(Bettencourt, Trancik, and Kaur 2013; Gallagher 2014).22
Figure 3.3: Wind Power Patents Granted by All Patenting Offices
a. Total wind patents from January 1980 to 2014 by country or region b. Wind patents over time by country
Source: Data from PATSTAT 2015. plot originally produced by Lam et al. (2017).
Note: CN = China; JP = Japan ; US = United States; EU = European Union 15 and European Patent Organisation member states; KR = Republic of Korea; RU = Russian Federation; SU = Soviet Union; CA = Canada; ES = Spain; GB = Great Britain; FR = France; DK = Denmark; and DE = Germany.

50
Box 3.1: Patents as a Measure of Innovation
Lam et al. (2017) provide a helpful overview of the use of patents as measures of innovation. Our text here
closely follows their overview. Patents have been used as a measure of innovation since the early 1960s in mainstream
economic research (Griliches 1990). Information about the invention is readily available in patent data and can be
disaggregated into specific technological fields. Furthermore, there are few economically significant inventions that have
not been patented (Johnstone, Haščič, and Popp 2010). Broadly speaking, patent data analyses can be categorized into
two approaches: patent counts and patent citation analysis. They have been used widely in the economic literature, each
with its advantages and disadvantages (Jaffe and Trajtenberg 1996). Patent counts, which tally the number of
applications or granted patents, are straightforward, and a number of studies have employed this metric. Within the
energy innovation literature, Popp (2005) shows that innovative activity responds to incentives, that social returns to
environmental research are high, and that policies can be used to influence new inventions. Johnstone, Haščič, and Popp
(2010) illustrate that different environmental policies have different innovation effects on renewable energy
technologies. Examining wind turbine patenting activity in the United States, Horner, Azevedo, and Hounshell (2013)
find that renewable portfolio standard (RPS) policies have positive effects on wind innovation, whereas tax-based
incentives are not as effective. A number of studies have examined the number of renewable energy patents in China
(Bettencourt, Trancik, and Kaur 2013; Gallagher 2014; Gosens and Lu 2014) and have found that Chinese patenting
activity is on the rise. However, simple patent counts neither account for the differences in commercial values of various
patents nor do they indicate whether the patented technology is adopted.
Patent citation data can address some of the limitations associated with patent counts. If we assume the prior
inventions cited in new patents are the important fundamental knowledge on which the new knowledge is built, then the
more important this knowledge precursor is, the more often it is cited. A patent citation analysis examines the number of
times each patent has been cited by subsequent patents, and this method has been used to measure patent quality
(Trajtenberg 1990) and economic value (Harhoff et al. 1999), as well as knowledge flows and spillovers across
inventions (Jaffe, Trajtenberg, and Henderson 1993). Within the energy innovation literature, Popp (2002) shows that
patent citations can be used as a measure of the knowledge supply available to inventors. We use a similar approach in
this paper to compare the quality of patents granted to Chinese inventors with the quality of patents granted to non-
Chinese inventors. Firms that wish to use the patent system to protect their invention first file an initial patent
application, also known as a “priority application,” with a national patent office—usually the one in their home
jurisdiction. Under international patent rules, firms then have up to one year to choose to apply for patent protection
abroad for the same invention. Foreign applications filed within this period will retain the same application date as the
one on their initial application. This policy is important, because under World Trade Organization (WTO) rules, patents
are awarded in nearly all countries under a “first to file” principle rather than a “first to invent” principle. To evaluate the
merit of the patent application, a patent office normally conducts an international search report of prior art. This search
report helps the patent office assess the patentability of an invention as well as the legitimacy of the claims made by the
inventors.
The citations serve as legal boundaries, limiting the scope of the property rights eventually awarded to the
patent applicant by explicitly placing related ideas outside the boundary of what the eventual patent award will protect.
The inventors thus have an incentive to limit unnecessary patent citations. However, the deliberate omission of relevant
patent citations can be grounds for legal sanctions or even patent invalidation, so inventors have an incentive to cite all
relevant patents (OECD 2009).

51
However, this figure treats Chinese domestic patent grants as being equivalent to European or U.S.
patent grants in quality. Lam et al. (2017) assess the number of patents that were awarded to
inventors in the major patenting offices—that is, the EPO and the USPTO (U.S. Patent and
Trademark Office). When they restrict their sample to only those patents eventually granted by an
EPO member state, the total number of patents drops substantially (figure 3.4). Of these, inventors
with German addresses were awarded the most patents, followed by Danish and American
inventors. Inventors typically file for patents at the patent offices of their home country first, and
apply to the EPO only to extend protection to some or all of the 38 member countries states.
Because the EPO’s patent application process can be costly, the EPO data filter out low-value
inventions (Johnstone, Haščič, and Popp 2010), explaining the smaller number of patents granted
by the EPO member states.
Figure 3.4: Wind Power Patents Granted by European Patent Office Member States
a. Cumulative number of wind patents b. Wind patents over time, by country
Source: Data from PATSTAT 2015, plot originally produced by Lam et al. (2017).
Note: Granted to inventors from China (CN), Japan (JP), United States (US), Germany (DE), Denmark (DK),
France (FR), Great Britain (GB), and Spain (ES) from January 1980 to 2014.
Over the entire sample period, only 16 patents of a total of 1,695 wind patents (or 0.9 percent of the
total wind patents in the EPO) have been granted by EPO member states to Chinese inventors. To
date, Envision and XEMC have respectively lodged 38 and 19 EPO applications through the EPO,
receiving respectively two and six patents. Sinovel has submitted about 21 patent applications to
the EPO, but, of those, all but one were either subsequently withdrawn by Sinovel or deemed to be
withdrawn by the EPO. Sinovel has secured one patent grant. The other 7 of the top 10 Chinese wind turbine manufacturers have not obtained any EPO patents, and 5 of them have no records of
applying for patent protection through EPO. China’s State Intellectual Property Office (SIPO)
granted more than 3,000 patents in the F03D classification over the same time period (figure 3.3,
panel a).
In figure 3.5, information regarding the number of wind power patents granted by the USPTO to
inventors from different countries is provided. In the sample period, Chinese inventors were
granted 91 wind patents in the USPTO, corresponding to less than 1.6 percent of total wind patents
in the USPTO. A significant fraction of these patents was assigned to multinational corporations like
GE or to inventors unaffiliated with any firm. Envision is aggressive in seeking protection rights for

52
its intellectual property, lodging 72 applications and receiving 28 patents. Sinovel comes in second
with 22 applications and 1 patent. Five of the top manufacturers have never filed with the USPTO
for patent protection.
Figure 3.5: Wind Power Patents Granted by the U.S. Patent and Trademark Office
a. Cumulative number of wind patents b. Wind patents over time by country
Source: Data from PATSTAT 2015; plot originally produced by Lam et al. (2017).
Note: Granted to inventors from China (CN), Japan (JP), United States (US), Germany (DE), Denmark (DK), France (FR),
Great Britain (GB), and Spain (ES) from January 1980 to 2014.
Similarly, figure 3.6 illustrates the number of wind power patents granted through the Patent
Cooperation Treaty (PCT) process. This figure shows a higher number of patents granted to Chinese
inventors (175) as well as a greater overall share (5 percent). However, when patents that were
granted only by SIPO are filtered out, the number of patents decreases to 96.
Figure 3.6: Wind Power Patents Granted by Patent Cooperation Treaty Member States
Source: Data from PATSTAT 2015; plot originally produced by Lam et al. (2017).
Note: Granted to inventors from China (CN), Japan (JP), United States (US), Germany (DE), Denmark (DK), France (FR),
Great Britain (GB), and Spain (ES) from January 1980 to 2014.

53
The results also indicate that Chinese turbine manufacturers increasingly rely on R&D centers
outside of China to generate international patents. For instance, as noted by Lam et al. (2017), in
2010 Envision Energy, a Jiangsu producer, established its Global Innovation Center in Denmark, and
all of its EPO, USPTO, and PCT patents were assigned to its Danish counterpart, Envision Energy
(Denmark) ApS. The Danish entity filed for all but one of these applications. Significantly, all the
listed inventors were Danish nationals.23 Likewise, all of XEMC’s patents were assigned to its Dutch
subsidiary, XEMC Darwind, and all of the listed inventors have Dutch nationality. In 2008, Goldwind
acquired the majority stake in Vensys, a German firm, and since then, Vensys and its German
inventors have obtained four USPTO patents and four EPO patents. Goldwind and Vensys also
jointly filed for one EPO application.24
The recent uptick in patenting activity is clearly evident across different patent authorities, and the
final years of the data sample are ones in which Chinese firms have displaced foreign rivals in their
home market. Despite the growth in Chinese production and the expansion of Chinese exports of
wind power equipment to other major markets, we find a limited number of patents granted to
indigenous Chinese firms outside of their home market.
Patent Citation Likelihood
Using World Intellectual Property Organization (WIPO) patent data, Lam et al. (2017) find that
there are 156 patents whose first inventors were Chinese nationals. Between 1980 and 2014, the
likelihood of a Chinese wind turbine patent being cited by subsequent patents is less than that of an
American, Danish, German, or Japanese patent, and this trend is significant and robust. For example,
when interpreted as an incidence rate ratio, German wind patents are associated with an
approximately two and one-third times higher citation rate than Chinese patents, and U.S. patents
are three times more likely to be cited than Chinese patents.25
To account for the fact that the Chinese wind turbine manufacturing industry has only been active
since the early 2000s, we narrowed our sample period to include only patents granted between
2004 and 2014. Again, our results show that among regional patent groups, Chinese wind patents
are the least likely to receive citations. The coefficients associated with German wind patents
indicate that German patents in this period experienced a 2.2 times increase in citation rate. Finally,
the patent examination process may be lengthy and can require a few years to complete, and the
sharp drop off at the end of the sample period in figure 3.4, panel b, illustrates this phenomenon. To
account for the fact that a number of patents may still be under examination, Lam et al. (2017)
restrict the sample period to 2002–12. The results show again that Chinese patents are less likely to
receive citations than are patents from other countries.
These results place the recent global surge of wind turbine patents in perspective. A simple count of
global patent activity might lead the observer to believe that China is a leader in wind turbine
innovation. However, the level of global outreach of these patents is lower as observed by the
significant difference in the “citedness” between Chinese patents and American, Danish, German, or
Japanese patents. The number of Chinese international patents has increased, but few of them have
progressed all the way to the point of receiving a patent grant in a major market outside China, and
their value is fairly limited.

54
Other Measures
In addition to patent analysis that attempts to determine the quality and significance of specific
patents filed, there are other ways to try to assess technological sophistication that are specific to
the wind industry. For example, one way to assess technological progress in wind power
technology is by the average size of the wind turbines being installed annually. Because the size of
individual wind turbines has increased over time, and the majority of China’s wind power installed
in recent years has come from Chinese technology manufacturers, the average size of the turbines
installed is an approximate measure of the technology level of Chinese wind technology providers.
Although in the initial years of China’s wind industry development it was installing smaller wind
turbines on average than other countries that were earlier innovators in the industry, China has all
but caught up with advanced countries. For example, in 2015, the average turbine size installed in
China was 1.837 megawatt, compared with an average of 2 megawatt that year in the United States.
At this point, countries installing larger turbines are those that are pursing offshore wind
development, primarily in Europe. More than 91 percent of offshore wind installations are located
in Europe, led by the United Kingdom with 40 percent of installed capacity (GWEC 2016).
In addition to average size, examining the largest commercially available turbine size on the market
by a domestic manufacturer reflects the state of the domestic manufacturer’s technical capability.
As illustrated in figure 3.7, Vestas still has the largest commercially available turbine at 8 megawatt,
while both Goldwind, Guodian United, and HeWind have 6-megawatt turbines available. Chinese
firms have been working on developing 10-megawatt wind turbines, but they are not yet in
production.
Figure 3.7: Wind Power Front Runners in China and Abroad by Turbine Size
Source: Adapted from Lewis 2016a.
In addition to turbine size, blade length is another indicator of technical sophistication. Blades are
one of the more challenging design features of the wind turbine, and blade length has been
increasing to increase total swept area and to increase electricity production, particularly in low-
0.6
1.7 2.0
2.5
4.5
5.0
6.0
7.6
8.0
0.6 0.8
1.2
1.5 1.5
3.0
5.0
6.0 6.0 6.0 6.0
0.0
1.0
2.0
3.0
4.0
5.0
6.0
7.0
8.0
9.0
Max
imum
Tur
bine
Uni
t S
ize
(Meg
awat
ts)
Foreign Chinese
Vestas
Vestas
Vestas
Nordex
Goldwind
Goldwind
Sinovel
Goldwind
Sinovel
Sinovel
Sinovel
Goldwind
Goldwind
Hewind
United Power
Vestas
Enercon
RePower
Enercon
Enercon

55
wind-speed areas. Within China, an increasing number of 2-megawatt turbines have blade lengths
of 93 meters or more, as illustrated in figure 3.8.
Figure 3.8: Blade Length in 2-MW Wind Turbines in China
Source: Adapted from Y. Yu et al. 2017.
Assessing Learning and Cost Declines
Chinese wind turbine producers may not be generating internationally patented product or process
innovations, but they have dramatically reduced costs in a relatively short period of time. Lam et al.
(2017) use China’s wind farm project price data from Clean Development Mechanism (CDM)
program for the period between 2004 and 2012, the most extensive period to date. In the same
spirit as Qiu and Anadon (2012) and Yao, Yang, and Qu (2015), they construct an economic model
to estimate the learning rate in China’s wind turbine industry.
The results show that in the sample period, China’s wind installed capacity increased more than
100 times, and the capital cost per unit capacity decreased approximately 25 percent. The implied
learning rate for wind electricity ranges between 3.5 percent and 4.5 percent, which is on the low
end of learning rate estimates for the wind industry (Qiu and Anadon 2012; Rubin and others 2015;
Yao, Liu, and Shiyou 2015). Over the study period, Chinese manufacturers adopted wind power
technology from abroad (Lewis 2013), where wind turbines were widely deployed, and there was
little room for significant technical improvement. Furthermore, the average estimated load factor,
or the ratio of actual electricity generation to the maximum possible generation assuming
continuous full power operation, actually decreased in this time period, suggesting that the
industry’s swift expansion has run into location and infrastructural constraints that recent
technological progress cannot help compensate.
The analysis shows that because the Chinese government prioritized wind power development in
the past decade, Chinese turbine manufacturers have become important players both in the global
and the domestic markets. During this period, the number of wind patents granted by SIPO has
exploded, and the majority were granted to domestic inventors. This increase suggests that Chinese

56
firms in this industry have acquired a substantive capacity to generate novel, indigenous
innovations. However, we find that there are not many wind power patents granted to Chinese
inventors, and even fewer to leading Chinese manufacturers by the member states of the EPO or by
the USPTO. A higher number of PCT or international applications filed by Chinese inventors were
examined by an international patent office, but a significant portion of these international
applications have not been granted by patent offices outside of China. Comparing the patent citation
likelihood, we find that Chinese patents are less likely to be cited than patents from Denmark,
Germany, Japan, and the United States.
Although Chinese wind power firms were focused on their domestic market in the beginning of the
past decade, the top firms have looked to the international market in recent years to expand their
market share (CWEA 2015). Unless Chinese firms patent their inventions in these jurisdictions, they
cannot prevent other inventors from infringing on their intellectual property rights. As noted by
Lam et al. (2017), Chinese firms in other sectors have, in recent years, become increasingly
aggressive about patenting inventions outside of China—the total number of patents taken out in
the United States or the EU by China indigenous enterprises across all sectors per year is now in the
thousands (Branstetter, Li, and Veloso 2013). Indeed, we find evidence that Chinese wind turbine
producers tend to turn to patent offices outside China for intellectual property protection. However,
the majority of patents assigned to Chinese manufacturers were invented by their foreign
subsidiaries or through research centers with limited Chinese presence, suggesting that the Chinese
wind industry has yet to transition to an “indigenous innovation” mode as previously argued (Ru et al. 2012).
What about the growing numbers of domestic patents taken out by these Chinese manufacturers?
Are these not evidence of Chinese innovative dynamism? This is a question examined by Lam et al.
(2017). As these authors note, (2013) have examined the recent surge in Chinese domestic
patenting across a broad swath of technologies, finding that government support, at various levels,
for increased domestic patent applications explains part of the surge. Similarly, Li (2012) shows
that subsidy programs at the provincial level are partly responsible for the increased rate of
domestic patenting activity. Chinese companies are taking out local patents because they are paid
to do so. Additionally, patent grant numbers are used as criteria for personnel evaluation both in
government and private research institutes (Gosens and Lu 2014). What is also true is that China's
evolving legal system still has difficulty distinguishing between patents that protect real innovation
and patents that merely pretend to protect real innovation. This confusion provides local firms with
large portfolios of "junk" patents that carry potential legal leverage over rivals.26 If those patents
represented economically valuable inventions, then Chinese manufacturers would have a strong
incentive to patent them outside China as they look to export or manufacture their products outside
China.
Chinese wind turbine producers may not be generating patented product or process innovations,
but as Lam et al. (2017) note, they have dramatically ramped up their manufacturing capabilities in
a relatively short period of time. Qiu and Anadon (2012), Wang, Qin, and Lewis (2012), Gosens and
Lu (2013), Lewis (2013), Nahm and Steinfeld (2014), and Tang and Popp (2014) examine this rapid
acquisition of manufacturing capabilities from a range of perspectives. There is little question that
this represents a substantial technological achievement. Chinese enterprises can now manufacture
a full spectrum of wind turbine products, including the largest and most challenging, and they are
the cheapest builders of solar PV modules in the world. The best Chinese firms achieve reasonably

57
high levels of quality, and continue to price their products at levels well below those of the major
Western manufacturers. Clearly, Western technology has been successfully absorbed and
effectively applied in a context in which low factor and input prices enable cost-effective
manufacturing on a large scale.
But can we call this innovation in the usual sense of the word? To the extent that the global state of
the art is not advanced by the development of new products or processes that could be applied
outside of China, Lam et al. (2017) would suggest that this process is better characterized as
technology transfer or technology absorption rather than innovation. Some scholars have examined
the sustained decline in product prices in the Chinese alternative energy hardware industries and
have interpreted this as prima facie evidence of dynamic “cost innovation”—intentional, cumulative
refinement of the manufacturing process, coupled with small changes in the product itself (Nahm
and Steinfeld 2014). These changes are individually too minor to merit a patent but, collectively,
result in steady, sustained, significant cost reductions. However, sustained price reductions could
also emerge from a process of gradual absorption of Western best practice and its application in a
context in which factor and input prices are lower than in the Western locations where the
technology was originally invented. Prices and costs could fall even in the absence of a meaningful
capability on the part of Chinese firms to refine, improve, and change production processes in
significant ways. Even without innovation, this process generates economic value by creating a low-
cost center of production—a value that potentially benefits users of green-tech hardware far from
China's borders. On the other hand, to the extent that low wages, low effective land prices, and a low cost of capital will rise over time, the low costs could be temporary rather than permanent. And
once Western best practice is fully absorbed, that also implies a deceleration or a cessation of the
decline in costs.
Although some evidence suggests sustained reduction in wind turbine prices, Lam et al. (2017) find
that this reduction is relatively modest once normalized for the scale of the Chinese industry, as
indicated by the low learning rate in China relative to the global industry’s historical learning rate.
Furthermore, it is unclear if these kinds of cost innovations could continue indefinitely or be
replicated elsewhere. The average estimated capacity factor in China actually decreased during the
sample period, suggesting that the industry’s swift expansion has run into location and
infrastructural constraints. The actual annual capacity factors are several percentage points lower
than expected, owing to the widespread curtailment in the industry, so if we adjusted for the actual
capacity factor, the learning rate results would be lower.
Assessing Quality
There have been frequent claims that Chinese wind turbines are of lower quality than their foreign
counterparts. Quality can be assessed by overall performance, as well as lifetime on a longer
timescale, and maintenance needs on a shorter time scale. In the history of the wind turbine
technology industry, it has been common for companies to experience technology failures that have
wreaked financially devastating havoc on young companies. For example, NEG Micon infamously
experienced a gearbox failure while its turbines were still under warranty, and the widespread
retrofits it had to conduct ultimately bankrupted the company (Lewis 2013).

58
One study that assessed wind power technology quality in China found that China generally lags in
the design of megawatt-scale wind turbines, in key technical R&D of wind turbines, in
manufacturing technologies of key components, as well as in testing and certification, equipment
system design, integrated technology, and R&D of key parts (Kirkegaard 2015). China’s own Five-
Year Science and Technology (S&T) Plan for Wind Power noted weaknesses in advanced wind
power equipment design and in independent innovation capability, as well as in wind resource
data, wind farm design and operation, grid connection, and certification and testing (Ministry of
Science and Technology 2012).
In 2011–2012, when wind turbines were creating instability on China’s power grid, it became
clearer that Chinese turbines lacked international software capability that would increase overall
system stability. As a result, many Chinese firms turned to partnerships, primarily with Danish
companies with advanced expertise in this area. For example, Vestas was said to have retrofitted
several Chinese wind turbine designs with LVRT capabilities. Another Danish firm, control system
supplier Mita Teknik, engaged in a strategic partnership with Sinovel in 2012 in which it provided
expertise that enabled Sinovel turbines to connect using local grid codes in markets all over the
world (Kirkegaard 2015).
One of the best ways to assess quality is through independent testing and certification, a field that is
still developing in China. The China General Certification Center (CGC) was the first center
approved by the Certification and Accreditation Administration of China (CNCA). It was established
in 2003 with the aim of serving as China’s main certification body for wind turbines, similar to
leading industry certification companies Germanischer-Lloyd, DNV, and Garrad Hassan, which have
since merged (now DNV-GL). CGC is concerned with wind turbines and components certification
and testing, but there are other facilities that also assist with general technology testing. For
example, the China Electrical Power Research Institute (CEPRI) under the state grid runs a wind
turbine test site in Zhangbei, Hebei Province, to verify grid performance.

59
Case Study: Wind Turbine Test Centers (Denmark)
DTU Wind Energy is a division of Technical University of Denmark (DTU) credited with promoting
innovation in the wind industry in Denmark over the past decade. DTU focuses on collaboration
projects with industry, software development, and testing and validation. Tests conducted at the
two test centers operated by DTU produce data and learning that can be synthesized to software
projects and to other research at the Technical University of Denmark that may ultimately assist
existing wind companies and inspire new ones.
Denmark-based Vestas collaborates closely with DTU and leverages
testing facilities to explore new concepts in turbine design. Just recently,
Vestas installed a concept demonstrator to test the feasibility of
operating and controlling a multirotor turbine. Although most turbines
have only one rotor, the Vestas test turbine has four, presenting new
challenges around the effect on overall performance of having four rotors so close together and
around how to control multiple rotors consistently. Although the commercial viability of new
innovations like this are determined by industry, the real conditions provided by DTU’s test centers
generate valuable data and learning for product developers, as well as inspiring new tracks for
related research at DTU.
These industry links do more than benefit companies. They also provide a learning environment for researchers that helps the university maintain its reputation as one of the leading technical
programs focused on sustainability. This reputation builds over time and serves to attract top-
caliber students from around the world to pursue their studies at DTU.
Smaller countries like Denmark and its Nordic peers have been very focused on attracting talent as part of their approach to promoting green innovation. Despite being well-educated populations
with access to high-quality academic institutions, countries like Denmark must attract educated
workers from other countries to learn and ultimately staff many of the firms that develop there. By
maintaining links to industry through these test centers, DTU manages to continue attracting this
talent as well as providing links to companies that may hire them in the future. (Greve 2017.)
DTU operates test centers at
Høvsøre and Østerild, each
providing ideal geographic and
weather conditions to test new
wind turbine designs. The site
locations near the North Sea
provide consistent winds that can
simulate onshore and offshore
conditions for new designs.
60
Government Policy Support
China’s government has pursued the development of an indigenous wind power industry almost
since the country started using wind power. A core national innovation strategy in China has been
one that targets domestic development of technologies even if they were initially based on foreign-
innovated designs. Given this priority, the Chinese state opted to support the development of wind
power technology with a strategy similar to that used in other industries. China’s wind power
industry has benefited from various forms of government policy support; some policies have
specifically targeted industrial development for the wind power industry, while others have
indirectly supported industrial development by establishing a local market for wind power. The government has used policies to emphasize different areas of support at different times, and policy
structure has undoubtedly influenced firm strategies for technology development in wind power
(Lewis 2016a).
The support mechanisms described in the following sections can be viewed as an interacting
system of policies. Broader framework policies, including sector-specific policies such as the
National Renewable Energy Law and industrial policies that span multiple sectors, operate under a
system of even higher-level national policies such as general S&T policy, energy policy, and climate
policy strategies. At a lower level, another set of policies affects implementation, including pricing
policies, R&D programs, and trade and technology transfer policies that involve specific firms
(Lewis 2016a).
All these policies interact directly with wind technology companies at various stages of the
technology development process. In some cases, companies are vertically integrated actors, but in
this sector it is more common to build a supply chain using different actors at different stages of the
technology development process with varying levels of interactions. The levels of interactions
greatly depend on the technology development strategy of the firm in question, as well as the
technology acquisition, transfer, or innovation model used. Because of this variation, examples of
specific firm-level strategies are explored in more detail in the next section.
Pricing and Subsidies
The first major Chinese policy to support wind power specifically came in 1994 when the
government, with help from what was then the Ministry of Electric Power, released the Provisions
for Grid-Connected Wind Farm Management. However, it was not until the 2003 onshore wind
resource concessions were awarded to developers through a competitive bidding process that
large-scale wind power development took off. The wind concession projects got off to a bumpy start
because of reported gaming with the bidding system, but they succeeded in helping the government
determine the current price for wind power in China and they set the groundwork for the
establishment of feed-in tariffs, or fixed, subsidized wind power prices (Lewis 2016a).
In August 2009, the National Development and Reform Commission (NDRC) released the Notice on
Policy to Improve Grid-Connected Power Pricing for Wind Power Generation, which established the
first national feed-in tariff for wind power in China (NDRC Pricing Department 2009). Before the
feed-in tariff, projects were developed with different rules and different pricing agreements. Having

61
a unified pricing policy made it easier for project developers to predict the market and for
manufacturers to plan their technology production. The policy set four feed-in tariff levels across
the country, varying by region on the basis of wind resource class. Category I resource areas had
the best wind resources and therefore received the lowest tariff, while Category IV areas had the
poorest wind resources and therefore received the highest tariff. Setting a higher tariff in low-wind
resource regions encouraged wind power development despite lesser opportunities for electricity
production (Lewis 2016a). Onshore feed-in tariffs for wind have been revised twice since the 2009
rates were initially established. The 2016 rates range from 0.47 to 0.60 yuan per kilowatt-hour, and
will be reduced to 0.44–0.58 yuan per kilowatt-hour beginning in 2018 (GWEC 2016).
A “concession” (open bidding or tendering) program to support offshore wind development, similar
to the early wind concession program for onshore wind development, was initiated in May 2010. It
presented four offshore wind projects in Jiangsu Province, located in Binhai (300 megawatts),
Shenyang (300 megawatts), Dafeng (200 megawatts), and Dongtai (200 megawatts). One major
difference in the requirements for eligible bidders for these offshore concessions from the earlier
onshore concessions was that no foreign-owned companies were permitted to apply for the
offshore projects. The only way that foreign-owned companies could participate was as part of a
Sino-foreign joint venture where the Chinese partner held over a 50 percent controlling share in the
company. Foreign-owned turbine technology was technically not excluded from the bids; however
it is proving increasingly rare in China for Chinese-owned developers to partner with foreign-
owned turbine manufacturers, particularly because many Chinese developers already have existing relationships with Chinese technology suppliers (Lewis 2016a). Offshore wind development has
proceeded slower than expected, but lofty offshore targets have pushed R&D into these larger,
more advanced wind turbine designs.
Technology Transfer and Localization Mandates
While framework policies set the national stage for the promotion of renewable energy and pricing
policies promoted its deployment, another set of policies were specifically aimed at promoting
technology transfer and the localization of wind power technology. This section reviews some of
the key policies that were implemented at the national level. There are also numerous reports of
“unofficial” practices that either encourage or explicitly require technology transfer in firm-to-firm
interactions that are not enshrined in official government policies.
One of the first policies that encouraged local manufacturing dates back to 1997. Called the Double
Increase Program, it aimed to double the 80 megawatt of wind capacity that was then installed in
China while encouraging local content to be incorporated into the turbines used. However, the
future outlook for wind power use in China was probably too uncertain, and 80 megawatts was too
small a quantity to encourage local manufacturing by turbine suppliers at this stage. Additionally,
local content requirements conflicted with the requirement of most foreign government loans,
which were already being used to support many wind farm ventures in China. These loans were
typically in the form of tied-aid that came from various foreign governments (including Denmark,
Germany, and the United States) to support the sales of their own domestic wind farm technology
to China. The tied-aid from foreign governments helped to subsidize the cost of early wind power
development in China. About 74 megawatts of wind power was successfully installed under this

62
program, essentially meeting the program target (Ministry of Science and Technology, State
Development Planning Commission, and State Economic and Trade Commission 2002).
The 1997 Ride the Wind Program was the first policy to explicitly encourage wind power
technology transfer from foreign to domestic firms. Two joint venture enterprises were established
to manufacture wind turbines domestically, with the government selecting the firms that were to
participate rather than the match’s being commercially driven. The technology transfers carried out
through this program started with a 20 percent local content requirement, with a goal of increasing
this share to 80 percent as learning on the Chinese side progressed (Lew 2000). The Spanish-
Chinese joint venture between Made and Yituo focused on a 660-kilowatt turbine, whereas the
German-Chinese joint venture between Nordex and Xi’an Aero Engine Corporation focused on a
600-kilowatt turbine transferred by Nordex. The Ride the Wind Program’s success was limited, a
failing that many foreign companies attributed to their being unable to choose their Chinese
partners. The government selected companies from industries that it believed to be appropriate to
wind technology—primarily the aerospace industry—but that in reality had little experience or
interest in manufacturing wind turbines. This problem was not unlike what occurred in the early
years of the wind industry in the United States, and China fell far short of its target of 1,000
megawatts of wind by the year 2000. Members of the wind industry blamed the shortcoming on
murky approval procedures and unrealistic local content requirements (Lewis 2013).
The wind concession projects were the first meaningful instances in which the use of locally made
wind turbines was requested and rewarded. While earlier guidelines required that all wind farm
projects approved by the NDRC during the 9th Five-Year Plan (1996–2000) included wind turbine
equipment containing at least 40 percent locally made components, by the 2003 wind concession
program that percentage had increased to first 50 and then 70 percent. Because there were very
few Chinese turbine manufacturers at the time, these local content requirements mainly affected
the foreign wind turbine manufacturers, causing most of them to establish manufacturing facilities
in China.
China’s local content requirement for wind turbines was further institutionalized in the 2005 NDRC
Notice on the Relevant Requirements for the Administration of the Construction of Wind Farms
(NDRC 2005). The notice clarified that if the localization rate for the project was less than 70
percent, it would not be allowed to be built. Although some components were still expected to be
imported, the customs administration applied import duties on any wind equipment brought into
China from abroad. The 2005 requirements also clarified that wind farm projects with outputs
greater than 50 megawatts must be approved by the NDRC, while the provincial or local
Development and Reform Commission authorities would approve projects less than 50 megawatts.
Various preferential tax policies have also been directed at wind technology equipment
manufacturers over the past decade. For example, the 2005 Renewable Energy Law called for new
tax benefits to be put into place to promote industrial development in renewable energy. This law
led to the Renewable Energy Industrial Development Guidance Catalog, which gave special tax
status to wind power generation projects and equipment manufacturers and it led to the Enterprise
Income Tax Law, which levied reduced income tax rates on wind manufacturers (Lewis 2013).
63
Research and Development Programs
The Ministry of Science and Technology (MOST) has subsidized wind energy R&D expenditures at
varied levels over time. In an effort to help Chinese turbine manufacturers develop new products
and technologies, MOST funded research to develop technologies for 600-kilowatt machines as part
of the 9th Five-Year Plan (1996–2000), then moved on to supporting the development of megawatt-
size wind turbines, including technologies for variable pitch rotors and variable speed generators,
as part of the 863 National High Tech R&D Program. The 11th Five-Year Development Plan of
Science and Technology (2006–10) included support for the commercialization of 2- to 3-
megawatt-sized wind turbines.
In 2008, the Ministry of Finance announced the Interim Measures on Management of Special Project
Funds for the Industrialization of Wind Power Generation Equipment, which provided funding
support for the commercialization of wind power generation equipment (Ministry of Finance
2008). The policy specified that for all “domestic brand” wind turbines (with more than 51 percent Chinese investment), the first 50 wind turbines over 1 megawatt produced would be rewarded with
600 yuan per kilowatt (€60) from the government. The measures further required that the wind
turbines be tested and certified by CGC. The National Energy Bureau has reportedly granted
licenses to 16 national energy research and development centers for research topics such as blade
R&D, large-scale grid connected wind power systems, and offshore wind power equipment (Li, Shi,
and Gao 2010).
Industrial and Trade Policies
In addition to explicit technology transfer policies, trade policies have been used in a variety of
ways over time to try to encourage different modes of local manufacturing and industry
development. For example, in 2001, the Ministry of Finance and State Administration of Taxation
guidelines on the taxation of wind turbine imports stated that wind turbine components for
turbines larger than 1.5 megawatts were exempt from customs duties and import sector value-
added tax, while complete wind turbines less than 3 megawatts were subject to normal taxation.
These guidelines discouraged the import of complete wind turbines and supported local
manufacturers needing access to foreign components (Ministry of Finance and State Administration
of Taxation 2001).
In 2009, U.S. Commerce Secretary Gary Locke traveled to China to ask for the removal of the local
content requirements, arguing that it was a trade barrier for foreign firms. China agreed and
recalled the requirement in the November 2009 Notice on Abolishing the Localization Rate
Requirement for Equipment Procurement in Wind Power Projects. Although this recall was viewed
as an achievement for foreign manufacturers, it was likely to have little impact in the Chinese wind
sector, where foreign firms had already established in-country manufacturing facilities. At the same
time, there were concerns at the highest levels of government about the health of the Chinese wind
sector because of reports of substantial overcapacity. In August 2009, the State Council listed wind
turbine production as an “excess capacity sector,” causing the Ministry of Land and Resources
reportedly to deny all applications for new wind turbine manufacturing facilities. In 2009, there
64
were reportedly 83 wind producers with annual production capacity exceeding 50 gigawatts, while
annual demand that year was closer to 10 gigawatts.
It is worth noting that protectionism is not just a cross-border phenomenon; local Chinese firms
experience protectionism when they try to move into other provinces. For example, Goldwind has
benefited from the development of wind power in its home region of Xinjiang. However, Xinjiang
has little remaining exploitable wind resources to develop. To maintain its position as the world’s
largest wind turbine supplier, Goldwind will have to increase sales in other Chinese provinces,
where it will also have to compete directly with Guodian United Power, Ming Yang, and CSIC, all of
which have received preferential treatment in their home provinces (Shepherd and Hornby 2016).
In early 2010, the Chinese Ministry of Industry and Information Technology released the draft Wind
Power Equipment Manufacturing Industry Access Standards27, which aimed to “promote the
optimization and upgrading of the industrial structure of the wind power equipment manufacturing
industry, enhance enterprises’ technical innovation, improve product quality, [and] restrict the
introduction of redundant technology” to “guide the industry’s healthy development.” This was to
be accomplished by restricting the operation of wind turbine manufacturers that did not have the
capability to produce a 2.5 MW or larger turbine, did not have at least five years of experience in a
related industry, and did not meet various financial, R&D, and quality-control requirements. It was
thus an attempt at large-scale industry consolidation and weeding out smaller firms with inferior
technology. It aimed to address the issue of continued overcapacity in the industry, particularly of
low-quality wind turbines, while encouraging the development of larger, more advanced wind
turbines and their components (Kirkegaard 2015). While this regulation was never fully
implemented, it became increasingly difficult for smaller turbine manufacturers to compete with
the larger state-backed firms who were given preferential access to projects and other intangible
benefits.
Course Corrections and Lessons Learned
Electricity versus Capacity
China made perhaps one of the world’s most common mistakes in promoting wind power
development when in its early push to encourage installed capacity, it failed to pay sufficient
attention to the actual electricity being generated by the wind turbines. Targets for wind power were in megawatts rather than megawatt-hours and were accompanied by direct incentives, even
though tariffs paid were based on actual electricity produced. In addition, wind farm developers
build projects before the grid has been extended to the project location. The often-remote locations
of China’s best wind resources lead to difficulties in transmitting China’s wind power to population
centers, and many completed wind farms sit idle while they wait for the construction of long-
distance transmission capacity.
Financial incentives have since been changed such that investors no longer receive subsidies for
investment in new wind projects but only for the feed-in tariff on the basis of actual electricity
produced. However, these changes have not solved the problem of delayed grid connection or of
curtailment because delayed grid connection is often due to the approval process for wind projects.

65
Developers often split up larger projects to avoid the requirement that projects greater than 50
megawatts in size must obtain central government approval, and instead the developers just obtain
provincial-level approvals. Because grid planning is done primarily at the central level, this work-
around has led to delayed interconnections.
For many years, specific actors within the government have been trying to encourage the passage of
a regulation to establish a renewable energy (RE) quota on power producers. Similar to a
renewable portfolio standard, the program would set specific RE quotas on the power generators
and would track compliance with renewable energy credits (RECs). Trading could be restricted to
force local use of renewable electricity. That requirement would help reduce the incentives to
pursue installed capacity over generation, as well as help address the curtailment issue, discussed
further in the next section. A draft of the quota policy was released in December 2012 by the
Chinese National Energy Administration (NEA), but it was not passed until March 2016, and by that
time the draft had been significantly weakened both in terms of obligations and enforcement
mechanisms (Cheng 2016).
There are some problems associated with this transition. First, there is still much debate among
Chinese policy makers about whether to shift from a feed-in tariff to RECs. If there is overlap in the
timing of these policies, then RECs will need to compete with the feed-in tariffs and generators
would be unlikely to sell RECs unless the prices were equivalent to the feed-in tariff rate. There are
also uncertainties associated with receiving feed-in tariff income currently so that might encourage
some generators to participate in the REC market instead to reduce risk of receiving payment. Third
party certification programs will be needed for the voluntary market to effectively drive new
renewable energy development. There are also potentially problematic interactions with carbon
policies, including the developing cap and trade program. If RECs are permitted to count for
compliance in carbon regulations and a Renewable Portfolio Standard, then double counting of
carbon benefits could occur. For any market based system, better data, accountability and
transparency, supported by independent verification, will be required for the market to function
efficiently and effectively.
Curtailment Woes
Today, the biggest challenge facing China’s wind sector is integration: making sure the wind power
being produced by China’s wind farms is absorbed by the grid and consumed. In 2015, 15 percent
of China’s wind-generated electricity was curtailed, a record high until 2016, which was expected to
see even higher rates after a 19 percent national curtailment rate was reported for the first three
quarters of 2016 (NEA 2016). Curtailment leads to major losses for wind farm operators, and from
an environmental perspective leads to wasted pollution-free electricity (Lewis 2016b).
Addressing wind curtailment has been the focus of several policies introduced by the government
going back to 2011. That year, NEA issued 18 new technical standards targeting curtailment and
performance issues in the wind sector, including a Notice on Strengthening the Management of
Wind Power Plant Grid Integration and Operation, which introduced new grid codes aimed at
preventing disruptions from wind turbines, and the Provisional Management Methods for Wind Power Forecasting, which required all wind farms to install wind forecasting systems to better

66
predict power output in advance and help with dispatch planning. The introduction of new grid
codes included low-voltage-ride-through capability, which ensures that wind turbines do not
disconnect from the grid despite short disruptions in the voltage of the grid. Overall, grid codes
require wind power plants to have more or less the same operating capability as conventional
power plants to ensure the security and reliability of the power system. Such a requirement has
become increasingly critical as the penetration of wind power into the power system has increased
(Kirkegaard 2015).
In further attempts to deal with the curtailment issue, numerous additional policies have been
released. Most recently in March 2016, NDRC released the Measures for the Administration of
Guaranteed Acquisition of Renewable Energy Power Generation, an extensive regulation detailing
how renewable energy should be given priority on the grid, and that any grid company that
restricts generation must compensate it for the curtailment (NDRC 2016a). In July, NDRC also
issued a notice on the preferential power generation pilot scheme for renewable energy peak load
units, which states that the peak of renewable energy should be used locally, and interprovincial
transfers should be encouraged when necessary. It also restricts curtailment rates of renewables to
less than that of fossil fuels (NDRC 2016b).
Technology Transfers in China’s Wind Industry
Consistent policy support specifically targeting Chinese firms has led to the emergence of a Chinese
wind technology manufacturing industry primarily built on foreign technology transfers. European
and American wind turbine manufacturers were demonstrating their technology in China as early
as the mid-1980s. These demonstrations created opportunities for learning, led to local
partnerships, and eventually led to technology transfers from these overseas companies to local
Chinese companies, whether in the form of intellectual property, skilled personnel, or other
informal means of knowledge transfer (Lewis 2013).
The mid-1990s saw the establishment of the first Sino-foreign joint ventures in wind turbine
manufacturing, and the first Chinese-owned wind turbine manufacturers were established in the
late 1990s. By the mid-2000s, many new Chinese manufacturers had entered the Chinese market,
and today Goldwind, the most successful wind company in the world in terms of global market
share, hails from China (Shankleman 2016). Although Chinese firms still lag in novel and frontier
innovations in this sector, they are producing world-class technology that has dominated within the
Chinese market and is increasingly being sold outside the Chinese market.
Models of Technology Transfer
Designing a new generation of wind turbines can take many years, requiring skilled mechanical and
electrical engineers with a high level of tacit knowledge (Kirkegaard 2015). Adaptations to climate,
wind speed and profile, and local grid codes are examples of more incremental innovations to wind
turbine technology in recent years. More sophisticated innovations include structural changes to
the rotor, hub, or drive train, but because of interactions between all of these components, changing
one may require changing others (Kirkegaard 2015). There is also a broader set of skills required
for wind farm siting and construction, ranging from hardware (large cranes) to software (for
optimal siting on the basis of topography, wind speeds, and so on.).

67
The entry barriers for new companies in the turbine business are rather high, particularly in
developed countries where financial backers usually require a minimum of 100 turbine-years of
performance data. In developing countries, limited indigenous technical capacity and quality
control make entry even more difficult. International technology transfers can be a solution,
although leading companies in the industry are unlikely to license proprietary information to
companies that could become competitors. This solution could be even riskier for technology
transferred from developed to developing countries, where an identical but cheaper turbine
potentially could be manufactured (Lewis 2013).
A common strategy among latecomer firms has been to obtain, through a technology transfer, a
technology from a company that has already developed advanced wind turbine technology.
Technology transfers can occur through many different models. One model is through a licensing
agreement that gives the licensing firms access to a certain wind turbine model, often with
restrictions on where it can be sold. Another model includes establishing joint-venture
partnerships between two companies, either to share a license or for collaborative research and
development. Firms also can opt to jointly develop a new technology design (joint development)
and then share the associated intellectual property without forming a new company or a joint-
venture enterprise. If a firm has the capacity and means, it can also obtain access to technology
through the purchase of ownership rights in a company with the desired technology or through
other forms of mergers and acquisitions (M&A) (Lewis 2013).
The evolution from licensing, to M&A, to joint development in partnership with international firms
that is illustrated in the case of Goldwind can also be seen on a larger scale. Very few firms, once
they have moved beyond relying on their licenses, move back to that technology transfer model.
Instead, they develop new international partnerships to develop new turbine designs when outside
knowledge is needed. Also, it takes firms that came after the early pioneers in China less time to
move from licensing to having international R&D centers. For example, Goldwind licensed its first
wind turbine in 1989, and 23 years later, in 2012, it opened its first overseas R&D unit based on
indigenous knowledge. In contrast, Ming Yang licensed its first turbine in 2006 and opened its first
overseas R&D center in 2009.
Technology Networks In recent years, as new national industries were established in emerging wind markets including in
China, India, and Korea, a common pattern that emerged was that local firms licensed designs from
established manufacturers before moving on to indigenous R&D. As illustrated in figure 3.10, many
wind turbine manufacturers based in China (red), India (orange), and Korea (light green) licensed
technology from the same set of smaller, wind turbine design and engineering companies, most
commonly based in Germany (purple) but also based in the United States (blue) (Lewis 2013).
When a firm shares licenses with multiple firms, or engages in joint development with multiple
firms, it creates a network of firms through which knowledge can be shared. Although such sharing
of information is often restricted through contractual agreements, in other cases it is encouraged
and can have both positive and negative consequences for firms. Such networks increase access to
global learning and experience worldwide, often benefiting the participants. However, networks
that facilitate information sharing in this way can also create competitors and make it harder to
safeguard valuable or sensitive information (Lewis 2013).

68
Key companies that have served as the source of wind power technology transfer for many of the
manufacturers located in China, India, and Korea (and beyond) are Avantis, Windtec, REpower,
Aerodyn, Fuhrlander, Norwin, and Vensys. It is notable that these companies are either small
manufacturers that are not competing with the companies they have licensed to in the Chinese,
Indian, or Korean markets or they are primarily engineering design firms with little to no
manufacturing experience. One exception is REpower, which has become a top-tier global
manufacturer in recent years and is now selling directly to many overseas markets (Lewis 2013).
Avantis, based in Germany, has worked with both Hyundai in Korea and Yinhe in China to develop
wind turbines. Windtec, now a subsidiary of AMSC, not only has transferred wind turbine
technology to China (Sinovel, DEC, CSR Zhuzhou, SBW, and XJ Group), Korea (Hyundai and Doosan),
and India (Inox Wind and Ghodawat) but also has partnered with companies to produce wind
turbines in Germany; Japan; Taiwan, China; and Turkey. China’s DEC has also benefited from a
license from German firm REpower, the same firm that is now owned by India’s Suzlon and that
provided licenses to China’s Goldwind. DEC is also conducting joint development with German firm
Aerodyn, the same firm that works with Chinese firms Guodian United, CSIC Haizhuang, HeWind,
and Sewind.
German firm Fuhrlander has licensed wind turbine technology to China’s Sinovel and A-Power as
well as India’s Global Wind Power; Fuhrlander originally obtained this technology from Windtec. A-
Power has also worked with Danish firm Norwin, which has licensed and jointly developed wind
technology with A-Power and with Global Wind Power of India, Tecnometal in Brazil, and
Aeronautica in the United States. Global Wind Power also licensed technology from Dutch firm
Lagerwey and NEPC of India; the latter originally obtained its technology from Micon of Denmark.
German firm Vensys, now owned by Goldwind, has licensed wind technology to several firms
around the world, including Enerwind of Argentina (primarily selling to the Brazilian market),
IMPSA in Brazil, ReGen Powertech in India, Eozen in Spain, a Canadian subsidiary of Vensys, and
most recently CKD NOVÉ Energo in the Czech Republic and Slovakia (Lewis 2013).
Increased mergers and acquisitions are another way that firms in emerging economies have better
tapped into global knowledge. For example, as many Chinese wind turbine manufacturers have
become more sophisticated, they have increasingly established overseas R&D centers and cross-
border collaborative R&D links (Kirkegaard 2015; Lewis 2011; Ru et al. 2012). For example,
Goldwind acquired Germany’s Vensys Energy, and XEMC Windpower took over Darwind. Shanghai
Electric has engaged in a strategic alliance in the form of a joint venture with Siemens, and Envision
has established its Global Innovation Center in Silkeborg, Denmark, engaging in various R&D
collaborations with Danish firms, research institutes, and universities (Kirkegaard 2015). Envision
has also established facilities in Japan and the United States, and it has hired employees who
formerly worked at leading wind companies (Kirkegaard 2015).
Increasingly, Chinese firms are engaging in international collaborations to improve their
technology. An example is Chinese firm Windey, which was a spin-off company created by
researchers from the Zhejiang Institute of Mechanical and Electrical Engineering (China) and
therefore has a strong research background. Windey has collaborated with Siemens on a test
platform, sending some of its employees to Germany, and it has collaborated with DNV-GL
(formerly Garrad Hassan) (Kirkegaard 2015; Lewis 2013).

69
These developments have reduced the cost of wind turbines and their components significantly, a
contributing factor to the recent increases in new installed wind capacity in China.
Case Study: Siemens (Germany)
Siemens AG is a diversified industrial company with a wind energy subsidiary that has been active
since 1980. For the past few years, Siemens Wind Power and Renewables has dominated the
offshore European wind energy market. Although offshore wind is a small percentage of global
wind capacity today, it is expected to grow as a share of the global wind sector in the next five
years. The most recent financial results from the division reported a doubling in profitability,
driven by higher productivity and contribution from services.
Siemens is a useful company to study for Chinese wind manufacturers because of its technological
focus on the offshore wind sector. Although on paper China’s Sewind installed the most offshore
wind capacity in 2016 at 489 megawatts, these installments included 388 megawatts of Siemens
wind turbines built under license, showing how in reality, Siemens technology is already central to
the domestic Chinese offshore wind sector. Siemens spends up to 6 percent of revenues on R&D, the
highest amount of any German industrial firm. Recently, China’s Goldwind announced that it would
establish a new subsidiary in Denmark to track technological research and industry development.
This move follows the establishment of a similar R&D division there by Envision Energy.
Test facilities are one way that Siemens Energy advances its wind turbine technology. Its two main
facilities in Denmark feature test stands for major components of turbines, including generators,
main bearings, and complete nacelles. In Aalborg, seven blade test stands are able to perform full-
scale tests of rotor blades, including the world’s largest blade in operation with a length of 75
meters. Such efforts pay off in concrete efficiency improvements that lower the costs to project
developers. For example, Siemens recently announced that it had increased the output of its
offshore wind turbines from 7 to 8 megawatts. The new turbines generate up to 10 percent more
electrical energy per year under offshore wind conditions. This capability is part of an effort to
produce offshore wind energy at a total cost of less than 10 Euro cents per kilowatt-hour by 2020.
Siemens’s new wind turbine can generate up to 10 percent more energy per year, depending on its
location. (Siemens 2016.)
Looking Ahead The cooling of China’s wind sector in 2016 had a noticeable impact on domestic manufacturers.
Goldwind lost its spot as the top global manufacturer to Vestas and Siemens and total installations
in China fell 21 percent to 22.8 gigawatts (from 29 gigawatts in 2015). China’s wind sector is facing
policy uncertainty as feed-in tariffs are phased out and replaced by a program of renewable energy
credits. It remains to be seen how smoothly this transition proceeds, and the extent to which new
renewable energy credits can address the curtailment issues. Amid what will surely be an
unpredictable few years in China’s onshore wind sector, and with the clear need for innovation to
drive the offshore wind sector, it could be the right moment for Chinese firms to focus incentives
and other policies on promoting innovation to service the offshore wind segment.

70
4. China’s Solar Power Technology Sector
Venture Activity
Admittedly, venture capital funding overall has
declined in recent years for clean energy sectors, and
solar PV is now a mature sector, implying that it is
less likely to be a target for venture capital in a way
that a more nascent industry may be. But solar PV
investments in the form of Seed or Series A capital
which are two investment types most closely
associated with innovative activity have not
disappeared in peer countries: in the United States,
71 total deals occurred in this period, which were
valued at approximately $170 million. No such
investments were recorded in China’s solar PV sector
between 2014 and 2016.
R&D
Looking at the solar sector in China, R&D data tell a
more encouraging story. Public R&D spending in
2016 was $1.2 billion in the solar sector, by far the
highest of the other five countries being considered.
Chinese spending was also higher than those other
markets when weighted by gross domestic product.
That result suggests that although China may still lag
other countries in its overall public spending on clean
energy R&D, the solar sector is an exception and has
already experienced a notable ramp-up in public
support. The same trend does not exist for
companies, however, as corporate R&D spending by
solar companies was a mere $63.7 million, much
lower than the other countries, with the exception of
the United Kingdom.
Patents
Since the 1990s, global patenting related to solar photovoltaic technology has soared. However, if we look at the numbers of patents granted by highly developed, international patent agencies, such as the EPO or the USPTO, we see that Chinese firms and inventors have contributed very little to this surge. The United States, Japan, and Germany have led the way in patenting. Chinese firms have generated substantial numbers of patents at home, but they patent a tiny fraction of those “inventions” outside their home country. The patent count and the patent citation analysis lead
us to conclude that it is not innovation, per se, that
has fueled the rise of China’s solar PV industries.
Rather, in the case of China's solar PV industry,
foreign demand was the key driver—strong
subsidies in European markets implemented after
the Kyoto Protocol was ratified by western European
states played a particularly important role in growing
the market that Chinese firms served.
Learning & Cost Declines
Chinese Solar PV cell producers may not be
generating internationally patented products, but
they have dramatically reduced costs in a relatively
short period of time. Solar PV cell and module prices
have declined substantially throughout the past two
decades, particularly within the past five years, with
the most substantial cost declines in China. Cost
reduction has come through the performance of PV
cells indicated by overall efficiency. Chinese firms
have seen rising efficiencies over time from learning
by doing in large-scale manufacturing leading to
process innovations.

71
China’s solar manufacturing industry first emerged in the 1990s but really took off in 2000,
representing half of global photovoltaic (PV) production by 2010. Until 2011, over 90 percent of
Chinese production was exported, primarily to the German solar market. In fact, Germany’s PV
demand drove much of the increase in manufacturing capacity in the Chinese solar industry. That
situation is in stark contrast to the Chinese wind industry, which grew almost exclusively around
locally driven demand. As a result, the policies designed to support the Chinese PV industry
emerged differently and with different timing from the wind power industry. Domestic subsidies
and industrial policies came late in the solar industry’s development, driven not by an attempt to
grow the manufacturing base but rather by an attempt to save the industry by growing the
domestic market after the global economic downturn caused declining solar demand in overseas
markets. As a result, by 2015, China had become the top country for installed solar capacity, adding
15.2 gigawatts to reach a total of almost 44 gigawatts and overtaking longtime leader Germany
(REN21 2016).
Solar Power Development Although all stages of the PV production process (silicon purification and production, ingot and
wafer production, cell production, and module assembly) are represented in China, the
downstream segments of cell production and module assembly initially dominated Chinese
production because of lower barriers to entry. Foreign firms led in the upstream segments of silicon
purification and ingot and wafer manufacturing, which are more high-tech processes and had
higher barriers to entry until 2009, when these areas began to rapidly expand in China as well.
A variety of positive and negative forces are at play in the sector today. On the positive side, Chinese
solar firms have succeeded in gaining significant market share globally in the past five years, and
new capacity installations in China continue to lead other countries by a wide margin. These scale
and manufacturing efficiencies, many of which were introduced in the Chinese market, have
resulted in a sharp decline in the average price of solar PV panels. That factor is making solar PV
cost competitive in some auctions (without subsidies) for the first time in early 2017.
But amid these positive developments are also worrisome signs. Falling solar PV prices have
resulted in softening investments in the sector as investors see better returns from alternative
clean energy categories. These lower prices have also eroded margins at some of the larger Chinese
(and global) solar manufacturing firms, putting pressure on those firms to rethink their business
models and financing strategies. To compound this challenge, the Chinese market currently has an
oversupply of solar PV modules, suggesting that sector investment and sales from leading
companies are unlikely to increase significantly in 2017.
This backdrop of both positive and negative trends underlines how the solar PV sector in China is at
a crossroads. Innovation—to the extent that it can add new product value and revenue streams to
existing companies, as well as generate new China-based ventures—is one approach to invigorating
the sector. During a similar period in 2012 when firms in China exerted pricing pressure on many
global solar manufacturers, most of the largest Chinese firms today gained significant intellectual
property (IP) and research and development (R&D) through acquisition. That trend is supported by
data showing that between 2012 and 2014, approximately 30 mergers and acquisitions (M&A) took
place between Chinese solar firms and smaller, mostly non-Chinese firms.28 That acquisition trend
was reinforced by a requirement that called for solar firms to be on a list of approved

72
manufacturers in order to qualify for domestic feed-in tariffs. That requirement provided further
incentive for foreign firms to pursue links and knowledge exchange with companies in China.
Given that the sector has already undergone significant consolidation in the past five years, the
Chinese solar PV sector will need a new approach to innovation over the next five years. Following
the high M&A volume between 2012 and 2014, only four such mergers or acquisitions have been
recorded since then. So although this model of acquiring IP and R&D value may continue on a
smaller scale through 2020, it is unlikely to propel the sector forward on its own. A recent study from the Asian Development Bank assessed the relative strength of top countries on innovative
capacity and comparative advantage in manufacturing of climate change mitigation technologies,
including solar PV. The results were instructive: although China enjoys a comparative advantage in
solar PV exports that is greater than any other climate change mitigation technology analyzed, its innovative capacity is much lower (Fankhauser, Kazaglis, and Srivastav 2017).
In 2015, 5 of the top 10 solar firms were from mainland China: Trina from Changzhou, Jiangsu; JA
Solar from Shanghai; Jinko Solar from Shangrao, Jiangxi; Yingli Green from Baoding, Hebei; and
Shungfeng-Suntech from Wuxi, Jiangsu. In addition, Motech and NeoSolar are from Taiwan, China
(figure 4.1).
Figure 4.1: Solar Market Shares 2015
Source: Mints 2016.
The origins and technology strategies of Suntech and JA Solar are quite different and provide
interesting insights into the origins of the Chinese solar industry. These two firms are explored in
the cases presented later in this chapter.
Trina7%
JASolar7%
HanwhaQ-Cells7%
CanadianSolar5%
FirstSolar5%
JinkoSolar5%
Yingli5%Motech
4%NeoSolar4%
Shungfeng-Suntech4%
Other47%

73
Research and Development
At the United Nations Climate Change Conference in Paris in December 2015, the Chinese
government committed to “Mission Innovation,” whereby government signatories agreed to double
the amount of public R&D support for the clean energy sector by 2020.29 Chinese leadership is
clearly making good on that commitment: the latest government R&D spending in China was
approximately $2.5 billion in 2016, and it has been steadily increasing at a rate of between 5
percent and 10 percent annually. That government spending level is surely higher than most other
middle-income countries, but it still lags all of the peer countries when weighted by gross domestic
product. In this weighting, the Chinese spend about $112.6 million compared with the United
States, which spends more than double that amount ($282 million), and Denmark, which spends a notable $604.3 million Those figures illustrate the extent to which clean energy R&D is a
government priority in countries like Denmark that have excelled around green innovation (BNEF,
2017).
Corporate R&D spending reveals different trends in the Chinese market that should be concerning,
given the goals to embed business model innovation in green markets there. Overall corporate R&D
spending in China in 2016 was a mere $170.7 million, a significant decline from 2015 when
spending was closer to $700 million. Comparatively, those corporate numbers are extremely low.
Companies in the United States spent $3.6 billion in the same period, and those in Japan spent $4.8
billion. When weighted by the relative size of each economy, these data are equally concerning,
with Chinese companies spending about 1 percent of what companies in Japan spend on corporate
R&D.
Yet looking at the solar sector in China, these data tell a more encouraging story. Public R&D
spending in 2016 was $1.2 billion in the solar sector, by far the highest of the other five countries
being considered. Chinese spending was also higher than those other markets when weighted by
gross domestic product. That result suggests that although China may still lag other countries in its
overall public spending on clean energy R&D, the solar sector is an exception and has already
experienced a notable ramp-up in public support. The same trend does not exist for companies,
however, as corporate R&D spending by solar companies was a mere $63.7 million, much lower
than the other countries, with the exception of the United Kingdom.
Venture Activity
Although M&A activity in the Chinese solar PV sector has been limited in the past three years, other
forms of nongovernmental venture activity closely associated with start-ups and innovation have
been practically nonexistent. Consider Seed and Series A funding—two investment types most
closely associated with innovative activity in a market. No such investments were recorded in
China’s solar PV sector between 2014 and 2016.
Admittedly, venture capital funding overall has declined in recent years for clean energy sectors,
and solar PV is now a mature sector, implying that it is less likely to be a target for venture capital
in a way that a more nascent industry may be. But solar PV investments in the form of Seed or
Series A capital have not disappeared in peer countries: in the United States, 71 total deals occurred

74
in this period, which were valued at approximately $170 million. Many U.S. firms that receive the
highest volumes of investment focus on software and other technology solutions, rather than on PV
production and manufacturing. This early-stage investment trend confirms the observation that
much of the innovation focus in solar PV is shifting from the panels themselves to the systems
within which they operate.30
Yet when considering government-linked venture capital, the story could be quite different. In
2015, up to 780 government-linked venture funds existed in China with more than $300 billion under management, a tripling of these funds compared with the prior year (Oster and Chen 2016).
That enormous amount of capital dwarfs that associated with private venture capital firms and
suggests that significant government-backed Seed and Series A funding could exist from domestic
sources in China. But because of limited data on these funds and how, if at all, they have been
disbursed to firms in the solar PV sector, it is premature to draw definitive conclusions about how
they might positively support innovation in the future.
Such expansive funding could be leveraged in China in positive ways. First, those investors may be
willing to support riskier projects than their private venture capital counterparts, invigorating the
early-stage companies and R&D that until this point have been less visible in the Chinese solar PV
market. Second, this abundance of capital could be deployed to recruit talent and technical
expertise from other markets to support product development in the Chinese market, particularly
in areas such as software that supports distributed solar systems or solar plus storage, an area in
which the Chinese have less experience. Third, the government links that these funds enjoy on the
provincial and national level could provide stability to these investments as they mature.
Case Study: First Solar (United States)
First Solar (FS) is both a supplier of solar panels and a developer of its own large solar farms. FS
differs from its competitors because its model for company growth centers on research and
development (R&D), investing significantly in a new generation of thin-film cells made of a
compound of cadmium and tellurium (CdTe). FS spends 4 percent of total revenues on R&D, nearly
double the industry average, funding that supports a dedicated R&D lab in Santa Clara, California,
strategically located in proximity to Silicon Valley’s scientific and engineering talent pool.
After several years of testing, FS recently achieved an efficiency record for its CdTe cells of 22.1 percent in the lab, surpassing silicon-based cells for the first time. CdTe cells are also easier to
produce than silicon-based cells, with analysts estimating their manufacturing cost at 60–70 cents
per watt compared with 69–80 cents per watt for silicon. FS is betting that this R&D expenditure
will result in lower production costs and greater efficiency for its customers, boosting the
company’s long-term profitability and competitive advantage in a market that is under significant
pressure from rapidly falling prices and the phaseout of subsidies in many large markets.
FS’s focus on innovation has been achieved by consistent investments in company assets like the
Santa Clara lab, as well as external acquisitions. In 2013, FS acquired General Electric’s global CdTe
solar intellectual property portfolio. Although CdTe panels were still cheaper to manufacture, their
efficiency lagged behind that of silicon-based cells significantly. Given FS’s established business and
long-term commitment to silicon alternatives, the acquisition provided an infusion of new
75
intellectual property and know-how to develop further through its own R&D activities. In addition
to the intellectual property, GE Global Research and FS R&D formed an agreement to collaborate
further on R&D from 2013 to 2016.
This model of intellectual property acquisition combined with research partnership is one way that
other solar firms can approach embedding R&D and innovation in their business.
Leaders in China’s Solar Power Technology Sector
Suntech: A Case Study
Suntech was China’s first globally successful solar brand, led by the world’s first green billionaire,
former Chief Executive Officer Shi Zhenrong. It was China’s first private solar company and the first
private Chinese company to list on the New York Stock Exchange, raising $520 million when it was
offered in 2005.
The origins of Suntech as well as its technology come almost entirely from its founder, Shi
Zhenrong. Shi grew up in a poor farming community on the Yangtze River in Jiangsu Province, near
where he established his company. He was selected for a Chinese government merit scholarship to
study abroad and went to the University of New South Wales to pursue his PhD in physics. He was
there in 1989 during the Tiananmen Square massacres and was one of more than 40,000 Chinese
students granted permanent Australian visas at that time.
The first company Shi worked for was a spinoff of the University of New South Wales founded by
his PhD adviser, Professor Martin Green and a colleague. That company, Pacific Solar, was
established to commercialize solar technologies they had developed in their lab. Shi left Pacific
Solar when he felt that it overly focused on advanced solar R&D and not on the production of
simpler technology that was already ready for deployment and that he thought would have been
more effective. As a result, he decided to move back to China. Using his savings, along with his
professional network and extensive solar industry know-how, plus important support from the
local government where he grew up, he formed Suntech in Wuxi, Jiangsu Province, in 2001 (Clifford
2015).
The city of Wuxi agreed to invest $6 million in Shi’s company in exchange for 75 percent ownership
(Hopkins and Li 2016). Li Yanren, the former director of the city’s Economic and Trade
Commission, became Suntech’s chairman of the board. Shi acquired 25 percent ownership of the
company by contributing $400,000 of his personal savings (Hopkins and Li 2016). Between 2003
and 2004, the city gave Suntech low-interest, guaranteed bank loans of Y 50 million (approx. US$ 7
million), plus helped it with nine grants worth Y 37 million (approx. US$ 5million) from the
technology commercialization and industrialization fund of the central government and the Jiangsu
provincial government (Hopkins and Li 2016).
Suntech expanded quickly. In 2007, it opened its U.S. headquarters in San Francisco and in 2008
opened offices in Australia, Germany, the Republic of Korea, and Spain. The company gained
international recognition and was asked to participate in many high-profile solar installations—
from the Beijing Olympics Bird’s Nest stadium to the Yas Formula One race track in Abu Dhabi
(Clifford 2015). By 2011, Suntech had 10,000 employees in Wuxi. Chief Executive Officer Shi

76
Zhenrong gained an international reputation as being one of the richest men in China and has been
referred to in the media as both a “solar billionaire” and a “hero of the environment” ( Green 2007;
Watts 2008).
Suntech had several strategic partnerships with foreign firms to build its expertise. In August 2002,
Suntech launched its 15-megawatt solar cell production line, in part using equipment acquired from
the bankrupt U.S.-based Astrosolar (Hopkins and Li 2016). Suntech also acquired parts and
equipment from multiple Chinese and Japanese companies, as well as an Italian lab.
In August 2006, Suntech acquired MSK Corporation, one of Japan’s largest solar manufacturers specializing in building-integrated PV (Suntech 2016). The company also focused more on innovation than other Chinese solar firms. Suntech had reorganized its imported technology to fit local conditions, for example, by replacing automated tasks with low-cost labor. In 2008, it established the Suntech Photovoltaic Technology Research Institute to focus on R&D. In 2009, it built a PV module testing lab facility. Because solar technology was relatively mature by the time Suntech entered the market, most of Suntech’s innovations were incremental, focused primarily on cell efficiency, for which it broke several international records. The capacity of Suntech’s first line exceeded China’s total production capacity of solar cells over the previous four years, yet Shi continued to expand even further while losing money. But for a while, Suntech was able to sell solar panels as fast as it could make them. Before its initial public offering, Shi convinced its public financiers to divest their stake in Suntech because of complications of state-owned shares of firms listed overseas, receiving returns over 13 times their original investments (Ahrens 2013). The company's most profitable year was 2010, with $238 million in net income, $3 billion in revenue, and more than 20,000 employees (Hopkins and Li 2016). Suntech’s fortune changed rapidly when the company found itself overextended and facing excess capacity with rapidly falling panel prices. The company was $1.6 billion in debt by March 2012. It was also a victim of the solar trade disputes discussed previously, its panels receiving an initial cumulative duty of 54.02 percent (an antidumping tariff rate of 33.08 percent plus a countervailing duty of 20.94 percent) in the U.S. market. The company defaulted on its U.S. bonds and filed for bankruptcy in March 2013. According to Shi, it was very difficult to manufacture entirely in China when 99 percent of Suntech’s market was overseas, because of the very different corporate and regulatory cultures in China and abroad. He blamed that difference for the company’s decline as well (Callick 2016). In 2007, 51 percent of Suntech’s revenue came from Germany and 35 percent from Spain (Ahrens 2013). In February 2014, Suntech was purchased by Shunfeng International Clean Energy Limited, a renewable energy investment company and independent power producer listed on the Hong Kong Stock Exchange, for Y 3 billion (US$ 0.4 billion). Shunfeng has also acquired a majority stake in the U.S.-based solar manufacturer Suniva, in part because the company is not subject to tariffs in the U.S. market. In June 2016, Shunfeng announced its plan to sell its solar business, including Suntech, to a Hong Kong–based investment company for $760 million, but that has not come to fruition (Mancheva 2016).
77
JA Solar and Innovalight: A Case Study
JA Solar is based in Shanghai but has a global footprint, including a U.S. headquarters in Silicon
Valley and a European office in Munich, Germany. Originally called Ningjin Jinglong-Zhong'ao Solar
Company Limited, the company was founded in May 2005. It was publicly listed on the New York
Stock Exchange in February 2007, when it established its first wholly owned subsidiary JA Solar in
the United States. JA Solar’s development and holding companies are registered in the Cayman
Islands and the British Virgin Islands. It also has its own R&D center in Shanghai, where it focuses
on improving module efficiency as well as the next generation of PV technologies (JA Solar 2016).
To gain an edge over its competitors in China, JA Solar embarked on an important technology
partnership with U.S. Silicon Valley start-up firm Innovalight in 2009. With support from Syracuse
University’s Department of Energy and the National Renewable Energy Laboratory, as well as about
$100 million in venture capital investment, Innovalight had developed materials using silicon ink
that integrates into the solar protection process and produces solar cells with higher conversion
efficiencies. The proprietary material is composed of silicon nanoparticles formulated into a screen
printable ink. The firm was unable to raise the capital needed to build a solar PV production facility
and was nearly bankrupt when it decided to partner with Chinese solar manufacturer JA Solar to
bring its technology to the market cells (Nahm and Steinfeld 2014).
JA Solar licensed Innovalight’s technology and then expanded the partnership to jointly develop a
new high-efficiency solar cell using Innovalight’s silicon ink technology. After successful initial
collaboration, the two firms signed a three-year agreement for the supply of silicon ink, as well as a
strategic agreement for the joint development of high-efficiency cells (Nahm and Steinfeld 2014).
The process of joint development allowed for the verification of Innovalight’s silicon ink technology
as a product that could contribute value to solar PV manufacturing. This success improved
Innovalight’s reputation in the industry, and it subsequently licensed its technology to other solar
manufacturers (Stuart 2012).
Innovalight originally aspired to be a module manufacturer, but it opted instead to license its
material to several first- and second-tier Chinese solar manufacturers, including JA Solar. Although
the up-front licensing cost is nominal, revenue comes primarily from the fees collected for every
wafer produced that uses the Innovalight ink. The Innovalight product can be used in almost any
solar production process to increase efficiency by adding one process at the front end after wafer
texturing and then integrating the Innovalight ink step into the customer's production line (Wesoff
2011). As a result, JA Solar no longer has a competitive edge through its partnership with
Innovalight, because its license was nonexclusive and its technology is now widely used in China.
In 2011, Innovalight was acquired by DuPont and was sold among the technology offerings in
DuPont’s solar division. DuPont’s “100 engineering-year of ink development” allowed it to optimize
the silicon ink power and processes to maximize the conversion efficiency of Innovalight’s
technology (DuPont 2016).
JA Solar signed an agreement in 2012 for technology testing and certification with Munich-based
technical service provider TÜV SÜD Group. JA Solar has cooperated with other foreign firms as well,
including former company BP Solar and Siemens, but not on R&D.

78
In response to the solar tariffs placed on exports from China, JA Solar has expanded its production
in Malaysia, allowing it to export panels to Europe tariff free. It is expected that other Chinese firms
may follow suit to avoid trade penalties on its products in Western markets.
Assessing Technological Sophistication
Patenting Activity Patents represent one way of assessing the innovative capacity of a given market. In theory,
companies or markets with larger numbers of patent registrations are likely to be more inclined to
undertake new product innovation and inventions. Younger firms in sectors such as solar, wind,
and energy storage could demonstrate the extent to which innovation is embedded in their
business models by the volume of patents they register. Thus, using company data from the
Cleantech Group (CTG) i3 database, we can calculate the percentage of total firms in each of those
three sectors that have registered patents through either the U.S. Patent and Trademark Office
(USPTO) or the European Patent Office (EPO). This approach reveals a perspective on patents and
innovation that is different from what is revealed when looking at overall registrations. However, it
is limited to the extent that it excludes patents filed in China.
In the solar PV sector, China’s patent filings generally mirror those for the five peer countries being considered. Of the 241 total China-based companies in the solar PV sector tracked in the i3
database, 13 firms (or about 5 percent of the total) have patents filed through the USPTO or the
EPO. Of the 1,743 total solar PV companies tracked by i3 across China plus the five peer countries,
about 139 (or 8 percent) have filed patents, illustrating that in this sector, patent production and
filing by China are basically on par with the average among peer countries. The United States and
Denmark have the highest rates of patent production at 10 percent and 9 percent, respectively.
Since the 1990s, global patenting related to solar photovoltaic technology has soared. However, if we look at the numbers of patents granted by highly developed, international patent agencies, such as the EPO or the USPTO, we see that Chinese firms and inventors have contributed very little to
this surge. The United States, Japan, and Germany have led the way in patenting. Chinese firms have generated substantial numbers of patents at home, but they patent a tiny fraction of those “inventions” outside their home country. That suggests that the actual quality of Chinese patents is very low—even the inventors do not regard them as worth patenting outside China.
Patent Citation Patent citation analysis strongly suggests that the technical advances in the market-dominant
technologies have been incremental at best, even on a global level. China's leading solar PV
manufacturers—which have historically relied almost entirely on export markets rather than on
the domestic market—should have an even stronger incentive than the wind turbine
manufacturers to patent their product and process innovations abroad, especially in the key
European markets that have played such an important role in their global rise. Yet an analysis of
EPO data reveals that no European country has granted a single patent to any of the emergent
Chinese firms! Again, it is hard to resist the conclusion that China's solar giants have so far failed to
generate any innovations worth patenting outside their home country. Interview and survey
evidence put forward by other researchers affirms that the large and growing number of domestic

79
patent applications and grants is more reflective of an effort to impress local authorities bent on
fostering an "innovation economy" than on protecting real innovation.
Assessing Learning and Cost Declines
Solar PV cell and module prices have declined substantially throughout the past two decades,
particularly within the past five years, with the most substantial cost declines in China as illustrated
in Figure 4.2.
Figure 4.2: Solar PV Module Prices, 2010–15
Source: IRENA 2016.
Note: Figures used are for January 2010 to December 2015.
Cost reduction has come through the performance of PV cells indicated by overall efficiency.
Chinese firms have seen rising efficiencies over time from learning by doing in large-scale
manufacturing leading to process innovations. For the most part, labor costs have not been a
significant factor in cost declines, because PV manufacturing is a highly automated process, even in
a place like China that has relatively low labor costs. However, labor flexibility—for example, being
able to increase and decrease the number of workers with changing market conditions—can be
hard to do in some markets because of labor laws, but it is easier in China (Gallagher 2014).
A few other conditions unique to China have been identified as providing competitive advantage.
Geography has played a role in the industry. The numerous parts and component suppliers
clustered in eastern China allow firms to tailor production as needed in response to orders
(Gallagher 2014). Another factor was necessity: silicon shortages reportedly encouraged firms to
use it more efficiently because it was so expensive and scarce for several years before China scaled
up its own silicon production capacity (Gallagher 2014).

80
Assessing Quality A fundamental way to promote the quality and credibility of an emerging solar power company’s
technology is through participation in a certification and testing program that meets international
standards. Several international standards are currently in use at all stages of the solar PV supply
chain, including at the manufacturing phase, for specific components, system installation, and
integration (Solarbuzz 2011). Standards help build consumer confidence in an otherwise unfamiliar
product, help with differentiation between superior and inferior products, and, if internationally
recognizable, are often vital to success in a global market.
As part of the 2009 Golden Sun Program, the Ministry of Finance, Ministry of Science and
Technology, and National Energy Administration (NEA) required that companies supplying PV
technology to the government-subsidized demonstration projects be certified by authorized institutions and that all of the PV systems meet the integration requirements issued by the National
Grid Company. The Golden Sun Program and the Solar Rooftops Program both mandated minimum
panel efficiencies for the technology used for the demonstration projects. Monocrystalline silicon
panels used in the demonstration projects must be at least 14 percent efficient; multicrystalline PV
panels, 16 percent efficient; and amorphous silicon thin-film panels, at least 6 percent efficient.
Government Policy Support
The patent count and the patent citation analysis lead us to conclude that it is not innovation, per
se, that has fueled the rise of China’s solar PV industries. Rather, in the case of China's solar PV
industry, foreign demand was the key driver—strong subsidies in European markets implemented
after the Kyoto Protocol was ratified by western European states played a particularly important
role in growing the market that Chinese firms served. However, Chinese producers also benefited
from a poorly documented but clearly extensive set of formal and informal subsidies to Chinese
producers, mostly funded by local and regional governments. The downstream segments of the
solar PV manufacturing value chain—cell production and module assembly—are characterized by
low barriers to entry. New producers can purchase turnkey production lines, replete with modern equipment. A repatriation of Chinese experts who had received world-class training and work
experience in the solar PV industry outside China provided the human capital needed to
complement imported capital goods. Finally, like all Chinese manufacturing industries in the 2000s,
China-based solar PV manufacturers benefited from capital costs, land costs, energy costs, and an
exchange rate that all deviated from the levels that would have obtained in a market-driven
economy. In a commoditized market, small differences in price can lead to large shifts in market
share. All of these factors worked together to drive a surge in the global market share of Chinese
firms.
For China's solar PV industry, the financial crisis was triggered not by a reversal of domestic energy
policy but by a reversal of foreign energy policy. In Fall 2010, growing concern about the
sustainability of Greece's large central government budget deficits metastasized into a crisis that
eventually engulfed many of the euro area's weaker economies and drove the entire European
regional economy into recession. Spain, whose extremely generous solar feed-in tariffs had
significantly boosted global growth in solar PV demand, was forced to abruptly curtail its support
for further deployment of solar energy. Given the scale of Spain's solar surge, that single policy shift
had a measurable effect on the pace of global demand growth. Even in the stronger European

81
economies, the implications of Europe's crisis required a restructuring of government finances.
Germany, which had been the single largest national market throughout the solar boom of the
2000s, had designed its financial incentives from the beginning so that they tapered off
automatically as the solar share of total electricity generation grew. Cheaper Chinese solar PV
modules caused that limit to be reached sooner than many policy makers had expected.
The abrupt European policy shift had an immediate and profound effect on global market dynamics.
Exponential growth disappeared, growth leveled off, and expanding Chinese production volumes
could now find fewer purchasers. The price of solar PV modules began to collapse as increasingly
desperate producers fought for the limited amount of market demand by engaging in an
unprecedented price war. Some casual observers have since interpreted those price declines as
evidence of the emergence of a Moore's law–like phenomenon in solar PV. But the darker reality of
oversupply and expanding losses was made evident: first in the collapsing equity prices of Chinese
PV manufacturers and then in a wave of bankruptcies that eventually engulfed the market leader,
Suntech.
As prices continued to fall, new sources of solar demand emerged. In California, savvy
entrepreneurs realized that they could make a profit selling the surplus energy generated by cut-
rate Chinese solar PV modules to regional utilities, which were forced to buy it at a favorable rate. A
new business model emerged in which firms essentially rented rooftop solar PV systems to
California homeowners under terms that shared the profits they expected to earn with the
homeowners hosting the PV modules, virtually guaranteeing the homeowners some modest
financial gain. Freed of the need to make large up-front capital investments, California residents
were happy to participate in this effort, because they were also financial beneficiaries.
In the aftermath of the 2011 earthquake and tsunami, Japan emerged as an important source of
new demand. The nuclear meltdown in Fukushima forced the government to shut down a nuclear
reactor fleet that had provided about 30 percent of Japan's electricity. That abrupt shift led to
months of persistent energy shortages, as Japanese utilities scrambled to bring thermal power
plants online to replace the lost nuclear generators. The sky-high price of natural gas on the spot
market drove Japan's trade balance into a persistent deficit, and the large shift from zero-emissions
nuclear energy to fossil energy made it that much harder for Japan to make progress toward the
emissions reduction targets it had agreed to when it signed the Kyoto Protocol. The Japanese
government placed new emphasis on solar energy, taking advantage of the depressed prices in the
global marketplace. Nevertheless, rapid increases in Japanese and U.S. demand were not enough to
make up for the sharp declines in European demand.
As the financial conditions of the major solar power producers in China worsened, the Chinese
government began to put in place much more aggressive policies to promote the deployment of
solar energy in China. The key step was the establishment of a fairly generous feed-in tariff (FIT). In
July 2011, the Chinese government announced a two-tiered FIT scheme providing a subsidy of Y
1.15 (US$ 0.17 equivalent) per kilowatt-hour for projects approved before December 31, 2011, and
a subsidy of Y 1 (US$ 0.15 equivalent) per kilowatt-hour for projects approved thereafter. By
international standards, these are fairly generous subsidies. The Chinese government also replaced
its initial target of 5 gigawatts of solar energy by 2015 with a target that is six times more
ambitious—35 gigawatts by 2015. That move sent a strong signal to utilities regarding the
government's intention to promote domestic deployment of solar energy. Installation in 2013 (12

82
gigawatts) actually exceeded the target for that year. More recently, the FIT has been adjusted, with
the nation divided into three regions and the FIT varying from Y 0.90 to Y 1 (US$ 0.13 to US$ 0.15
equivalent) per kilowatt-hour. The stated policy is to sustain these subsidies for 20 years and to
ensure, over that period, an annual return of at least 10 percent to power providers.
The equity prices of the publicly listed Chinese solar PV manufacturers have risen sharply from
recent lows as these policies have been phased in, reflecting the widespread perception among
market analysts that the new policies amount to an expensive bailout of solar PV manufacturers.
China became the largest single national market for solar PV in 2013 by a considerable margin—an
enormous shift from 2010, when it barely registered in international statistics. After declining in
2012, global solar PV installation grew significantly in 2013, a turnaround that was entirely reliant
on Chinese demand.
For the moment, Chinese government largesse appears to be rescuing the Chinese solar PV
industry—or at least the larger and stronger firms—from the consequences of their overcapacity.
That being said, market observers note reports that the new solar PV installed capacity is having
problems connecting to the grid. Whether the systematic and persistent grid connection and
curtailment problems that have bedeviled China's domestic wind energy market will also affect its
emerging domestic solar energy generation remains to be seen. In the meantime, market observers
also note that the central government appears to be trying to force the shutdown and consolidation
of the hundreds of marginal solar PV producers that entered the market in recent years. That move
has been firmly resisted by the local governments that bankrolled local producers. In the absence of
further consolidation and a stabilization of product prices, the financial health of the large mass of
smaller producers is unlikely to improve.
China has implemented most of the policies tracked by Bloomberg New Energy Finance to support
renewable energy development, including debt/equity finance incentives, feed-in tariffs, grid
incentives, renewable energy targets and certificates, and tax incentives. Unsurprisingly, given the
low levels of distributed solar installations in the Chinese market, no net metering schemes exist
yet, and that represents the only policy from this “basket” of Bloomberg New Energy Finance’s best
practices that is currently missing in the Chinese market. That said, according to an NEA policy
consulting document that was published in February 2017, special pilots will be established across
the country to develop microgrids that aim to connect distributed energy (particularly solar) with
end users in independent, self-balancing systems. Those microgrids, if successful, could hasten the
development of distributed solar power in China, something that is likely to increase innovation
focus on the energy management software and other integrated systems that are taking off in this
distributed space globally.
Importantly for the solar sector, the Chinese government is in the process of phasing out feed-in
tariffs to the sector, to be replaced by renewable energy certificates (RECs) and an associated
trading system. In February 2017, the NEA announced guidelines for a voluntary national REC
trading system to be launched in mid-2017, followed by a mandatory program in 2018. Although
RECs have the potential to replace the feed-in tariff as the main subsidy for the solar sector in
China, they have raised a high level of uncertainty about their price in the new trading systems, the
types of companies that will be mandated to participate, and the level of enforcement by
government regulators. As this new REC system takes shape, projections for new solar installations
may be difficult to make over the next five years, something that could negatively affect the appetite

83
for sector innovation (BNEF 2017).
Looking Ahead Perhaps a more important metric than current technology is whether Chinese firms have the ability
to innovate to produce the next generation of solar technologies (second generation). China is
arguably still behind the United States in fundamental solar technology research at universities and
national laboratories, as well as in second-generation technologies such as thin-film solar cells.
NEA’s 12th Five-Year Plan for solar-attributed challenges in the industry to inferiority in core
technologies and research and import dependence on key machinery (Fischer 2014). Few Chinese
companies have been willing to take the risk needed to move into alternative solar technologies,
including thin film, and instead focus on incremental innovations targeting process improvements
and cost reduction. One exception is the Chinese firm Hanergy from Beijing, a large thin-film
manufacturer that has bought several U.S. start-ups. As China has consolidated the entire upstream
solar supply chain, some have argued that this integration can stifle innovation, and therefore we
are unlikely to see the emergence of new, innovative solar technologies from China (Sivaram 2015).
Innovations in Wind and Solar Compared
Wind turbines and solar photovoltaic modules are fundamentally different technologies with
different production requirements and supply chain structures. The structure of these respective
technology industries has implications for innovation models, as well as how policy support has
been structured to encourage industry development.
Role of State Support
The timing of the development of the wind and solar technology industries was relatively similar,
but the differences in their markets ultimately influenced government policy. Whereas the wind
power industry was targeted from its origins for the domestic market, the solar industry relied
almost exclusively on overseas markets for many years. Only when overseas demand declined
suddenly in the wake of the financial crisis did the Chinese government introduce policies to
promote domestic industry development.
Because of differences in the cost competitiveness of wind and solar technologies, pricing and
subsidy policies also differed in timing, with implications for the growth of domestic markets. Wind
was cheaper than solar technology through most of the 2000s. Most energy officials believed solar
was too expensive to subsidize for domestic deployment in China. As a result, the early years of
China’s solar industry formation were essentially subsidized by the governments of Germany and to a lesser extent Japan, which were subsidizing deployment in their own countries.
Another key difference is firm ownership structures. Many Chinese wind turbine manufacturers are
fully or partially state owned. However, almost all of China’s solar PV companies are privately
owned. Companies like Suntech that were originally state owned divested state ownership to make
them more competitive overseas (Liu and Goldstein 2013).

84
Role of International Technology Transfer
China’s innovation model in the solar technology sector has been somewhat similar to the wind
sector, in that most Chinese companies have purchased some form of production technology from
companies located in countries that were earlier innovators in the solar industry.
As the production lines moved to China, PV manufacturers gradually adapted them to local
conditions—for example, if less expensive inputs were available. Although technology licensing
played a role in both the wind and solar industries, it was arguably more important in the wind
industry. First-mover firms had very little experience in wind technology compared with Chinese
solar firms, which could build on knowledge from the semiconductor industry.
Although several factors contributed to the rise of many new wind turbine manufacturers in China,
the implication of their rise has added competition for the foreign firms that were already operating
within the Chinese market. In contrast, no foreign manufacturers were early movers in China’s
solar market, mostly because China had only a minimal domestic market until long after it had
created leading global solar companies. As a result, far more tensions have existed between foreign
and local firms in China’s wind sector than in the solar sector.
As China’s wind market has risen to become the largest in the world over the past few years,
China’s homegrown wind turbine manufacturers have been able to capture the majority of Chinese
market share, increasing competitive tensions between foreign and Chinese firms, and even leading
to high-profile disputes (Lewis 2013). Although rarer than claims of protectionism, there have been
some claims of blatant theft of intellectual property from Chinese wind firms. One recent high-
profile IP dispute was between American Superconductor (AMSC) and Chinese turbine
manufacturer Sinovel. AMSC initially entered the Chinese market through its partnership with
Sinovel by means of a licensing agreement followed by joint R&D for several new wind turbine
models. In June 2011, while servicing wind turbines in China, AMSC engineers discovered that
Sinovel was using a version of AMSC’s low-voltage ride-through software in a wind turbine in China
that AMSC had not sold or licensed to Sinovel (Beyer 2013). That discovery led to legal proceedings
in both the Chinese and U.S. court systems. AMSC claimed that Sinovel paid an AMSC systems
integrator in Austria for source code and software that Sinovel used to upgrade hundreds of its
wind turbines to meet proposed Chinese grid codes, and he was found guilty of that crime (Beyer
2013).
China’s solar industry has been the target of its own international criticism, not because of IP theft,
but because of its role in global trade disputes. As previously discussed, the U.S. government placed
tariffs on Chinese solar imports starting in 2012 that persist today.
Wind versus Solar Innovation Processes Compared
Although wind turbine components can be composed of 8,000 individual parts produced by 1,000
unique suppliers, the production of solar wafers, cells, and modules is extremely automated and
standardized across the industry, requiring fewer suppliers and a shorter supply chain (Nahm and
Steinfeld 2014). As a result, the scale of the production process is higher for solar PV, whereas the
complexity of the product architecture is significantly higher for wind turbines (Huenteler et al.

85
2016). The difference in these structures has implications for comparing the innovation processes
in these two sectors in China.
So although both the solar PV and wind sectors in China have achieved manufacturing scale at
lower costs, the urgency for innovation and new product development may be more pronounced in
the solar PV sector than is the case for wind.
The structure of China’s wind sector also has other differences. Unlike solar PV, in which Chinese
manufacturers have gained such significant global market share, China’s wind sector is almost
entirely domestically focused with very low export volumes. Almost all of the sales of Goldwind—
the country’s largest wind turbine maker—are in China. And of the new capacity added in 2016, 25
local turbine suppliers accounted for 94.8 percent of the domestic market. That is not entirely
surprising: in addition to the large, rapidly growing market for wind turbines in China, trade
presents unique challenges for wind components that do not exist for solar PV. It is simply more
difficult for wind turbine manufacturers to export these larger components and develop export
markets, unless through joint ventures in which production facilities are located closer to the end
customer. Although curtailment issues associated with unused wind power in the north of the
country suggest that new capacity installations in China may fall somewhat in 2017, it will continue
to be a strong market for these domestic producers.
Solar modules have few moving parts and are a mass-manufactured commodity with low annual
operation and maintenance costs. In contrast, wind turbines are complex and expensive machines
that can contain site-specific characteristics and have relatively high operation and maintenance
costs. The differences in the technology mean that differences have also existed in how innovation
is focused across the components and system. In solar PV panels, most of the innovative activity has
been to the cells themselves, with far less being focused on system architecture, modules, or
mounting systems. Innovation targeting grid connection is a relatively new area of innovative
activity for solar panels. In wind turbines, innovation has over time focused on different
components and overall system architecture. For example, power train innovation was a significant
focus of innovation from the mid-1980s to mid-1990s, then grid connection–related innovation
took over, along with innovative activity related to mounting and encapsulation (Huenteler et al.
2016).
Overall, Chinese solar firms are closer to the frontier in mainstream solar technologies, but they do
not seem well positioned to be innovators in the next generation of solar technologies. In contrast,
Chinese wind firms are still a bit further from the frontier compared with global competitors in
wind turbine technologies, but they are just as well poised to develop advanced wind turbines as
foreign firms.
Limitations to Innovation Most studies of the Chinese wind and solar industries have found no significant obstacles to gaining
access to advanced technologies and intellectual property through licensing, mergers, or research partnerships with foreign firms. Some foreign firms do not want to give up key elements of their
proprietary technology because of concerns about IP protection and competition. Those concerns
are prevalent mostly in the wind industry but also occur in the solar industry, particularly for
second-generation technologies. There have been no major barriers to increasing manufacturing
scale locally because of China’s strong manufacturing base and skilled workforce.
86
The larger challenge for China has been the development of a healthy innovation system that
provides multiple layers of support for innovative activity, including by fostering access to global
learning networks. The tension between the state-led push for indigenous or independent
innovation and the needs of Chinese firms to catch up to global counterparts using international
collaborations in innovation has to some extent hurt Chinese firms. In addition, protectionism and
barriers to market entry and to trade by foreign technology firms are still widespread, and it is
unlikely that will change. These obstacles prevent innovation that can happen through international
collaborations and even indirect knowledge transfers, as well as through competition. To counter
these hurdles, many Chinese solar firms, and increasingly wind firms, have developed R&D centers
abroad.
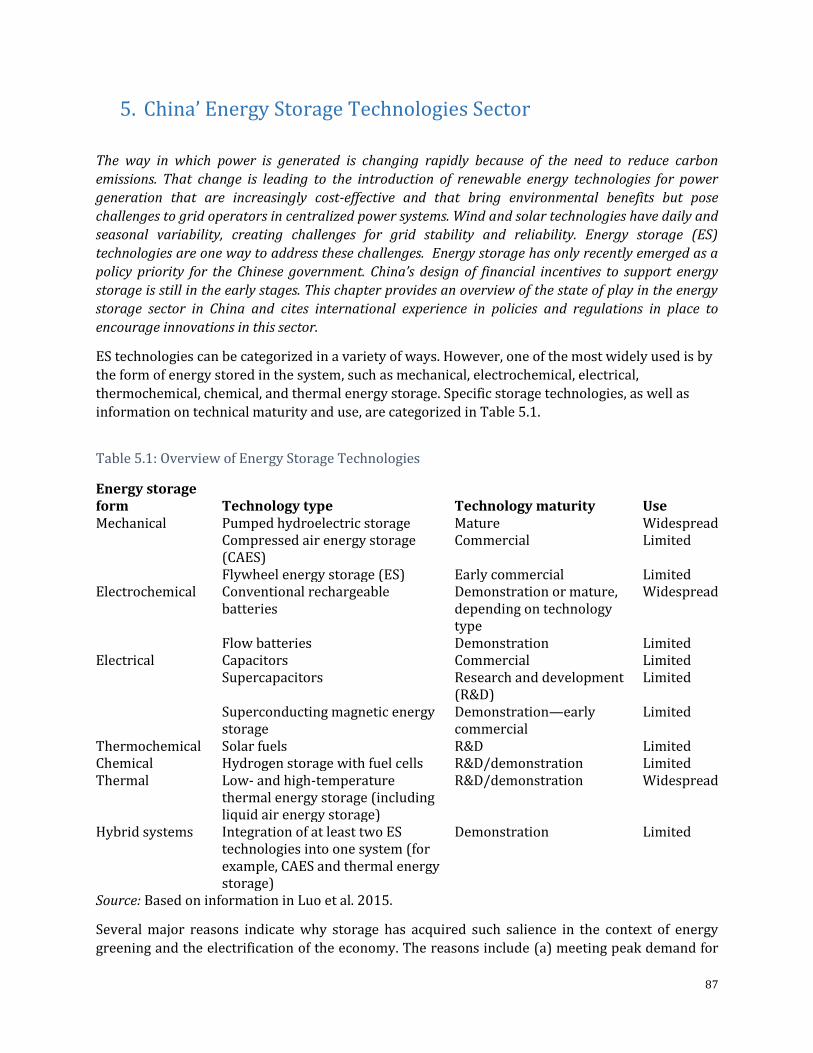
87
5. China’ Energy Storage Technologies Sector
The way in which power is generated is changing rapidly because of the need to reduce carbon
emissions. That change is leading to the introduction of renewable energy technologies for power
generation that are increasingly cost-effective and that bring environmental benefits but pose
challenges to grid operators in centralized power systems. Wind and solar technologies have daily and
seasonal variability, creating challenges for grid stability and reliability. Energy storage (ES)
technologies are one way to address these challenges. Energy storage has only recently emerged as a
policy priority for the Chinese government. China’s design of financial incentives to support energy
storage is still in the early stages. This chapter provides an overview of the state of play in the energy
storage sector in China and cites international experience in policies and regulations in place to
encourage innovations in this sector.
ES technologies can be categorized in a variety of ways. However, one of the most widely used is by
the form of energy stored in the system, such as mechanical, electrochemical, electrical,
thermochemical, chemical, and thermal energy storage. Specific storage technologies, as well as
information on technical maturity and use, are categorized in Table 5.1.
Table 5.1: Overview of Energy Storage Technologies
Energy storage form
Technology type
Technology maturity
Use
Mechanical Pumped hydroelectric storage Mature Widespread Compressed air energy storage (CAES)
Commercial Limited
Flywheel energy storage (ES) Early commercial Limited Electrochemical Conventional rechargeable
batteries Demonstration or mature, depending on technology type
Widespread
Flow batteries Demonstration Limited Electrical Capacitors Commercial Limited
Supercapacitors Research and development (R&D)
Limited
Superconducting magnetic energy storage
Demonstration—early commercial
Limited
Thermochemical Solar fuels R&D Limited Chemical Hydrogen storage with fuel cells R&D/demonstration Limited Thermal Low- and high-temperature
thermal energy storage (including liquid air energy storage)
R&D/demonstration Widespread
Hybrid systems Integration of at least two ES technologies into one system (for example, CAES and thermal energy storage)
Demonstration Limited
Source: Based on information in Luo et al. 2015.
Several major reasons indicate why storage has acquired such salience in the context of energy
greening and the electrification of the economy. The reasons include (a) meeting peak demand for

88
power at the lowest cost locally and minimizing the need to import it from elsewhere and (b)
facilitating the use of intermittent sources of energy and ensuring the reliability of the power
supply and its voltage. As the share of solar and wind power increases, so too will the potential
need to store power. Ultimately, this would depend on how the costs of storage compare with the
alternatives.31
Among the electrochemical storage options, rechargeable batteries32 are of primary interest
because of their widespread uses, which will only increase as electricity becomes the near-exclusive source of energy in the urban economy. Since it was introduced in 1990 by Sony, the lithium-ion
battery (LIB) has become the battery of choice, gradually displacing nickel–metal hydride and
nickel-cadmium batteries because of its light weight, high energy and power densities, low self-
discharge and maintenance requirements, and absence of memory effect. It is the battery that now
powers EVs and is produced by hundreds of companies in China, the domestic market leaders being
BYD, BAK, and Lishen, and the world market being dominated by Panasonic, AESC, Samsung SDI, LG
Chem, and others (Statista 2016).
Much research continues into new battery chemistries that will improve on the performance of LIB,
lessening dependence on lithium, a relatively scarce mineral that is found in quantity in only a few
countries: Argentina, Australia, Bolivia, Chile, China, and the United States. Some of the lithium’s
shortcoming include high manufacturing costs (the corrosive nature of the electrolyte calls for
careful handling) and the need for a protective covering and for circuitry to ensure that the voltage
and current remain within safe limits. Thus far, the leading suppliers—given their investment in the
manufacture of lithium batteries and in the value chain—are content with tweaking the LIB, making
small changes to the chemistry,33 adding graphene or other materials to lithium battery cathodes,34
and improving the software for managing performance with positive results.
Energy storage in a battery depends on the volume of its electrodes, and how rapidly a battery
recharges is a function of the contact between the electrolyte that transports electrons and the
electrodes. Thus, innovators are attempting to maximize the surface area of electrodes that is in
contact with an electrolyte so as to achieve large electrode volume and compactness of the battery.
For example, working with Panasonic, Tesla has raised the storage capacity of its battery packs by
60 percent since 2008 while halving the cost.35 But LIB storage systems are still far from adequate
for a large city. The 18,000-pack LIB unit that AES Corp. is constructing for Edison in Long Beach,
California, the world’s largest, will be able to run at 100 megawatts for only four hours, which is a
fraction of what a city entirely dependent on renewables would need if its supply were to be
interrupted by extreme weather.
The scope for innovation remains wide, with researchers experimenting with other metals that are
below lithium on the periodic table—for example sodium, sulfur, magnesium, zinc, manganese,36
and aluminum37—as well as with flow batteries.38 Solid sulfide electrolytes that have the
conductivity of fluids could lead to an all solid-state battery that would circumvent the flammability
problem that plagues lithium batteries. A breakthrough that reduced costs through the use of cheap
elemental sulfur, for example,39 and enhanced the safe operation of batteries over thousands of
recharge cycles would accelerate the diffusion of renewables and bring the all-electric economy
closer to reality. There is no dearth of ideas: the challenge for researchers is to better understand
the reactions between the components of batteries at the atomic scale with the help of new
instruments and to come up with a scalable technology sufficiently disruptive to overcome the
heavy investment in the LIB and the inertia to change that it creates.

89
The path to commercialization and to scaling up production is a long and costly one. The obstacles
explain why over the medium term, given its volumetric and mass-based energy efficiency,
incremental improvements in LIBs might be the way forward.40
The Global Energy Storage Market and China’s Role
The global stationary energy storage sector is still quite immature, and China is no exception. Global
installed capacity of stationary energy storage was around 3 gigawatts at the end of 2016, a fraction
of the nearly 250 gigawatts of solar and 500 gigawatts of installed wind capacity. But because of
increasing demand from utilities managing solar and wind grid integration and new residential solar photovoltaic (PV) and storage systems, the stationary energy storage market is projected to
grow rapidly to about 45 gigawatts globally by 2024, with 6.5 gigawatts of that capacity in China
(BNEF, 2017). Although this projected growth is significant, it is important to remember how small
the stationary energy storage market is today compared with the market for EV batteries. As a
point of comparison, demand in China for EV lithium-ion batteries was 15.7 gigawatts in 2015,
compared with less than 1 gigawatt for stationary energy storage batteries.
The United States is home to the most energy storage technology manufacturing companies,
followed by Japan, then China. Their market shares are illustrated in Figure 5.1.
Figure 5.1: Global Energy Storage Technology Market Shares by Country
Source: CNESA 2016a.
Among the top 10 global ES technology manufacturers, the Republic of Korea’s firm LG Chem is by
far the largest (Figure 5.12). It is one of Korea’s oldest and largest chemical companies, and it has
recently expanded into information technology, electronic materials, and energy solutions. The
next-largest market share is held by Japan’s Toshiba, then NEC Energy Solutions, a battery company
that focuses specifically on power system storage. NEC Energy Solutions was established when
Japanese firm NEC acquired A123 Energy Solutions, a small spinoff company of the Massachusetts
Institute of Technology based outside Boston. NEC Energy Solutions is still headquartered in
USA
30%
Japan23%
China
18%
Germany7%
SouthKorea7%
Switzerland4%
Canada5%
Australia2%
CzechRepublic2%
France2%

90
Westborough, Massachusetts, with a software development team in Missouri, sales offices in Tokyo
and Rome, and its supply chain is based in Suzhou, China. Japan’s NGK is one of the most successful
electronic ES technology manufacturers, using a sodium-sulfur battery technology.
Figure 5.2: Top 10 Global Energy Storage Technology Manufacturers, 2015
Source: CNESA 2016a.
Companies are responding to this wide-open market with high growth potential by making
strategic investments in new battery producers targeting the stationary energy storage segment. As
table 5.2 illustrates, large companies ranging from GE Ventures to Enel have made small
investments in these newer companies as a strategy for acquiring a better understanding of this
emerging market segment.
Table 5.2: Established Companies Investing in New Battery Producers
Investing company Energy storage investment target Date of transaction
Engie (France) Green Charge (United States) May 2016
GE Ventures (United States) Sonnen (Germany) June 2016
Doosan (Korea, Rep.) 1 Energy Systems (United States) July 2016
Innogy (Germany) Belectric (Germany) January 2017
Enel (Italy) Demand Energy (United States) January 2017
Source: Data from BNEF Insight “Solar and Storage San Francisco Workshop Presentation,” February 16,
2017.
The company BYD is the most successful Chinese ES firm with regard to global market share,
ranking sixth globally in 2015. BYD is an automobile manufacturer based in Shenzhen Province,
China’s largest LIB maker, and the leader in most ES projects deployed domestically. BYD’s
developments of ES technologies are driven primarily by its hybrid and EV battery technology
needs. Within China, BYD is followed by Dalian, Wanxi, Southern, China Aviation, ATL, Citic,
Prudent, Shuangdeng, and Zhuhai in overall Chinese market share measured by installed capacity in
2015, although that is a rapidly changing, highly competitive landscape, as discussed further later in
this chapter.
0
20
40
60
80
100
120
140
160
Inst
alle
dCa
pacit
y(M
W)

91
The vast majority (66 percent) of ES projects that use batteries in China are based on LIB
technology. This is followed by lead-acid batteries (15 percent), flow batteries (13 percent), and
then supercapacitors (6 percent), as illustrated in Figure 5.3. BYD leads in LIB technology in China;
Narada Power leads in lead-acid battery technology, and Dalian Rongke has deployed the most flow
batteries (CNESA 2016b).
Figure 5.3: China Energy Storage Projects in Operation by Technology, 2000–2015
Source: CNESA 2016a.
To date, ES projects in China have been targeting primary distributed generation projects and
microgrids. This type of application represents 56 percent of projects by capacity, or 77 percent of
all ES projects for microgrids (figure 5.4). Renewables integration is the next most popular ES
application in China, though it is an application that is growing rapidly because of increasing
renewable integration challenges. ES is also used on a more limited basis to support transmission
and distribution, as well as frequency regulation of the power grid (figure 5.5).
Figure 5.4: Types of Energy Storage Projects in China by Installed Capacity
Source: CNESA 2016a.
Supercapacitor6%
Flowbattery13%
Lead-AcidBattery15%
Li-ionBattery66%
DistributedGenerationandMicrogrids
56%
RenewablesIntegration
35%
FrequencyRegulation
2%
Transmission&Distribution
7%

92
Figure 5.5: Types of Energy Storage Projects in China by Number of Projects
Source: CNESA 2016a.
Within the lithium-ion ES technology space (the technology that China is using primarily for ES
applications), Chinese firm BYD ranked second globally in 2015, following A123 (now NEC Energy
Solutions), as illustrated in
Figure . Of the top 10 manufacturers in China, most make lithium-ion batteries, with BYD being both China’s leading ES manufacturer and LIB maker. Dalian Rongke is China’s largest flow battery maker, and Southern Power is China’s largest lead-acid battery maker.
Figure 5.6: Top Five Global Lithium-Ion Battery Manufacturers
DistributedGenerationandMicrogrids
77%
RenewablesIntegration
16%
FrequencyRegulation
1%
Transmission&Distribution
6%

93
Source: CNESA 2016a.
Expectations for a growing ES market have led several new companies to enter the Chinese market.
Two of the most popular models of new entrants include a joint venture of a battery manufacturing
firm and a system integrator and traditional PV system integrators opening their own ES-focused
companies. Two new joint ventures are (a) China’s Sungrow Power, the world’s largest PV inverter
manufacturer, partnering with Korean ES and battery company Samsung SDI to produce energy
storage equipment; and (b) Shenzhen Clou Electronics, which makes grid technologies for China’s State Grid Corporation, partnering with Korea’s LG Chem, the current ES market leader (CNESA
2016c). In addition, China’s EVE Lithium Batteries purchased a 12.5 percent share in Neovoltaic, an
Austrian solar PV and ES company.
Examples of solar companies expanding into the storage business include Suzhou GCL Integrated
Storage Technology Co., owned by Chinese solar company GCL, which will develop distributed PV,
industrial storage, and grid storage technologies; and Trina Energy Storage, established by China’s
Trina Solar, which will provide storage solutions for industrial users as well as public utility grid
storage, residential storage, off-grid storage, communications systems, and vehicles (CNESA 2016c).
Chinese ES companies have been expanding their operations abroad, particularly targeting
residential ES in countries with subsidies for residential storage usually tied to residential solar
programs, including in Australia and Germany. Since 2016, Shenzhen Clou Electronics, Neovoltaics,
China Aviation Lithium Battery Co., GCL Integrated Storage, Pylontech, and Trina Storage have all
released products for residential PV with LIB storage for systems ranging from 2.5 kilowatt-hours
to 7 kilowatt-hours (CNESA 2016c).
Another company to watch is Contemporary Amperex Technology Ltd. (CATL) from Ningde, China,
which according to some reports exceeded BYD’s battery production in 2016 and is growing
rapidly. It has also been targeted for millions of dollars of government subsidies under the 13th
Five-Year Plan (Reuters 2016). CATL went through a second funding round in October 2016 in
which the company was valued at $11.5 billion (Reuters 2016). In January 2017, CATL purchased a
22 percent stake in Valmet Automotive, a Finnish company that supplies auto parts to European
auto manufacturers (Forsell 2017). The company already has offices in France, Germany, and
Sweden and plans to build a European factory soon (Spring 2016).
These partnerships suggest that already-established Chinese firms are following the global pattern
of forming partnerships and strategic investments to develop storage products and acquire
knowledge about this fast-growing sector.
Venture Activity
Private venture investment closely associated with start-ups and innovation has been practically
nonexistent in recent years in China’s energy storage sector.41 There has been no Seed or Series A
funding recorded in China’s energy storage sector between 2014 and 2016. Yet Seed and Series A capital investments have not disappeared in peer countries, most notably the United States.
Between 2014 and 2016, 57 deals were completed in the United States, which were valued at
approximately $14 million. Additionally, eight deals valued at $33.4 million took place in the United
Kingdom, and four deals valued at $2.8 million in Germany during the same period (not including
government venture funds or corporate R&D).42

94
In many of China’s peer countries, however, new innovation-driven companies are emerging with a
dedicated focus on energy storage. These companies are receiving Seed and Series A private
funding globally and generally focus on developing battery alternatives to lithium-ion and software
systems to support storage integration with distributed or utility-scale renewable energy
generation. Some of the recipients of the largest amounts of funding in the past three years are (a)
Imprint Energy, an Alameda, California–based recipient of $6 million in Series A funding in 2014, is
a pioneer of ultrathin, flexible, rechargeable batteries using a proprietary ZincPoly chemistry; (b)
Energy Storage Systems, an Oregon-based recipient of $3.2 million in Series A funding in 2015, is a
developer of advanced flow batteries that use iron as the energy storage medium; and (c) Origami
Energy, a Cambridge, United Kingdom–based recipient of $5.8 million in Series A capital in 2014
followed by a further Series A investment of $13.7 million in 2016, is a developer of a technology
platform for the intelligent management of distributed energy assets.
Case Study: Aquion Energy (United States)
Aquion Energy manufactures safe and sustainable saltwater batteries. They are an alternative to
the lead or lithium-ion batteries commonly deployed in stationary energy storage markets today.
Besides being more cost-effective because of their lower up-front installed systems costs, Aquion
Energy’s batteries last longer and are tolerant to wide temperature changes, partial state of charge
cycling, and daily deep cycling, making them well suited to the unique needs of stationary energy
storage systems.
Aquion Energy is an example of an energy storage start-up “spinoff” from a university research
setting. Aquion’s founder began researching low-cost battery designs at Carnegie Mellon University
in Pittsburgh, Pennsylvania, in 2007. Upon realizing some success, he leveraged connections with
venture capital firm Kleiner Perkins to secure financial support for the venture and expertise in
how to spin off the company from Carnegie Mellon. Despite operating as an independent company
for several years, Aquion continues to leverage its relationship with Carnegie Mellon and its
cutting-edge research laboratories. To further support product innovation, Aquion developed a
Global Partner Program, a network of solar and battery dealers and distributors who are regional
experts in renewable energy. These partners know what product attributes are important to their
local customers—from a performance, aesthetic, and regulatory standpoint—and they have direct
access to Aquion’s product teams to provide this crucial feedback. The Aquion team gathers all of
these bits of data and uses them to shape product development initiatives and to ensure that the
company is prioritizing the elements that will bring the most value to its worldwide customer base.
Information for this case study is from Fehrenbacher 2014, with additional background provided by Colin
Mahoney, Mahoney Communications, February 19, 2017. Despite being one of the most promising energy storage
start-ups, Aquion Energy filed for bankruptcy in early 2017. The company is a useful case study for Chinese policy
makers seeking to understand how to better design the domestic VC market in China to support new companies in
the energy storage space. More details on the Aquion Energy bankruptcy:
https://www.cleantech.com/breakthroughs-just-what-does-it-take-to-make-it/

95
Case Study: BYD—Leader in China’s Storage Technology Sector
BYD was the highest selling manufacturer of new energy vehicles in the world in 2015 and 2016
(Thomas 2017). It is also a leading manufacturer of energy storage technologies, primarily lithium-
ion batteries. By 2025, Goldman Sachs estimates that the LIB market will be dominated by China
and worth $40 billion (Sanderson, Hancock, and Lewis 2017).
BYD stands for “Build Your Dream.” The company was originally started in 1995 as a battery
manufacturer. By 2005, it was the largest Chinese manufacturer of rechargeable batteries,
particularly for mobile phones (Loon 2016). In 2003, BYD purchased Tsinchuan Automobile
Company to form BYD Auto. The company was able to build on its battery expertise to produce
some of the most innovative hybrid and EVs in the world.
The founder of the company, Chuanfu Wang, reportedly considered purchasing an automated LIB
production line through an international technology transfer arrangement. However, he found the
cost to be prohibitive, so he opted instead to develop his own line employing R&D efforts led by the
company. The line was semiautomated, meaning it actually substituted workers for robots and
machines, and cost only one-fifth of purchasing an automated production line with a comparable
production capacity. Consequently, it could sell its batteries for much less than its overseas
competitors.
Although BYD was the first Chinese company to enter the lithium-ion market, the production
method pioneered by the firm was ultimately copied by many other local firms, including many
whose employees initially trained at BYD. And China now has about 100 lithium-ion manufacturers.
BYD’s supply chain is vertically integrated; a model that began during its days as a battery producer
as a cost-reduction strategy, as well as to maintain the quality control needed to ensure that design
parameters were consistent (a particular issue in mobile phone manufacturing). One study finds
that BYD has been particularly innovative in three key areas: (a) its production method of
semiautomation relying on inexpensive labor, (b) its vertical integration strategy, and (c) its
attention to local demand and preferences in product design (Loon 2016).
BYD is a private firm, so it did not benefit from direct state ownership or investment for support.
However, numerous reports noted that BYD benefited from government policies, especially
industrial policies that targeted domestic manufacturers in strategic clean energy industries. For example, it received public procurement of EVs from Shenzhen municipal government as well as
central government pilot programs. In a 2016 round of public bidding for PEV (pure electric
vehicle) transit buses in Shenzhen, —BYD won all of the orders (more than 3,000 buses). In
contrast, BYD was unable to sell its parallel hybrid electric vehicles in Beijing, because of
competition from hometown firm BAIC (Wang et al. 2017).
BYD has benefited from government subsidies for electric buses using lithium-ion phosphate
batteries, a technology rarely used by foreign manufacturers because of its lower energy density
than the more common lithium–cobalt-oxide battery, or the newer technology, nickel-manganese-
cobalt-oxide battery (Ayre 2015; LeVine 2015). BYD has also benefited from foreign investment; for
example, Warren Buffett’s company Berkshire Hathaway has a 10 percent stake in BYD (Sanderson,
Hancock, and Lewis 2017).

96
Although BYD has been China’s largest company in the LIB sector, it now faces steep competition
from other Chinese competitors.
Assessing Technological Sophistication
Patenting Activity
This section analyzes the development of energy storage technology in China, Denmark, Germany,
Japan, Korea, the United Kingdom, and the United States. To conduct the analysis, the Thomson
Innovation patent database was used to gather relevant patents between January 1, 1980, and April
24, 2017, from the U.S. Patent and Trademark Office (USPTO) and China’s State Intellectual
Property Office (SIPO). Prominent energy storage technologies were identified for analysis. They
are detailed in table A5.1 in the annex. Each patent identified was then analyzed for nationality, co-
invention, multinational ownership, number of citations received, and the date published. They
were then compared across nationality, technology group, and year to produce a snapshot of
energy storage innovation in China in contrast to the rest of the world.
Large differences existed between patents in the United States and China. On average, the USPTO
received far more patents than SIPO. Because of the USPTO’s more stringent requirements for the
application process, it is regarded as having higher-quality patents. The growth in Chinese patents
has been sizable in recent years, but China’s total representation in the USPTO is far lower than
most of the analyzed countries. China saw significant growth in its energy storage development
after 2010. Lithium-ion batteries were found to be the largest focus worldwide, accounting for 72
percent of all patents granted. To validate the results and gain more qualitative insights, the team
interviewed energy storage experts in the United States, China, the United Kingdom, and Germany
about the current state of energy storage and industry trends. The observations acquired from the
data and interviews paint an optimistic image of China’s energy storage development. China
entered the storage industry late, but it has progressively made energy storage a much larger focus.
The patent analysis shows that the level of Chinese innovation in energy storage mechanisms is
growing, but research in the sector is less important than in countries such as the United States and
Japan. As figures 5.7 and 5.8 show, China has few patents in the USPTO, although the number of its
patents has been growing quickly since 2008. Other countries that have seen this rapid
development in the past 10 years include the United States, Japan, and Korea. China dominates
SIPO. However, SIPO has lower-quality standards than the USPTO. China lags far from its peers in
the average number of citations received for each patent. This factor is evident in both the USPTO
and SIPO. These trends show an increasing focus on energy storage R&D in China as well as
limitations from a country that is relatively new in the industry.

97
Figure 5.7: U.S. Patent and Trademark Office Patents by Country and Year
Source: Thomson Innovation patent database. Note: The figure includes USPTO patents for all energy storage technologies covered in this study between
1980 and 2017. Japanese, American, and Korean inventors have received the most energy storage patents,
whereas Chinese inventors have received relatively few patents from the USPTO, although the number of
China’s patents is growing.
Figure 5.8: State Intellectual Property Office, China, Patents by Country and Year
Source: Thomson Innovation patent database. Note: The figure includes SIPO patents for all energy storage technologies. Chinese inventors received the
most patents, Japanese inventors received a few, and all other countries, including the United States, were
poorly represented.

98
As shown in figures 5.9 and 5.10, the number of patents granted for energy storage exploded after
2008. Concerns of increasing energy prices in the previous years drove the investment in new
energy technology. The number of LIB patents rose steadily starting about 1994 and accelerated
after 2009. The lithium-ion battery is the dominant storage technology for new innovation focus,
comprising roughly 72 percent of the USPTO patents we considered. The reason for the strong
focus is the use of lithium-ion batteries for smaller applications such as cell phones and for electric
vehicles, in addition to their applications in grid-level storage.
Figure 5.9: U.S. Patent and Trademark Office Patents by Technology Type and Year, 1980–2017
Source: Thomson Innovation patent database. Note: CAES = Compressed air energy storage; NaS = sodium sulfur; Ni =nickel; Pb = lead; Redox = oxidation reduction.
Figure 5.10: State Intellectual Property Office, China, Patents by Technology Type and Year, 1980–2017
Source: Thomson Innovation patent database. Note: CAES = Compressed air energy storage; NaS = sodium sulfur; Ni =nickel; Pb = lead; Redox = oxidation reduction.

99
Level of Co-Invention The period after 2008 also saw significant improvements in international collaboration (figures
5.11 and 5.12). The reason is in part the increase in total patents granted during this period, but the
increased worldwide focus on energy storage after the worldwide spike in oil prices also provided
incentives for strong research. Fewer overall co-invented patents were issued than multinational
patents, especially by the USPTO. Because SIPO’s inventors since 2015 were all listed as living in
China, no co-invention patents are listed in SIPO since that time. Thus, it is hard to compare SIPO
with the USPTO, which saw a much higher rate of co-invention. Overall, China has higher rates of
co-invention than Japan and Korea and is similar to the United States and the United Kingdom.
Japan owns the majority of multinational patents invented in China and is especially prevalent in
SIPO, which shows owners of patents outside China owning products invented in China, with very
few patents owned by Chinese companies and invented abroad. See the annex for the numbers of
multinational patents in each country.
Figure 5.11: Chinese Patents in U.S. Patent and Trademark Office by Co-Invention and Multinational Ownership, 1980–2017
Source: Thomson Innovation patent database.
Figure 5.12: Chinese Patents in State Intellectual Property Office, China, by Co-Invention and Multinational Ownership
Source: Thomson Innovation patent database.

100
Studies have shown a correlation between the number of citations a patent receives and its
economic and technological relevance. Using the number of forward citations as a measure of
innovation can be more informative than raw patent counts. The number of forward citations may
indicate the technical and economic importance of a particular patent relative to its peers. The
difference in average citations between patents in the USPTO and SIPO is extreme. The USPTO had
about 16 citations for every patent, whereas roughly only 1 in every 50 patents in SIPO received a
citation. The reason for this difference may primarily be the increased reputation of the USPTO and
an academic culture that places more emphasis on citations in the United States. Within each patent
office, however, Chinese patents were cited less than other countries’ patents. Chinese patents in
the USPTO received an average of 2 citations per patent, which is far below citation leaders like the
United States and the United Kingdom, which have an average of 24 and 21 citations per patent,
respectively (figure 5.13).
Chinese patents also performed poorly in SIPO. Chinese patents received an average of 0.0134
citations per patent, whereas the United States and Japan received 0.05 and 0.028, respectively.
Although the lower number of citations may indicate lower technological quality, we also note that
most of the Chinese patents were granted in recent years, meaning that they have had less time to
be cited. Figure 5.14 shows the average citations per patent by year for all of the patents in the
USPTO and the Chinese patents in the USPTO. Those years that China has patents in the USPTO, the
patents have close to or more than the average number of citations. So although China has very few
patents in the USPTO, those patents are of high quality.
Figure 5.13: Average Number of Citations per U.S. Patent and Trademark Office Patent by Country
Source: Thomson Innovation patent database.

101
Figure 5.14: Average Number of Citations of U.S. Patent and Trademark Office Patents by Year and Number of Chinese Patents in USPTO by Year
Source: Thomson Innovation patent database.
Overview of China’s Regulatory and Policy Framework for Energy Storage
China’s 13th Five-Year Plan (2016–20) includes multiple policy targets for reforming China’s
energy systems. Those include innovation in new energy technologies, smart grid development, and
the increased deployment of renewable and nonfossil energy sources. In particular, 2016 saw a
surge of policies promulgated to target the development of the energy internet, ancillary service,
and microgrids, all of which declared the need for increased use of ES technologies. Those policies
are reviewed in the following section.

102
Energy Storage in Government Plans
Central Level
The energy storage market in China began to take off in 2015, primarily in response to challenges
facing the grid companies. A few earlier guidance documents, including the 2014 “Energy
Development Strategy Action Plan (2014–20),” mention energy storage technologies in the list of
technologies being targeted for innovation prioritization (General Office of the State Council 2014).
But it was the 2015 push to begin the reform and marketization of the electric power sector that
placed increased attention on energy storage.
The start of reforms in the power sector led to policies that supported compensation for energy
storage, encouraging the development of an ancillary services market (to maintain grid stability
and security and that may include frequency control, spinning reserves, and operating reserves).
Annex 4 of the “Six Core Supporting Documents” released in November 2015 that outlined China’s
plans for reforming the power sector noted a focus on reforming the way in which ancillary services
are handled (NDRC 2015, 4). Electricity demand response policies have been piloted but are not yet
widely implemented (CNESA 2016c). The China Energy Storage Alliance lists a web of policies
issued during 2015 that have implications for energy storage development, illustrated in figure
A5.1 in the annex of this chapter.
Energy storage is frequently mentioned in China’s national energy policy documents and plans, but
no explicit subsidies or support policies for energy storage deployment have yet been released.
Most of the policy focus to date has been on encouraging continued technological innovation. Most
recently, the 2016 “Guidance for Promoting Internet and Smart Energy Development” (NDRC, NEA,
and MIIT 2016) mentioned promoting the development of distributed ES technologies, and the 13th
Five-Year Plan mentioned a focus on promoting innovation in new energy technologies that
included energy storage (National People’s Congress 2016).
The document providing the most detail about Chinese government priorities for innovation in
energy storage technologies is the March 2016 “Energy Technology Revolution Innovation Plan
(2016–30)” (NDRC and NEA 2016). The document details specific research, development, and
demonstration goals for different energy storage technology types. Those goals include (a) a
supercritical compressed air energy storage system (goal of 10 megawatts per 100 megawatt-
hours), (b) flywheel energy storage array unit (goal of 1 megawatts per 1,000 megajoules), (c)
vanadium-flow battery energy storage system (100 megawatts), (d) sodium-sulfur battery energy
storage system (10 megawatts), and (e) lithium-ion battery energy storage system (100
megawatts). Innovation goals for 2030 include having a better grasp of different energy storage
technology options, having achieved demonstration, and standardizing and verifying ES
technologies. Other goals include the development of an industry value chain for ES technology
manufacturing, as well as a goal of technological catch-up equivalent to the most advanced
international level (NDRC and NEA 2016). The government’s road map for energy storage
innovation is depicted in figure A5.2 in the annex to this chapter. Several policies in mid- to late
2016 targeted the further use of ES to provide ancillary services in the power sector, compiled
together in Table 1.3.

103
Central level energy storage policies can be divided into four categories: (a) planning targets, (b)
technical guidelines, (c) pilots and demonstrations, and (d) power sector reforms. China’s key ES
support policies for 2005–16 are categorized in Table .3. China also has city and provincial level
plans as shown in Box 5.1.
Table 5.3: Key National Policies and Plans in China Supporting Energy Storage
Policy category
Year
Policy or plan
Focus
Pla
nn
ing
ta
rge
t
2005 Renewable Energy Industry Development Guidance Directory
2011 12th Five-Year Plan for National Energy Technology (2011–15)
2014 Energy Development Strategy Action Plan (2014–20)
2016 Guidance for Promoting Internet and Smart Energy Development
Use of ES for ancillary services and for improving renewable energy integration
2016 13th Five-Year Plan (2016–20)
Te
chn
ica
l g
uid
eli
ne
s
2006 National Medium and Long-Term Science and Technology Development Plan (2006–20)
2013 General specification for electrochemical energy storage system of power system
2016 Energy Equipment Implementation Scheme (by 2025)
2016 Energy Technology Revolution Innovation Action Plan (2016–30)
Pil
ots
an
d d
em
on
stra
tio
ns
2009 Provisional measures for the management of financial subsidies of the Golden Sun Demonstration Project
2010 Smart Grid Planning for the 12th Five-Year Plan Period (2011–15)
2016 Guidance for Promoting Electrification
2016 Notice on Pilots for Promoting the Participation of Electrical Energy Storage in the Ancillary Service Compensation Mechanism in the ‘Three Norths’ Areas
Five ES pilots to demonstrate an ancillary service compensation mechanism to support peak-load shifting and frequency regulation

104
2016 Notice on Pilots of Ancillary Services Reforms in Northeast China
ES be used to provide ancillary services and stabilize demand
Re
form
2016 Opinions on further deepening power system reform, annex 4 of the “Six Core Supporting Documents”
Sources: CNESA 2016b, 2016c; NREL and SGERI 2016; SMM 2016.
Energy Storage Demonstration Projects
According to the China Energy Storage Alliance, China had 118 ES projects in operation at the end
of 2015 totaling 105.5 megawatts, or 11 percent of the global market CNESA 2016b). That figure
includes lithium-ion, lead-acid, and flow battery technologies but excludes pumped hydro,
compressed air energy storage, and thermal energy storage. Most of the ES demonstration projects
in China through 2015 were for distributed generation, microgrids, and renewable energy
Box 5.1: City- and Provincial-Level Plans
In addition to the central government plans and policies supporting energy storage (ES) technology
development, several local and regional governments have implemented their own support schemes.
Examples of provincial- or city-level support schemes are described here.
Dalian City in Liaoning Province issued the “Dalian City People’s Government Opinions on Advancing the
Energy Storage Industry” in March 2016, declaring that the city was positioning itself to become a research
and development and manufacturing hub for ES technologies. Government officials specifically targeted the
development of a local supply chain to produce vanadium-flow and lithium-ion batteries; an industry they
estimated was worth nearly $7.3 billion. Dalian is home to the first national demonstration project for
chemical storage sanctioned by the National Energy Administration: the 200-megawatt/800 megawatt-
hours “National Chemical Storage Peak Load-Shifting Station demonstration project” (CNESA 2016c).
Qinghai Province, a longtime leader in clean energy industry development and home to numerous solar
companies, is positioning itself to be a leader in lithium battery development because of its lithium resource
base and clean energy supply chain. The province is reportedly home to over 80 percent of the national
lithium resource supply (CNESA 2016c). The cities of Xining and Haidong will be targeted for increased
electric vehicle programs that will benefit from the lithium battery–manufacturing base, whereas other
cities in the province are being targeted for photovoltaic and storage hybrid applications.
Bijie City in Guizhou Province is home to China’s first compressed air storage demonstration project (1.5
megawatts) as well as its first national research and development center for large-scale physical storage.
The National Energy Large-Scale Physical Energy Storage Research and Development Center was built by
the Institute of Engineering Thermophysics of the Chinese Academy of Sciences and the municipal
government of Bijie, Guizhou Province IET CAS 2016). Construction on the center is in process and includes
a 9,000-square-meter office building and an 11,000-square-meter experimental plant. When completed, it
will reportedly be the largest such facility in Asia (CNESA 2016c).

105
integration. Larger-scale demonstration projects targeting ancillary services to the power grid
began to be developed in 2016 in conjunction with power sector reforms. Those demonstration
projects primarily involve system integration firms, such as Samsung SDI–Sungrow, Dalian Rongke,
and Narada Battery.
Storage is also increasing in northwestern China in response to increasingly severe wind and solar
power curtailment resulting from challenges with renewable energy integration. Compared with
other countries, ES is underused in China to aid in renewable energy integration. The China Energy Storage Alliance estimates that 366.5 megawatts of ES was specifically being applied to renewables
integration at the end of 2015 globally, but only 6 percent was in China. Most ES targeting
renewable energy integration in China focuses on wind power, which has been experiencing the
most severe curtailment rates (Lewis 2016). ES is increasingly being used for solar integration as
well,—for example in the Golmud City Solar Storage Station in Tibet and the Kelu Electronics Solar
Storage in Yumen, Gansu Province CNESA 2016b). Key energy storage demonstration projects in
China are listed in Table A5.3 in the annex.
One of the national ES research centers in China is the Chinese Academy of Sciences’ Institute of
Engineering Thermophysics (IET). The IET developed a 10-megawatt compressed air energy
storage technology that led to the establishment of a spinoff company, Zhong-ke-Shuangliang
Energy Storage Systems Company Limited. Some of the major projects the IET is involved in that
are supported by the Ministry of Science and Technology’s R&D programs for energy storage
include (a) the National Basic Research Program (973 Program)—the basic research for the large-
scale supercritical compressed air energy storage system—which runs from January 2015 to
August 2019; (b) the National High-Tech Research and Development Program (863 Program)—the
research and demonstration of large-scale supercritical compressed air energy storage system—
which ran from January 2013 to December 2015; and (c) the integrated research platform of large-
scale physical energy storage research and development project, which ran from 2013 to 2016.
International Policy Comparison
China does not offer the same level of policy support for energy storage development as the United
States, Japan, and Germany (table 5.4). China is the only country among its peer group that does not
currently have policies in place to support the installation of stationary energy storage systems. It is
true that these policies are scarce in all countries compared with the generous support mechanisms
for solar and wind. But they are emerging slowly: Germany has an energy storage subsidy for PV
systems made up of a low-interest loan and grant up to US $28 million, a program that supported
about 55 percent of the 50,000 systems installed in the country through the end of 2016; in the
United States, the California Public Utilities Commission mandated that 1.325 gigawatts of energy
storage be procured by its three major investor-owned utilities by 2020; and in Japan, a stationary
lithium-ion subsidy battery program promotes installation of energy storage systems in residential
and industrial use by subsidizing the cost up to a pre-established limit of US$ 90 million.
The feed-in tariff is the only policy instrument that China has in common with those countries.
However, China is in the process of developing many such policies. Initial policy research into

106
dynamic pricing is ongoing in the country. Energy storage research grants and pilot projects are
available on a case-by-case basis, even if no national program is in place to incentivize them.
Table 5.4: Energy Storage Technologies of China and Well-Developed Countries
Source: Carnegie Mellon University Research, Based on Official Sources and Website
Policy Experience in the United States
The United States has a comprehensive approach to energy storage technology development, led by
a variety of federal agencies as well as state-level support. Focus on ES in the United States has
gained traction in the past three to four years, though many obstacles remain to deploying ES
technologies on a large scale.
Federal Policy
Key government agencies and programs at the federal level include the Department of Energy
(DOE) and the Federal Energy Regulatory Commission (FERC), with early-stage research support
targeting novel energy storage technologies being provided by the Advanced Projects Research
Agency for Energy (ARPA-E).

107
According to the DOE, the current challenges preventing the widespread commercial deployment of
energy storage technologies include deficient market structure, insufficient technical progress, a
lack of standards and models, and weak stakeholder understanding (U.S. DOE 2010). DOE supports
R&D in ES through ARPA-E and the Office of Energy Efficiency and Renewable Energy. ARPA-E has
12 ES projects under the Grid-Scale Rampable Intermittent Dispatchable Storage (GRIDS) program.
This program is aimed at developing new energy storage technologies that enable the increased use
of renewable electricity while maintaining high reliability in electricity supply. ARPA-E uses the
pumped hydro as a benchmark for reliability and cost with which new ES technologies are
compared. Key policy and regulatory support for ES in the United States comes from Federal Energy
Regulatory Commission (FERC) regulations on the power sector as well as federal tax credits and
grants (table 5.5). FERC has been developing a variety of regulations that enable ES use in capacity,
energy and ancillary service markets.
Other U.S. federal incentives for ES technologies include the Business Energy Investment Tax Credit
and the U.S. Department of Agriculture’s High Energy Cost Grant Program. Energy storage qualifies
as an advanced energy project under the Investment Tax Credit, defined as “an energy storage
system for use with electric or hybrid-electric motor vehicles,” or electric grids to support the
transmission of intermittent sources of renewable energy, including storage of the energy” (IRS
2016).
Recent attempts have been made to update comprehensive energy legislation in the United States—
such as the 2005 Energy Policy Act and the 2007 Energy Independence and Security Act—by
including provisions for grid modernization and energy storage. In 2016, the U.S. Senate passed the
Energy Policy Modernization Act, which included provisions for addressing the challenges of
integrating conventional and renewable sources with energy storage and smart grid technologies.
However the legislation was changed dramatically in the House and did not move forward
(Murkowski 2016).
Table 5.5: Key U.S. Federal Energy Storage and Demand Response Support Policies
Regulation Year Description Energy Policy Act 2005 Supported demand response projects Energy Independence and Security Act
2007 Requires FERC to evaluate demand response resources
American Recovery and Reinvestment Act
2009 Supported grid modernization and smart grid research and development
FERC Order 719 2009 Allowed demand response resources to participate in wholesale market bidding
FERC Order 745 2011 Required grid operators in wholesale markets to pay demand response providers the same as generators
FERC Order. 775 2011 Compensated certain ES technologies FERC Order 792 2013 Defined ES as generating facilities for interconnection
procedures FERC Order 782 2013 Monetized ES in ancillary service markets Business Energy Investment Tax Credit
2008 Tax credit for ES to support RE transmission or in electric or hybrid vehicles
U.S. Department of Agriculture High Energy Cost Grants
2014 Assists energy providers in lowering energy costs for families in areas with high household energy costs, including by installing backup or emergency power

108
generation or ES technology Sources: CNESA 2016a; ISO, CPUC, and CEC 2014. Note: ES = energy storage; FERC = Federal Energy Regulatory Commission; RE = renewable energy.
State Policy
State-level regulation has also played an important role in encouraging the development and use of
ES technologies, led by the state of California. California established itself as a leader in ES in 2013
when it mandated that the large investor-owned utilities reach a combined target of 1,325
megawatts of energy storage by 2024. California Assembly Bill 2514 led to the California Public
Utilities Commission (CPUC) energy storage procurement targets, which must be completed by the
end of 2020 and implemented by 2024. This target built on a 2010 regulation stating that load-
serving entities consider the procurement of viable, cost-effective energy storage systems.
Additionally, the CPUC provides financial incentives to encourage customers to adopt energy
storage, including the Permanent Load Shifting Program and the Self-Generation Incentive Program
( ISO, CPUC, and CEC 2014).
In 2014, the CPUC, jointly with the California Independent System Operator and the California
Energy Commission, released an energy storage road map. The road map was developed after years
of input from key stakeholders, including utilities, energy storage developers, generators,
environmental groups, and industry. It focuses on actions that address key challenges expressed by
stakeholders, namely, (a) expanding revenue opportunities, (b) reducing the costs of integrating
and connecting to the grid, and (c) streamlining and spelling out policies and processes to increase
certainty. The road map identifies several high-priority concerns for ES deployment, including (a)
refining existing products and driving new ones to market, (b) clarifying operational constraints to
connecting energy storage to the grid, (c) reducing costs of metering and connection, and (d)
creating a predictable and transparent process for commercializing and connecting storage projects
( ISO, CPUC, and CEC 2014).
About two years after California released its ES road map, an ES road map was released for New
York’s electric grid. That road map was produced by the New York Battery and Energy State
Consortium, a member organization of manufacturers, academic institutions, utilities, technology
and materials developers, start-ups, government entities, engineering firms, systems integrators,
and end users (NY-BEST 2017). The New York–focused road map establishes goals of having 2
gigawatts of multihour storage capacity on New York’s electric grid by 2025 and 4 gigawatts by
2030. Using the road map, states would help reduce costly peak electricity demand and would
provide flexibility for intermittent renewables that New York has committed to install over the next
15 years, as well as provide resilience and backup power throughout the grid (NY-BEST 2016). The
road map also recommends specific actions to remove obstacles to ES deployment, including (a)
monetizing the value of ES through new regulatory and market mechanisms; (b) reducing the soft
costs of ES installations related to siting, permitting, and interconnection; (c) creating standardized
codes to increase commercial confidence in ES solutions; (d) promoting a study to evaluate options
for storage to support renewable energy and climate goals; (e) increasing the availability of
information related to electric grid system needs to enhance industry decision making; and (f)
implementing a declining bridge incentive that monetizes the value ES delivers to the electric
system and provides investors with long-term confidence in the grid (NY-BEST 2016).

109
The state of Texas, led by the Electric Reliability Council of Texas, is planning to launch ancillary
service markets to enhance grid reliability, including through fast-acting energy storage devices.
Nine utility-scale battery electric storage systems currently operate in Texas, including the largest
in the United States, the Notrees Battery Storage Project operated by Duke Energy at Goldsmith,
Texas. That project consists of a 36-megawatt Samsung SDI lithium-ion technology, converted in
2016 from the original lead-acid battery technology. The battery system helps with integration of
the 153-megawatt wind farm and participates in the Electric Reliability Council’s fast-responding
regulation service market. The first utility-scale battery operational in Texas was a 2010 project
using a 4-megawatt sodium-sulfur energy storage system technology. This project provides backup
power to the town of Presidio and is operated by a joint venture between subsidiaries of Electric
Transmission Texas and American Electric Power (Holloway 2016).
Smart Grid Technology
Renewables and storage systems are two key elements of the green economy. A third is the grid
that serves the vital function of transporting electric current from generators to users. The advent
of renewables and the parallel rise of electricity as the energy of choice have made it essential to
drastically upgrade the capacity, functionality, and reliability of power grids in response to the
patterns of demand and supply emerging in the early 21st century.43
Smart grids are seen as a way to reduce energy consumption, increase the efficiency of the
electricity network, and manage electricity generation from renewable technologies. China’s State
Grid Corporation outlined plans in 2010 for a pilot smart grid program that maps out deployment
to 2030. Smart grid investments will reach at least $96 billion by 2020. The 13th Five-Year Plan
published in 2016 has undergone some revisions since that time. It has specific goals related to
further investment in “smart grid” technology, distributed generation, and new energy storage
devices.
Owing to the complexity of power systems, the definition of a smart grid varies. In fact, smart grids
not only are a kind of technology but also are a series of new technical and institutional innovations
that can make the power grid more efficient, cleaner, and smarter. In China, the smart grid concept
focuses on all sections of the power system, including smart power generation, transmission,
deployment, usage, and storage. Thus, we define smart grids in China as an integration of
renewable energy, new materials, advanced equipment, information technology, control
technology, and energy storage technology that can realize digital management, intelligent decision
making, and interactive transactions of electricity generation, transmission, deployment, usage, and
storage.
Advantages of smart grids rely heavily on advancement of energy storage. For example, through an
energy storage mechanism, smart grids will be able to achieve (a) real-time demand response and
(b) management strategies for lowering peak demand and overall load. In turn, smart grids will
integrate renewables and energy storage in electricity networks, while optimizing their use and contribution to system services and the wholesale markets. These achievements will facilitate the
development of a distributed generation market that will further unlock the market for energy
storage and thus push forward scaling up and commercialization.

110
Case Study: Tesla: Examining an Innovative Energy Storage Company
Tesla has been singled out as one of the most innovative automobile technology manufacturers and now energy storage technology companies in the United States and the world. This section reviews
Tesla’s involvement in the ES technology market and its company strategy for innovation.
Tesla was founded in 2003 in San Carlos, California, and is led by Chief Executive Officer Elon Musk.
In May 2015, Tesla launched Tesla Energy, which focuses on energy storage technology
applications beyond vehicles, including for homes, businesses, and utilities. It also aims to support
the use of renewable energy, providing backup power, and increasing grid resilience (Tesla 2017a).
One of its key ES products is the Tesla Powerwall: a wall-mounted rechargeable lithium-ion battery
combined with a liquid thermal control system and software that interacts with the solar inverter.
Integrated with the local grid, it is designed to support residential solar power consumption by
giving customers the flexibility to draw from their own storage reserve, shift loads to less expensive
rate periods, and provide backup power (Tesla 2017a). Tesla’s development of this product
signaled its entry into the residential solar market, which was also supported through its
acquisition of residential solar company Solar City. A similar product is available to provide storage
for larger solar power systems at commercial businesses. The Powerwall 2, released in late 2016
for $5,500, provides 14 kilowatt-hours of energy, 5 kilowatts of continuous power, and 7 kilowatts
of peak power (Lambert 2016).
Tesla Energy has also developed the larger Powerpack storage system for utility-scale systems in
the form of 100-kilowatt-hour battery blocks, grouped to scale from 500 kilowatt-hours to 10
megawatt-hours and up. These systems can be used for peak shaving, load shifting, and demand
response, as well as for renewable firming and a variety of grid services (Tesla 2017a). The Tesla
Powerpack was used in Europe’s first grid-scale energy storage system installation, unveiled in
Somerset, United Kingdom, in December 2016. The project, developed by Camborne Energy
Storage, was colocated with a solar farm (Ayre 2016).
The clean energy industry is rife with intellectual property battles over patent protection and
infringement. Musk therefore surprised the world when he announced Tesla would open all of its
patents to the public. Tesla has developed highly innovative ES technology. Its lithium-ion battery
packs have the highest energy density in the industry. However, the strategy to open source its
intellectual property for this battery technology placed Tesla in an interesting position with respect
to future innovation. As carefully worded in its patent pledge, Tesla irrevocably promises that it will
not initiate a lawsuit against any party for infringing a Tesla patent through activity relating to
electric vehicles or related equipment as long as such party is acting in “good faith” (Tesla 2014b).
According to one analysis, that essentially means that Tesla could safely use the patents of a
company that used its own patents, even if the other company’s patents are not open source.
Therefore, Tesla would have access to all innovations and improvements made to its own patents,
because the companies that make the improvements cannot go back and sue Tesla for infringement
on the basis of their initial agreement to use Tesla’s patents in “good faith”(Lambert 2015). This is a
novel innovation strategy, and it remains to be seen whether it will benefit the company. Although
some companies are reportedly using Tesla’s patents, others are afraid to have their future
intellectual property linked to Tesla out of concern for potential competition.

111
Tesla is creating a Gigafactory in Nevada, which is expected to reach full operation of 35 gigawatt-
hours by 2018. It is being developed jointly with Panasonic and other strategic partners to supply
batteries for its Powerwall and Powerpacks as well as its vehicles. Using economies of scale,
innovative manufacturing, reduction of waste, and simple optimization through locating most
manufacturing processes under one roof, Tesla estimates that the Gigafactory will produce
batteries for significantly less cost (Tesla 2017b).
Tesla’s strategy of creating a vertical industrial chain has proved successful so far, but the company faces fierce competition from ES rivals like Bosch, GE, and Samsung.
Figure 5.15: Tesla’s Gigafactory Projections versus 2013 Global Battery Production
Source: Tesla 2014a.
Looking Ahead Energy storage has only recently emerged as a policy priority for the Chinese government. As a
result, the policy support system for energy storage technology development and deployment is
still rather nascent. China’s electric power system in particular can benefit from regulatory reforms
designed to encourage energy storage development. The new focus on energy storage in China
seems to be driven primarily by recent challenges in renewable energy integration, including the
substantial curtailment of wind and solar power. However, such ES applications should be
developed as part of a more comprehensive strategy to optimize China’s power system, including
by improving the overall stability of the electricity grid and considering future technology
development, including increased low-carbon energy development. The explicit prioritization of
power system needs—in addition to renewable energy integration—should be comprehensively
examined. In addition, much could likely be learned from the successes and failures of existing
projects, including with different technology configurations that could be highly useful for the
design of future projects and policy incentives.
Clearly, China’s design of financial incentives to support energy storage is still in the early stages.
Other countries have incentivized energy storage in a variety of ways, including through subsidies
and tax credits, but also by reducing the regulatory uncertainty associated with energy storage

112
development that can affect “soft costs” significantly. For example, in the United States, the simple
clarification of definitions by FERC facilitated grid interconnection and project approvals. That
coupled with target setting at the state and utility level (for example, in California) encouraged the
rapid development of an energy storage market. The government has an important role to play in
reducing investor uncertainty not just by offering subsidies but also by clarifying how energy
storage facilities will be treated by the utilities and grid operators.

113
6. Role of Government: Policy Recommendations
The government plays an essential role in establishing a conducive environment for green
innovation. Given the high fixed costs associated, green sectors are even more dependent on the
public sectors and favorable regulatory regimes. As outlined at the outset, green innovation can
become a new driver of growth in China. This study has reviewed China’s domestic strategy to
support wind, solar, and energy storage technology development and China’s position globally in
each of these sectors’ innovation. On the basis of these findings, this chapter provides policy
recommendations that could increase innovation and deployment in each sector.
This analysis has looked more closely at the dynamics of innovation today in China’s solar, wind,
and stationary energy storage sectors. Two leading global indexes—the Global Innovation Index
(GII) and the Global Cleantech Innovation Index (GCII)—were used to establish China’s overall
global standing in innovation and determine how that looks when applied to cleantech sectors
more specifically. Using data that could be obtained for the three sectors, some of the themes from
these indexes were explored in further detail. The topics—including early-stage private venture
investments, levels of public and corporate research and development (R&D) for clean energy,
patents, and policies—revealed China’s innovation capacity in these sectors relative to its overall
results from the indexes, and compared with the five peer countries: Denmark, Germany, Japan, the
United Kingdom, and the United States.
One of the challenges in taking a data-driven approach to analyzing innovation in a market like
China is that some of the cultural factors that produce innovation are very hard to measure. Some of
those factors—like cultural appetite for risk and orientation toward entrepreneurship—are
captured through the GII and GCII, but they are difficult to capture for sectors like solar, wind, and
storage. Another limitation of this data-driven approach is that there is no comprehensive data
source that captures some of the emerging initiatives in China to support innovation. Also, not all
Chinese companies report R&D spending in a systematic way, meaning that those values may not
fully capture how those firms support innovation directly from their balance sheets.
Amid these disclaimers, the analysis revealed some clear conclusions:
• Approaches to boosting innovation in China should focus on the overarching institutions that enable innovation, as much as on sector-specific policies. The GII revealed that the
political, regulatory, and business institutions with which entrepreneurs must interact in
China are lagging far from where they should be, given China’s overall innovative capacity.
China ranks very low on the ease of starting a business, and innovation will continue to be
restricted until the underlying institutions relating to this process are improved.
• China has demonstrated success in commercializing cleantech innovations, as evidenced by
how successfully its firms acquired intellectual property and know-how in the solar and
wind sectors, applied process innovation in their production, and successfully
commercialized them. But China’s weakness is in early-stage innovation, whereby that

114
intellectual property and know-how are produced domestically through universities, start-
ups, or companies. This conclusion was revealed through China’s GCII results but also
through data on early-stage private investment in solar, wind, and storage, which is
basically nonexistent. While Chinese patents are on the rise in SIPO, our analysis has shown
that there are lower levels of patent citations and patent filings in USPTO and EPO which
could be taken as a lower level of global integration of Chinese patents as compared to those
of its peers. It would be important for Chinese authorities to analyze which projects have
actual commercial viability and the network around them (that is, research labs, mentors,
and so on) to succeed, before investing more money in new projects.
• Of the three sectors analyzed, energy storage appears to represent the greatest opportunity
for innovation in the coming years for a variety of reasons: (a) innovations are required to
drive down prices and promote storage systems, (b) new types of batteries are required to
satisfy the unique recharging and capacity needs for stationary storage, and (c) China
already has significant domestic capacity and know-how in manufacturing batteries for
electric vehicles. Although some interesting partnerships are forming in this area
(mirroring a global trend of larger energy companies investing in battery start-ups), no
clear evidence shows that the Chinese market is on a different trajectory in this area
compared with solar or wind. More specifically, there are (a) no high-profile start-ups in the
Chinese market exploring new battery types or systems, as is the case in China’s peer
countries; and (b) no supporting policies for stationary storage that would signal to
entrepreneurs that a viable market will exist for their products.
• Although public R&D spending in China is increasing about 5–10 percent annually on par
with its peer countries, corporate R&D remains very low in the solar and wind sectors. This situation is an example of where innovation needs to be better integrated into the business
models of Chinese firms. Although many of the firms in the solar and wind sectors are more
established, energy storage offers a good opportunity for firms to develop R&D capabilities.
Government policy could incentivize such development through tax breaks or other
mechanisms.
• Most of the case studies across the three sectors reveal the centrality of global and local
networks to promoting innovation. Such networks do not assume one form: in Denmark,
they involve test centers that forge links between research institutions and the Danish wind
sector; in the United States, battery start-up Aquion involves global networks to solicit
customer feedback on its products so future iterations can be better tailored to customers’
needs; and in Germany, the government allocates funds to establish ties between academia
and industry in ways that promote employment and innovation. Although such networks
are beginning to form in China’s industrial parks and incubation hubs, less university
collaboration with industry takes place than in peer countries.
• Policy in China still focuses more on capacity management and installations than on innovation. For example, many recent policy announcements deal with curtailment and
balancing out excess renewable energy capacity, particularly in the wind sector. Yet focus
has been more limited on policies promoting innovation to support China’s offshore wind
segment, one that has greater demand for innovation than the onshore segment.

115
Priority Areas for New Policies and Programs
The recommendations provided in this study aim to provide China with more comprehensive
support for select green sectors. The study analyzes a few specific sectors in which China has
varying levels of advancement: wind, solar, and energy storage. These sectors have been chosen
due to their central role in China’s ability to meet its green growth and GHG reduction goals, the
significant public investments in innovation targeting these sectors, and data availability to assess
both the inputs and outputs of innovation.
In order for China to go beyond “catching up” and begin to push the technology frontier, a variety of
improvements to government support for innovation in the clean energy industry are
recommended in the sections below.
Increase support for early-stage innovation
Government support for strategic industries may include access to dedicated state industrial funds,
increased access to private capital, or industrial policy support through access to preferential loans
or R&D funds. However, such funds should be allocated strategically, without picking winners.
While integration of an industry can improve efficiency, it can simultaneously stifle innovation. For
example, as China has consolidated the entire upstream solar supply chain, some have argued that
this integration can stifle disruptive innovation, and therefore we are unlikely to see the emergence
of new, innovative solar technologies from China.
Overall R&D dollars have been increasing for early-stage research in China's quest to become a
more innovative economy that is less reliant on foreign technology. The Ministry of Science and
Technology (MOST) is completely overhauling its science and technology support system, including
for clean energy, so the previous programs that have benefited wind and solar technology
companies are being redirected and restructured. Much of past R&D support has been criticized for
being given to the large state-owned enterprises rather than to smaller, more innovative firms and
for allocating and spending much of the money inefficiently. Rectifying that situation will surely not
be easy, but MOST is working to more competitively allocate funding, which in theory could be good
for more innovative firms. Although China has clearly succeeded in bringing commercial
technologies to scale and in reducing costs with incremental innovations, it is not yet well
positioned to develop the next generation of innovative wind and solar technologies. Therefore,
these areas would benefit from targeted government R&D support.
To improve the innovation impact of government resources, the following improvements are
suggested:
• Support should be more competitively allocated.
• Be strategic about government support at all stages of technology development, particularly
early stage support.

116
ARPA-E in the United States provides one such example of targeting high-risk, high-reward clean
energy innovations. Government loan guarantees then provide later stage support for many clean
energy startup companies. These early stage support programs are highly competitive and help
prepare fledging technology companies for larger-scale technology demonstrations.
Take a more comprehensive approach to measuring innovation
The dominant model of innovation indicators is based on a linear model of innovation, and includes
such factors as R&D expenditures, human resources qualification, and patents. These indicators are
not as effective at measuring what actually happens between the inputs to innovation (like R&D)
and the outputs of innovation (like patents), and therefore they arguably provide only a partial
view of innovation. That may be especially prejudicial for firms in emerging economies, where
fewer financial resources are available for everything from patent registration and maintenance to
R&D support (Marins 2008).
As a result, taking a more comprehensive approach to measuring innovation may be more suitable
for a context such as China. That approach would include measuring progress in innovation in
relation to higher-performing technology or measuring cutting-edge innovations in a specific sector
against a global benchmark. Examples include overall efficiency, size, or other performance metrics.
A deeper exploration of the dynamics of innovation in the solar, wind, and stationary storage
sectors in China starts with understanding how innovation is measured in a comparative way
between countries. Simple patent counts do not account for the differences in commercial values of
various patents nor do they indicate whether the patented technology is being adopted.
To better understand metrics that are suitable for assessing innovation in the Chinese context, the
following are recommended:
• Develop more transparent metrics to track innovation inputs including R&D expenditures
by technology.
• Develop more transparent metrics to track innovation outputs including patent quantity
and quality both inside and outside of China.
Increase International Collaboration and Access to Global Learning Networks
The review of the Global Innovation Index pointed to China scoring quite low on
University/Industry Research Collaboration (31st), State of Cluster Development (23rd), Gross
domestic expenditure for R&D financed by abroad by percentage (90th), and Joint Venture Strategic
Alliance Deals per billion $PPP GDP (49th). In addition, the patent analysis showed that Chinese
patent citations were lower than its peers and the number of patents filed by Chinese inventors in
USPTO and EPO are also lower than those of its peers. These are all signs of limited international
collaboration to promote domestic innovation capabilities. In the wind industry, we see further
signs of this. For example, Chinese turbine manufacturers increasingly rely on R&D centers outside
of China to generate international patents. Envision Energy, a Jiangsu producer, established its

117
Global Innovation Center in Denmark, and all of its EPO, USPTO, and PCT patents were assigned to
its Danish counterpart, Envision Energy (Denmark) ApS. Likewise, all of XEMC’s patents were
assigned to its Dutch subsidiary, XEMC Darwind, and all of the listed inventors have Dutch
nationality. Goldwind in 2008 acquired the majority stake in Vensys, a German firm, and since then,
Vensys and its German inventors have obtained four USPTO patents and four EPO patents.
Goldwind and Vensys also jointly filed for one EPO application.
China needs more cooperation between the government, academia, and the private sector to increase the development of energy storage technologies. That increased cooperation should be
supported by the existing structure within China’s government. The Ministry of Science and
Technology’s National High-Tech Research and Development Program (863 Program) and National
Basic Research Program (973 Program) promote research in key resource and energy technologies.
Energy storage should become a more prominent topic for research allocations within government
agencies, and grant funding should be directed toward projects with academic and industrial
collaboration.
A barrier to international collaboration is IP protection. China has historically had very relaxed
patent and property protection for both international and domestic property. Despite its efforts to
amend the patent law in 2008 and adjust it to international standards, China has made no revision
since that date, precisely when patents for energy storage technologies increased exponentially.
This situation has discouraged high-level scientific communication between China and other
technologically developed countries. Therefore, China should continue to strengthen its IP rights
and enforce the rights of foreign and domestic patent holders equally and stringently.
Reforms to the IP system including how patents are incentivized and granted, is also important,
both to encourage international collaborations and to ensure that the most innovative Chinese
firms do not leave China in search of better IP protection. Currently, energy storage research
centers are more developed outside China. Chinese researchers can improve their efficiency and
knowledge by collaborating with those foreign centers of excellence.
If China’s research centers work independently from global knowledge resources, the quality of
their output may suffer, and the efficiency of technology development may be compromised. In
addition, centers of development in the industrial West and Japan stand to benefit from Chinese
talent and resources. China’s rapidly developing energy system could also serve as a test bed for
new technologies. International collaboration could benefit both China and more developed
countries.
As a result, it is recommended that the government aim to:
• Encourage international collaboration in clean energy innovation by opening early-stage demonstration projects to foreign partnerships.
• Encourage the development of industrial clusters to foster innovation and shared
knowledge in strategic sectors with both foreign and domestic researchers and firms.
• Undertake broader reform to the intellectual property (IP) system.

118
Improve Market Design to Allow Renewable Energy to Compete
Demand-pull policies are struggling to continue to grow the wind and solar sectors because of
overcapacity in the power sector and widespread curtailment. Broader power sector reform is on
the horizon, but the rollout has been incremental. Therefore, in the absence of policies driving
market growth and innovation indirectly, it will be more important for the government to
strategically implement policies that directly support innovation. The Chinese national government
is keenly aware of the problem of renewable curtailment and has acknowledged as much. A set of
policies and regulations has been unleashed, to a large extent, to address this curtailment problem.
Our review of the various government documents reveals that Decree No. 9 spearheads a new
round of reform on the electric power system. Although Decree No. 9 and its reform do not directly address innovation of renewables and energy storage, the reform would have a significant effect on
innovation activities, because the potential implications for the electricity market and pricing
would likely influence enterprises’ approach and commitment on innovation.
One key aspect of the reform as set forth by Decree No. 9 is the transition from a planned, quota-
based electricity system to one that will gradually accommodate a significant amount of trading.
Before the reform, generation quotas exist for different types of energy, including coal and other
fossil-based energies. Under this system, coal-based power producers are guaranteed generation
quotas without referencing the efficiency of the generation units and are, therefore, reluctant to
reduce their generation to accommodate wind and solar power, whose production is intermittent in
nature. This factor stands out as a significant reason to curtail wind and solar power generation.
The key policy issue is how to bring about the change from using coal, oil, and gas sources of energy
to using renewables. Underlying that problem, is the constraint on renewables, such as wind power
and solar energy—China is the world’s largest generator of both—because of the problems of
transmitting energy from provinces that generate excess power to provinces where the demand is
highest. Distances are too great, local grids are not connected nationally, and the storage of energy
is a problem. An additional policy problem is that “provincial governments are incentivized to
dispatch power locally to support their tax base and oppose importing renewable energy from
wind-rich provinces to protect the financial health of local fossil fuel generators” (Vest 2017). The
result is, “According to China’s Renewable Energy Industries Association (CREIA), the country’s
average wind curtailment rate stood at a record high of 15% in 2015” (Ying 2016). The lack of a
spot market for energy supplies is another policy issue that has been raised in the debates in China
(Vest 2017). Such problems clearly subvert green policies nationally.
In March 2016, the State Council released a 15-year energy action plan (NDRC 2016a) to address
these issues, and the NDRC has called for up to 20 demonstration projects of integrated energy
supply systems that will use high-voltage, direct-current electric power grid transmission at less
cost and lower energy loss than alternating current (NDRC 2016b). Research into energy storage is
the other emphasis.

119
Green energy policy, therefore, would best focus on following the supply chain in reverse, from
demand to supply:
• Create the right incentives for industries and households that burn coal to switch to
renewables using low-energy-consuming ICTs as machine tools and as home appliances.
• Introduce smart grid measures that on the technology side allow for interconnecting
networks and high-speed low-attenuation of transmissions, and on the business side
incentivize energy exchanges, spot markets, and discounts for storage and off-peak
consumption.
• Research more cost-efficient green means of energy generation and storage.
The design of China’s power markets makes it very difficult for renewable energy to compete.
Thermal power plants are assigned a set number of full load hours every year, and interprovincial
trading volumes are decided usually as much as a year in advance. Although some financial
incentives maximize local production, the variability of renewable sources such as wind power
interferes with the long-standing practice of allocating full load hours and trading far in advance.
Power sector reforms that could be taken to improve the ability of renewable energy to compete
include:
• Develop competitive wholesale markets to reduce allocation of operating hours to coal-
based generators and increase hours allocated to more efficient, cleaner plants.
• Give renewable energy priority dispatch status to address widespread curtailment.
• Increase overall power system flexibility through improvements such as coordination of
the electricity and heating sectors, greater coordination between balancing areas, more
electricity transfers between regions, implementation of market mechanisms and other
incentives to support resource flexibility, incorporation of wind and solar into system
dispatch, and better use of wind and solar forecasts.
• Increase incentives for grid companies to experiment with new regulatory models so they
are encouraged to dispatch generation most efficiently and cleanly, including through
demand side management.
• Increase the use of energy storage applications as part of a more comprehensive strategy to
optimize China’s power system, including by improving the overall stability of the
electricity grid.
Focus on performance, not just capacity expansion
Too often there is insufficient learning from demonstration projects applied to larger scale
deployment mechanisms. This has been true in early wind farm development, in distributed solar
development, and most recently in energy storage projects. Policy in China still targets capacity
expansion at the expense of performance. Wind is a great example where capacity targets are
regularly met or exceeded while performance and capacity factors are far below global averages. As
a result, it is recommended that successes and failures be better examined and lessons learned
incorporated in the design of future projects and policy incentives.

120
This includes:
• Review and examine existing energy storage demonstration projects, including with different technology configurations.
• Emphasis to be laid on performance and not entirely on capacity expansion for future initiatives.
Increased Development and Demonstration of Energy Storage Technologies To increase the development and demonstration of energy storage technologies, several
recommendations should be considered. First, an energy storage road map exercise should be
conducted to clarify current industry status, current challenges, and growth targets for energy
storage development. To justify those targets, an assessment should be made of the value of energy
storage in meeting current challenges facing China’s power system, including improving reliability
and stability and increasing the integration of renewable sources of electricity. A stakeholder
process to develop such a road map should be developed, modeled after California’s process in the
United States. It is important to bring together all key stakeholders, including policy makers,
utilities, and grid companies, along with project developers, technology companies, and
researchers. The road map should be able to link the targets to specific actions that would enable
attainment of those targets. A very important feature would be an established robust monitoring
and evaluation framework to track progress and to apply to course-correct policy and the programs
being implemented.
Second, existing energy storage demonstration projects should be evaluated for lessons learned to
inform future developments. If necessary, new demonstration projects should be designed using
newly developed energy storage technologies or piloting innovative business models. Experience
with China’s demonstration projects should also be placed in the context of demonstration projects
occurring around the world. As seen in the case of the Golden Sun Demonstration Project, China
needs an efficient and fiscally prudent subsidy if this policy is to be expanded into the entire energy
industry. China must revitalize its pilot projects with a broad focus on technologies to study the
costs and benefits that it will incur by subsidizing energy storage technologies.
Third, China should consider developing new financial incentives to support energy storage
deployment. China is in the process of reforming the electric power sector, including reforms to
contracting and pricing mechanisms. Any new mechanisms should take energy storage services into
account with a goal of quantifying the value that energy storage technologies can provide to the
power system. In addition to potential market-based incentives, the government may want to
explore other financial incentives, such as subsidies and tax credits, to encourage the private sector
to invest in energy storage projects.
Fourth, research and development support for innovation in energy storage technologies should be
expanded. In particular, early-stage support is needed to bring technologies from the laboratory to
the field. Such support will be beneficial to both research organizations and start-up technology
companies.

121
Fifth, China has positioned itself as a leader in the development and appointment of numerous
clean energy technologies, and it is poised to do the same in the energy storage sector. Lessons can
be learned from both successes and failures in the development of other clean energy technology
sectors in China, including the wind and solar power technology sectors, to ensure that energy
storage development proceeds rapidly and that the industry develops in a healthy manner. It is
therefore crucial to encourage international cooperation in technology and policy information
sharing to improve the integration of China’s energy storage industry with global innovation
networks.

122
References
Acemoglu, Daron, Philippe Aghion, Leonardo Bursztyn, and David Hémous. 2012. “The Environment
and Directed Technical Change.” American Economic Review, 102(1): 131–66. 1
Ahrens, Nathaniel. 2013. “Case Study: Suntech.” In China’s Competitiveness: Myths, Realities, and
Lessons for the United States and Japan. Washington, DC: Center for Strategic and International Studies. https://www.csis.org/programs/japan-chair/japan-chair-archives/chinas-
competitiveness-myths-realities-and-lessons-united. 4
Asmelash, Henok Birhanu. 2015. “Energy Subsidies and WTO Dispute Settlement: Why Only
Renewable Energy Subsidies Are Challenged.” Journal of International Economic Law 18 (2): 261–
85. 3
Ayre, James. 2015. “LG Chem & 3M Enter into Nickel-Manganese-Cobalt-Oxide Cathode Materials
Patent License Agreements.” CleanTechnica, August 8. https://cleantechnica.com/2015/08/08/lg-
chem-3m-enter-nickel-manganese-cobalt-oxide-cathode-materials-patent-license-agreements/. 5
———. 2016. “1st Grid-Scale Tesla Energy Storage System in Europe Officially Opened.”
CleanTechnica, December 8. https://cleantechnica.com/2016/12/08/first-grid-scale-tesla-energy-
storage-system-europe-officially-opened/. 4
Baker Botts LLP. 2010. “Entry Standards for Wind Power Equipment Manufacturing Industry, Draft
for Solicitation of Opinions [tr. from Chinese].” Ministry of Industry and Information Technology,
Beijing. 3
Bettencourt, L., J. E. Trancik, and J. Kaur. 2013. “Determinants of the Pace of Global Innovation in
Energy Technologies. PloS ONE 8 (10): e67864. doi:10.1371/journal.pone.0067864.g001. 3
Beyer, Justin K. 2013. “AMSC/Sinovel Industrial Espionage Thriller Takes a Procedural Detour,
Threatening U.S. Criminal Prosecution.” Lexology, September 9.
http://www.lexology.com/library/detail.aspx?g=c06d91c6-1d63-4fb0-a1a7-d803bf90ef60. 4
BNEF (Bloomberg New Energy Finance). 2017. “What Will RECs Do to the Energy Market in China?”
Vimeo, February. https://vimeo.com/205212214. 4

123
Brander, Matthew. 2012. ”Greenhouse Gases, CO2, CO2e, and Carbon: What Do All These Terms
Mean?” Ecometrica, Bethesda, MD. https://ecometrica.com/assets/GHGs-CO2-CO2e-and-Carbon-
What-Do-These-Mean-v2.1.pdf. 6
Branstetter, Lee, Guangwei Li, and Francisco Veloso. 2015. “The Rise of International Coinvention.
NBER Working Paper.” In The Changing Frontier: Rethinking Science and Innovation Policy, edited
by Adam B. Jaffe and Benjamin F. Jones, 135–68. Chicago: University of Chicago Press. 3
Callick, Rowan. 2016. “The Sun King’s New Dawn.” Australian, August 14.
http://at.theaustralian.com.au/link/7be9f33c0d9f3fe56a78f929584e86a6?domain=theaustralian.c
om.au. 4
Cheng, Wang. 2016. “China Announces Renewables Quota, but Is It Enough?” China Energy Storage
Alliance, March 8. http://en.cnesa.org/featured-stories/2016/3/8/china-renewables-quota. 3
China ESCN News. 2012. “The Luxi Dao Grid–Connected Microgrid Demonstration Project Starts
Construction—China ESCN.” China Energy Storage, December 25.
http://en.escn.com.cn/article/show/7194.aspx. 5
Chun, Zhang. 2016a. “China Prepares for World’s Biggest Carbon Market,” Climate Home, November
22. http://www.climatechangenews.com/2016/11/22/china-prepares-for-worlds-biggest-carbon-
market/. 6
———. 2016b. “China Prepares to Open National Carbon Market.” China Dialogue, November 18.
https://www.chinadialogue.net/article/show/single/en/9406-China-prepares-to-open-national-
carbon-market. 6
Clark, Pilita. 2016. “China’s Goldwind Becomes World’s Largest Wind Turbine Maker.” Financial
Times, February 22. https://www.ft.com/content/123f1af0-d97e-11e5-a72f-1e7744c66818. 3
Clifford, Mark. 2015. “The Sun Kings.” ChinaFile. February 25.
https://www.chinafile.com/library/excerpts/sun-kings. 4

124
Climate Bonds Initiative. 2015. Year 2015 Green Bonds Final Report. London: Climate Bonds
Initiative. https://www.climatebonds.net/year-2015-green-bonds-final-report. 6
CNESA (China Energy Storage Alliance). 2016a. “Energy Storage China 2016 Review.” June 16.
http://en.cnesa.org/featured-stories/2016/6/8/energy-storage-china-conference-2016-review-
chinas-energy-storage-market-to-reach-642-gw-by-2020. 5
———. 2016b. “Energy Storage White Paper 2016.” http://www.cnesa.org. 5
———. 2016c. “Nine Updates on China’s 2016 Energy Storage Industry.” September 29.
http://en.cnesa.org/featured-stories/2016/9/27/nine-updates-on-chinas-2016-energy-storage-
industry. 5
Connor, Peter M. 2003. “National Innovation, Industrial Policy and Renewable Energy Technology.”
Paper for the Government Innovation in Energy Markets’ British Institute of Energy Economics
conference, Oxford, U. K., September 25–26.
Conte, Andrea, Ariane Labat, Janos Varga, and Ziga Zarnic. 2010. “What Is the Growth Potential of
Green Innovation? An Assessment of EU Climate Policy Options.” Economic Paper 413, European
Commission, Brussels.
http://ec.europa.eu/economy_finance/publications/economic_paper/2010/pdf/ecp413_en.pdf. 1
Cottier, Thomas, Garba Malumfashi, Sofya Matteotti-Berkutova, Olga Nartova, Joëlle De Sépibus, and
Sadeq Z. Bigdeli. 2009. “Energy in WTO Law and Policy.” NCCR Trade Working Paper 2009/25,
Swiss National Centre of Competence in Research, Geneva. 2
Covert, Thomas, Michael Greenstone, and Christopher R. Knittel. 2016. “Will We Ever Stop Using
Fossil Fuels?” Journal of Economic Perspectives 30 (1): 117–38. 1
CWEA (China Wind Energy Association). 2015. 2007-2014 China’s Wind Power Installed Capacity
Statistics. Accessed April 18, 2015. Available from http://www.cwea.org.cn. 3
Dai, Hancheng, Xuxuan Xie, Yang Xie, Jian Liu, and Toshihiko Masui. 2016. “Green Growth: The
Economic Impacts of Large-Scale Renewable Energy Development in China.” Applied Energy 162:
435–49. 1

125
Davidson, Michael. 2014. “Will an Ultra-High Voltage Transmission Supergrid Solve China’s Air
Pollution Crisis?” The Energy Collective. April 23. http://theenergycollective.com/michael-
davidson/371396/primetime-debate-will-ultra-high-voltage-transmission-supergrid-solve-china.
Dechezleprêtre, Antoine, Matthieu Glachant, Ivan Haščič, Nick Johnstone, and Yann Ménière. 2011.
“Invention and Transfer of Climate Change–Mitigation Technologies: A Global Analysis.” Review of
Environmental Economics and Policy 5 (1): 109–30. 3
DuPont. 2016. “DuPont Innovalight Silicon Inks Enable Superior for Selective Emitter Solar Cells.”
http://www.dupont.com/products-and-services/solar-photovoltaic-materials/silicon-inks.html. 4
Durkay, Jocelyn. 2016. “State Renewable Portfolio Standards and Goals.” NCSL.org, December 13.
http://www.ncsl.org/research/energy/renewable-portfolio-standards.aspx. 2
Dutz, Mark A. and Siddharth Sharma. 2012. “Green Growth, Technology and Innovation.” Policy
Research Working Paper 5932, World Bank, Washington, DC. 1
Economist. 2014. January 17. 1
———. 2017. “Volts Wagons.” February 18. 1
EIA (U.S. Energy Information Administration). 2012. “Wind Energy Tax Credit Set to Expire at the
End of 2012.” Today in Energy (blog), November 21.
http://www.eia.gov/todayinenergy/detail.php?id=8870. 2
EnergyTrend PV. 2016. “Final Ruling for Second Review of US-China Solar Trade Dispute Unveiled,
Duty Rates to Drive Down Solar Product Prices in US.” EnergyTrend PV, June 24.
http://pv.energytrend.com/research/Final_Ruling_for_Second_Review_of_US_China_Solar_Trade_Di
spute_Unveiled.html. 1
Ernst, Dieter, and Barry Naughton. 2012. “Global Technology Sourcing in China’s Integrated Circuit
Design Industry: A Conceptual Framework and Preliminary Findings.” East-West Center Working
Papers, Economics Series No. 131, East-West Center, Honolulu. 2

126
Fankhauser, Sam, Alex Kazaglis, and Sugandha Srivastav. 2017. “Green Growth Opportunities for
Asia.” ADB Economics Working Paper 508, Asian Development Bank, Manila, January.
https://www.adb.org/sites/default/files/publication/224391/ewp-508.pdf. 4
Fehrenbacher, Katie. 2014. “Behind the Scenes of Aquion Energy’s Battery Factory & the Future of
Solar Storage.” Gigaom, July 20. https://gigaom.com/2014/07/20/behind-the-scenes-of-aquion-
energys-battery-factory-the-future-of-solar-storage. 5
Fischer, Doris. 2014. “Green Industrial Policies in China—The Example of Solar Energy.” In Green
Industrial Policy in Emerging Countries, edited by Anna Pegels, 69–103. London; New York:
Routledge. 4
Forsell, Tuomas. 2017. “Chinese Battery Maker CATL Buys Stake in Finnish Car Supplier.” Reuters,
January 30. http://www.reuters.com/article/us-valmet-automotive-m-a-catl-idUSKBN15E10U. 5
Francois, Joseph F., and Laura M. Baughman. 2016. “Value of the Environmental Goods Agreement:
Helping China Meet Its Environmental Goals.” Paper prepared by Trade Partnership Worldwide
LLC.
https://www.uschina.org/sites/default/files/Value%20of%20the%20Environmental%20Goods%
20Agreement%20on%20China%20(English).pdf. 3
Frankfurt School-UNEP Centre/BNEF. 2016. Global Trends in Renewable Energy Investment 2016.
Frankfurt School–United Nations Environment Programme Collaborating Centre for Climate and
Sustainable Energy Finance and Bloomburg New Energy Finance, Frankfurt.
Gallagher, Kelly Sims. 2014. The Globalization of Clean Energy Technology: Lessons from China.
Cambridge, MA: MIT Press. 34
GCEC (Global Commission on the Economy and Climate). 2014. China and the New Climate Economy.
Beijing: GCEC/Tsinghua University. 1
General Office of the State Council. 2014. “国务院办公厅关于印发能源发展战略 行动计划(2014–
2020年)的通知 [Energy Development Strategy Action Plan 2014–2020].”
http://www.gov.cn/zhengce/content/2014-11/19/content_9222.htm. 5

127
Ghiollarnáth, Carol Ní. 2011. “Renewable Energy Tax Incentives and WTO Law: Irreconcilably
Incompatible? An Examination of the WTO-Consistency of Direct Corporate Tax Incentives for the
Development of Renewable Energy.” PhD diss., Maastricht University, the Netherlands. 2
Goldwind. 2015. “Goldwind Successfully Issued the World's First Single-Owned Enterprises Green
Bonds.” July 20.
http://translate.google.com/translate?hl=en&sl=auto&tl=en&u=http%3A%2F%2Fwww.goldwind.
cn%2Fweb%2Fnews.do%3Faction%3Ddetail%26id%3D201507200211047846. 6
———. 2016. “Goldwind Announces New GW3S Smart Wind Turbine.” PR Newswire, November 15.
http://www.prnewswire.com/news-releases/goldwind-announces-new-gw3s-smart-wind-
turbine-300362605.html. 3
Gosens, Jorrit, and Yonglong Lu. 2013. “From Lagging to Leading? Technological Innovation
Systems in Emerging Economies and the Case of Chinese Wind Power.” Energy Policy 60: 234–50.
———. 2014. “Prospects for Global Market Expansion of China’s Wind Turbine Manufacturing
Industry.” Energy Policy 67: 301–318.
Government of China. 2010. “State Council Decision on Accelerating the Development of the
Strategic Emerging Industries” [国务院关于加快培育和发展战略性新兴产业的决定: 国发2010, 32
号]. Communique of the State Council, October 18. http://www.gov.cn/zwgk/2010-
10/18/content_1724848.htm. 1
———. 2011. “12th Five-Year Plan for National Economic and Social Development of the People’s
Republic of China” [中华人民共和国国民经济和社会发展第十二个五年规划纲要]. March 16.
http://news.xinhuanet.com/politics/2011-03/16/c_121193916.htm. 1
Government of India, Ministry of New and Renewable Energy. 2010. “Jawaharlal Nehru National
Solar Mission: Towards Building Solar India.” Mission document, Ministry of New and Renewable
Energy, New Delhi. 2
Green, Martin. 2007. “Heroes of the Environment: Shi Zhengrong.” Time, October 17.
http://www.time.com/time/specials/2007/article/0,28804,1663317_1663322_1669932,00.html.
4

128
Greve, Morten. 2017. “Danish Wind Turbine Sets World Record in Energy Production.” Knowledge,
February 7. http://www.dr.dk/nyheder/viden/miljoe/dansk-vindmoelle-saetter-verdensrekord-i-
energiproduktion. 3
Griliches, Z. 1990. “Patent Statistics as Economic Indicators: A Survey.” Journal of Economic
Literature 28 (4): 1661–1707. 3
Grubler, Arnulf, Francisco Aguayo, Kelly Gallagher, Marko Hekkert, Kejun Jiang, Lynn Mytelka, Lena
Neij, Gregory Nemet, and Charlie Wilson. 2012. “Chapter 24—Policies for the Energy Technology
Innovation System (ETIS).” In Global Energy Assessment—Toward a Sustainable Future, 1665–744.
Cambridge, U.K., and New York: Cambridge University Press and Laxenburg, Austria: International
Institute for Applied Systems Analysis. http://www.globalenergyassessment.org. 23
GWEC (Global Wind Energy Council). 2016. “Global Wind Report 2015.” GWEC, Brussels.
http://www.gwec.net/publications/global-wind-report-2/. 3
GWEC (Global Wind Energy Council) and IRENA (International Renewable Energy Agency). 2012.
30 Years of Policies for Wind Energy: Lessons from 12 Wind Energy Markets. Abu Dhabi: IRENA. 3
Hart, Melanie. 2015. “Current Patterns and Future Opportunities: Mapping Chinese Direct
Investment in the U.S. Energy Economy.” Center for American Progress, Washington, DC, July 30.
https://www.americanprogress.org/issues/green/reports/2015/07/30/118372/current-
patterns-and-future-opportunities/. 3
Hart, Melanie, and Angela Luh 2015. “Chinese Direct Investment in the U.S. Energy Economy.”
Center for American Progress, Washington, DC, July 30.
https://www.americanprogress.org/issues/green/news/2015/07/30/118379/chinese-direct-
investment-in-the-u-s-energy-economy/. 3
Heal, Geoffrey. 2016. “Notes on the Economics of Energy Storage.” NBER Working Paper 22752,
National Bureau of Economic Research, Cambridge, MA. http://www.nber.org/papers/w22752. 5
Helm, Dieter. 2016. “The Future of Fossil Fuels: Is It the End?” Oxford Review of Economic Policy 32 (2): 191–205. 1

129
Hepler, Lauren. 2017. “Berkeley-Based Tech Incubator Cyclotron Road Aids Companies Focused on
Energy Innovation.” San Francisco Business Times, February 2.
http://www.bizjournals.com/sanfrancisco/news/2017/02/02/berkeley-based-tech-incubator-
cyclotron-road-aids.html. 6
Holloway, Milton. 2016. “The Texas Energy Storage Market: A Four-Part Examination.” Emerging
Energy Insights, October 11. http://www.emergingenergyinsights.com/2016/10/texas-energy-
storage-market-four-part-examination/. 5
Hopkins, Matthew, and Yin Li. 2016. “The Rise of the Chinese Solar PV Industry.” In China as an
Innovation Nation, edited by Yu Zhou, William Lazonick, and Yifei Sun. New York: Oxford University
Press. 4
Hornby, Lucy. 2014. “China’s Anti-Corruption Drive Focuses on Energy Industry.” Financial Times,
May 28. http://www.ft.com/cms/s/0/5379486c-e608-11e3-a7f5-
00144feabdc0.html#axzz3KrUGupY4. 2
Horner, N., I. Azevedo, and D. Hounshell. 2013. “Effects of Government Incentives on Wind
Innovation in the United States.” Environmental Research Letters.
doi:10.1016/j.techfore.2006.03.002. 3
HSBC. 2010. “China’s Next 5-Year Plan: What It Means for Equity Markets.” Economics and equity
strategy, HSBC Global Research, Hong Kong, SAR, China, October 6. 1
Hu, Rui, Jim Skea, and Matthew Hannon. 2016. “The Drivers for China’s Wind Energy Technology
Innovation System.” Paper presented at the British Institute of Energy Economics Conference,
Oxford, September 21–22.
https://www.researchgate.net/publication/308724078_The_drivers_for_China’s_wind_energy_tech
nology_innovation_system. 3
Hübler, Michael. 2011. “Technology Diffusion under Contraction and Convergence: A CGE Analysis
of China.” Energy Economics 33 (1): 131–42. 1
Hübler, Michael, Sebastian Voigt, and Andreas Löschel. 2014. “Designing an Emissions Trading
Scheme for China—An Up-to-Date Climate Policy Assessment.” Energy Policy 75: 57–72. 1

130
Huenteler, Joern, Tobias S. Schmidt, Jan Ossenbrink, and Volker H. Hoffmann. 2016. “Technology
Life-Cycles in the Energy Sector—Technological Characteristics and the Role of Deployment for
Innovation.” Technological Forecasting and Social Change 104 (March): 102–21.
doi:10.1016/j.techfore.2015.09.022. 4
ICMA (International Capital Market Association). 2016. “Green Bond Principles.”
http://www.icmagroup.org/Regulatory-Policy-and-Market-Practice/green-bonds/green-bond-
principles/. 6
Joint Policies and Measures Database.”
http://www.iea.org/policiesandmeasures/renewableenergy/. 2
IET CAS (Institute of Engineering Thermophysics, Chinese Academy of Sciences). 2016. “Energy
Storage R&D Center.” http://english.iet.cas.cn/Institute/6/. 5
———. 2017. “Zhong-Ke-Ao-Neng Gas Technology (Beijing) Co., Ltd.”
http://english.iet.cas.cn/Cooperation/Shareholding/201606/t20160614_164402.html. 5
IRENA (International Renewable Energy Agency). 2014. “Renewable Energy Prospects: China.”
REmap 2030 analysis, IRENA, Abu Dhabi.
http://www.irena.org/menu/index.aspx?mnu=Subcat&PriMenuID=36&CatID=141&SubcatID=480.
2
———. 2016. “Data and Statistics.” IRENA, Abu Dhabi.
http://resourceirena.irena.org/gateway/dashboard/?topic=3&subTopic=32. 34
IRS (Internal Revenue Service). 2016. “Instructions for Form 3468, Investment Credit.”
https://www.irs.gov/pub/irs-pdf/i3468.pdf. 5
ISO (California Independent System Operator), CPUC (California Public Utilities Commission), and
CEC, (California Energy Commission). 2014. “Advancing and Maximizing the Value of Energy
Storage Technology: A California Roadmap.” December 31. http://energystorage.org/energy-
storage/industry-resources/caiso. 5

131
ITA (International Trade Administration). 2016. “2016 Top Markets Report: Renewable Energy.”
ITA, U. S. Department of Commerce.
http://trade.gov/topmarkets/pdf/Renewable_Energy_Top_Markets_Report.pdf. 3
JA Solar. 2016. “JA Solar: History & Milestones.”
http://www.jasolar.com/site/about_develment?year=2012. 4
Jaffe, Adam B., and Manuel Trajtenberg. 1996. “Flows of Knowledge from Universities and Federal
Labs: Modeling the Flow of Patent Citations over Time and Across Institutional and Geographic
Boundaries.” Proceedings of the National Academy of Sciences 93: 12671–77. 3
Jaffe, Adam B., Manuel Trajtenberg, and Rebecca Henderson. 1993. “Geographic Localization of
Knowledge Spillovers as Evidenced by Patent Citations.” Quarterly Journal of Economics 108: 577–
98. 3
Jin, Wei. 2012. “Can Technological Innovation Help China Take on Its Climate Responsibility? An
Intertemporal General Equilibrium Analysis.” Energy Policy 49: 629–41. 1
Johnstone, Nick, Ivan Haščič, David Popp. 2010. “Renewable Energy Policies and Technological
Innovation: Evidence Based on Patent Counts.” Environonmental and Resource Economics 45: 133–
55. doi:10.1007/s10640-009-9309-1. 3
Kai, Ouyang. 2015. “National Carbon Emissions Trading Market to Launch Next Year Involving 3–4
Billion Tons” [全国碳交易市场明年启动 排放量涉及30亿-40亿吨]. Sina.com, February 9.
http://finance.sina.com.cn/chanjing/cyxw/20150209/011421504128.shtml. 1
Kirkegaard, Julia. 2015. “Ambiguous Winds of Change—Or Fighting against Windmills in Chinese
Wind Power: Mapping Controversies over a Potential Turn to Quality in Chinese Wind Power.” PhD
thesis, Copenhagen Business School. 3
Kucinskis, Gints, Gunars Bajars, and Janis Kleperis. 2013. “Graphene in Lithium Ion Battery Cathode
Materials: A Review.” Journal of Power Sources 240 (October 15): 66–79.
http://www.sciencedirect.com/science/article/pii/S0378775313005545. 5

132
Kuntze, Jan-Christoph, and Tom Moerenhout. 2013. “Local Content Requirements and the
Renewable Energy Industry—A Good Match?” Working paper, International Centre for Trade and
Sustainable Development, Geneva. http://ictsd.org/i/publications/165193/?view=details. 2
Lam, Long, Lee Branstetter, and Ines Azevedo, 2017. “China’s Wind Industry: Leading in
Deployment, Lagging in Innovation,” Energy Policy 106 (2017), pp. 588-599.
Lambert, Fred. 2015. “A Number of Companies Are Now Using Tesla’s Open-Source Patents and It
Has Some Interesting Implications.” Electrek, November 10. https://electrek.co/2015/11/10/a-
number-of-companies-are-now-using-teslas-open-source-patents-and-it-has-some-interesting-
implications/. 5
———. 2016. “Tesla Powerwall 2 Is a Game Changer in Home Energy Storage: 14 kWh W/Inverter
for $5,500.” Electrek, October 29. https://electrek.co/2016/10/28/tesla-powerwall-2-game-
changer-in-home-energy-storage-14-kwh-inverter-5500/. 5
Larson, Christina. 2014. “Overhaul of Chinese Science Spending Looms.” Science, October 23.
http://www.sciencemag.org/news/2014/10/overhaul-chinese-science-spending-looms. 1 2
Lei Zhen, Zhen Sun, and Brian Wright. 2013. “Patent Subsidy and Patent Filing in China.” Fung
Institute, University of California, Berkeley. http://funginstitute.berkeley.edu/wp-
content/uploads/2013/12/patent_subsidy_Zhen.pdf
LeVine, Steve. 2015. “Two Industrial Titans Are Duking It Out over a Technology That Could Make
Electric Cars Mainstream.” Quartz, March 30. https://qz.com/369657/two-industry-titans-are-
duking-it-out-over-a-technology-that-could-make-electric-cars-mainstream/. 5
Lew, Debra J. 2000. “Alternatives to Coal and Candles: Wind Power in China.” Energy Policy 28 (4):
271–86. doi:http://dx.doi.org/10.1016/S0301-4215(99)00077-4. 3
Lewis, Joanna I. 2007a. “A Comparison of Wind Power Industry Development Strategies in Spain,
India and China.” Report prepared for the Energy Foundation China Sustainable Energy Program by
the Center for Resource Solutions, San Francisco. 2

133
———. 2007b. “A Review of the Potential International Trade Implications of Key Wind Power
Industry Policies in China.” Policy analysis prepared for the Energy Foundation China Sustainable
Energy Program, Beijing. 2
———. 2011. “Building a National Wind Turbine Industry: Experiences from China, India, and
South Korea.” International Journal of Technology and Globalisation 5 (3/4): 281–305. 3
———. 2013. Green Innovation in China: China’s Wind Power Industry and the Global Transition to a
Low-Carbon Economy. New York: Columbia University Press. 234
———. 2014. “The Rise of Renewable Energy Protectionism: Emerging Trade Conflicts and
Implications for Low Carbon Development.” Global Environmental Politics 14 (4): 10–35. 2 3
———. 2016a. “The Development of China’s Wind Power Technology Sector: Characterizing
National Policy Support, Technology Acquisition and Technological Learning.” In China as an
Innovation Nation, edited by Yu Zhou, William Lazonick, and Yifei Sun. New York: Oxford University
Press. 3
———. 2016b. “Wind Energy in China: Getting More from Wind Farms.” Nature Energy 1 (6):
16076. doi:10.1038/nenergy.2016.76. 35
Lewis, Joanna I., and Ryan H. Wiser. 2007. “Fostering a Renewable Energy Technology Industry: An
International Comparison of Wind Industry Policy Support Mechanisms.” Energy Policy 35 (3):
1844–57. doi:10.1016/j.enpol.2006.06.005. 2
Li, Junfeng, Pengfei Shi, and Hu Gao. 2010. “2010 China Wind Power Outlook.” Chinese Renewable
Energy Council, Beijing; Global Wind Energy Council, Brussels; and Greenpeace, Beijing.
http://www.greenpeace.org/eastasia/publications/reports/climate-energy/2010/wind-power-
report-english-2010/. 3
Li, Pang. 2009. “MOST: No Surplus Capacity in New Energy.” China.org.cn, November 17.
http://www.china.org.cn/business/2009-11/17/content_18903291.htm.
Li, Xibao. 2012. “Behind the Recent Surge of Chinese Patenting: An Institutional View.” Research
Policy 41(1): 236–49. 3
134
Liang, Xiupei. 2014. “Lost in Transmission: Distributed Solar Generation in China.” China
Environment Forum, Wilson Center. Washington, DC.
http://www.wilsoncenter.org/sites/default/files/Lost%20in%20Transmission_Distributed%20Sol
ar%20Generation%20in%20China_Xiupei%20Liang_2.pdf.
Liu, Jialu, and Don Goldstein. 2013. “Understanding China’s Renewable Energy Technology
Exports.” Special Section: Transition Pathways to a Low Carbon Economy, edited by Timothy J.
Foxon, Geoffrey P. Hammond, Matthew Leach, and Peter J.G. Pearson, Energy Policy 52 (January):
417–28. doi:10.1016/j.enpol.2012.09.054. 4
Loon, Mark. 2016. “Innovation in the Local Context—A Case Study of BYD in China.” University of
London. http://eprints.worc.ac.uk/4603/. 5
Lovinger Kaufmann LLP. 2013. “FERC Order No. 792 (Part 2 of 3): Benefits for Energy Storage.”
December 31. http://lklaw.com/ferc-order-no-792-part-2-of-3-benefits-for-energy-storage/. 5
Luo, Xing, Jihong Wang, Mark Dooner, and Jonathan Clarke. 2015. “Overview of Current
Development in Electrical Energy Storage Technologies and the Application Potential in Power
System Operation.” Applied Energy 137 (January): 511–36. doi:10.1016/j.apenergy.2014.09.081. 5
Mah, Daphne Ngar-yin, and Peter Hills. 2010. “The State-Industry-University Collaboration for Wind
Energy: Local Diversity, Achievements, and Limits in China.” In Proceedings of China Windpower
2010. Beijing, China. 3
Mancheva, Militsa. 2016. “Shunfeng of China May Shed Upstream Solar Ops for USD 760m.”
Renewables Now, June 1. http://renewables.seenews.com/news/shunfeng-of-china-may-shed-
upstream-solar-ops-for-usd-760m-527192. 4
Marins, Luciana Manhães. 2008. “The Challenge of Measuring Innovation in Emerging Economies’
Firms: A Proposal of a New Set of Indicators on Innovation.” Maastricht Economic and Social
Research Institute on Innovation and Technology, United Nations University. 1
McCrone, Angus, Ulf Moslener, Francoise d’Estais, Eric Usher, and Christine Grüning, eds. 2016.
Global Trends in Renewable Energy Investment 2016. Hesse, Germany: Frankfurt School of Finance
and Management. 1
135
McKibbin, Warwick J., Adele C. Morris, Peter J. Wilcoxen, and Weigfeng Liu. 2015. “China’s Carbon
Future: A Model-Based Analysis.” Climate and Energy Discussion Paper, Brookings Institution,
Washington, DC. 1
MEP (Ministry of Environmental Protection)/NDRD (National Development and Reform
Commission)/MOF (Ministry of Finance). 2012. “Twelfth Five-Year Plan on Air Pollution Prevention
and Control in Key Regions” [English tr.]. http://www.epa.gov/ogc/china/air%20pollution.pdf. 1
Ministry of Finance, China. 2008. Interim Measures on Management of Special Project Funds for the
Industrialization of Wind Power Generation Equipment, Regulation No. 476.
Ministry of Finance, and State Administration of Taxation, China. 2001. Notice Regarding Policy
Issues for Comprehensive Utilization of Some Natural Resources and Other Goods, No. 198.
Ministry of Mines and Energy of Brazil. 2010. “Programa de Incentivo Às Fontes Alternativas de
Energia Elétrica (PROINFA) (Program of Incentives for Alternative Electricity Sources).”
http://www.mme.gov.br/programas/proinfa/. 2
Ministry of Science and Technology, China. 2012. “Twelfth Five-Year Plan for Wind Power Science
and Technology Development [关于印发风力发电科技发展‘十二五’专项规划的通知].”
http://www.most.gov.cn/fggw/zfwj/zfwj2012/201204/t20120424_93884.htm. 3
Ministry of Science and Technology, State Development Planning Commission, and State Economic
and Trade Commission, China. 2002. “Evaluation of Policies Designed to Promote the
Commercialization of Wind Power Technology in China.” Energy Foundation, China Sustainable
Energy Program, Beijing. 3
Mints, Paula. 2016. “2015 Top Ten PV Cell Manufacturers.” Renewable Energy World, April 8.
http://www.renewableenergyworld.com/articles/2016/04/2015-top-ten-pv-cell-
manufacturers.html. 4
Morin, Bill. 2010. “Commentary on US-China Cooperation on Renewable Energy from the
Perspective of Applied Materials.” China Environment Forum, Wilson Center, Washington, DC,
December 2.

136
Murkowski, Lisa. 2016. “Actions—S. 2012—114th Congress (2015–2016): North American Energy
Security and Infrastructure Act of 2016.” September 8. https://www.congress.gov/bill/114th-
congress/senate-bill/2012/all-actions. 5
Myllyvirta, Lauri. 2016. “New Trends in China Energy Consumption.” Brookings Institution,
Washington, DC. https://www.brookings.edu/wp-content/uploads/2016/07/PPT_Lauri-
Myllyvirta.pdf. 1
Nahm, Jonas, and Edward S. Steinfeld. 2014. “Scale-up Nation: China’s Specialization in Innovative
Manufacturing.” World Development 54 (February): 288–300. doi:10.1016/j.worlddev.2013.09.003.
34
Nakano, Jane, and Kang Wu. 2016.”The Changing Political Economy of Energy in China.” Center for
Strategic and International Studies, Washington, DC. https://www.csis.org/analysis/changing-
political-economy-energy-china. 1
Nanda, R., K. Younge, and L. Fleming. 2015. “Innovation and Entrepreneurship in Renewable
Energy.” In The Changing Frontier: Rethinking Science and Innovation Policy, edited by A. Jaffe and B.
Jones, 199–232. Chicago, IL: University of Chicago Press. 3
National Climate Strategy Center, November 17.
http://www.ncsc.org.cn/article/yxcg/yjgd/201411/20141100001254.shtml. 1
National Energy Administration. 2016. “Wind Power Grid Connection in the First Three Quarters of
2016.” November 18. http://www.nea.gov.cn/2016-11/18/c_135839581.htm. 1
National People’s Congress of China. 2005. The Renewable Energy Law of the People’s Republic of
China. 2
———. 2016. “The 13th Five-Year Plan for Economic and Social Development of the People’s
Republic of China.” http://en.ndrc.gov.cn/newsrelease/201612/P020161207645765233498.pdf. 5
National People’s Congress Standing Committee. 2009. “China Renewable Energy Law Decision.”
http://www.npc.gov.cn/huiyi/cwh/1112/2009–12/26/content_1533217.htm. 2

137
NDRC (National Development and Reform Commission, China). 2005. Notice from the National
Development and Reform Commission on the Relevant Requirements for the Administration of the
Construction of Wind Farms, No. 1204). July 4. http://documents.nytimes.com/chinas-
requirements-for-wind-farms?ref=global. 3
———. 2011. NDRC Notice on Improving Solar PV Electricity Pricing Policy (No. 1594) [in Chinese].
http://www.ndrc.gov.cn/zcfb/zcfbtz/2011tz/t20110801_426501.htm.
———2014. “National Climate Change Plan (2014–2020).” September 19.
http://www.sdpc.gov.cn/zcfb/zcfbtz/201411/t20141104_642612.html. 1
———. 2015a. “China’s Nationally Determined Contribution.” June 30.
http://www4.unfccc.int/Submissions/INDC/Published%20Documents/China/1/China’s%20INDC
%20-%20on%2030%20June%202015.pdf. 1
———. 2015b. “附件 4 关于有序放开发用电计划的实施意见 [Annex 4: On the Implementation of
the Orderly Development of Electricity Plans].”
www.sdpc.gov.cn/gzdt/201511/W020151130314768643254.pdf.
———. 2016a. “Energy Technology Revolution Innovation Action Plan, 2016–2030.”
http://www.sdpc.gov.cn/gzdt/201606/W020160601321860444534.pdf. 6
———. 2016b. Measures for the Administration of Guaranteed Acquisition of Renewable Energy
Power Generation [可再生能源发电全额保障性收购管理办法]. March 24.
http://www.ndrc.gov.cn/zcfb/zcfbtz/201603/t20160328_796404.html. 3
———. 2016c. “National Development and Reform Commission on the Issuance of ‘Renewable
Energy Power Generation.’”
http://www.sdpc.gov.cn/zcfb/zcfbtz/201603/t20160328_796404.html. 6
———. 2016d. Notice on the Renewable Energy Peak Load Unit Priority Power Generation Pilot
Scheme [可再生能源调峰机组优先 发电试行办法]. July 14.
http://www.ndrc.gov.cn/zcfb/zcfbtz/201607/t20160722_811984.html. 36
138
NDRC (National Development and Reform Commission, China) Pricing Department. 2009.
Regulation No. 1906, Notice on Policy to Improve Grid-Connected Power Pricing for Wind Power
Generation. 3
NDRC (National Development and Reform Commission, China) and NEA (National Energy
Administration, China). 2016. “能源技术革命创新行动计划 (2016–2030 年) [Energy Technology
Revolution Innovation Action Plan 2016-2030].”
http://www.ndrc.gov.cn/zcfb/zcfbtz/201606/t20160601_806201.html.
NDRC (National Development and Reform Commission, China), NEA (National Energy
Administration, China), and MIIT (Ministry of Industry and Information Technology, China). 2016.
“Guidance of Promoting Internet + Smart Energy Development.”
NDRC (National Development and Reform Commission, China), NEA (National Energy
Administration, China), and MOF (Ministry of Finance, China). 2016. “Guidance for Promoting
Electrification.”
NEA (National Energy Administration, China). 2016a. “Notice of the National Energy Administration
on Pilot Project of Promoting Electricity Storage to Participate in the ‘Three North’ Area Electricity
Supplementary Service Compensation (Market) Mechanism [政府信息公开目录---国家能源局---国
家能源局关于促进电储能参与‘三北’地区电力辅助服务补偿] No. 164.” June 7.
http://zfxxgk.nea.gov.cn/auto92/201606/t20160617_2267.htm. 5
———. 2016b. “Notice on Pilots of Ancillary Services Market Reforms in Northeast China.” 5
———. 2016c. “Notice on Pilots of Promoting the Participation of Electrical Energy Storage in the
Ancillary Services Compensation Mechanism.” 5
———. 2016d. “Wind Power Grid Connection in the First Three Quarters of 2016.” November 18.
http://www.nea.gov.cn/2016-11/18/c_135839581.htm 3
———. 2017. “国家能源局关于公布首批多能互补集成优化示范工程的通知37号 [NEA Notice No.
37 Announcing the First Energy Storage Demonstration Project].”
http://zfxxgk.nea.gov.cn/auto82/201702/t20170206_2500.htm. 5

139
Nemet, G. F. 2009. “Demand-Pull, Technology-Push, and Government-Led Incentives for Non-
incremental Technical Change.” Research Policy 38: 700–709. doi:10.1016/j.respol.2009.01.004. 3
Ng, Eric. 2016. “Wind Turbine Giant Goldwind in Power Joint Venture with Apple.” South China
Morning Post, December 7. http://www.scmp.com/business/companies/article/2052643/wind-
turbine-giant-goldwind-power-joint-venture-apple. 3
Nielsen, Stephan. 2013. “Buy-Local Rules Make Vestas Wind-Market Loser in Brazil.”
Bloomberg.com, October 4. https://www.bloomberg.com/news/articles/2013-10-04/buy-local-
rules-make-vestas-wind-market-loser-in-brazil. 2
NRC (National Research Council). 2012. Building the U.S. Battery Industry for Electric Drive Vehicles:
Progress, Challenges, and Opportunities—Summary of a Symposium. Washington, DC: National
Academies Press. https://www.nap.edu/read/13370/chapter/3#13. 5
NREL (National Renewable Energy Laboratory) and SGERI (State Grid Energy Research Institute).
2016. “Grid-Level Application of Electrical Energy Storage and Use Cases in the United States and
China.” Draft report. 5
NSF (National Science Foundation) Beijing Office. 2016. “China Announces Major Reform of
Competitive S&T Funding.” NSF.gov.
http://www.nsf.gov/od/oise/beijing/perspectives/china_reforms_st_funding.jsp. 2
NY-BEST (New York Battery and Energy Storage Technology Consortium). 2016. “2016 Energy
Storage Roadmap for New York’s Electric Grid.” https://www.ny-best.org/page/2016-energy-
storage-roadmap-new-yorks-electric-grid. 5
———. 2017. “About Us.” https://www.ny-best.org/About_NY-BEST. 5
Nykvist, Bjorn, and Måns Nilsson. 2015. “Rapidly Falling Costs of Battery Packs for Electric
Vehicles.” Nature Climate Change 5: 329–32. 1
OECD (Organisation for Economic Co-operation and Development). 2009. OECD Patent Statistics
Manual. Paris: OECD Publishing. http://browse.oecdbookshop.org/oecd/pdfs/free/9209021e.pdf.3

140
———. 2011a. Towards Green Growth. Paris: OECD Publishing. 1
———. 2011b. Fostering Innovation for Green Growth. Paris: OECD Publishing. 1
Orcutt, Mike. 2015. “Where’s the Money for Energy Startups?” MIT Technology Review, November
23. 6
People.com.cn. 2011. “Zhang Guobao: ‘Twelfth Five’ Push to Non-Fossil Energy to Account for 11.4
Percent Share of Primary Energy” [张国宝:’十二五’末力争非化石能源占一次能源比重11.4%].
January 6. http://energy.people.com.cn/GB/13670716.html. 1
Oster, Shai, and Lulu Yilun Chen. 2016. “Inside China’s Historic $338 Billion Tech Startup
Experiment.” Bloomberg Technology, March 8. https://www.bloomberg.com/news/articles/2016-
03-08/china-state-backed-venture-funds-tripled-to-338-billion-in-2015. 4
Polaris Power News Network. 2014. “中国首个1.5兆瓦压缩空气储能微电网项目正式启动 [China’s
First 1.5-Megawatt Compressed Air Storage Microgrid Project Was Officially Launched].” December
5. http://news.bjx.com.cn/html/20141205/570754.shtml. 5
Polaris Smart Grid Online News. 2013. “China Wants to Build What Kind of Power? Three Options
Still Hotly Debated” [中国要建什么样的电网’ 三套方案各方仍争论激烈 - 北极星智能电网在线].
Chinasmartgrid.com.cn. June 18.
http://www.chinasmartgrid.com.cn/news/20130618/440360.shtml. 1
Popp, David. 2002. “Induced Innovation and Energy Prices.” American Economic Association 92:
160–80. 3
———. 2005. “Lessons from Patents: Using Patents to Measure Technological Change in
Environmental Models.” Ecological Economics 54 (2-3): 209–26. 3
Popp, David, Richard G. Newell, and Adam B. Jaffe. 2010. “Energy, the Environment, and
Technological Change.” In Handbook of the Economics of Innovation, vol. 2, edited by Bronwyn H.
Hall and Nathan Rosenberg. Amsterdam: Elsevier, 873–938. 1
141
Qi, Wu. 2012. “Chinese Race for Credible 10MW Turbine Design.” Windpower Monthly, June 13.
http://www.windpoweroffshore.com/article/1191994/chinese-race-credible-10mw-turbine-
design. 3
Qiu, Yueming, and Laura D. Anadon. 2012. “The Price of Wind Power in China during Its Expansion:
Technology Adoption, Learning-by-Doing, Economies of Scale, and Manufacturing Localization.”
Energy Economics 34 (3): 772–85. doi:10.1016/j.eneco.2011.06.008. 3
Quilter, James. 2012. “Ming Yang Admits Reliance on Aerodyn.” Windpower Monthly, May 1.
http://www.windpowermonthly.com/article/1129719/ming-yang-admits-reliance-aerodyn. 3
Raccichini, Rinaldo, Alberto Varzi, Stefano Passerini, and Bruno Scrosati. 2015. “The Role of
Graphene for Electrochemical Energy Storage.” Nature Materials 14 (3): 271–79.
http://www.nature.com/nmat/journal/v14/n3/abs/nmat4170.html. 5
REN21 (Renewable Energy Policy Network for the 21st Century). 2016. Renewables 2016 Global
Status Report. Paris: REN21 Secretariat. http://www.ren21.net/status-of-renewables/global-
status-report/. 34
REPower. 2010. “REpower Unternehmen: History/Milestones.” Accessed December 22.
http://www.repower.de/index.php?id=39&L=1&period=1994-2001. 3
Reuters. 2016. “Chinese Battery Maker Taking on Global Electric Car Market.” Fortune, December
25. http://fortune.com/2016/12/25/catl-chinese-electric-car-battery-maker/. 5
Reuters Beijing. 2015. “China to Launch Carbon Market Middle of 2016.” South China Morning Post,
February 4. http://www.scmp.com/business/commodities/article/1701610/china-launch-carbon-
market-middle-2016. 1
Rohde, Robert A., and Richard A. Muller. 2015. “Air Pollution in China: Mapping of Concentrations
and Sources.” PLoS ONE 10(8): e0135749. doi:10.1371/journal.pone.0135749. 1
Romei, Valentina. 2016. “Investments Boom in Renewable Energies.” Financial Times, March 3.
https://www.ft.com/content/8badeaa9-7ae5-3c0d-be7a-dd6c0c042860. 3

142
Ru, Peng, Qiang Zhi, Fang Zhang, Xiaotian Zhong, Jianqiang Li, and Jun Su. 2012. “Behind the
Development of Technology: The Transition of Innovation Modes in China’s Wind Turbine
Manufacturing Industry.” Energy Policy 43 (April): 58–69. doi:10.1016/j.enpol.2011.12.025. 3
Rubini, Luca. 2011. “The Subsidization of Renewable Energy in the WTO: Issues and Perspectives.”
NCCR Trade Working Paper 2011/32, Swiss National Centre of Competence in Research, Geneva. 2
Sanderson, Henry, Tom Hancock, and Leo Lewis. 2017. “Electric Cars: China’s Battle for the Battery
Market.” Financial Times, March 5. https://www.ft.com/content/8c94a2f6-fdcd-11e6-8d8e-
a5e3738f9ae4. 5
Schuman, Sara. 2010. “Improving China’s Existing Renewable Energy Legal Framework: Lessons
from the International and Domestic Experience.” NRDC white paper, Natural Resources Defense
Council China program, Beijing. 2
Schwartz, Mark. 2015. “Aluminum Battery from Stanford Offers Safe Alternative to Conventional
Batteries.” Stanford News, April 6. http://news.stanford.edu/2015/04/06/aluminum-ion-battery-
033115/. 5
ScienceDaily. 2016. “Unexpected Discovery Leads to a Better Battery.” April 18.
https://www.sciencedaily.com/releases/2016/04/160418145631.htm. 5
Service, Robert F. 2014. “Tanks for the Batteries.” Science 344 (6182): 352–54.
http://d2ufo47lrtsv5s.cloudfront.net/content/344/6182/352. 5
Shankleman, Jessica. 2016. “China’s Goldwind Knocks GE from Top Wind Market Spot.”
Bloomberg.com, February 22. http://www.bloomberg.com/news/articles/2016-02-22/china-s-
goldwind-knocks-ge-from-top-spot-in-global-wind-market. 3
Shao, Luning, Yixi Xue, and Jianxin You. 2014. “A Conceptual Framework for Business Model
Innovation: The Case of Electric Vehicles in China.” Problems of Sustainable Development 9 (2): 27–
37. https://papers.ssrn.com/abstract=2478597.
Shepherd, Christian, and Lucy Hornby. 2016. “Wind Turbine Maker Goldwind Looks Beyond
Xinjiang.” Financial Times, June 20. https://www.ft.com/content/6b536324-f1ea-11e5-9f20-
c3a047354386 3.

143
Siemens AG. 2016. “Eight-MW Giant Makes Offshore Wind Cheaper.” Pictures of the Future, July 29.
https://www.siemens.com/innovation/en/home/pictures-of-the-future/energy-and-
efficiency/sustainable-power-generation-offshore-wind-turbines-with-eight-megawatts.html. 3
Sivaram, Varun. 2015. “Why Concentration of the Solar Industry in China Will Hurt Technology
Innovation.” Greentech Media, July 29. https://www.greentechmedia.com/articles/read/why-
concentration-of-the-solar-industry-in-china-will-stunt-innovation. 4
Smith, Patrick. 2014. “United Power Develops New 6MW Model.” Windpower Offshore, October 8.
http://www.windpoweroffshore.com/article/1316329. 3
SMM (Shanghai Metals Market). 2016. “Energy Storage Battery—Industry Combing.” September.
https://o9kwm2s9v.qnssl.com/production/admin/news/file/jSwcWjPQKMLCZPlTYrvE20170120
105337.pdf. 5
Snieckus, Darius, 2016. “Goldwind Strengthens Chinese Danish Presence with Tech Centre.”
Recharge, February 23. http://www.rechargenews.com/wind/1424841/goldwind-strengthens-
chinese-danish-presence-with-tech-centre. 1 3
Solarbuzz. 2011. “Solar Energy Industry and Product Certifications.” Accessed January 4, 2017.
http://www.solarbuzz.com/ProductCertifications.htm. 4
Spegele, Brian. 2016. “China’s Clean Energy Push Runs into Headwinds.” Wall Street Journal,
December 4, 2016. http://www.wsj.com/articles/chinas-clean-energy-push-runs-into-headwinds-
1480852982. 1
Spring, Jake. 2016. “Power Surge: Chinese Electric Car Battery Maker Charges for Global Market.”
Reuters, December 25. http://www.reuters.com/article/us-china-autos-batteries-
idUSKBN14E0K1. 5
State Council of the People’s Republic of China. 2006. “The National Medium- and Long-Term
Program for Science and Technology Development (2006–2020).”
https://www.google.com/url?sa=t&rct=j&q=&esrc=s&source=web&cd=3&ved=0ahUKEwigjpr59_TQAhUsDMAKHWNrASkQFggsMAI&url=http%3A%2F%2Fsydney.edu.au%2Fglobal-
health%2Finternational-

144
networks%2FNational_Outline_for_Medium_and_Long_Term_ST_Development1.doc&usg=AFQjCNF
Sz8ieO3CQYpuGXEAmBFwtffmlEQ&sig2=uYhBjE-a7m3CZANjs1z1kw2
Statista. 2016. “Lithium-Ion Batteries.” Hamburg, Germany.
https://www.statista.com/statistics/235323/lithium-batteries-top-manufacturers/.
Stern, Nicholas. 2010. “China’s Growth, China’s Cities and the New Global Low-Carbon Industrial Revolution.” Policy paper, Centre for Climate Change Economics and Policy and Grantham Research
Institute on Climate Change and the Environment, London School of Economics and Political
Science. 1
Stuart 2012 4
Su, Wei. 2010. “Letter from China on Autonomous Domestic Mitigation Actions Submitted to
Appendix II of the Copenhagen Accord.” Letter from Department of Climate Change, National
Development and Reform Commission of China to the UNFCCC.
http://unfccc.int/files/meetings/cop_15/copenhagen_accord/application/pdf/chinacphaccord_ap
p2.pdf. 1
Suntech. 2016. “About Suntech.” http://www.suntech-power.com/menu/about-suntech.html. 4
Tang, Tian, and David Popp. 2014. “The Learning Process and Technological Change in Wind Power:
Evidence from China's CDM Wind Projects.” NBER Working Paper 19921, National Bureau for
Economic Research, Cambridge, MA.
Tesla. 2014a. “Gigafactory.” February 26. https://www.tesla.com/blog/gigafactory. 5
———. 2014b. “Patent Pledge.” June. https://www.tesla.com/about/legal#patent-pledge. 5
———. 2017a. “Tesla Energy Press Kit.” https://www.tesla.com/presskit/teslaenergy. 5
———. 2017b. “Tesla Gigafactory.” https://www.tesla.com/gigafactory. 5
145
Thomas, India. 2017. “BYD Tops Global Electric Vehicle Sales Charts for Second Year Running.”
Automotive World, February 7. http://www.automotiveworld.com/news-releases/byd-tops-global-
electric-vehicle-sales-charts-second-year-running/. 5
Trajtenberg, Manuel. 1990. “A Penny for Your Quotes: Patent Citations and the Value of
Innovations.” RAND Journal of Economics 21: 172–87.
UET (UniEnergy Technologies). 2016. “200MW/800MWh Energy Storage Station to Be Built with
Rongke Power’s Vanadium Flow Battery.” May 30. http://www.uetechnologies.com/news/71-
200mw-800mwh-energy-storage-station-to-be-built-with-rongke-power-s-vanadium-flow-battery.
5
UNEP. 2011. Towards a Green Economy: Pathways to Sustainable Development and Poverty
Eradication. Nairobi: United Nations Environment Programme.
———. 2015. Uncovering Pathways Towards an Inclusive Green Economy. Nairobi: United Nations
Environment Programme.
U.S. DOE (Department of Energy). 2010. “Electric Power Industry Needs for Grid-Scale Storage
Applications.” https://energy.gov/oe/downloads/electric-power-industry-needs-grid-scale-
storage-applications. 5
———. 2013. “Southern Grid Baoqing Plant Phase-2 [南网宝清电站项目一期工程-2].” DOE Global
Energy Storage Database. December. https://www.energystorageexchange.org/projects/855. 5
———. 2017. “GuoDian LongYuan Wind Farm VFB.” DOE Global Energy Storage Database. May.
http://www.energystorageexchange.org/projects/1624. 5
Vest, Charles. 2017. “China Turns to Energy Storage to Push Renewables.” Eco-Business, February
28. http://www.eco-business.com/news/china-turns-to-energy-storage-to-push-renewables/. 6
Wang, Ke, Can Wang, and Jining Chen. 2009. “Analysis of the Economic Impact of Different Chinese
Climate Policy Options Based on a CGE Model Incorporating Endogenous Technological Change.”
Energy Policy 37: 2930–40. 1

146
Wang, Yunshi, Daniel Sperling, Gil Tal, and Haifeng Fang. 2017. “China’s Electric Car Surge.” Energy
Policy 102 (March): 486–90. doi:10.1016/j.enpol.2016.12.034. 5
Wang, Zhongying, Haiyan Qin, and Joanna I. Lewis. 2012. “China's Wind Power Industry: Policy
Support, Technological Achievements, and Emerging Challenges.” Energy Policy 51: 80–88.
doi:10.1016/j.enpol.2012.06.067. 3
Watts, Jonathan. 2008. “Jonathan Watts Speaks to Shi Zhengrong, the World’s First Solar
Billionaire.” Guardian, July 25.
http://www.guardian.co.uk/environment/audio/2008/jul/25/watts.solar. 4
Wesoff, Eric. 2011. “Innovalight: Successful Solar Startup, Troubling Exit.” Greentech Media, July 28.
https://www.greentechmedia.com/articles/read/Innovalight-Successful-Solar-Startup-Troubling-
Exit. 4
Wilke, Marie. 2011. “Feed-in Tariffs for Renewable Energy and WTO Subsidy Rules: An Initial Legal
Review.” ICTSD Issue Paper 4, International Centre for Trade and Sustainable Development.
Geneva. 2
Wing, Ian Sue. 2011. “Computable General Equilibrium Models for the Analysis of Energy and
Climate Policies.” In International Handbook on the Economics of Energy, paperback ed., edited by
Joanne Evans and Lester C. Hunt. Cheltenham, U.K.: Edward Elgar Publishing. 1 1
World Bank. 2012. Inclusive Green Growth: The Pathway to Sustainable Development. Washington,
DC: World Bank. 1
———. 2013. “China 2030: Building a Modern, Harmonious, and Creative Society.” Report No.
76299. Washington, DC: World Bank.
http://documents.worldbank.org/curated/en/781101468239669951/China-2030-building-a-
modern-harmonious-and-creative-society. 1 3
———. 2014. Building Competitive Green Industries: The Climate and Clean Technology Opportunity
for Developing Countries. Washington, DC: World Bank. 1

147
———. 2015. Cross-Cutting Topics: Green Competitiveness.
http://www.worldbank.org/content/dam/Worldbank/document/Trade/Cross-
Cutting_GreenCompetitiveness.pdf. 1
———. 2017. Regulatory Indicators for Sustainable Energy (RISE): A Global Scorecard for Policy
Makers. Washington, DC: World Bank. 2
World Wind Energy Association. 2007. “Acquisition of REpower by Suzlon Is Important Step in
International Cooperation.” World Wind Energy Association, June 5.
http://www.wwindea.org/home/index.php?option=com_content&task=view&id=175&Itemid=40.
3
Wu, Gang. 2015. “Wind Matters: China’s Role in the Future of Wind.” Presented at the World Wind
Energy Association Conference 2015, Israel, October 28.
WWF (World Wide Fund for Nature). 2012. “Baoding Clean Tech Hub: Carbon Positive in the ‘Green
Electric Valley.’” March 1. http://wwf.panda.org/wwf_news/?204378. 1
Yang, Jianxiang. 2014. “Analysis: Goldwind Develops Micro-Grid Systems.” Windpower Monthly, June
20. http://www.windpowermonthly.com/article/1299810/analysis-goldwind-develops-micro-
grid-systems. 3
———. 2015. “Goldwind Develops New Tower Designs.” Windpower Monthly, May 28.
http://www.windpowermonthly.com/article/1349035. 3
Yao, Xilong, Yang Liu, and Shiyou Qu. 2015. When Will Wind Energy Achieve Grid Parity in China?—
Connecting Technological Learning and Climate Finance. Applied Energy 160: 697–704.
doi:10.1016/j.apenergy.2015.04.094. 3
Ye, Qi and Jiaqi Lu. 2016. “The End of Coal-Fired Growth in China.” Brookings, August 4.
https://www.brookings.edu/blog/up-front/2016/08/04/the-end-of-coal-fired-growth-in-china/. 1
Yeh, Emily T., and Joanna I. Lewis. 2004. “State Power and the Logic of Reform in China’s Electricity
Sector.” Pacific Affairs 77 (3): 437–65. 3

148
Ying, Li. 2016. “Blowing in the Wind.” China Dialogue, May 31.
https://www.chinadialogue.net/article/show/single/en/8965-Blowing-in-the-wind. 6
Yu, W. M., and G. Wu. 2004. “The Development of China’s Wind Turbine Manufacturing Industry and the
Strategy of Goldwind Co.” In Proceedings of the World Wind Energy Congress. Beijing, China, October 31
to November 4. 3
Yu, Yang, Hong Li, Yuyuan Che, and Qiongjie Zheng. 2017. “The Price Evolution of Wind Turbines in
China: A Study Based on the Modified Multi-Factor Learning Curve.” Renewable Energy 103 (April): 522–
36. doi:10.1016/j.renene.2016.11.056. 3

149
[A]Annex to Chapter 5
For the purpose of this study, we consider any class of energy storage technology that operates, or
has the potential to operate, at the grid level in the analysis. We exclude technologies that are
applicable only on a smaller scale. Using these parameters, we have identified 12 energy storage
technologies as being significant for Chinese energy storage development (table A5.1).
Table A5.1: Energy Storage Technologies, Technical and Market Maturity, and Estimated Storage Costs
Storage technology Market available Technical maturity
Cost
($/kilowatt)
Pumped storage Yes Mature 25–50
Lithium-ion battery Yes In development 800–1,200
Sodium-sulfur battery Yes In development 450–550
Lead-acid battery Yes Mature 415–465
Nickel and alkaline battery Yes Mature 800–1,500
Redox flow battery Yes In development 1,545–4,000
Flywheel storage Yes Mature 5,000–6,000
Capacitor storage Yes In development 20–24
Thermal storage Yes Mature 1,296–2,640
Cryogenic storage No In development n.a.
Air compression storage No In development 600–1,200
Hydrogen storage No In development 50
Note: n.a. = not applicable.
For each technology, queries are created using key phrases and relevant patent classifications—(a)
Cooperative Patent Classification, (b) International Patent Classification, (c) European Classification
System, and (d) U.S. Patent and Trademark Classification —based on data filters provided by the
National Science Foundation. Using these queries, the Thomson Innovation patent database is
analyzed. The data include all patents published between January 1, 1980, and April 24, 2017. Only
patents granted by the U.S. Patent and Trademark Office (USPTO) or the State Intellectual Property
Office (SIPO) are considered. The patents are segmented by technology, patent office (USPTO and
SIPO), country of inventor (China, Denmark, Germany, Japan, the Republic of Korea, the United
Kingdom, and the United States), and time frame.

150
For each group, the number of patents, both overall and across time, is examined. To measure the
level of importance, the number of citations that different patents receive in each category is
examined. To determine these patents’ inventors and the companies under which they filed these
patents, a patent’s nationality is considered to be the country where its inventor lives. If a patent
had two or more inventors from different countries, the patent is considered co-invented by
multiple countries. If a patent was invented in one country but is owned by a company in another
country, the patent is considered multinational. (See table A5.2.)
Table A5.2: Multinational and Co-Invented Patents by Country
a. Multinational
b. Co-invention
c. Indigenous
d. Total

151
Source: Thomson Innovation patent database. Note: SIPO = State Intellectual Patent Office, China; USPTO = U.S. Patent and Trademark Office.
When analyzing the patent data from the Thomson Innovation database, one must note a large
number of incomplete entries. Table A5.3 shows the extent of missing data for each patent office.
Roughly 25 percent of patents in SIPO do not include inventor addresses. These patents were
omitted from the analysis. Omissions would not affect the overall results if the portion without
inventor addresses were evenly distributed across countries. But a statistical z-test on a sample of
400 patents without inventor addresses labeled by predicted nationality on the basis of inventor
name shows with 99 percent confidence that the patents missing inventor information are much
more likely to have Japanese inventors, and much less likely to have Chinese inventors, than the
patents with inventor addresses for the analysis. Consequently, the results may slightly overstate
indigenous Chinese patents in SIPO relative to patents with inventors from other countries,
especially Japan.
Table A5.3: Unknown Patent Entries for Each Patent Office and Country
Total Patents Total unknown % unknown
28,006 3,434 12.262
Total USPTO USPTO unknown % unknown
14,499 1 0.007
Total SIPO SIPO unknown % unknown
13,507 3,433 25.416
Source: Thomson Innovation patent database. Note: SIPO = State Intellectual Patent Office; USPTO = U.S. Patent and Trademark Office.

152
Figure A5.1: China’s Energy Storage–Related Policies Launched in 2015
Source: CNESA 2016b. Note: EV = electric vehicle; LIB = lithium=ion battery; T&D = transmission and distribution
13
Table 1: 2015 China Energy Storage Related Policies
Energy Development Master Plan Policies
Electric Reforms and Tariff Policies
Renewable Energy Development Policies
Energy Storage Technology Industry Regulations and Standards Policies
New Energy Vehicle Policies
<13th Five Year Plan Outline>Energy Development Strategic Action Plan (2014-2020)China Manufacturing 2025<Guidelines on “Internet+” Smart Energy DevelopmentCentral Committee Guidelines on Deepening Electricity ReformsGuidelines on Smart Grid DevelopmentDistribution Grid Construction Reform Action Plan (2015-2020)Guidelines on accelerating distribution grid construction reform
Guidelines on multi-front improvements in electric operation adjustment to clean powerNotice on implementing Policy No. 9 – accelerated T&D pricing reformsImplementation views on advancing T&D pricing reformImplementation views on advancing electricity market constructionImplementation views on electricity trading mechanisms and normal operationImplementation views on beginning of electric usage planningImplementation views on retail side reformsNotice on expanding T&D pricing reform pilot scopes related matters
Mgmt measures for the fully protected purchase of renewables generation (Draft for comments) Guidelines for establishing renewables development via guiding targetsGuidelines on promoting new energy microgrid demonstration project constructionNotice on solar thermal generation demonstration project constructionInterim opinions on renewables local consumption pilotsNotice on electricity storage participation in „Sanbei‟ region frequency regulation ancillary service (Draft for comments)
Li-ion battery industry standardization conditions / Notice on interim management methods for Li-ion battery industry standardsLead-acid battery industry standardization conditions (v. 2015)/ Notice on interim management methods for lead-acid battery industry standards (v. 2015)Waste battery pollution prevention technology policy (Straw proposal)
2016-2020 New Energy Vehilce Popularized Usage Financial Support PolicyState Council Guiding Opinions on Accelerating EV Charging Infrastructure ConstructionEV Charging Infrastructure Standardized Project List (2015 Version)Notice On “13th FivE Year Plan” New Energy Vehicle Charging Infrastructure Incentive Policy and Strengthening New Energy Vehicle Popularized UsageEV Battery Recycling Technology Policy (2015 Version)New Energy Vehicle Worn Out Battery Comprehensive Usage Industry Regulations and ConditionsNew Energy Vehicle Worn Out Battery Comprehensive Usage Industry Regulations Interim Management Announcement
Energy Storage Related Policies
Launched in 2015
Source: CNESA

153
Figure A5.2: China’s Advanced Energy Storage Technology Innovation Road Map
Source: Translated from NDRC and NEA 2016.
Note: MJ = megajoule; MW = megawatt; MWh = megawatt-hour.
60
先进储能技术创新路线图
Large Capacity Heating Storage / Cooling Storage System in Distributed Energy Systems
High Temperature Superconducting Energy Storage Technology
1MW / 1000MJ flywheel energy storage array unit technology
Key Technologies of 10MW / 100MWh and 100MW / 800MWh
Supercritical Compressed Air Energy Storage
Large Capacity Thermal Chemical Storage Technology
New type of high temperature heat storage technology
10MWHighCapacityLiquidMetalBatteryTechnology
New Hybrid Energy Storage System Based on Superconducting
Magnetic
>10MWLargeCapacitySodiumSulfurBatteriesEnergyStorageTechnology
10MW Supercapacitor Energy Storage Technology
100MW high safety, low cost, long life lithium ion storage battery
technology
100MWVanadiumRedoxBatteryRegionalStoragePowerPlantTechnology
Newconceptofchemicalenergystoragetechnology(Magnesium-basedbatteries,Fuionbattery,etc.)
2.Catchupwithandsurpassinternationalthermalchemicalenergy
storagetechnologyresearchlevel,achievefirstbreakthrough.
HighPerformanceLeadAcidBatteryTechnology
3.Havetheindependent
intellectualpropertyrightsofcompressedair,
flywheelandhightemperaturesuperconductingenergy
storagetechnology,gettotheinternationaladvancedlevel,and
establishasoundphysicalstorage
technologystandard.
5.Breakthroughinmetalliquidbatterykey
technology,andcarryoutdemonstrationprojects.
6.Achieveasignificantbreakthroughinthenew
conceptofelectrochemicalenergy
storagetechnology,catchupwithandsurpasstheinternational
advancedlevel.
1.Accesstothermalstoragetechnology,reachtotheinternationallevel,
establishasoundthermalstorage
standard.
4.Mostofthehigh-parameterchemical
energystoragereachtheinternationaladvancedlevel,establishasound
chemicalenergystorage
technologystandard.
BasicResearch TestandDemonstration ApplicationandPromotion
Expectedresults
Ad
va
nce
de
ne
rgy
sto
rag
et
ech
no
log
yin
no
va
tio
n
Th
erm
als
tora
ge
Ch
emic
alS
tora
ge
Ph
ysic
als
tora
ge
Advancedenergystoragetechnologyinnovationroadmap
2016 203020252020 2050

154
Table A5.3: Overview of Key Energy Storage Demonstration Projects in China
Project Name Location Time Technology Size Company
Dalian City ES Demonstration Projects
Dalian, Liaoning Province
March 2016 Vanadium-flow, lithium-ion batteries
200 MW/ 800 MWh
Rongke Power
Bijie Compressed Air Storage/Multiple Energy Source Demonstration Project
Bijie, Guizhou Province
2014 Air storage/multiple energy source
1.5 MW Zhong Ke Ao Neng Gas Technology (IEA and Ao Neng)
Beizhen Wind Power Project
Beizhen, Liaoning Province
End of 2014 Lithium iron phosphate batteries, vanadium-flow batteries, supercapacitors
5 MW/10 MWh lithium iron phosphate batteries, 2 MW/4 MWh of vanadium-flow batteries and 1 MW × 2 min of supercapacitors
Zhangbei Wind-Solar-EES-Transmission Pilot Project
Hebei Province
Lithium iron phosphate batteries, vanadium-flow batteries
16 MW of EES, of which 12 MW of lithium iron phosphate batteries and 2 MW of vanadium-flow batteries
Zhangbei Scenery Storage and Transportation Demonstration Project (Phase I)
Hebei Province
Completed in December 2011
Phosphoric acid iron battery, lithium-titanic battery, vanadium redox flow battery, lead-acid battery
83.5 MWh Prudent Energy Corporation, GE
Baoqing Energy Storage Station of China Southern Power Grid Co., Ltd.
Shenzhen, Guangdong Province
Put into operation in September 2011
Lithium iron phosphate batteries
4 MW/16 MWh CALB
Shijingshan Thermal Power Plant
Beijing Put into operation in September 2013 and stopped service in March 2015 with the shutdown of the
Lithium iron phosphate batteries
2 MW/0.5 MWh

155
power plant
Kelu Electronics Sanshili Jingzi Scenery Storage Grid Integration Demonstration Project
Jiuquan, Gansu
Commissioning in June 2016
Lithium iron phosphate energy storage technology
10 MW
China Southern Power Grid FGC Scenery Storage Integrated Substation Demonstration Projects
Shenzhen, Guangdong
Commissioning in November 2015
Lead-carbon battery, phosphoric acid iron battery energy storage system
3 MWh
Guodian and Fengbei Town Fengchang Energy Storage Projects
Jinzhou city, Liaoning
Demonstration operation in November 2015
Phosphoric acid iron battery, vanadium redox flow battery, supercapacitor
14.083 MWh
Zhongneng Silicon Energy Storage Station Implementation Project
Jiangsu Winning bid in December 2015
Lead-carbon storage battery
12 MWh
CGN Network Photovoltaic Power Station In Gonghe County
Gonghe County, Jiangsu
Started in May 2014
Lithium battery, lead-acid battery
3 MW/28MWh
CGN Micro-Grid Photovoltaic Power Plant in Qilian County
Qilian county, Qinghai
Completed in Oct. 2013
Lithium battery, lead-acid battery
1.2 MW/4 MWh
Guodian Longyuan Faku Wuniushi Wind Power Plant Project
Shenyang, Liaoning
Completed in 2012
Vanadium redox flow battery energy storage technology
10 MWh Rongke Power
Zhejiang Luxi Island Micro-Grid Project
Wenzhou, Zhejiang
Commissioned in January 2014
Lead-acid battery 4 MWh
Goldwind Yizhuang Wind Power Project
Beijing April 2012 Lithium batteries, vanadium-flow batteries (the power types for EES are supercapacitors and flywheel energy storage)
540 kWh of EES
156
Three North pilots
Three North region
June 2016 >10 MW, duration time at least 4 hours
Pilots include: • Zhangbei Wind-Solar-Hydro-Thermal-Storage Demonstration Project, Zhangjiakou, Hebei • Tumote Wind-Solar-Hydro-Thermal-Storage Demonstration Project, Baotou, Inner Mongolia
• Yazuihe Wind-Solar-Hydro-Thermal-Storage Demonstration Project, Liangshan, Sichuan
• Longmen Wind-Solar-Hydro-Thermal-Storage Demonstration Project, Hancheng, Shaanxi
• Haixi Wind-Solar-Hydro-Thermal-Storage Demonstration Project, Geermu, Qinghai
• Hainan Wind-Solar-Hydro-Thermal-Storage Demonstration Project, Hainan, Qinghai
Sources: China ESCN News 2012; IET CAS 2017; NEA 2016a, 2017; NREL and SGERI 2016; Polaris Power
News Network 2014; SMM 2016; UET 2016; US DOE 2013, 2017.
Note: The “Three Norths” region includes Northeast, North, and Northwest China. EES = electrical
energy storage; MW = megawatt; MWh = megawatt-hour.
Endnotes
1. Worldwide, industries are responsible for one-third of overall greenhouse gas emissions that cause climate change. Given the strength of Chinese manufacturing, the impact in China is likely to be even higher (World Bank 2015). 2. Improving th+6e capabilities of wind turbines may be limited because little additional gains can be squeezed from tweaking blade designs and bearings. Moreover, wind farms are noisy eyesores and affect the bird and bat populations. 3. A breakthrough in storage not only would increase the use of intermittent power sources but also would allow the power industry to dispense with the underused and expensive excess generating capacity that is held in reserve to meet peak demand. 4. CGE models have become a standard tool for the analysis of energy and climate policies, such as carbon tax and emission trading schemes. For an overview of these models, their applications to energy and climate policies, and their limitations, see Wing (2011). 5. As stressed by Wing (2011, PgX), although “policy makers may be tempted to treat CGE models as a sort of economic crystal ball, . . . CGE models’ usefulness as tool for policy analysis owes less to their predictive accuracy, and more to their ability to shed light on the mechanisms responsible for the transmission of [policy-induced] price and quantity adjustments among markets.”
6. The global collaboration on green growth resulted in the establishment of the Global Green Growth Institute as a new international organization at the UN Conference on Sustainable Development in June 2012 and in the creation the same year of a Green Growth Knowledge Platform by the Global Green Growth Institute, OECD, UNEP, and World Bank (http://www.greengrowthknowledge.org).
7. Dutz and Sharma (2012) broadly define innovation as “the commercialization of new ways to solve problems through improvements in technology, with a wide interpretation of technology as encompassing product, process, organizational, and marketing improvements.” Besides frontier (new-to-the-world) innovations, this definition includes catch-up innovations, that is, the diffusion (both across and within countries) and the adaptation to local context of existing green technology. See their study for a list of green technology sectors. The OECD (2011b) further differentiates among incremental, disruptive, and radical/systemic green innovation. 8. The share of energy derived from coal appears to have peaked and is now declining; it was 64 percent in 2015 (Ye and Lu 2106).

157
9. Ferrous and nonferrous industries and industries producing construction materials are among the most energy intensive. 10. In 2015, China ranked third in the energy intensity of its GDP, after Russia and India and well in excess of the United States and Japan. China also exceeded the world average by 50 percent (Nakano and Wu 2016). 11. The city of Baoding southwest of Beijing in Hebei Province has emerged as a hub for companies producing for and serving the renewables industry (WWF 2012). 12. “Will China Take the Lead on Climate Change?" ChinaFile, November 21, 2016,
http://www.chinafile.com/conversation/will-china-take-lead-climate-change; “China Widens Wind Power
Lead over U.S., World with Another 23 GW,” Bloomberg News, February 10, 2017,
https://www.bloomberg.com/news/articles/2017-02-10/china-widens-wind-power-lead-over-u-s-world-
with-another-23-gw.
13. After examining 80 estimates of the costs of EV battery packs over the period 2007–14, Nykvist and Nilsson (2015) found that prices dropped annually by 14 percent from about $1,000 per kilowatt-hour to $410 per kilowatt-hour. 14. Built into this assumption is a 2 percent per year improvement in the efficiency of the internal combustion engine. 15. Fewer than 1 percent of all vehicles in use today are EVs. According to some forecasts, the share could reach 4 percent by 2025. However, auto producers are raising their sights and hoping that a decline in battery costs, increased power densities that extend the mileage per charge, and rapid charging technologies will raise the share of EVs to 7 percent by 2025. China—the largest market for EVs with 400,000 sold in 2016—is demanding that 8 percent of all cars sold in 2018 should be either hybrids or EVs (Economist 2017, 53). 16. The production, installation, and maintenance of solar- and wind-based sources of electricity employed about 3.7 million workers in China in 2015. 17 MIIT = Ministry of Industry and Information Technology; MOF = Ministry of Finance; MOFCOM = Ministry of Commerce; SOA = State Oceanic Administration; MOHURD = Ministry of Housing and Urban-Rural Development 18. Both the GII and GCII are published through partnerships between academic institutions, nongovernmental organizations, and private firms. The GII is published through INSEAD, the Johnson School at Cornell University, and the World Intellectual Property Association. The GCII is published through World Wide Fund for Nature and CTG (formerly Cleantech Group). Other indexes addressing national performance around green economy and climate change include the Global Green Economy Index (Dual Citizen LLC), Climate Change Performance Index (Germanwatch), and the Environmental Performance Index (Yale University). 19. The GII defines Utility Models by Origin as “the number of resident utility model applications filed at a given national or regional patent office in 2014. A resident UM application “refers to an application filed with an [intellectual property] office of oran office acting on behalf of the state or jurisdiction in which the first-named applicant has residence.”
20. The most recent Global Entrepreneurship Monitor can be viewed at http://www.gemconsortium.org. 21 Data queried from the Cleantech Group’s i3 database. 22 PATSTAT coverage of inventor information is incomplete for the State Intellectual Property Office (SIPO) data, although after examining domestic wind power patenting activities, Gallagher (2014) reports that a majority of SIPO patents were granted to domestic inventors. 23 One inventor has a Chinese surname but a Danish address. 24 Goldwind recently established a new technology development center in Denmark, hoping to tap into the European wind power knowledge pool (Snieckus 2016). 25 We also estimated the double exponential citation function used in Jaffe and Trajtenberg (1996) and Popp
(2002) using data from PATSTAT 2012, and we obtained similar results indicating Chinese patents are less
likely to be cited than non-Chinese patents. However, because the dependent variable is a citation that patent
year cohort K received from patent year cohort k in year t, the number of observations is much smaller. We
therefore opted for the more standard and more widely used count regression instead.
158
26 The largest number of intellectual property lawsuits anywhere in the world occurs with Chinese firms suing each other for intellectual property infringement. 27 The regulation was “Feng dian shebei zhizao hangye zhun ru biaozhun (zhengqiu yijian gao)” [Wind Power
Equipment Manufacturing Industry Access Standards-Draft], MIIT (March 25, 2010).
28. Data obtained from the Cleantech Group (CTG) i3 database. 29. More information can be found on the Mission Innovation website, http://mission-innovation.net. 30. Data obtained from the CTG i3 database. 31. See Heal (2016) and the literature cited therein. 32. Batteries are divided into two groups: (a) throwaway primary batteries (such as alkaline, zinc carbon, and silver oxide) and (b) secondary or rechargeable batteries (such as lead acid, nickel cadmium, nickel metal hydride, lithium ion, and lithium ion polymer). 33. Lithium iron and lithium sulfur batteries are candidates. 34. Graphene increases the capacity of the battery to absorb a charge, its cyclability, and rate capability (Kucinskis, Bajars, and Kleperis 2013; Raccichini et al. 2014). 35. On developments in the United States, see NAS (2012).[[AQ: Reference missing: please provide full details in reference list.]] 36. The potential viability of zinc-manganese chemistry is a recent discovery (ScienceDaily 2016). 37. An aluminum-ion rechargeable battery is now on offer (Schwartz 2015). 38. Flow batteries have great potential and are well suited for small communities that currently use pumped storage (Service 2014). 39. The production of oil and gas yields vast amounts of sulfur, the 13th most common element. 40. As noted earlier, innovations that affect the material used for the cathode—and the anode—are especially appealing at this stage. 41. Cleantech Group (CTG) i3 database. 42. Data obtained from the CTG i3 database. 43. The success of wind power in Texas is largely because it is the only U.S. state with its own power grid, and it built a grid starting in 2010 that could effectively handle power from intermittent sources. The state Competitive Renewable Energy Zones program made that possible.