china use of surrogate data in waste sector … gao qingxian.pdfuse of surrogate data in waste...
TRANSCRIPT

Use of surrogate data in waste sector Use of surrogate data in waste sector estimation (China’s Case)estimation (China’s Case)
G Qi iG Qi iGao QingxianGao QingxianChinese Research Academy of Environmental Chinese Research Academy of Environmental
S i (CRAES)S i (CRAES)Science (CRAES)Science (CRAES)

focusing onfocusing onfocusing onfocusing onPurposePurpose ofof usingusing thethe surrogatesurrogate datadataMethodsMethods andand datadata usedused inin estimationestimationResultsResults ofof estimationestimationUseful advice / recommendation China’s experienceUseful advice / recommendation China’s experienceUseful advice / recommendation China s experienceUseful advice / recommendation China s experience

Purpose of using the surrogate dataPurpose of using the surrogate data
No DataNo Data
Why SurrogateWhy Surrogate data neededdata needed?? No Enough dataNo Enough dataWhy Surrogate Why Surrogate data neededdata needed?? No Enough dataNo Enough data
Quality of dataQuality of data
Good quality countryGood quality country--specific activity data mean countryspecific activity data mean country--specific data on waste disposed in SWDS for specific data on waste disposed in SWDS for 10 years or more10 years or more
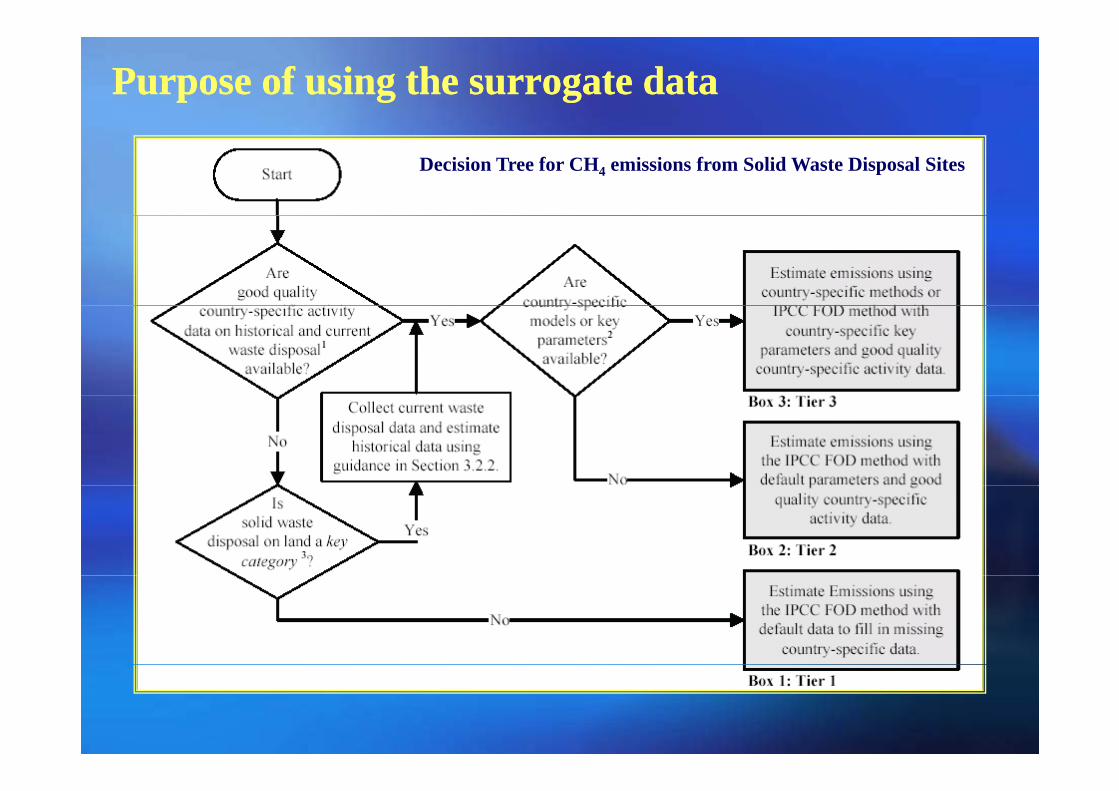
Purpose of using the surrogate dataPurpose of using the surrogate data
Decision Tree for CH4 emissions from Solid Waste Disposal Sites

Purpose of using the surrogate dataPurpose of using the surrogate data
Total production of MSW and its compositionTotal production of MSW and its compositionMunicipal Solid Waste (MSW)Municipal Solid Waste (MSW)
data neededdata needed
(food(food waste,waste, Garden,Garden, paper,paper, woodwood andand strawstraw ,, textiles,textiles, disposabledisposable nappiesnappies ))
Sewage sludgeSewage sludgeIndustrial waste Industrial waste (Manufacturing Industries and Construction waste)(Manufacturing Industries and Construction waste)data neededdata needed
(1/2)(1/2) Other waste Other waste (Clinical and Hazardous waste)(Clinical and Hazardous waste)
The Ratio of treatment of MSW(%)The Ratio of treatment of MSW(%)Resource RecoveryResource RecoveryCompostingCompostingIncinerationIncinerationDisposalDisposal

Purpose of using the surrogate dataPurpose of using the surrogate data
The Methane Correction Factor (MCF) The Methane Correction Factor (MCF) Managed: anaerobicManaged: anaerobicManaged: semiManaged: semi--aerobicaerobicUnmanaged: deep ( >5 m) and /or high water tableUnmanaged: deep ( >5 m) and /or high water tableU d h ll ( 5 )U d h ll ( 5 )Unmanaged: shallow (<5 m) Unmanaged: shallow (<5 m) Uncategorised SWDS Uncategorised SWDS
Oxidation factor (OX) Oxidation factor (OX) data neededdata needed ( )( )Managed, unmanaged and uncategorised SWDSManaged, unmanaged and uncategorised SWDSManaged covered with CHManaged covered with CH44 oxidizing materialoxidizing material
Methane Generation rate constant (k)Methane Generation rate constant (k)
data neededdata needed(2/2)(2/2)
Methane Generation rate constant (k)Methane Generation rate constant (k)Fraction of DOC dissimilated Fraction of DOC dissimilated ((DOCDOCFF))Delay time (month)Delay time (month)Delay time (month)Delay time (month)Fraction of Methane (F)Fraction of Methane (F)Conversion factorConversion factorM h R (G / )M h R (G / )Methane Recovery (Gg/yr)Methane Recovery (Gg/yr)
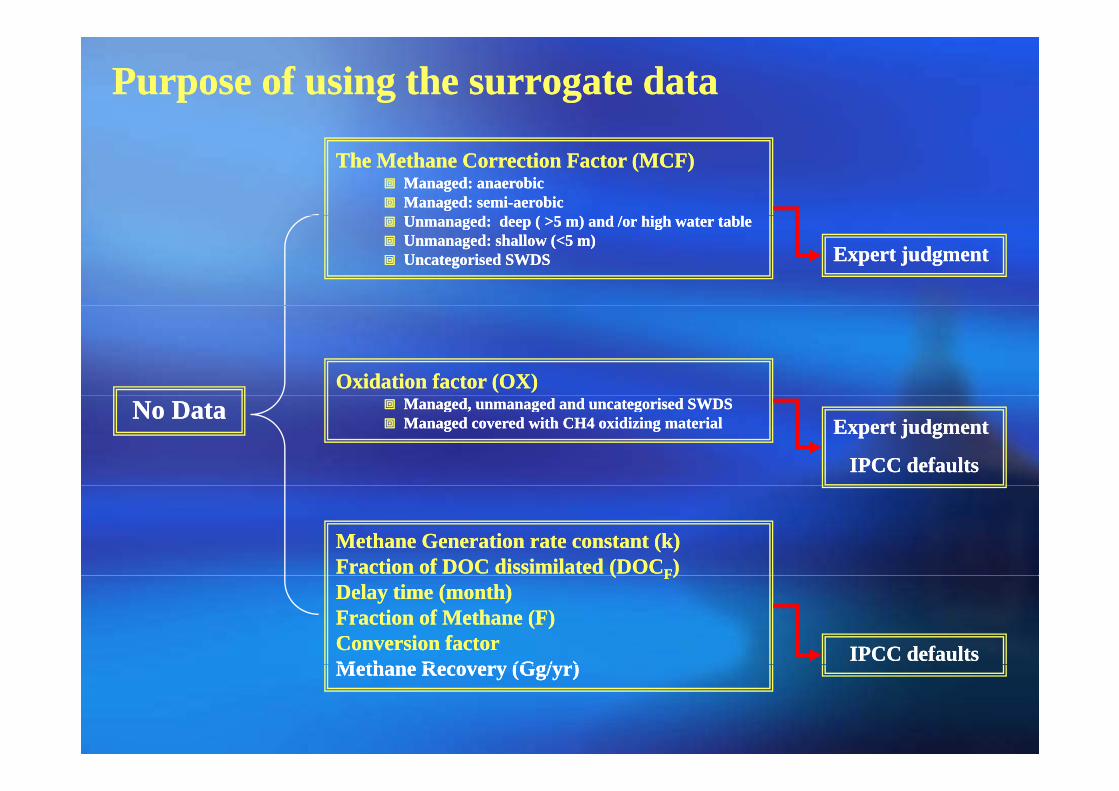
Purpose of using the surrogate dataPurpose of using the surrogate data
The Methane Correction Factor (MCF) The Methane Correction Factor (MCF) Managed: anaerobicManaged: anaerobicManaged: semiManaged: semi--aerobicaerobicU d d ( 5 ) d / hi h blU d d ( 5 ) d / hi h blUnmanaged: deep ( >5 m) and /or high water tableUnmanaged: deep ( >5 m) and /or high water tableUnmanaged: shallow (<5 m)Unmanaged: shallow (<5 m)Uncategorised SWDSUncategorised SWDS Expert judgmentExpert judgment
Oxidation factor (OX)Oxidation factor (OX)No DataNo Data Managed, unmanaged and uncategorised SWDSManaged, unmanaged and uncategorised SWDS
Managed covered with CH4 oxidizing materialManaged covered with CH4 oxidizing material Expert judgmentExpert judgment
IPCC defaultsIPCC defaults
Methane Generation rate constant (k)Methane Generation rate constant (k)Fraction of DOC dissimilated (DOCFraction of DOC dissimilated (DOCFF))(( FF))Delay time (month)Delay time (month)Fraction of Methane (F)Fraction of Methane (F)Conversion factorConversion factorM th R (G / )M th R (G / )
IPCC defaultsIPCC defaultsMethane Recovery (Gg/yr)Methane Recovery (Gg/yr)

Purpose of using the surrogate dataPurpose of using the surrogate data
Total production of MSW and itsTotal production of MSW and its compositioncompositionMunicipal Solid Waste (MSW) Municipal Solid Waste (MSW) (food waste, Garden, (food waste, Garden,
paper, wood and straw , textiles, disposable nappies )paper, wood and straw , textiles, disposable nappies )Sewage sludgeSewage sludge
Country specific Country specific methodologymethodology
Sewage sludgeSewage sludgeIndustrial waste Industrial waste (Manufacturing Industries and (Manufacturing Industries and
Construction waste)Construction waste)Other waste Other waste (Clinical and Hazardous waste)(Clinical and Hazardous waste)
Expert judgmentExpert judgment
No No
The Municipal Construction Statistics YearbookThe Municipal Construction Statistics Yearbookcarrying amount (MSW treated)carrying amount (MSW treated)disposal percentage of municipal wastedisposal percentage of municipal waste
Enough Enough DataData
p p g pp p g p
The Ratio of treatment of MSWThe Ratio of treatment of MSW(%)(%) Survey dataSurvey data (specific(specificThe Ratio of treatment of MSWThe Ratio of treatment of MSW(%)(%)Resource RecoveryResource RecoveryCompostingCompostingIncinerationIncinerationDisposalDisposal
Survey data Survey data (specific (specific years & region) years & region)
Expert judgmentExpert judgment

Purpose of using the surrogate dataPurpose of using the surrogate data
Time seriesTime seriesTime series Time series
Country specific methodCountry specific method
DataData
Country specific method Country specific method
Expert judgmentExpert judgment
Data Data QualityQuality ConsistentConsistent
Expert judgmentExpert judgment
Transparency Transparency
Expert judgmentsExpert judgments

Methods and data used in estimationMethods and data used in estimation
Urban nonUrban non--agricultural populationagricultural population16000
s)
12000
al(1
0,00
0ton
s
8000
rbag
e D
ispo
s
y = 12929.25 * ln(x) - 116443.35R2 0 96 TheThe relationrelation ofof nonnon--
4000
Volu
me
of G
a R2=0.965 TheThe relationrelation ofof nonnonagricultureagriculture populationpopulation andandthethe generategenerate amountamount ofof MSWMSW
8000 12000 16000 20000 240000
V
Non-Agricultrue Population
1/71/7

Methods and data used in estimationMethods and data used in estimation
Gross Domestic Product (GDP)Gross Domestic Product (GDP)16000
s)
12000
al(1
0,00
0ton
s
3311 16 * l ( ) 25493 29
8000
rbag
e D
ispo
sa y = 3311.16 * ln(x) - 25493.29R2=0.978
TheThe relationrelation ofof GDPGDP andand thethe
4000
Volu
me
of G
a TheThe relationrelation ofof GDPGDP andand thethegenerategenerate amountamount ofof MSWMSW
0 40000 80000 1200000
V
GDP
2/72/7

Methods and data used in estimationMethods and data used in estimation
The area of cityThe area of city16000
s)
12000
al(1
0,00
0ton
s
y = 0 59 x 1121 36
The relation of area of city and
8000
rbag
e D
ispo
s y = 0.59 x - 1121.36R2=0.989
The relation of area of city andthe generate amount of MSW
4000
Volu
me
of G
a
5000 10000 15000 20000 25000 300000
V
Surface Area of Built District
3/73/7

Methods and data used in estimationMethods and data used in estimation
Urban populationUrban population16000
s)
12000
al(1
0,00
0ton
s
The relation of urban
8000
rbag
e D
ispo
s ln(y) = 5.50E-005 x + 7.28R2=0.906
The relation of urbanpopulation and the generateamount of MSW4000
Volu
me
of G
a
0 10000 20000 30000 400000
V
Urban Population
4/74/7

Methods and data used in estimationMethods and data used in estimation
The number of cityThe number of city16000
s)
12000
al(1
0,00
0ton
s
y = 21 66 x - 2594 85
The relation of city
8000
rbag
e D
ispo
s y = 21.66 x - 2594.85R2=0.930
The relation of citynumbers and the generateamount of MSW4000
Volu
me
of G
a
200 300 400 500 600 7000
V
Number of cities
5/75/7

Methods and data used in estimationMethods and data used in estimation
GDP per capitaGDP per capita16000
s)
12000
al(1
0,00
0ton
s
The relation of per GDP and
8000
rbag
e D
ispo
s
y = 3608.13 * ln(x) - 19706.85R2= 0.977
The relation of per GDP andthe generate amount of MSW
4000
Volu
me
of G
a
0 2000 4000 6000 8000 100000
V
Per GDP
6/76/7

Methods and data used in estimationMethods and data used in estimation
The relationship of MSW Generation amount and its driving forcingThe relationship of MSW Generation amount and its driving forcing
EstimateEstimate modelmodel forfor MSWMSW
NonNon--agricultural population: agricultural population: MSW = 12929.25ln(x) MSW = 12929.25ln(x) --116443.35116443.35
Where, x resprent nonWhere, x resprent non--agricultural population (ten thousand person)agricultural population (ten thousand person)Where, x resprent nonWhere, x resprent non agricultural population (ten thousand person)agricultural population (ten thousand person)GDP:GDP:
MSWMSW = 3311.16 ln(x) = 3311.16 ln(x) --25493.2925493.29Where x resprent GDP ( 100 million Yuan RMB)Where x resprent GDP ( 100 million Yuan RMB)Where, x resprent GDP ( 100 million Yuan RMB)Where, x resprent GDP ( 100 million Yuan RMB)
GDP per capita GDP per capita MSWMSW = 3608.13 ln(x) = 3608.13 ln(x) --19706.85 19706.85
Where x resprent GDP per capita (Yuan RMB)Where x resprent GDP per capita (Yuan RMB)Where, x resprent GDP per capita (Yuan RMB)Where, x resprent GDP per capita (Yuan RMB)
7/77/7

Results of estimationResults of estimation
29000
Scenario I : Based on the GDPScenario I : Based on the GDP
YearYear 20102010 20202020 20302030 20402040 2050205026000
)YearYear 20102010 20202020 20302030 20402040 20502050S1S1 197694197694 367007367007 522370522370 10052091005209 15307211530721S2S2 178936178936 321962321962 544767544767 846006846006 1181895118189520000
23000
运量
(万
吨
S2S2 178936178936 321962321962 544767544767 846006846006 11818951181895S3S3 175997175997 286681286681 404392404392S4S4 160224160224 237171237171 31873831873817000
20000
活垃
圾清
运
情景1
情景S4S4 160224160224 237171237171 318738318738
S1: http://macrochina com cn/report/free/detail/xs/008/00001493 shtml
14000
生活 情景2
情景3
情景4S1: http://macrochina.com.cn/report/free/detail/xs/008/00001493.shtmlS2: http://www.drcnet.com.cn/new_product/drcexpert/showdoc.asp?doc_id=144563S3 & S4: 王高尚、韩梅《中国重要矿产资源的需求预测》。
11000
2000 2010 2020 2030 2040 2050yeary
1/61/6

Results of estimationResults of estimation
ChinaChina’’s population predicted by FAO Unit : 10s population predicted by FAO Unit : 1088 personspersons29000
Year 2010 2020 2030 2040 2050
Population 13.72903 14.38192 14.59865 14.48698 14.0519123000
26000
吨)
The four future per GDP scenes in China Unit : yuanThe four future per GDP scenes in China Unit : yuan20000
23000
清运
量(万
吨
Year 2010 2020 2030 2040 2050
S1 14399.70 25518.64 35782.09 69387.06 108933.3117000
生活
垃圾
清
情景1
情景2
情景3
S2 13033.40 22386.58 37316.26 58397.68 84109.21S3 12819.33 19933.43 27700.64
11000
14000 情景4
S4 11670.45 16490.91 21833.3911000
2000 2010 2020 2030 2040 2050year
2/62/6
Results of estimationResults of estimation
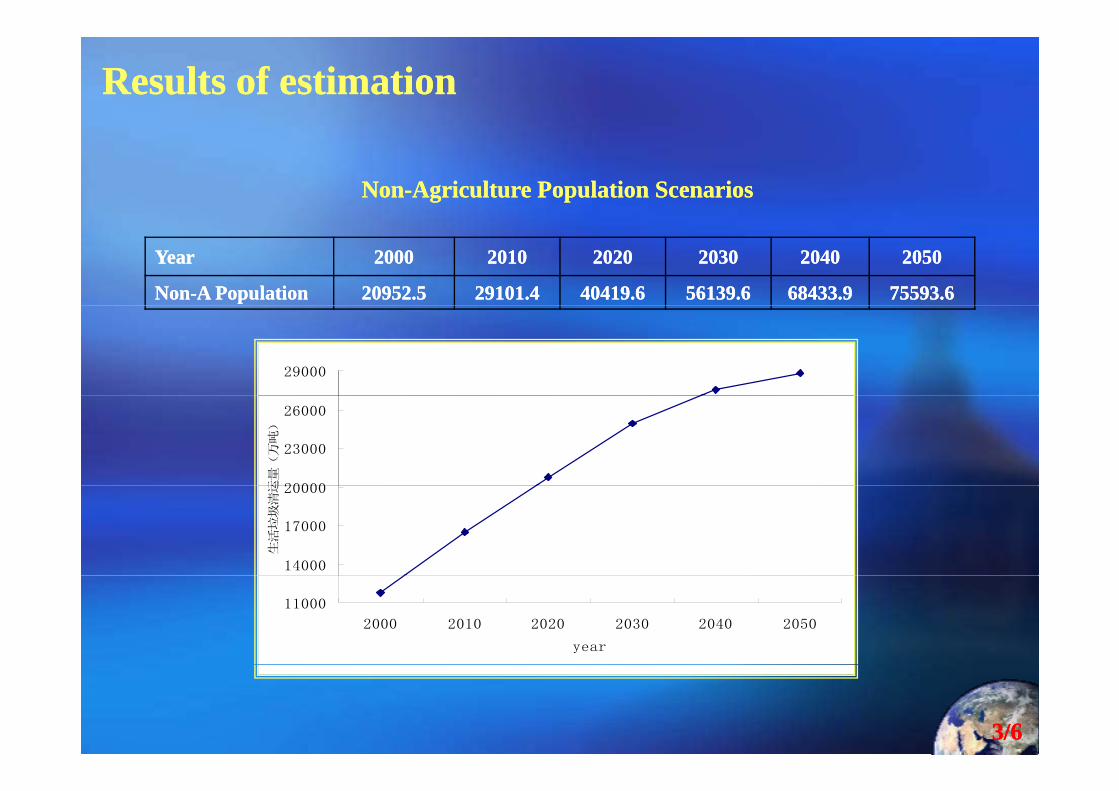
NonNon--Agriculture Population ScenariosAgriculture Population Scenarios
YearYear 20002000 20102010 20202020 20302030 20402040 20502050
NonNon--A PopulationA Population 20952.520952.5 29101.429101.4 40419.640419.6 56139.656139.6 68433.968433.9 75593.675593.6
29000
20000
23000
26000
运量(万吨)
14000
17000
20000
生活垃圾清运
11000
2000 2010 2020 2030 2040 2050
year
3/63/6

Results of estimationResults of estimation
80 90 100 110 120 130
50 50
40
45
40
45
30
35
30
35
1 to 10
10 to 20
80 90 100 110 120 130
20
25
20
25 10 to 20
20 to 30
30 to 50
50 to 100
100 to 200
200 to 400
400 to 650
MSW Generation amount distribution MSW Generation amount distribution (2000,2002,2004)(2000,2002,2004)
80 90 100 110 120 130( , , )( , , )
4/64/6

Results of estimationResults of estimation
TheThe methanemethane emissionemission ofof 20042004
TheThe methanemethane emissionemission ofof 19941994
5/65/6

Results of estimationResults of estimation
1000
1200
最小排放量
最大排放量
缺省值净排放量
400
600
800
1
1132
0
200
华北 东北 华东 华中 华南 西南 西北
33
33
444 44
7
7
22
22
66
600
700
最小排放量
最大排放量
5
447
66 5
5
419941994
300
400
500
600 最大排放量
缺省值净排放量
0
100
200
300
华北 东北 华东 华中 华南 西南 西北华北 东北 华东 华中 华南 西南 西北
200420046/66/6

Useful advice / recommendation China’s experienceUseful advice / recommendation China’s experience
Regional issuesRegional issuesRegional issues Regional issues economic leveleconomic levelindustrial levelindustrial levelclimate condition climate condition life stylelife style
Manage Issues Manage Issues law and regulation as well as standard law and regulation as well as standard Statistics systemStatistics systemStatistics system Statistics system Data sharing mechanismData sharing mechanism


The Composition of MSW in ChinaThe Composition of MSW in China
TianjingBeijing
The weighted average of carbon content of various components of waste streamThe weighted average of carbon content of various components of waste stream
Tianjing14.1%
0.0%43.5%
Beijing6.2%0.0%
37 6%39.0%
3.4%
paper and textilesgarden waste,park waste or other non-food organic putresciblesf
37.6%
1.1%
55.0%
paper and textilesgarden waste,park waste or other non-food organic putrescibles
food wastewood or strawother
food wastewood or strawother
SampleSample TianjingTianjing BeijingBeijing AverageAverage
Paper and Paper and TextilesTextiles
14.0814.08 6.246.24 10.1610.16components of waste components of waste
streamstreamOrganic Caron Organic Caron
percentage (Weight)percentage (Weight)
PP 2626Food wasteFood waste 39.0239.02 37.6337.63 38.3338.33
Wood and Wood and strawstraw
3.43.4 1.151.15 2.282.28
PaperPaper 2626
Wood and strawWood and straw 2828
TextilesTextiles 3030strawstraw
OthersOthers 43.543.5 54.9954.99 49.2549.25Food wasteFood waste 77
Fresh wasteFresh waste 1/41/4

The Composition of MSW in ChinaThe Composition of MSW in China
60708090
1020304050
0Sh
angh
ai
Bei
jing
Tian
jing
Wuh
an
Gua
ngzh
ou
Hae
rbin
Xi'a
n
Jina
n
Cha
ngsh
a
Gui
yang
Fuzh
ou
Wux
i
Hef
ei
Nan
jing
Organic Waste Inorganic Waste Other Wastes
8
10
12
1991 1996 2000
①① Organic waste increase (Organic waste increase (~~50%);50%);②② Inorganic Waste decrease (Inorganic Waste decrease (~~23 34%);23 34%);
2
4
6
8 ②② Inorganic Waste decrease (Inorganic Waste decrease (~~23.34%);23.34%);③③ Recycle waste increase (~26.6%);Recycle waste increase (~26.6%);④④ Combustible waste increase.Combustible waste increase.
0
2
Paper Plastic Textile Woodd
2/42/4
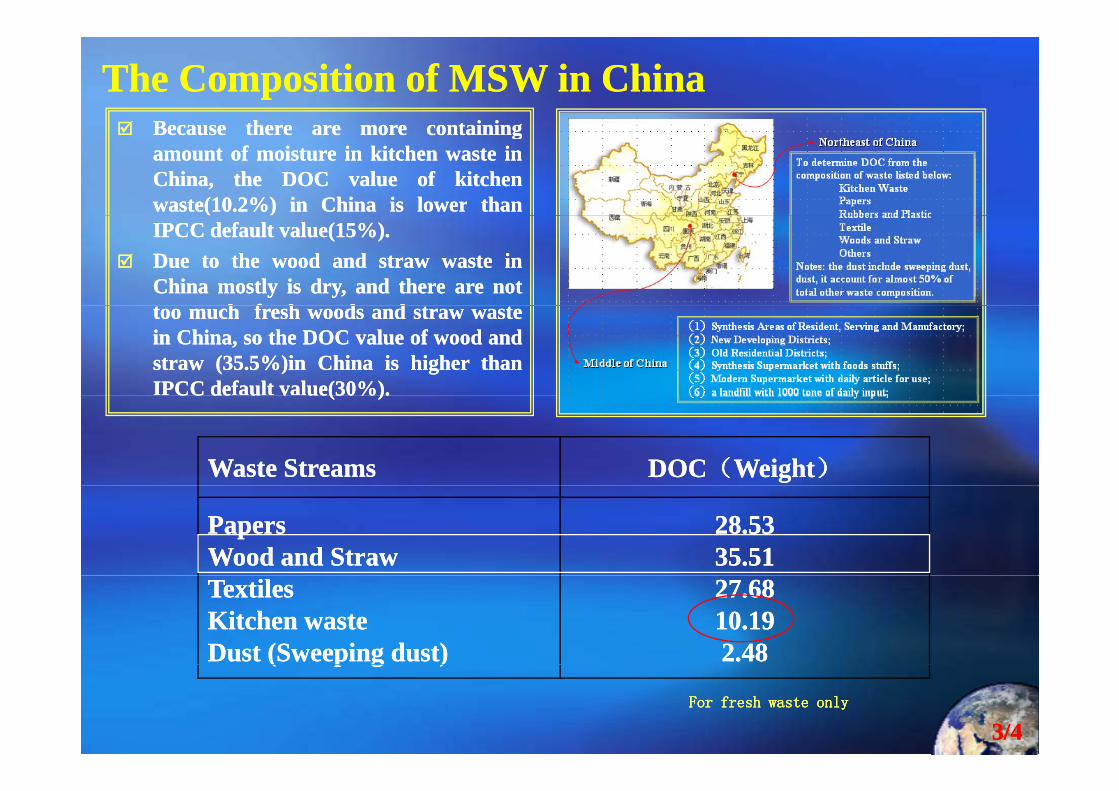
The Composition of MSW in ChinaThe Composition of MSW in ChinaBecauseBecause therethere areare moremore containingcontainingBecauseBecause therethere areare moremore containingcontainingamountamount ofof moisturemoisture inin kitchenkitchen wastewaste ininChina,China, thethe DOCDOC valuevalue ofof kitchenkitchenwaste(waste(1010..22%%)) inin ChinaChina isis lowerlower thanthanIPCCIPCC defaultdefault value(value(1515%%))..DueDue toto thethe woodwood andand strawstraw wastewaste ininChinaChina mostlymostly isis dry,dry, andand therethere areare notnottt hh f hf h dd dd tt tttootoo muchmuch freshfresh woodswoods andand strawstraw wastewasteinin China,China, soso thethe DOCDOC valuevalue ofof woodwood andandstrawstraw ((3535..55%%)in)in ChinaChina isis higherhigher thanthanIPCCIPCC defaultdefault value(value(3030%%))..
Waste StreamsWaste Streams DOCDOC((WeightWeight))
CCCC de ude u v ue(v ue(3030%%))..
PapersPapersWood and StrawWood and Straw
28.5328.5335.5135.51
TextilesTextilesKitchen wasteKitchen wasteDust (Sweeping dust)Dust (Sweeping dust)
27.6827.6810.1910.192.482.48( p g )( p g )
For fresh waste onlyFor fresh waste only
3/43/4

The Composition of MSW in ChinaThe Composition of MSW in China
Collect different city historical data
4/44/4

The Disposal Rate of MSW in ChinaThe Disposal Rate of MSW in China
2543.5
West of China 20001994
30.248.4
Middle of China
41.774.8
East of China
35.860.2
Whole country
Th di l t i diff t i f Chi (1994Th di l t i diff t i f Chi (1994 d 2000)d 2000)The disposal rate in different region of China (1994The disposal rate in different region of China (1994 and 2000)and 2000)
1/21/2

The Disposal Rate of MSW in ChinaThe Disposal Rate of MSW in China
16000 70生活垃圾清运量
Treatment ratioTreatment ratio
12000
16000
运量
) 506070
化处
理率(万吨)
生活垃圾无害化处理率(%)
8000
活垃
圾清
(万
吨)
304050
圾无
害化
(%
)
理率(%)
4000生活
1020
生活
垃圾
01981 1985 1989 1993 1997 2001
0 生
1981 1981 -- 20032003Generate Generate
amount of MSWamount of MSW 2/22/2

Information of SNCInformation of SNC
To submit lately National Greenhouse gases inventory To submit lately National Greenhouse gases inventory INCINC::19941994SNCSNC::2005 2005
To add new gases sources To add new gases sources ggINCINC::COCO22、、NN22OO、、CHCH44
SNCSNC:: COCO NN OO CHCH HFCsHFCs PFCsPFCs SFSFSNCSNC:: COCO22、、NN22OO、、CHCH44、、HFCsHFCs、、 PFCsPFCs、、SFSF66
Geographical ScopeGeographical ScopeINCINC Chi i l dChi i l dINCINC::China mainlandChina mainlandSNCSNC:: China Mainland + Hongkong SAR + Macao SARChina Mainland + Hongkong SAR + Macao SAR

The Greenhouse Gas Emission in different The Greenhouse Gas Emission in different sector of China (1994)sector of China (1994)sector of China (1994)sector of China (1994)
Agricultural
Land Use anf Forestry
Waste Management
Agricultural
Land Use anf Forestry
Waste ManagementCO2 CH4
-500000 0 500000 1000000 15000002000000 2500000 3000000
Energy
Industry Process
0 5000 10000 15000 20000
Energy
Industry Process
N O 7%
Agricultural
Land Use anf Forestry
Waste Management N2O20%
7%
0 100 200 300 400 500 600 700 800
Energy
Industry Process 73%
CO2 CH4 N2O
UNCERTAINTY ASSESSMENTUNCERTAINTY ASSESSMENTUNCERTAINTY ASSESSMENT UNCERTAINTY ASSESSMENT
There are two areas of uncertainty in the estimate of CH4 emissionsThere are two areas of uncertainty in the estimate of CH4 emissionsThere are two areas of uncertainty in the estimate of CH4 emissions There are two areas of uncertainty in the estimate of CH4 emissions from SWDS:from SWDS:
the uncertainty attributable to the method;the uncertainty attributable to the method;the uncertainty attributable to the method;the uncertainty attributable to the method;
the uncertainty attributable to the datathe uncertainty attributable to the data
( ti it d t d t )( ti it d t d t )(activity data and parameters)(activity data and parameters)

UNCERTAINTY ASSESSMENTUNCERTAINTY ASSESSMENTUNCERTAINTY ASSESSMENT UNCERTAINTY ASSESSMENT
th t i t tt ib t bl t th th dth t i t tt ib t bl t th th dthe uncertainty attributable to the methodthe uncertainty attributable to the method
Decision Tree for CH4 emissions from Solid Waste Disposal Sites

UNCERTAINTY ASSESSMENTUNCERTAINTY ASSESSMENTUNCERTAINTY ASSESSMENT UNCERTAINTY ASSESSMENT
the uncertainty attributable to the datathe uncertainty attributable to the data
activity dataactivity data
how the data is obtained ?how the data is obtained ?
i h di h dyy
waste generation data waste generation data (total municipal solid waste, total industrial waste)(total municipal solid waste, total industrial waste)
CityCity 662662 √√
weighed weighed
CountiesCounties 2861 2861 village and town village and town 4482144821
composition datacomposition datacomposition datacomposition data
based on the survey in typical cities or region based on the survey in typical cities or region
management datamanagement data (the fraction of solid waste sent to SDWS)(the fraction of solid waste sent to SDWS)management datamanagement data (the fraction of solid waste sent to SDWS)(the fraction of solid waste sent to SDWS)

UNCERTAINTY ASSESSMENTUNCERTAINTY ASSESSMENTUNCERTAINTY ASSESSMENT UNCERTAINTY ASSESSMENT
the uncertainty attributable to the datathe uncertainty attributable to the data
parametersparameterspp
Methane correction factor (MCF)Methane correction factor (MCF)------------ Expert judgmentsExpert judgmentsDegradable organic carbon (DOC)Degradable organic carbon (DOC)---------- country specificcountry specificFraction of degradable organic carbon which decomposes Fraction of degradable organic carbon which decomposes
(DOCf)(DOCf)( )( )Fraction of CH4 in landfill gas (F)Fraction of CH4 in landfill gas (F)Methane recovery (R)Methane recovery (R)Oxidation factor (OX)Oxidation factor (OX)Oxidation factor (OX)Oxidation factor (OX)The halfThe half--lifelife