china nature fy14: abnormally high rmb1.2bn in other receivables held at the company level in two...
TRANSCRIPT
Hong Kong Exchanges and Clearing Limited and The Stock Exchange of Hong Kong Limited take no responsibility for the
contents of this announcement, make no representation as to its accuracy or completeness and expressly disclaim any
liability whatsoever for any loss howsoever arising from or in reliance upon the whole or any part of the contents of this
announcement.
Nature Home Holding Company Limited大 自 然 家 居 控 股 有 限 公 司
(Incorporated in the Cayman Islands with limited liability)
(Stock Code: 2083)
ANNOUNCEMENT OF RESULTSFOR THE YEAR ENDED 31 DECEMBER 2014
HIGHLIGHTS:
. Our revenue for the year ended 31 December 2014 amounted to approximatelyRMB1,979,285,000, representing an increase of 32.9% from approximately RMB1,488,949,000recorded in 2013.
. Our gross profit for the year ended 31 December 2014 amounted to approximatelyRMB619,623,000, representing an increase of 23.8% from RMB500,598,000 recorded in 2013.
. Our loss before tax for the year ended 31 December 2014 amounted to approximatelyRMB39,476,000, comparing to our profit before tax of approximately RMB210,566,000recorded in 2013.
. Loss attributable to equity shareholders of the Company for the year ended 31 December 2014amounted to approximately RMB75,356,000, comparing to the profit attributable to equityshareholders of the Company of approximately RMB138,102,000 recorded in 2013. The losswas mainly due to the recognition of the net decrease in fair value of the Group’s biologicalassets of approximately RMB144,349,000 which is non-cash in nature and has no effect on thecash flow of the Group.
. Profit attributable to equity shareholders of the Company excluding the net change in fair valueof biological assets for the year ended 31 December 2014 amounted to approximatelyRMB68,993,000, representing a decrease of 23.6% from approximately RMB90,341,000recorded in 2013.
. Basic loss per share of the Group for the year ended 31 December 2014 was RMB0.051 (For theyear ended 31 December 2013: basic earnings per share of RMB0.093).
. The board of directors recommends the declaration and payment of a final dividend of HK1.4cents out of the share premium account of the Company per ordinary share (please refer to note11 of this result announcement for details).
– 1 –
The board of directors (the ‘‘Board’’) of Nature Home Holding Company Limited (the ‘‘Company’’) ispleased to announce the audited consolidated results of the Company and its subsidiaries (the ‘‘Group’’)for the year ended 31 December 2014. The results have been reviewed by the audit committee of theCompany.
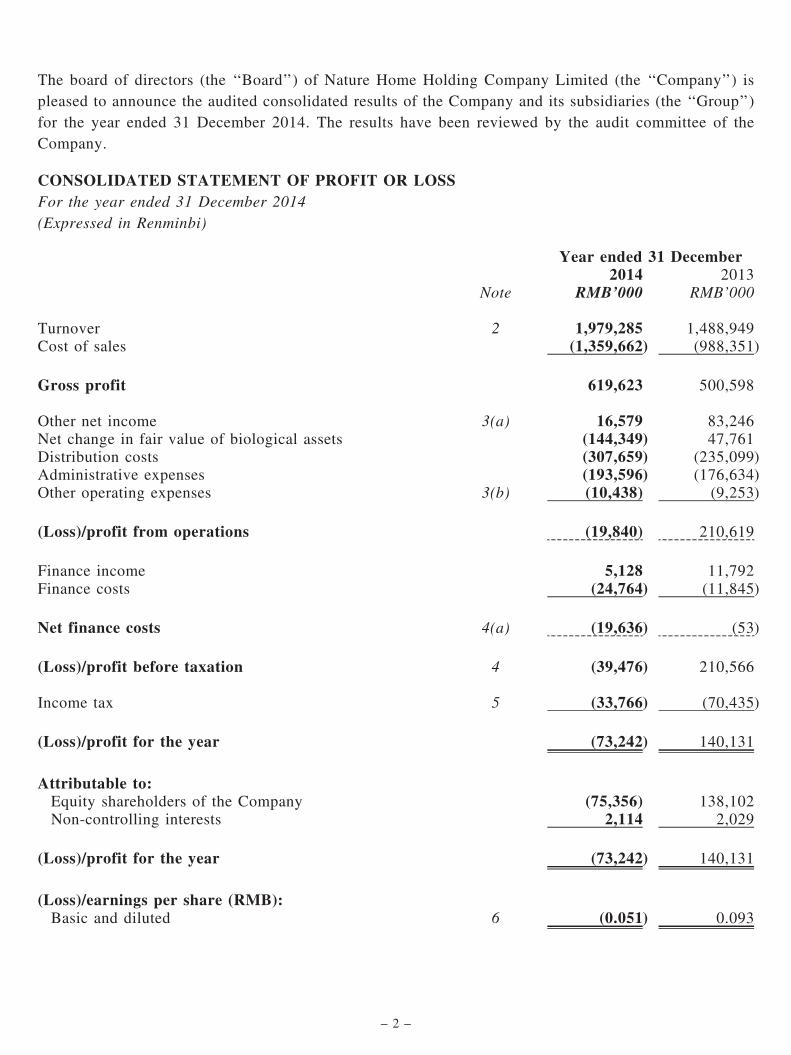
CONSOLIDATED STATEMENT OF PROFIT OR LOSSFor the year ended 31 December 2014(Expressed in Renminbi)
Year ended 31 December2014 2013
Note RMB’000 RMB’000
Turnover 2 1,979,285 1,488,949Cost of sales (1,359,662) (988,351)
Gross profit 619,623 500,598
Other net income 3(a) 16,579 83,246Net change in fair value of biological assets (144,349) 47,761Distribution costs (307,659) (235,099)Administrative expenses (193,596) (176,634)Other operating expenses 3(b) (10,438) (9,253)
(Loss)/profit from operations (19,840) 210,619
Finance income 5,128 11,792Finance costs (24,764) (11,845)
Net finance costs 4(a) (19,636) (53)
(Loss)/profit before taxation 4 (39,476) 210,566
Income tax 5 (33,766) (70,435)
(Loss)/profit for the year (73,242) 140,131
Attributable to:Equity shareholders of the Company (75,356) 138,102Non-controlling interests 2,114 2,029
(Loss)/profit for the year (73,242) 140,131
(Loss)/earnings per share (RMB):Basic and diluted 6 (0.051) 0.093
– 2 –
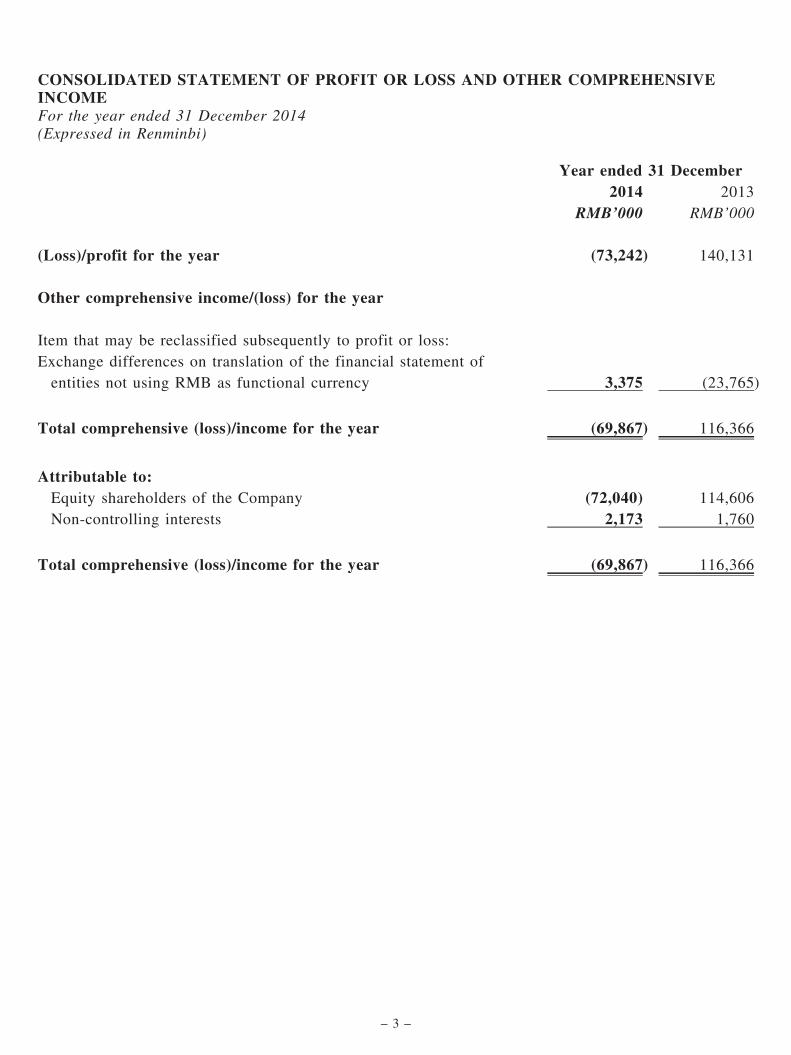
CONSOLIDATED STATEMENT OF PROFIT OR LOSS AND OTHER COMPREHENSIVEINCOMEFor the year ended 31 December 2014(Expressed in Renminbi)
Year ended 31 December2014 2013
RMB’000 RMB’000
(Loss)/profit for the year (73,242) 140,131
Other comprehensive income/(loss) for the year
Item that may be reclassified subsequently to profit or loss:Exchange differences on translation of the financial statement ofentities not using RMB as functional currency 3,375 (23,765)
Total comprehensive (loss)/income for the year (69,867) 116,366
Attributable to:Equity shareholders of the Company (72,040) 114,606Non-controlling interests 2,173 1,760
Total comprehensive (loss)/income for the year (69,867) 116,366
– 3 –
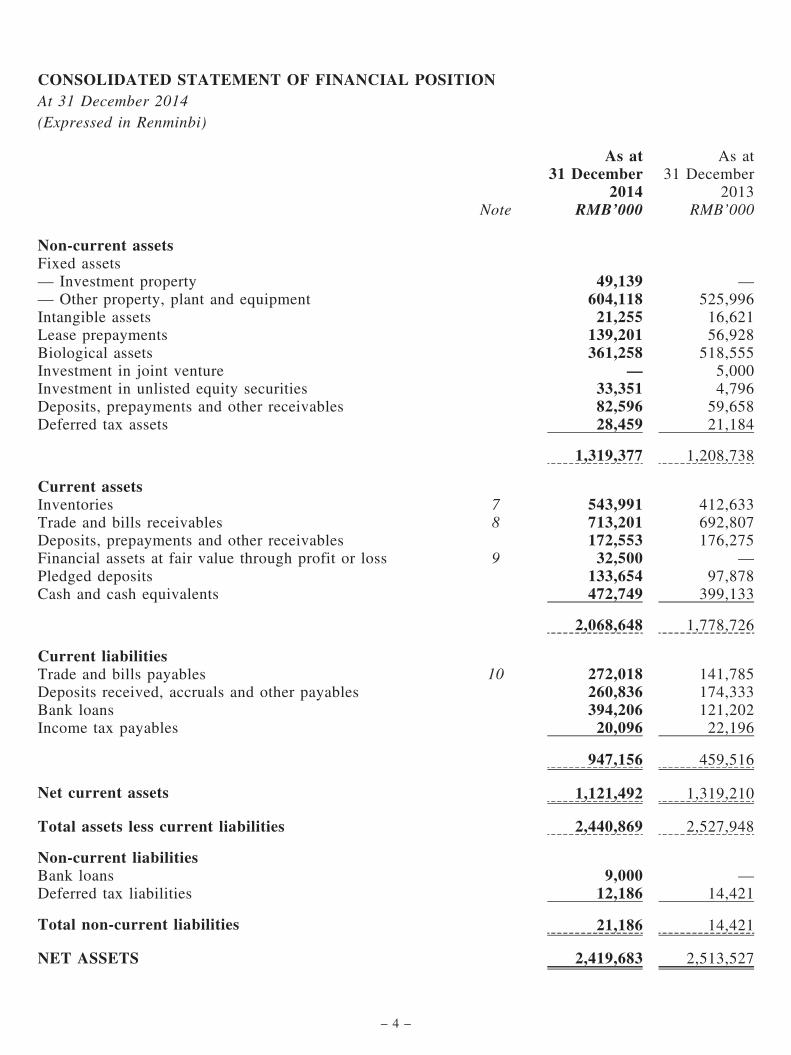
CONSOLIDATED STATEMENT OF FINANCIAL POSITIONAt 31 December 2014(Expressed in Renminbi)
As at31 December
As at31 December
2014 2013Note RMB’000 RMB’000
Non-current assetsFixed assets— Investment property 49,139 —
— Other property, plant and equipment 604,118 525,996Intangible assets 21,255 16,621Lease prepayments 139,201 56,928Biological assets 361,258 518,555Investment in joint venture — 5,000Investment in unlisted equity securities 33,351 4,796Deposits, prepayments and other receivables 82,596 59,658Deferred tax assets 28,459 21,184
1,319,377 1,208,738
Current assetsInventories 7 543,991 412,633Trade and bills receivables 8 713,201 692,807Deposits, prepayments and other receivables 172,553 176,275Financial assets at fair value through profit or loss 9 32,500 —
Pledged deposits 133,654 97,878Cash and cash equivalents 472,749 399,133
2,068,648 1,778,726
Current liabilitiesTrade and bills payables 10 272,018 141,785Deposits received, accruals and other payables 260,836 174,333Bank loans 394,206 121,202Income tax payables 20,096 22,196
947,156 459,516
Net current assets 1,121,492 1,319,210
Total assets less current liabilities 2,440,869 2,527,948
Non-current liabilitiesBank loans 9,000 —
Deferred tax liabilities 12,186 14,421
Total non-current liabilities 21,186 14,421
NET ASSETS 2,419,683 2,513,527
– 4 –
As at31 December
As at31 December
2014 2013Note RMB’000 RMB’000
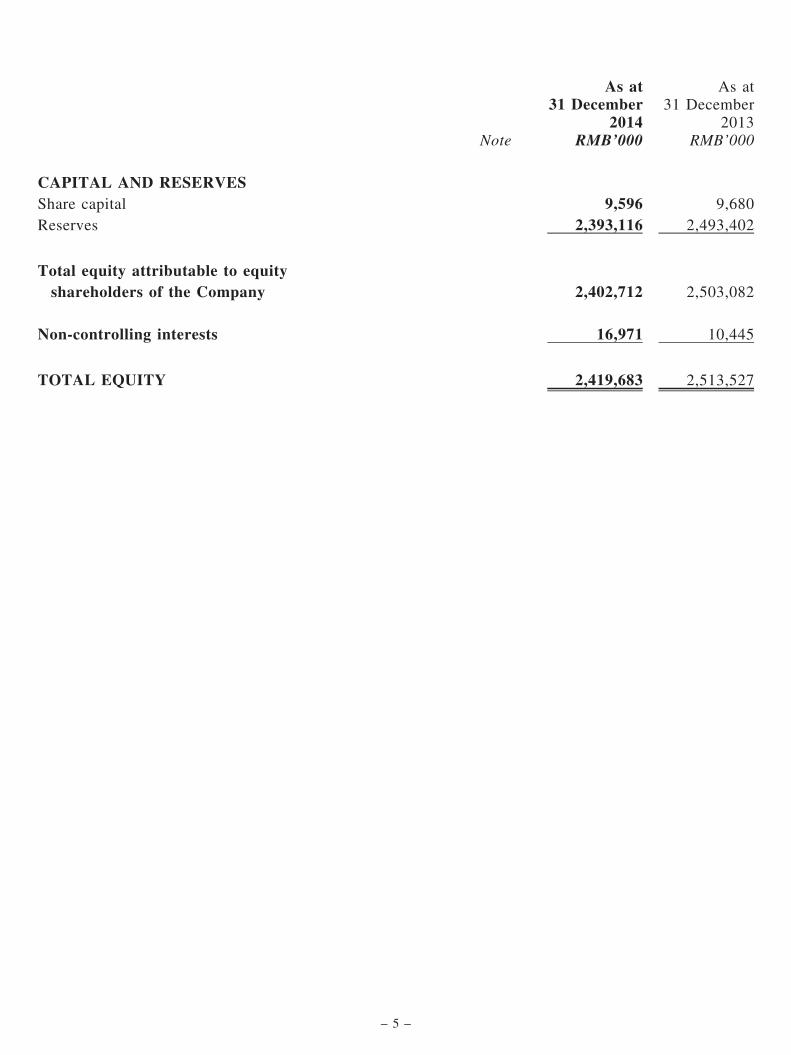
CAPITAL AND RESERVESShare capital 9,596 9,680Reserves 2,393,116 2,493,402
Total equity attributable to equityshareholders of the Company 2,402,712 2,503,082
Non-controlling interests 16,971 10,445
TOTAL EQUITY 2,419,683 2,513,527
– 5 –
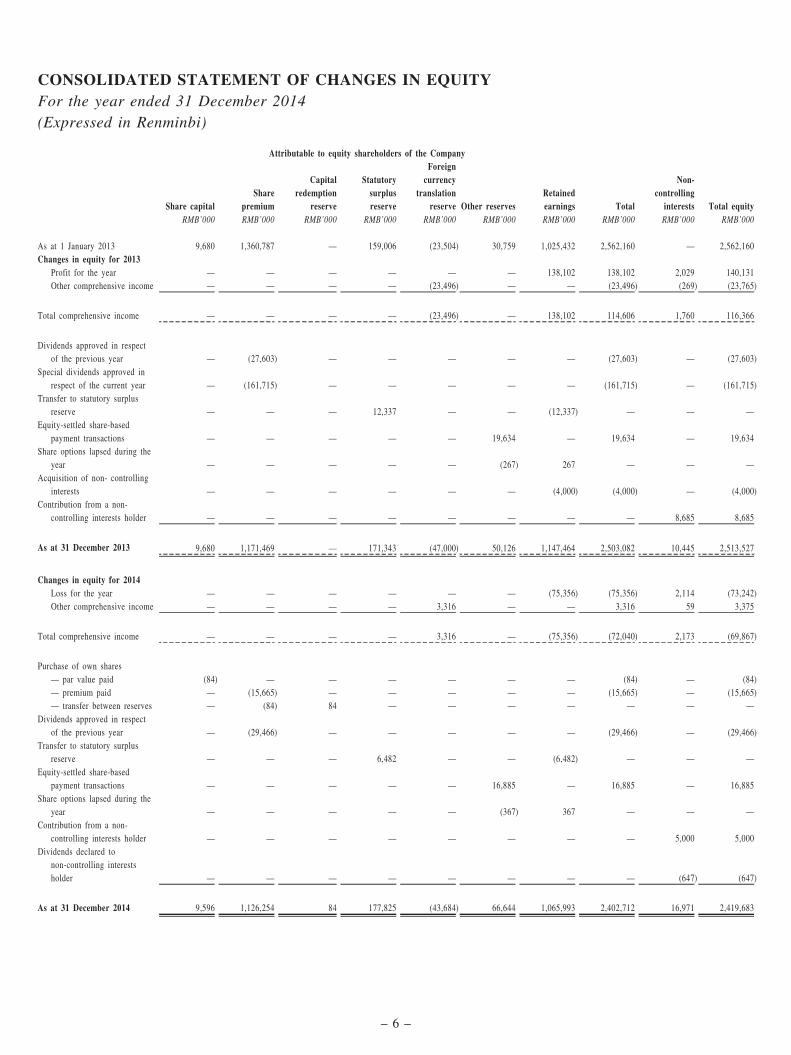
CONSOLIDATED STATEMENT OF CHANGES IN EQUITYFor the year ended 31 December 2014(Expressed in Renminbi)
Attributable to equity shareholders of the Company
Share capitalShare
premium
Capitalredemption
reserve
Statutorysurplusreserve
Foreigncurrency
translationreserve Other reserves
Retainedearnings Total
Non-controlling
interests Total equityRMB’000 RMB’000 RMB’000 RMB’000 RMB’000 RMB’000 RMB’000 RMB’000 RMB’000 RMB’000
As at 1 January 2013 9,680 1,360,787 — 159,006 (23,504) 30,759 1,025,432 2,562,160 — 2,562,160Changes in equity for 2013
Profit for the year — — — — — — 138,102 138,102 2,029 140,131Other comprehensive income — — — — (23,496) — — (23,496) (269) (23,765)
Total comprehensive income — — — — (23,496) — 138,102 114,606 1,760 116,366
Dividends approved in respectof the previous year — (27,603) — — — — — (27,603) — (27,603)
Special dividends approved inrespect of the current year — (161,715) — — — — — (161,715) — (161,715)
Transfer to statutory surplusreserve — — — 12,337 — — (12,337) — — —
Equity-settled share-basedpayment transactions — — — — — 19,634 — 19,634 — 19,634
Share options lapsed during theyear — — — — — (267) 267 — — —
Acquisition of non- controllinginterests — — — — — — (4,000) (4,000) — (4,000)
Contribution from a non-controlling interests holder — — — — — — — — 8,685 8,685
As at 31 December 2013 9,680 1,171,469 — 171,343 (47,000) 50,126 1,147,464 2,503,082 10,445 2,513,527
Changes in equity for 2014Loss for the year — — — — — — (75,356) (75,356) 2,114 (73,242)Other comprehensive income — — — — 3,316 — — 3,316 59 3,375
Total comprehensive income — — — — 3,316 — (75,356) (72,040) 2,173 (69,867)
Purchase of own shares— par value paid (84) — — — — — — (84) — (84)— premium paid — (15,665) — — — — — (15,665) — (15,665)— transfer between reserves — (84) 84 — — — — — — —
Dividends approved in respectof the previous year — (29,466) — — — — — (29,466) — (29,466)
Transfer to statutory surplusreserve — — — 6,482 — — (6,482) — — —
Equity-settled share-basedpayment transactions — — — — — 16,885 — 16,885 — 16,885
Share options lapsed during theyear — — — — — (367) 367 — — —
Contribution from a non-controlling interests holder — — — — — — — — 5,000 5,000
Dividends declared tonon-controlling interestsholder — — — — — — — — (647) (647)
As at 31 December 2014 9,596 1,126,254 84 177,825 (43,684) 66,644 1,065,993 2,402,712 16,971 2,419,683
– 6 –

CONSOLIDATED STATEMENT OF CASH FLOWSFor the year ended 31 December 2014(Expressed in Renminbi)
Year ended 31 December2014 2013
RMB’000 RMB’000
Operating activities(Loss)/profit before taxation (39,476) 210,566Adjustments for:Net change in fair value of biological assets 144,349 (47,761)Net finance costs 19,636 53Equity-settled share-based payment transactions 16,885 19,634Depreciation of property, plant and equipment 56,167 48,057Amortisation of lease prepayments in respect of land use rights 1,645 1,406Net gain on the resumption of land and assets of Nature(Zhangjiagang) Wood Industry Company, Limited(‘‘Nature Zhangjiagang’’) — (51,394)
Net loss/(gain) on disposal of property, plant and equipment 5,484 (627)Amortisation of intangible assets 2,451 2,173Impairment loss on investments in unlisted equity securities 2,522 5,424Loss on disposal of an unlisted equity security — 1,088Loss on disposal of a subsidiary 1,147 —
Changes in working capital:Increase in inventories (117,353) (53,472)Increase in trade and bills receivables (20,394) (21,019)Decrease/(increase) in deposits, prepayments and other receivables 3,722 (78,260)Increase in trade and bills payables 130,233 4,053Increase in deposits received, accruals and other payables 4,960 22,724
Cash generated from operations 211,978 62,645The People’s Republic of China (the ‘‘PRC’’) income tax paid (44,190) (52,719)Non-PRC income tax paid (1,246) (7)
Net cash generated from operating activities 166,542 9,919
– 7 –

Year ended 31 December2014 2013
RMB’000 RMB’000
Investing activitiesInterest received 5,128 7,398Proceeds from the resumption of land and assets ofNature Zhangjiagang — 120,029
Proceeds from disposal of other property, plant and equipment 22,627 13,076Proceeds from disposal of investment in unlisted equity securities — 3,162Payment for acquisition of property, plant and equipment (174,031) (225,633)Payment for acquisition of intangible assets (7,085) (893)Lease prepayments for land use rights (65,077) (10,299)Net cash inflow from acquisition of a subsidiary 522 —
Payment for acquisitions of unlisted equity investment (31,077) —
Payment for investment in joint venture — (5,000)
Net cash used in investing activities (248,993) (98,160)
Financing activitiesProceeds from bank loans 320,541 392,778Repayment of bank loans (38,537) (439,911)Contribution from non-controlling interests — 8,685Collection of deposits placed with banks for loans and borrowings 97,878 13,528Dividends paid (29,466) (189,318)Interest paid (12,230) (6,796)Costs of early repayment of loans from a third party — (5,049)Purchase of own shares (15,749) —
Payment for acquisition of non-controlling interests — (1,600)Deposits placed with banks for loans and borrowings (133,654) (97,878)Purchase of financial assets at the fair value through profit or loss (32,500) —
Net cash generated from/(used in) financing activities 156,283 (325,561)
Net increase/(decrease) in cash and cash equivalents 73,832 (413,802)
Cash and cash equivalents at 1 January 399,133 815,706
Effect of foreign exchange rate changes (216) (2,771)
Cash and cash equivalents at 31 December 472,749 399,133
– 8 –

NOTES TO THE FINANCIAL STATEMENTS
1. BASIS OF PREPARATION
(a) Statement of compliance
These financial statements have been prepared in accordance with all applicable International Financial Reporting
Standards (‘‘IFRSs’’), which collective term includes all applicable individual IFRSs, International Accounting
Standards (‘‘IASs’’) and Interpretations adopted by the International Accounting Standards Board (‘‘IASB’’).
These financial statements also comply with the applicable disclosure provisions of the Rules Governing the
Listing of Securities on The Stock Exchange of Hong Kong Limited (‘‘HKSE’’) and the disclosure requirements
of the Hong Kong Companies Ordinance, which for this financial year and the comparative period continue to be
those of the predecessor Hong Kong Companies Ordinance (Cap. 32), in accordance with transitional and saving
arrangements for Part 9 of the new Hong Kong Companies Ordinance (Cap. 622), ‘‘Accounts and Audit’’, which
are set out in sections 76 to 87 of Schedule 11 to that Ordinance.
The IASB has issued certain new and revised IFRSs that are first effective or available for early adoption for the
current accounting period of the Group and the Company. Note 1(c) provides information on any changes in
accounting policies resulting from initial application of these developments to the extent that they are relevant to
the Group for the current and prior accounting periods reflected in these financial statements.
(b) Basis of preparation of the financial statements
The consolidated financial statements for the year ended 31 December 2014 comprise the Company and its
subsidiaries.
The measurement basis used in the preparation of the financial statements is the historical cost basis except that
the following assets are stated at their fair value as explained in the accounting policies set out below:
. biological assets; and
. financial assets at fair value through profit or loss
The preparation of financial statements in conformity with IFRSs requires management to make judgements,
estimates and assumptions that affect the application of policies and reported amounts of assets, liabilities,
income and expenses. The estimates and associated assumptions are based on historical experience and various
other factors that are believed to be reasonable under the circumstances, the results of which form the basis of
making the judgements about carrying values of assets and liabilities that are not readily apparent from other
sources. Actual results may differ from these estimates.
The estimates and underlying assumptions are reviewed on an ongoing basis. Revisions to accounting estimates
are recognised in the period in which the estimate is revised if the revision affects only that period, or in the
period of the revision and future periods if the revision affects both current and future periods.
– 9 –

(c) Changes in accounting policies
The IASB has issued a number of amendments to IFRSs and one new interpretation that are first effective for the
current accounting period of the Group. Of these, the following development is relevant to the Group’s financial
statements:
. Amendments to IAS 32, Offsetting financial assets and financial liabilities
The amendments to IAS 32 clarify the offsetting criteria in IAS 32. The amendments do not have an impact on
the Group’s financial statements as they are consistent with the policies already adopted by the Group.
The Group has not applied any new standard or interpretation that is not yet effective for the current accounting
period.
2. TURNOVER AND SEGMENTS REPORTING
The principal activities of the Group are manufacturing and sale of wood products, provision of trademark and
distribution network, sale of timber and wood products and harvesting and sale of timber and wood products.
Turnover represents the sales value of goods supplied to customers and income from of trademark and distribution
network usage fees. Revenue excludes value added tax or other sales taxes and is after deduction of any returns and
trade discounts. The amount of each significant category of revenue recognised in turnover is as follows:
2014 2013
RMB’000 RMB’000
Sale of self-produced wood products 1,408,479 991,179
Provision of trademark and distribution network 199,466 235,016
Sale of timber and wood products 362,672 254,957
Sale of self-harvested timber and wood products 8,668 7,889
1,979,285 1,488,949
The Group’s customer base is diversified and did not have any customer with whom transactions exceeded 10% of the
Group’s aggregate revenue for the year ended 31 December 2014 (2013: Nil).
– 10 –

(a) Segment results, assets and liabilities
The Group manages its business by different lines of businesses and geographical locations. In a manner
consistent with the way in which information is reported internally to the Group’s most senior executive
management for the purposes of resource allocation and performance assessment, the Group has presented the
following reportable segments.
. Manufacturing and sale of wood products: this segment manufactures and sells wood products.
. Trademark and distribution network: this segment generates fees income from products manufactured by
authorised manufacturers which sell products under the Group’s trademarks and distribution network.
. Trading of timber and wood products: this segment trades timber and wood products.
. Forestry management: this segment operates forestry assets including harvest and sale of timber and wood
products.
Information regarding the Group’s reportable segments as provided to the Group’s most senior executive
management for the purposes of resource allocation and assessment of segment performance are set out below:
Manufacturing
and sale of wood
products
Trademark
and distribution
network
Trading of timber
and wood products
Forestry
management Total
2014 2013 2014 2013 2014 2013 2014 2013 2014 2013
RMB‘000 RMB‘000 RMB‘000 RMB‘000 RMB‘000 RMB‘000 RMB‘000 RMB‘000 RMB‘000 RMB‘000
Revenue from external customers 1,408,479 991,179 199,466 235,016 362,672 254,957 8,668 7,797 1,979,285 1,488,949
Inter-segment revenue 26,286 18,636 — — 42,097 28,727 3,064 2,196 71,447 49,559
Reportable segment revenue 1,434,765 1,009,815 199,466 235,016 404,769 283,684 11,732 9,993 2,050,732 1,538,508
Reportable segment result 120,989 85,415 60,600 88,383 20,716 19,523 (167,175) 15,259 35,130 208,580
Depreciation and amortisation
for the year (26,347) (21,375) — — (2,288) (1,579) (4,461) (2,999) (33,096) (25,953)
Net impairment losses
(recognised)/reversed for trade
receivables during the year (2,180) (12,199) — — 1,306 1,396 — — (874) (10,803)
Reportable segment assets 1,736,323 1,492,459 136,399 136,780 813,400 739,780 457,747 593,008 3,143,869 2,962,027
Reportable segment liabilities 458,173 449,644 — — 1,150,896 1,176,293 203,265 170,719 1,812,334 1,796,656
– 11 –

(b) Reconciliations of reportable segment revenues, profit or loss, assets and liabilities
2014 2013RMB’000 RMB’000
RevenueReportable segment revenue 2,050,732 1,538,508Elimination of inter-segment revenue (71,447) (49,559)
Consolidated revenue 1,979,285 1,488,949
ProfitReportable segment result 35,130 208,580Elimination of inter-segment profits (10,165) (1,879)
Reportable segment result derived from external customers 24,965 206,701
Other net income 16,579 83,246Other operating expenses (10,438) (9,253)Depreciation and amortisation (27,167) (25,683)Net finance costs (19,636) (53)Unallocated head office and corporate expenses (23,779) (44,392)
Consolidated (loss)/profit before taxation (39,476) 210,566
AssetsReportable segment assets 3,143,869 2,962,027Elimination of inter-segment balances (211,954) (367,406)Elimination of receivables from corporate headquarters (279,178) (130,310)
2,652,737 2,464,311
Cash and cash equivalents 472,749 399,133Pledged deposits 133,654 97,878Investment in unlisted equity securities 33,351 4,796Deferred tax assets 28,459 21,184Unallocated head office and corporate assets 67,075 162
Consolidated total assets 3,388,025 2,987,464
LiabilitiesReportable segment liabilities 1,812,334 1,796,656Elimination of inter-segment balances (211,954) (367,406)Elimination of payables to corporate headquarters (1,095,083) (1,113,773)
505,297 315,477
Banks loans 403,206 121,202Income tax payables 20,096 22,196Deferred tax liabilities 12,186 14,421Unallocated head office and corporate liabilities 27,557 641
Consolidated total liabilities 968,342 473,937
– 12 –
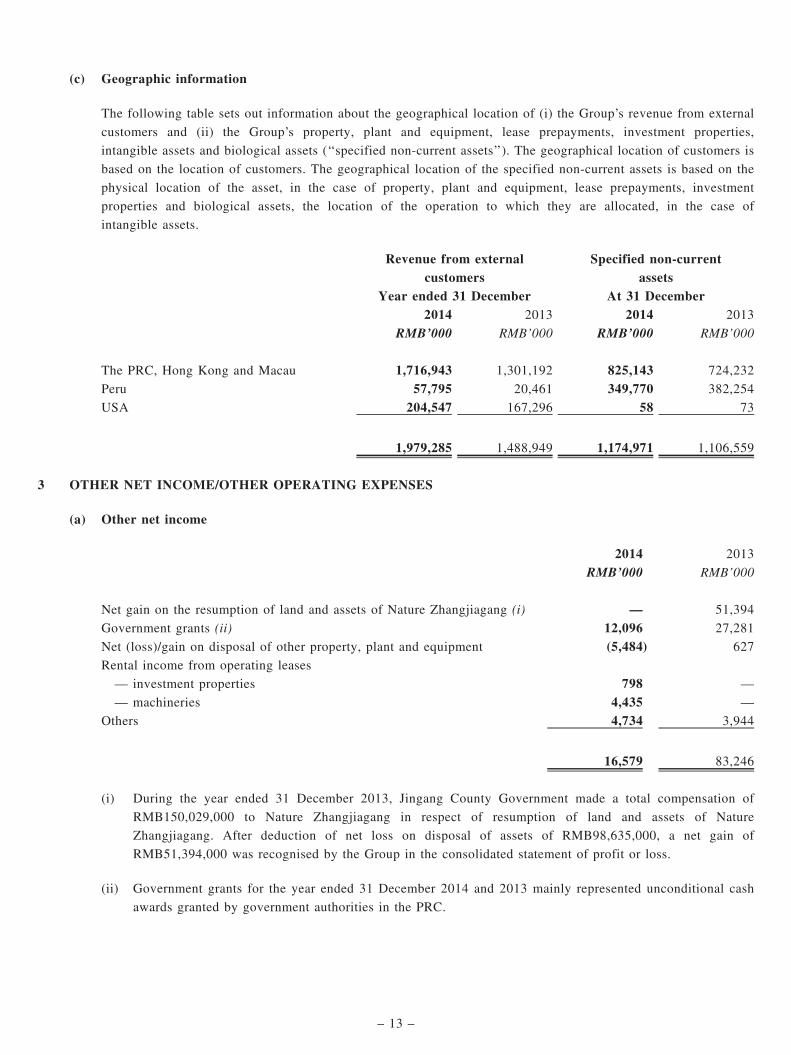
(c) Geographic information
The following table sets out information about the geographical location of (i) the Group’s revenue from external
customers and (ii) the Group’s property, plant and equipment, lease prepayments, investment properties,
intangible assets and biological assets (‘‘specified non-current assets’’). The geographical location of customers is
based on the location of customers. The geographical location of the specified non-current assets is based on the
physical location of the asset, in the case of property, plant and equipment, lease prepayments, investment
properties and biological assets, the location of the operation to which they are allocated, in the case of
intangible assets.
Revenue from externalcustomers
Specified non-currentassets
Year ended 31 December At 31 December2014 2013 2014 2013
RMB’000 RMB’000 RMB’000 RMB’000
The PRC, Hong Kong and Macau 1,716,943 1,301,192 825,143 724,232
Peru 57,795 20,461 349,770 382,254
USA 204,547 167,296 58 73
1,979,285 1,488,949 1,174,971 1,106,559
3 OTHER NET INCOME/OTHER OPERATING EXPENSES
(a) Other net income
2014 2013
RMB’000 RMB’000
Net gain on the resumption of land and assets of Nature Zhangjiagang (i) — 51,394
Government grants (ii) 12,096 27,281
Net (loss)/gain on disposal of other property, plant and equipment (5,484) 627
Rental income from operating leases
— investment properties 798 —
— machineries 4,435 —
Others 4,734 3,944
16,579 83,246
(i) During the year ended 31 December 2013, Jingang County Government made a total compensation of
RMB150,029,000 to Nature Zhangjiagang in respect of resumption of land and assets of Nature
Zhangjiagang. After deduction of net loss on disposal of assets of RMB98,635,000, a net gain of
RMB51,394,000 was recognised by the Group in the consolidated statement of profit or loss.
(ii) Government grants for the year ended 31 December 2014 and 2013 mainly represented unconditional cash
awards granted by government authorities in the PRC.
– 13 –

(b) Other operating expenses
2014 2013
RMB’000 RMB’000
Impairment loss for investment in unlisted equity securities 2,522 5,424
Loss on disposal of an unlisted equity security — 1,088
Loss on disposal of a subsidiary 1,147 —
Donations 1,635 1,260
Others 5,134 1,481
10,438 9,253
4. (LOSS)/PROFIT BEFORE TAXATION
(Loss)/profit before taxation is arrived at after (crediting)/charging:
(a) Finance income and finance costs
2014 2013
RMB’000 RMB’000
Interest income on bank deposits (5,128) (7,398)
Net foreign exchange gain — (4,394)
Finance income (5,128) (11,792)
Interest expense on bank loans 12,230 6,796
Cost of early repayment of loans from a third party (note) — 5,049
Net foreign exchange expenses 12,534 —
Finance costs 24,764 11,845
Net finance costs recognised in profit or loss 19,636 53
Note: On 18 September 2013, the Company early repaid a term loan of RMB185,388,000 and a convertible
loan of RMB61,796,000. Such loans were obtained in May 2013 and were intended to be used for
funding the acquisition of forestry assets in the PRC. An early repayment cost of RMB5,049,000 was
incurred as the Group did not identify any target forestry assets in the PRC.
– 14 –

(b) Staff costs
2014 2013
RMB’000 RMB’000
Salaries, wages and other benefits 209,560 159,581
Contributions to defined contribution retirement plan 8,103 6,557
Equity-settled share-based payment expenses 16,885 19,634
234,548 185,772
The employees of the companies in the PRC participate in a defined contribution retirement scheme operated by
the local government authorities whereby the Group is required to contribute to the scheme at rate of 10-20% of
the eligible employees’ basic salary. The local government authorities are responsible for the entire pension
obligations payable to the retired employees.
Contributions to the Mandatory Provident Fund (‘‘MPF’’) are required under the Hong Kong Mandatory
Provident Fund Schemes Ordinance. Under the MPF scheme, the employer and its employees are each required
to make contributions to the plan at 5% of the employees’ relevant income, subject to a cap of monthly relevant
income of HK$30,000 (HK$25,000 prior to June 2014).
(c) Other items
2014 2013
RMB’000 RMB’000
Cost of inventories* 1,354,889 983,564
Net impairment losses
— trade and other receivables 874 10,803
— investments in unlisted equity securities 2,522 5,424
Depreciation 56,167 48,057
Amortisation
— lease prepayments 1,645 1,406
— intangible assets 2,451 2,173
Net loss/(gain) on disposal of property, plant and equipment 5,484 (627)
Operating lease charges:
— hire of plant and machinery 10,404 9,257
— other assets (including property rental) 7,752 5,173
Auditors’ remuneration 4,114 3,906
* For the year ended 31 December 2014, cost of inventories includes RMB118,799,000 (2013:
RMB92,533,000) relating to staff costs, depreciation and operating lease charges, amounts of which are
also included in the respective total amounts disclosed separately above or in (b) for each of these types of
expenses.
– 15 –
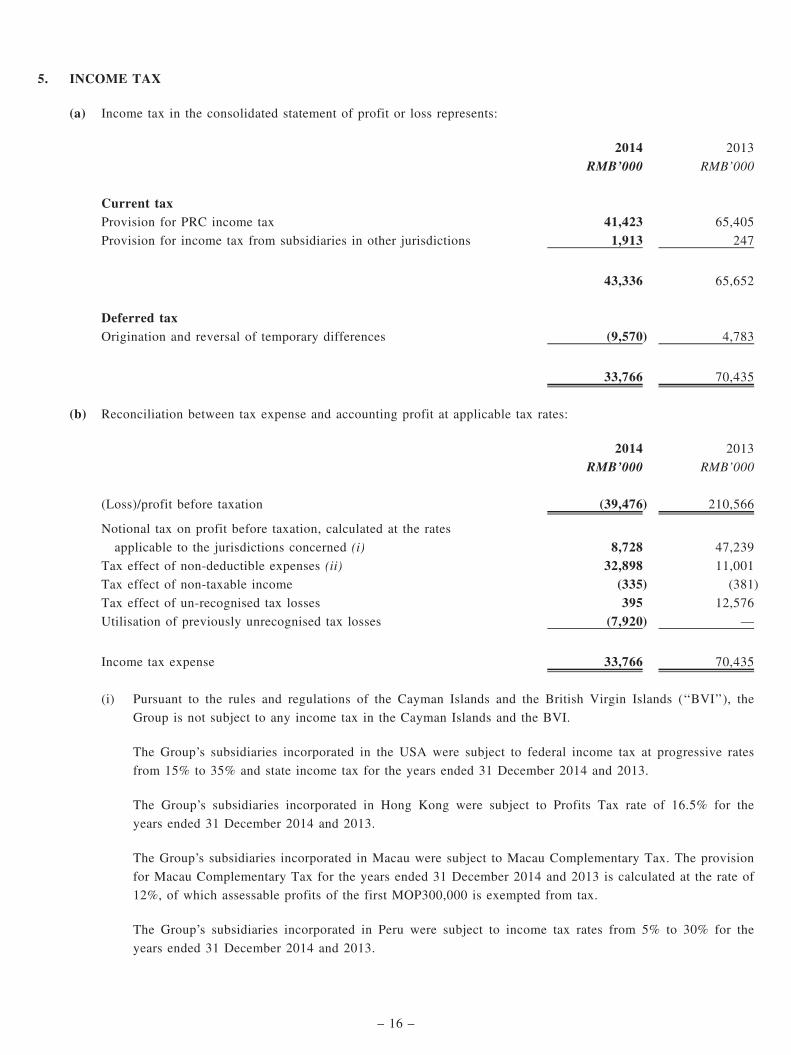
5. INCOME TAX
(a) Income tax in the consolidated statement of profit or loss represents:
2014 2013
RMB’000 RMB’000
Current taxProvision for PRC income tax 41,423 65,405
Provision for income tax from subsidiaries in other jurisdictions 1,913 247
43,336 65,652
Deferred taxOrigination and reversal of temporary differences (9,570) 4,783
33,766 70,435
(b) Reconciliation between tax expense and accounting profit at applicable tax rates:
2014 2013
RMB’000 RMB’000
(Loss)/profit before taxation (39,476) 210,566
Notional tax on profit before taxation, calculated at the rates
applicable to the jurisdictions concerned (i) 8,728 47,239
Tax effect of non-deductible expenses (ii) 32,898 11,001
Tax effect of non-taxable income (335) (381)
Tax effect of un-recognised tax losses 395 12,576
Utilisation of previously unrecognised tax losses (7,920) —
Income tax expense 33,766 70,435
(i) Pursuant to the rules and regulations of the Cayman Islands and the British Virgin Islands (‘‘BVI’’), the
Group is not subject to any income tax in the Cayman Islands and the BVI.
The Group’s subsidiaries incorporated in the USA were subject to federal income tax at progressive rates
from 15% to 35% and state income tax for the years ended 31 December 2014 and 2013.
The Group’s subsidiaries incorporated in Hong Kong were subject to Profits Tax rate of 16.5% for the
years ended 31 December 2014 and 2013.
The Group’s subsidiaries incorporated in Macau were subject to Macau Complementary Tax. The provision
for Macau Complementary Tax for the years ended 31 December 2014 and 2013 is calculated at the rate of
12%, of which assessable profits of the first MOP300,000 is exempted from tax.
The Group’s subsidiaries incorporated in Peru were subject to income tax rates from 5% to 30% for the
years ended 31 December 2014 and 2013.
– 16 –

The PRC’s statutory income tax rate is 25% for the years ended 31 December 2014 and 2013.
(ii) For the year ended 31 December 2014, the tax effect of non-deductible expenses mainly include impairment
losses recognised and losses from change in fair value of biological assets recorded by Jiangxi Yingran
Forest Development Company Limited (‘‘Jiangxi Forest’’). According to relevant Corporate Income Tax
Law in the PRC, income derived from projects in the forestry industry is exempted from corporate income
tax.
6. (LOSS)/EARNINGS PER SHARE
(a) Basic (loss)/earnings per share
The calculation of basic (loss)/earnings per share is based on the result attributable to equity shareholders of the
Company and the weighted average number of ordinary shares in issue, calculated as follows:
(i) Loss attributable to equity shareholders of the Company of RMB75,356,000 (2013: a profit of
RMB138,102,000).
(ii) Weighted average number of ordinary shares
2014 2013
’000 ’000
Issued ordinary shares at 1 January 1,481,824 1,481,824
Effect of repurchase and cancellation of own shares (9,697) —
Weighted average number of ordinary shares at 31 December 1,472,127 1,481,824
(b) Diluted (loss)/earnings per share
For the years ended 31 December 2014 and 2013, the effect of the Company’s outstanding share options was
anti-dilutive. Therefore, diluted (loss)/earnings per share were the same as the basic (loss)/earnings per share.
7. INVENTORIES
At31 December
2014
At
31 December
2013
RMB’000 RMB’000
Raw materials 109,749 72,306
Work in progress 43,503 48,895
Finished goods 363,065 266,084
Spare parts and consumables 27,674 25,348
543,991 412,633
– 17 –
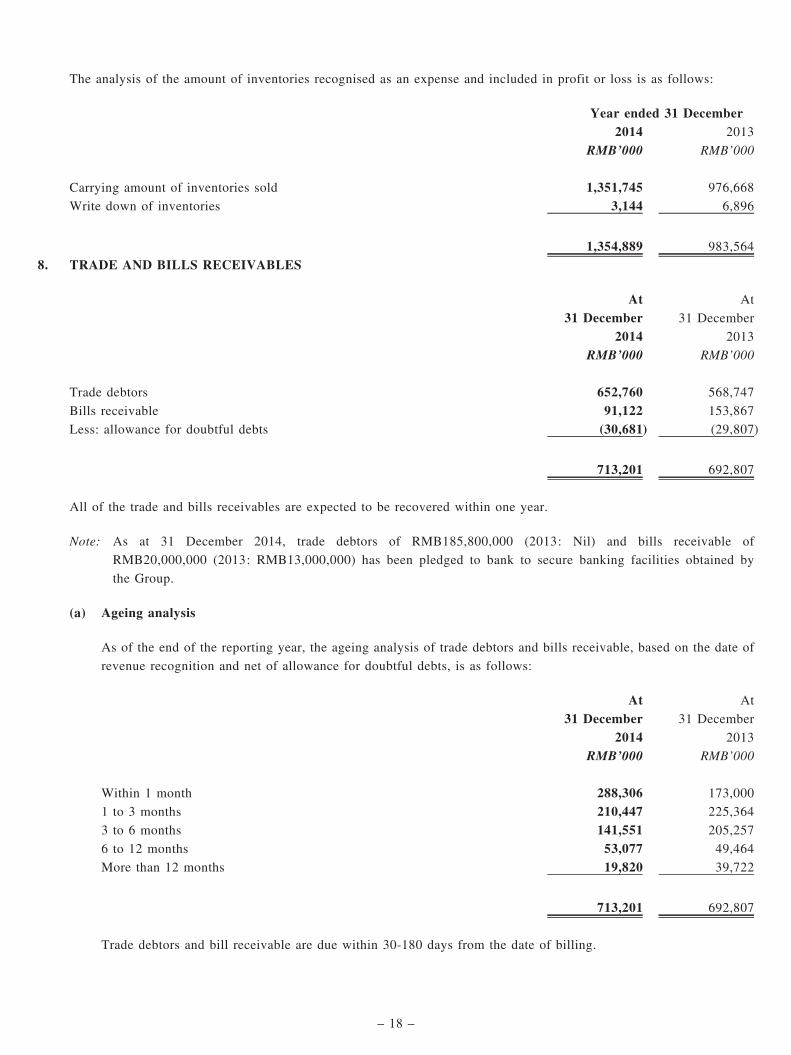
The analysis of the amount of inventories recognised as an expense and included in profit or loss is as follows:
Year ended 31 December2014 2013
RMB’000 RMB’000
Carrying amount of inventories sold 1,351,745 976,668
Write down of inventories 3,144 6,896
1,354,889 983,564
8. TRADE AND BILLS RECEIVABLES
At31 December
2014
At
31 December
2013
RMB’000 RMB’000
Trade debtors 652,760 568,747
Bills receivable 91,122 153,867
Less: allowance for doubtful debts (30,681) (29,807)
713,201 692,807
All of the trade and bills receivables are expected to be recovered within one year.
Note: As at 31 December 2014, trade debtors of RMB185,800,000 (2013: Nil) and bills receivable of
RMB20,000,000 (2013: RMB13,000,000) has been pledged to bank to secure banking facilities obtained by
the Group.
(a) Ageing analysis
As of the end of the reporting year, the ageing analysis of trade debtors and bills receivable, based on the date of
revenue recognition and net of allowance for doubtful debts, is as follows:
At31 December
2014
At
31 December
2013
RMB’000 RMB’000
Within 1 month 288,306 173,000
1 to 3 months 210,447 225,364
3 to 6 months 141,551 205,257
6 to 12 months 53,077 49,464
More than 12 months 19,820 39,722
713,201 692,807
Trade debtors and bill receivable are due within 30-180 days from the date of billing.
– 18 –

(b) Impairment loss of trade debtors and bills receivable
Impairment losses in respect of trade debtors and bills receivable are recorded using an allowance account unless
the Group is satisfied that recovery of the amount is remote, in which case the impairment loss is written off
against trade debtors and bills receivable directly.
The movement in the allowance for doubtful debts during current year, including both specific and collectiveloss components, is as follows:
At31 December
2014
At31 December
2013RMB’000 RMB’000
As at 1 January 29,807 19,004Impairment loss recognised 18,698 23,679Reversal of impairment loss recognised (17,824) (12,876)
As at 31 December 30,681 29,807
As at 31 December 2014, the Group’s trade receivables of RMB33,989,000 (31 December 2013:RMB30,727,000) were individually determined to be impaired. The individually impaired receivables related tocustomers that were in financial difficulties and management assessed that only a portion of the receivables isexpected to be recovered. Consequently, specific allowances for doubtful debts of RMB30,681,000 as at 31December 2014 were recognised (31 December 2013: RMB29,807,000).
9. FINANCIAL ASSETS AT FAIR VALUE THROUGH PROFIT OR LOSS
As at 31 December 2014, the Group held investment in a wealth management product issued by a bank in the PRCwith principal amount of RMB32,500,000. The wealth management product will mature on 11 June 2015. Based onthe agreement, the expected yield is ranged from 3.30% to 4.65% per annum which is linked to London Gold MarketIndex during the investment period. The principal amount of the product will be fully paid back at maturity day.
As at 31 December 2014, this wealth management product has been pledged to a bank to secure banking facilitiesobtained by the Group.
10. TRADE AND BILLS PAYABLES
At31 December
2014
At
31 December
2013
RMB’000 RMB’000
Trade creditors 223,779 127,685
Bills payable 48,239 14,100
272,018 141,785
All of the trade and bills payables are expected to be settled within one year or are repayable on demand.
– 19 –

As of the end of the reporting period, the ageing analysis of trade creditors and bills payable, based on invoice date is
as follow:
As at31 December
2014
As at
31 December
2013
RMB’000 RMB’000
Within 1 month 152,730 75,441
1 to 3 months 84,241 50,238
3 to 6 months 18,480 2,754
6 to 12 months 15,369 13,352
1 to 2 years 1,198 —
272,018 141,785
11. DIVIDENDS
(i) Dividends payable to equity shareholders of the Company attributable to the year
2014 2013
RMB’000 RMB’000
Special dividend declared and paid in 2013 of HK$0.128
(equivalent to RMB0.108) per ordinary share — 161,715
Final dividend of HK$0.014 (equivalent to RMB0.011) per ordinary share
proposed after the end of the reporting period (2013: HK$0.025
(equivalent to RMB0.021) per ordinary share) 16,216 31,344
The final dividend proposed after the end of the reporting period has not been recognised as a liability at the end
of the reporting period.
(ii) Dividends payable to equity shareholders of the Company attributable to the previous financial year, approved
and paid during the year
2014 2013
RMB’000 RMB’000
Dividend in respect of the previous year, approved and
paid during the year 29,466 27,603
– 20 –

MANAGEMENT DISCUSSION AND ANALYSIS
Business Review
For the year ended 31 December 2014 (the ‘‘Year’’), the Group maintained steady business growthdespite the competitions on channel, brand and price, amidst various uncertainties in the People’sRepublic of China (the ‘‘PRC’’) household-product market and global economy. The Group achieved anincrease of 32.9% in overall turnover when compared to the corresponding period last year. In respectof manufacturing and sale of wood products, trading of timber and wood products and forestrymanagement the Group recorded an increase in sales of approximately 42.1% and 42.2% and 11.1%,respectively. In respect of provision of trademarks and distribution network, the Group recorded adecrease in sales of approximately 15.1%. Moreover, a total of 26,826,000 square meters of ourbranded flooring products were sold during the year (for the year ended 31 December 2013:22,872,000 square meters), representing an increase of 24.8% year-on-year.
During the Year, the Group devoted continuous efforts to enlarge its market share of the Chineseflooring market, which led to the sales growth and better management of operating cash flow for thedomestic sales of flooring products. Nonetheless, the Year witnessed the Group enhance the expansionof overseas markets as well as the manufacturing and sales of wooden doors, wardrobes and cabinets.Furthermore, the Group made strategic investment in the PRC market of household products andservices in a bid to integrate its business of household products.
In respect of investment, the Group has become the strategic investor of Zhejiang YongYU BambooJoint-Stock Co.,Ltd. (‘‘Zhejiang YongYU’’) and Kong Jian Zhi Hui Decoration and Refurbishment(Beijing) Co., Ltd. (‘‘Kong Jian Zhi Hui’’). Zhejiang YongYU (‘‘浙江永裕’’) is a high and newtechnology enterprise that integrates the R&D, manufacturing and sales of bamboo flooring, furnitureand decoration material, whose shares are listed at the National Equities Exchange and Quotations forpublic transfer in the PRC (stock code: 831996). Kong Jian Zhi Hui (‘‘空間智慧’’) is a decorationengineering enterprise that integrates indoor decoration design, construction and product supply. As atthe date of this announcement, the Group holds 14.15% equity interest in Zhejiang YongYU and 7.5%equity interest in Kong Jian Zhi Hui.
1. Manufacturing and sales of wood products
The Group’s wood products are comprised of mainly floorings, wooden doors, wardrobes andcabinets. For the year ended 31 December 2014, the sales for the Group’s manufacturing and saleof wood products business was RMB1,408,479,000 (for the year ended 31 December 2013:RMB991,179,000), recording an increase of 42.1% year-on-year. Such increase is principallyattributable to the continued growth of the Group’s flooring business and the increased in sales offlooring products.
– 21 –

The business of manufacturing and sale of flooring products
In terms of the business of manufacturing and sales of flooring products, the Group’s flooringproducts mainly include laminated floorings, solid wood and engineered floorings. In respect of itsflooring store network, the Group has established a sound and extensive sales network in the PRC.The Group is also a major PRC distributor of a number of renowned foreign brands. As at 31December 2014, number of flooring stores reached 3,404 (31 December 2013: 3,338) in total, ofwhich, there were 1,799 ‘‘Nature’’ stores (31 December 2013: 1,917), 1,227 ‘‘Nature . No. 1 MySpace’’ stores (31 December 2013: 1,130), 131 ‘‘Nature . Aesthetics’’ stores (31 December 2013:155), and 124 foreign imported brand stores (31 December 2013: 71) and 123 other brand stores(31 December 2013: 65).
To facilitate the continuous growth of flooring product sales, the Group strived for capacityexpansion by constructing plants in Zhongshan City of Guangdong Province and Nanning City ofGuangxi Zhuang Autonomous Region to manufacture laminated floorings. One plant hascommence trial production in the second half of 2014 and the other is expected to commence trialproduction in the second half of 2015.
The business of manufacturing and sale of wooden doors, wardrobes and cabinets
In 2011, the Group started household products business leveraging on its ‘‘Nature’’ brand andnetwork. Since then, the Group has been gradually achieving its goal of integration of householdproducts. The business of wooden doors, wardrobes and cabinets is one of the core businesses ofthe Group. Leveraging on the brand recognition of ‘‘Nature’’, the Group has established its sub-brands, namely ‘‘Nature Wooden Doors’’ and ‘‘Nature Vanessa’’ respectively to further tap into thebusiness of wooden doors, wardrobes and cabinets. The Group has set up a production plant inTaizhou City, Jiangsu Province, the PRC (the ‘‘Taizhou Plant’’) which officially opened in lateFebruary 2014 and has already commenced its commercial production in the second half of 2014.It is the largest production plant among the wooden doors business of the Group with advancedproduction equipment imported from overseas. Although the business of manufacturing and sale ofwooden doors still recorded losses in the Year, the production cost is expected to be furtherreduced with the gradually improved production capacity of Taizhou Plant. As at 31 December2014, there were 665 (31 December 2013: 400) wooden door stores in total.
With respect to the business of wardrobes and cabinets, there were 240 (31 December 2013: 142)wardrobes and cabinets stores in total as at 31 December 2014. The business of wardrobes andcabinets still recorded loss for the Year. However, the Group has purchased a parcel of land and aproduction plant in Zhongshan City, Guangdong Province, the PRC (the ‘‘Zhongshan Wardrobesand Cabinets Plant’’), to set up a production line of wardrobes and cabinets. The Group alsoimported advanced production equipment from overseas to manufacture wardrobes and cabinetsproducts with high quality. The wardrobes and cabinets plant has commenced its trial productionin the second half of 2014. It is expected that the performance of the business of wardrobes andcabinets will be improved following the expanded production capacity of Zhongshan Wardrobesand Cabinets Plant. Furthermore, the Group has established an in-depth strategic cooperation
– 22 –

relationship with a domestic player of wardrobes and cabinets brand to set up a new productionline and sales network in the PRC, and it has generated sales in the second half of 2014. In termsof the overseas brand business, the Group is currently an exclusive distributor of a renownedGerman kitchen cabinet brand in the PRC.
2. Trademark and distribution network
The Group manufactures its products under the ‘‘Nature’’ brand manufactured by its ownproduction plants and through its exclusive authorized manufacturers. Such authorizedmanufacturers solely manufacture our branded products and only sell these products to thedistributors within our distribution network in an exclusive and direct manner, for which we chargethem trademark and distribution network usage fees.
During the Year, the turnover generated from trademark and distribution network usage feesdecreased by 15.1% to RMB199,466,000 from approximately RMB235,016,000 in 2013, whichwas principally attributable to the decrease in the sales of laminated products from authorizedmanufacturers as a result of the increase in laminated products manufactured by our self-ownedfactories in the Year.
3. Trading of timber and wood products
The Group’s subsidiaries located in the U.S. purchase flooring products from our self-ownedplants, authorized manufacturers and other flooring manufacturers. They then resell these productsto their customers in the overseas markets. During the Year, the Group has further boosted itsbusiness development in the U.S. by establishing additional sales channels, which drove asignificant growth in the Group’s turnover for the trading of wood flooring products in the U.S..During the Year, revenue from the Group’s trading business of timber and wood products wasapproximately RMB362,672,000 (for the year ended 31 December 2013: approximatelyRMB254,957,000), representing a significant increase of 42.2%.
4. Forest Management
As at 31 December 2014, the Group owned the land use rights and forestry concessions of 8,154hectares of forest assets in Yunnan Province, the PRC, and of 138,189 hectares of forest assets inLoreto Province, Peru. These forest assets contain several species of trees which are used in theproduction of premium solid wood flooring products. Through enhanced control on woodresources, the Group ensured itself and its authorized manufacturers a stable supply of high qualitywood.
Prospect
The Group has changed the name of the Company from ‘‘Nature Flooring Holding Company Limited’’to ‘‘Nature Home Holding Company Limited’’ in June 2014, which reflected that the Group has beengradually achieving its goal of integration of household products under its ‘‘Nature’’ brand.
– 23 –

In the PRC market, our self-owned ‘‘Nature’’ brand has been successfully positioned among consumersto represent high product quality and product safety as well as health and environmental awareness. Webelieve that more Chinese consumers will opt for household products that focus on healthy living andenvironmental protection, as health and environmental-friendly awareness grows among the Chineseconsumers. The Group will leverage on its brand recognition, consolidated business foundation anddistribution networks, to further expand its customer base and strive for steady sales growth. Inaddition, the completed investment and construction for the business of floorings, wooden doors,wardrobes and cabinets will enable the Group to better seize future development opportunities andcontinue to integrate its household products and improve its household brand strategy.
During the Year, the Group became the strategic investor of Zhejiang YongYU and Kong Jian Zhi Hui.The Group will further explore strategic partnerships and continue to seek appropriate investmentopportunities.
Faced with the challenge of gradual change to the sales model of traditional retail stores, the Group hasplanned to offer customers one-stop solutions by establishing an online housing O2O platform wherepartners will be introduced to provide various household products, logistics, decoration and installationservices. To coordinate with the development of the platform, the Group has opened ‘‘O2O HouseholdPackage Experience Stores’’ in Guangzhou and Hangzhou, the PRC to display different packages ofhousehold products, offering customers an open experience. The Group will focus on developing itsO2O platform and expanding its business in overseas markets, with appropriate strategic investments toestablish strategic partnerships. The Group will also set the goal of integrated household products,household brand enhancement and accelerated growth in domestic and overseas market shares, with acombination of online and offline platforms to maximize its sales effectiveness as a household brand.
In terms of future business development, the Group is actively seeking acquisition opportunities toexpand its international presence and to further strengthen its products offering in the householdproducts market. With all these strategies, the Company is committed to create value for itsshareholders
Financial Review
Revenue
We generate revenue from four business segments: (1) manufacturing and sale of wood products, (2)trademark and distribution network; (3) trading of timber and wood products; and (4) forestrymanagement.
Sale of self-produced wood products under the segment of manufacturing and sale of wood productsrepresents the revenue generated in the course of sales activities of laminated flooring, engineeredflooring and other wood products including wooden doors, wardrobes and cabinets we manufacture atour own factories and is measured at the fair value of the consideration received or receivable, net ofreturns and trade discounts.
– 24 –
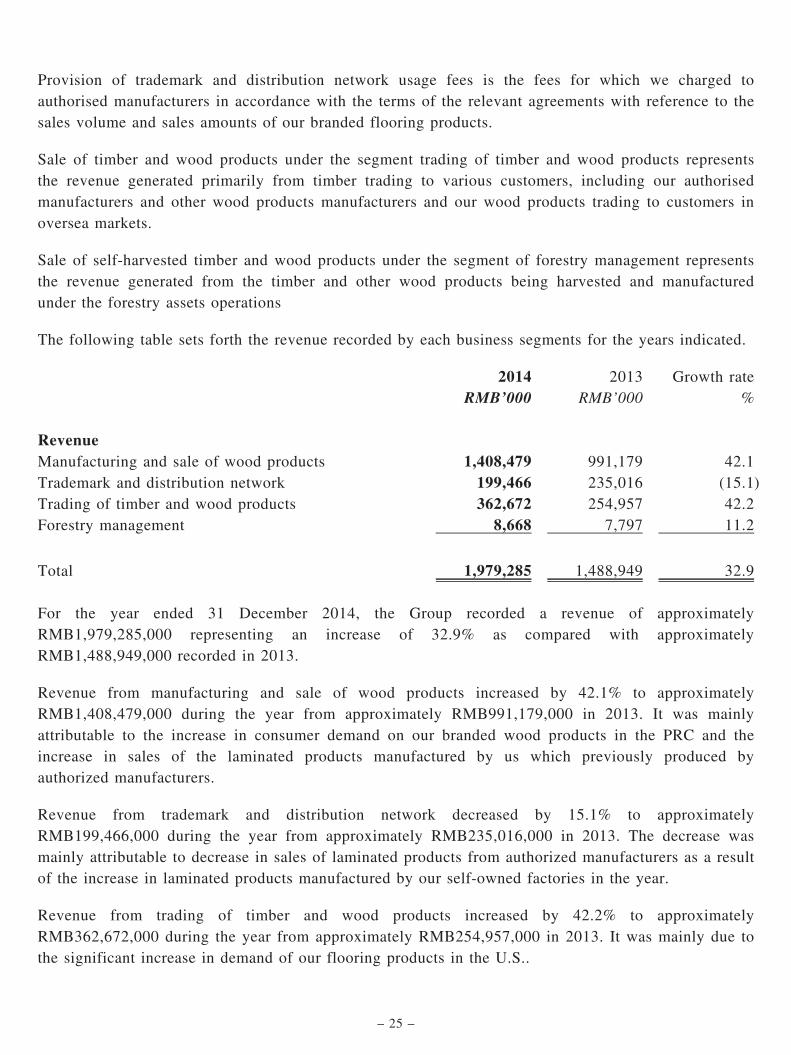
Provision of trademark and distribution network usage fees is the fees for which we charged toauthorised manufacturers in accordance with the terms of the relevant agreements with reference to thesales volume and sales amounts of our branded flooring products.
Sale of timber and wood products under the segment trading of timber and wood products representsthe revenue generated primarily from timber trading to various customers, including our authorisedmanufacturers and other wood products manufacturers and our wood products trading to customers inoversea markets.
Sale of self-harvested timber and wood products under the segment of forestry management representsthe revenue generated from the timber and other wood products being harvested and manufacturedunder the forestry assets operations
The following table sets forth the revenue recorded by each business segments for the years indicated.
2014 2013 Growth rateRMB’000 RMB’000 %
RevenueManufacturing and sale of wood products 1,408,479 991,179 42.1Trademark and distribution network 199,466 235,016 (15.1)Trading of timber and wood products 362,672 254,957 42.2Forestry management 8,668 7,797 11.2
Total 1,979,285 1,488,949 32.9
For the year ended 31 December 2014, the Group recorded a revenue of approximatelyRMB1,979,285,000 representing an increase of 32.9% as compared with approximatelyRMB1,488,949,000 recorded in 2013.
Revenue from manufacturing and sale of wood products increased by 42.1% to approximatelyRMB1,408,479,000 during the year from approximately RMB991,179,000 in 2013. It was mainlyattributable to the increase in consumer demand on our branded wood products in the PRC and theincrease in sales of the laminated products manufactured by us which previously produced byauthorized manufacturers.
Revenue from trademark and distribution network decreased by 15.1% to approximatelyRMB199,466,000 during the year from approximately RMB235,016,000 in 2013. The decrease wasmainly attributable to decrease in sales of laminated products from authorized manufacturers as a resultof the increase in laminated products manufactured by our self-owned factories in the year.
Revenue from trading of timber and wood products increased by 42.2% to approximatelyRMB362,672,000 during the year from approximately RMB254,957,000 in 2013. It was mainly due tothe significant increase in demand of our flooring products in the U.S..
– 25 –

Revenue from forestry management increased by 11.2% to approximately RMB8,668,000 during theyear from approximately RMB7,797,000 in 2013. It was mainly due to the increase in timber and woodproduct being harvested and manufactured under the forestry assets operation being sold in the year.
Cost of Sales
Cost of sales for manufacturing and sale of wood products consists primarily of raw materials costs,staff costs and overhead costs. The major raw materials used in our own manufacturing activities aretimber, veneers, fiberboards and plywood. Labor costs consist of salaries, wages and other benefits wepaid to our production staff. Overhead costs primarily include utilities, depreciation and others.
Cost of sales for trademark and distribution network consists primarily of the labour costs andtravelling expenses relating to our representatives who provide authorised manufacturers with onsitetechnical and logistics support and conduct quality control measures on their products.
Cost of sales for trading of timber and wood products consists primarily of the cost of timber and woodproducts purchased for trading.
Cost of sales for forestry management consists primarily of the cost of timber and wood products underthe forestry assets operations and harvesting cost.
Set forth below are the cost of sales by each business segments for the years indicated:
2014 2013 Growth rateRMB’000 RMB’000 %
Cost of SalesManufacturing and sale of wood products 1,029,705 766,245 34.4Trademark and distribution network 4,773 4,787 0.3Trading of timber and wood products 301,310 205,477 46.6Forestry management 23,874 11,842 101.6
Total 1,359,662 988,351 37.6
– 26 –

Gross Profit/(Loss) and Gross Profit/(Loss) Margin
Gross (loss)/profit is calculated by deducting cost of sales from revenue. The tables below shows thegross profit and gross profit/(loss) margin by each business segments during the years as indicated:
2014 2013 Growth rateRMB’000 RMB’000 %
Gross Profit/(Loss)Manufacture and sale of wood products 378,774 224,934 68.4Trademark and distribution network 194,693 230,229 (15.4)Trading of timber and wood products 61,362 49,480 24.0Forestry management (15,206) (4,045) 275.9
Total 619,623 500,598 23.8
2014 2013% %
Gross Profit/(Loss) MarginManufacture and sale of wood products 26.9 22.7Trademark and distribution network 97.6 98.0Trading of timber and wood products 16.9 19.4Forestry management (175.4) 51.9
Total 31.3 33.6
For the year ended 31 December 2014, the overall gross profit increased by 23.8% to approximatelyRMB619,623,000 from approximately RMB500,598,000 in 2013 and the gross profit margin decreasedto 31.3% from 33.6% in 2013.
The segment on manufacturing and sale of wood products contributed a gross profit of approximatelyRMB378,774,000 during the year, representing an increase of 68.4% from approximatelyRMB224,934,000 in 2013. The gross profit margin increased to 26.9% from 22.7% in 2013. Theincrease in gross profit was mainly attributable to the increase of the consumer demand on our brandedflooring products in the PRC and the increase in the sales of the laminated products manufactured byus which previously produced by our authorized manufacturers. The increase in gross profit margin wasmainly attributable to the economy of scales gained from simplifying the SKUs of wood flooringproducts and the improvement of margin on the other wood products.
– 27 –
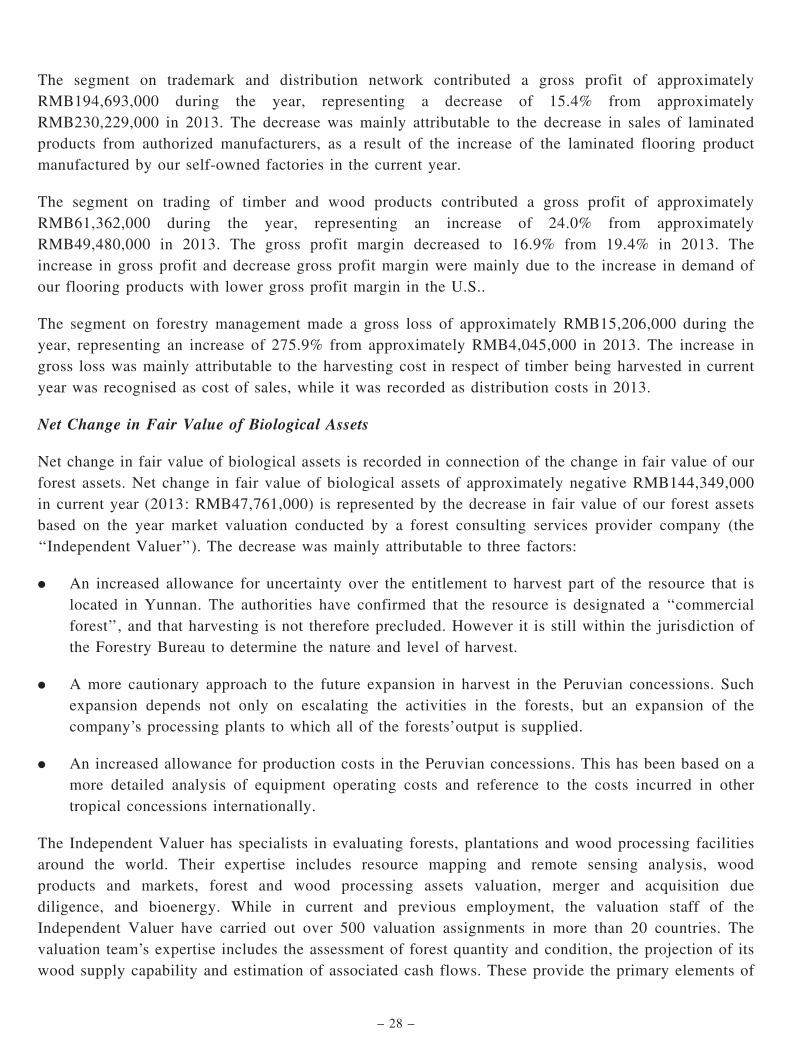
The segment on trademark and distribution network contributed a gross profit of approximatelyRMB194,693,000 during the year, representing a decrease of 15.4% from approximatelyRMB230,229,000 in 2013. The decrease was mainly attributable to the decrease in sales of laminatedproducts from authorized manufacturers, as a result of the increase of the laminated flooring productmanufactured by our self-owned factories in the current year.
The segment on trading of timber and wood products contributed a gross profit of approximatelyRMB61,362,000 during the year, representing an increase of 24.0% from approximatelyRMB49,480,000 in 2013. The gross profit margin decreased to 16.9% from 19.4% in 2013. Theincrease in gross profit and decrease gross profit margin were mainly due to the increase in demand ofour flooring products with lower gross profit margin in the U.S..
The segment on forestry management made a gross loss of approximately RMB15,206,000 during theyear, representing an increase of 275.9% from approximately RMB4,045,000 in 2013. The increase ingross loss was mainly attributable to the harvesting cost in respect of timber being harvested in currentyear was recognised as cost of sales, while it was recorded as distribution costs in 2013.
Net Change in Fair Value of Biological Assets
Net change in fair value of biological assets is recorded in connection of the change in fair value of ourforest assets. Net change in fair value of biological assets of approximately negative RMB144,349,000in current year (2013: RMB47,761,000) is represented by the decrease in fair value of our forest assetsbased on the year market valuation conducted by a forest consulting services provider company (the‘‘Independent Valuer’’). The decrease was mainly attributable to three factors:
. An increased allowance for uncertainty over the entitlement to harvest part of the resource that islocated in Yunnan. The authorities have confirmed that the resource is designated a ‘‘commercialforest’’, and that harvesting is not therefore precluded. However it is still within the jurisdiction ofthe Forestry Bureau to determine the nature and level of harvest.
. A more cautionary approach to the future expansion in harvest in the Peruvian concessions. Suchexpansion depends not only on escalating the activities in the forests, but an expansion of thecompany’s processing plants to which all of the forests’output is supplied.
. An increased allowance for production costs in the Peruvian concessions. This has been based on amore detailed analysis of equipment operating costs and reference to the costs incurred in othertropical concessions internationally.
The Independent Valuer has specialists in evaluating forests, plantations and wood processing facilitiesaround the world. Their expertise includes resource mapping and remote sensing analysis, woodproducts and markets, forest and wood processing assets valuation, merger and acquisition duediligence, and bioenergy. While in current and previous employment, the valuation staff of theIndependent Valuer have carried out over 500 valuation assignments in more than 20 countries. Thevaluation team’s expertise includes the assessment of forest quantity and condition, the projection of itswood supply capability and estimation of associated cash flows. These provide the primary elements of
– 28 –
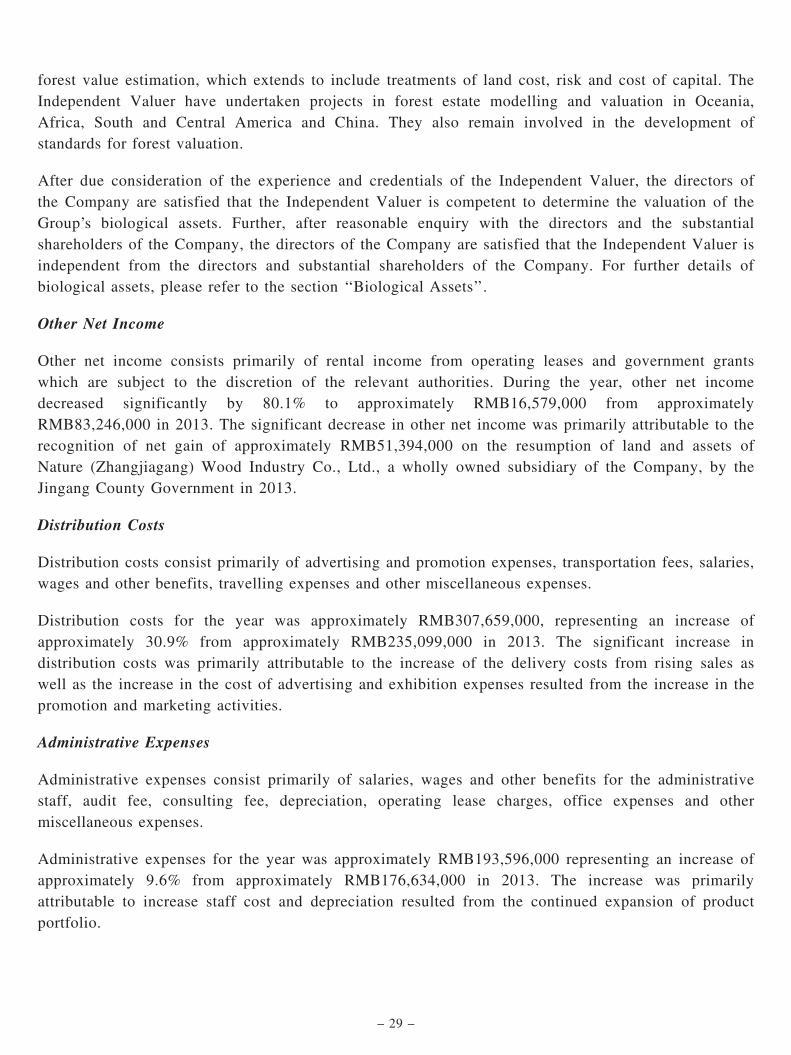
forest value estimation, which extends to include treatments of land cost, risk and cost of capital. TheIndependent Valuer have undertaken projects in forest estate modelling and valuation in Oceania,Africa, South and Central America and China. They also remain involved in the development ofstandards for forest valuation.
After due consideration of the experience and credentials of the Independent Valuer, the directors ofthe Company are satisfied that the Independent Valuer is competent to determine the valuation of theGroup’s biological assets. Further, after reasonable enquiry with the directors and the substantialshareholders of the Company, the directors of the Company are satisfied that the Independent Valuer isindependent from the directors and substantial shareholders of the Company. For further details ofbiological assets, please refer to the section ‘‘Biological Assets’’.
Other Net Income
Other net income consists primarily of rental income from operating leases and government grantswhich are subject to the discretion of the relevant authorities. During the year, other net incomedecreased significantly by 80.1% to approximately RMB16,579,000 from approximatelyRMB83,246,000 in 2013. The significant decrease in other net income was primarily attributable to therecognition of net gain of approximately RMB51,394,000 on the resumption of land and assets ofNature (Zhangjiagang) Wood Industry Co., Ltd., a wholly owned subsidiary of the Company, by theJingang County Government in 2013.
Distribution Costs
Distribution costs consist primarily of advertising and promotion expenses, transportation fees, salaries,wages and other benefits, travelling expenses and other miscellaneous expenses.
Distribution costs for the year was approximately RMB307,659,000, representing an increase ofapproximately 30.9% from approximately RMB235,099,000 in 2013. The significant increase indistribution costs was primarily attributable to the increase of the delivery costs from rising sales aswell as the increase in the cost of advertising and exhibition expenses resulted from the increase in thepromotion and marketing activities.
Administrative Expenses
Administrative expenses consist primarily of salaries, wages and other benefits for the administrativestaff, audit fee, consulting fee, depreciation, operating lease charges, office expenses and othermiscellaneous expenses.
Administrative expenses for the year was approximately RMB193,596,000 representing an increase ofapproximately 9.6% from approximately RMB176,634,000 in 2013. The increase was primarilyattributable to increase staff cost and depreciation resulted from the continued expansion of productportfolio.
– 29 –
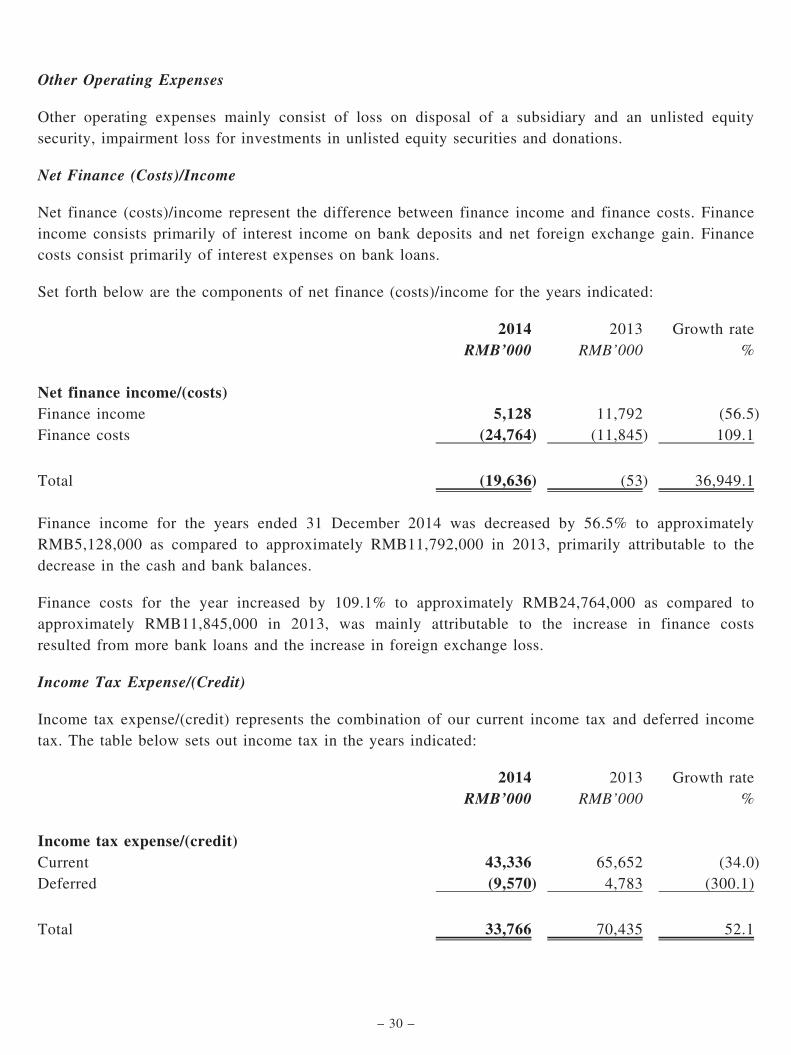
Other Operating Expenses
Other operating expenses mainly consist of loss on disposal of a subsidiary and an unlisted equitysecurity, impairment loss for investments in unlisted equity securities and donations.
Net Finance (Costs)/Income
Net finance (costs)/income represent the difference between finance income and finance costs. Financeincome consists primarily of interest income on bank deposits and net foreign exchange gain. Financecosts consist primarily of interest expenses on bank loans.
Set forth below are the components of net finance (costs)/income for the years indicated:
2014 2013 Growth rateRMB’000 RMB’000 %
Net finance income/(costs)Finance income 5,128 11,792 (56.5)Finance costs (24,764) (11,845) 109.1
Total (19,636) (53) 36,949.1
Finance income for the years ended 31 December 2014 was decreased by 56.5% to approximatelyRMB5,128,000 as compared to approximately RMB11,792,000 in 2013, primarily attributable to thedecrease in the cash and bank balances.
Finance costs for the year increased by 109.1% to approximately RMB24,764,000 as compared toapproximately RMB11,845,000 in 2013, was mainly attributable to the increase in finance costsresulted from more bank loans and the increase in foreign exchange loss.
Income Tax Expense/(Credit)
Income tax expense/(credit) represents the combination of our current income tax and deferred incometax. The table below sets out income tax in the years indicated:
2014 2013 Growth rateRMB’000 RMB’000 %
Income tax expense/(credit)Current 43,336 65,652 (34.0)Deferred (9,570) 4,783 (300.1)
Total 33,766 70,435 52.1
– 30 –
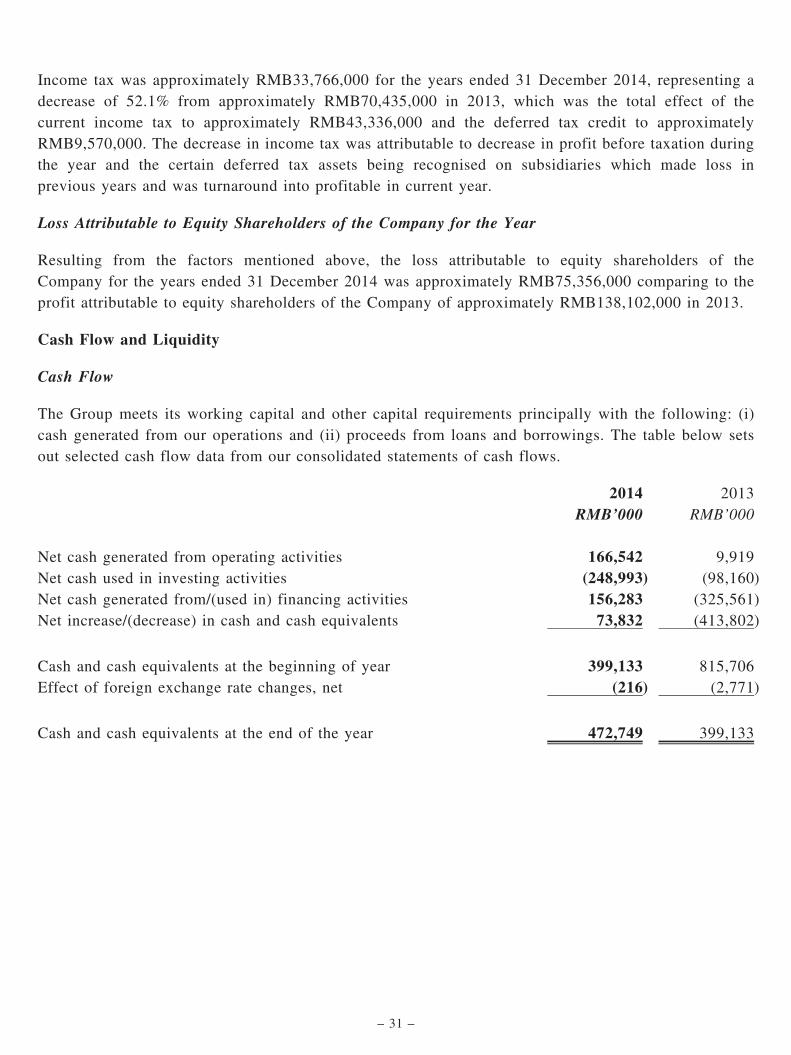
Income tax was approximately RMB33,766,000 for the years ended 31 December 2014, representing adecrease of 52.1% from approximately RMB70,435,000 in 2013, which was the total effect of thecurrent income tax to approximately RMB43,336,000 and the deferred tax credit to approximatelyRMB9,570,000. The decrease in income tax was attributable to decrease in profit before taxation duringthe year and the certain deferred tax assets being recognised on subsidiaries which made loss inprevious years and was turnaround into profitable in current year.
Loss Attributable to Equity Shareholders of the Company for the Year
Resulting from the factors mentioned above, the loss attributable to equity shareholders of theCompany for the years ended 31 December 2014 was approximately RMB75,356,000 comparing to theprofit attributable to equity shareholders of the Company of approximately RMB138,102,000 in 2013.
Cash Flow and Liquidity
Cash Flow
The Group meets its working capital and other capital requirements principally with the following: (i)cash generated from our operations and (ii) proceeds from loans and borrowings. The table below setsout selected cash flow data from our consolidated statements of cash flows.
2014 2013RMB’000 RMB’000
Net cash generated from operating activities 166,542 9,919Net cash used in investing activities (248,993) (98,160)Net cash generated from/(used in) financing activities 156,283 (325,561)Net increase/(decrease) in cash and cash equivalents 73,832 (413,802)
Cash and cash equivalents at the beginning of year 399,133 815,706Effect of foreign exchange rate changes, net (216) (2,771)
Cash and cash equivalents at the end of the year 472,749 399,133
– 31 –
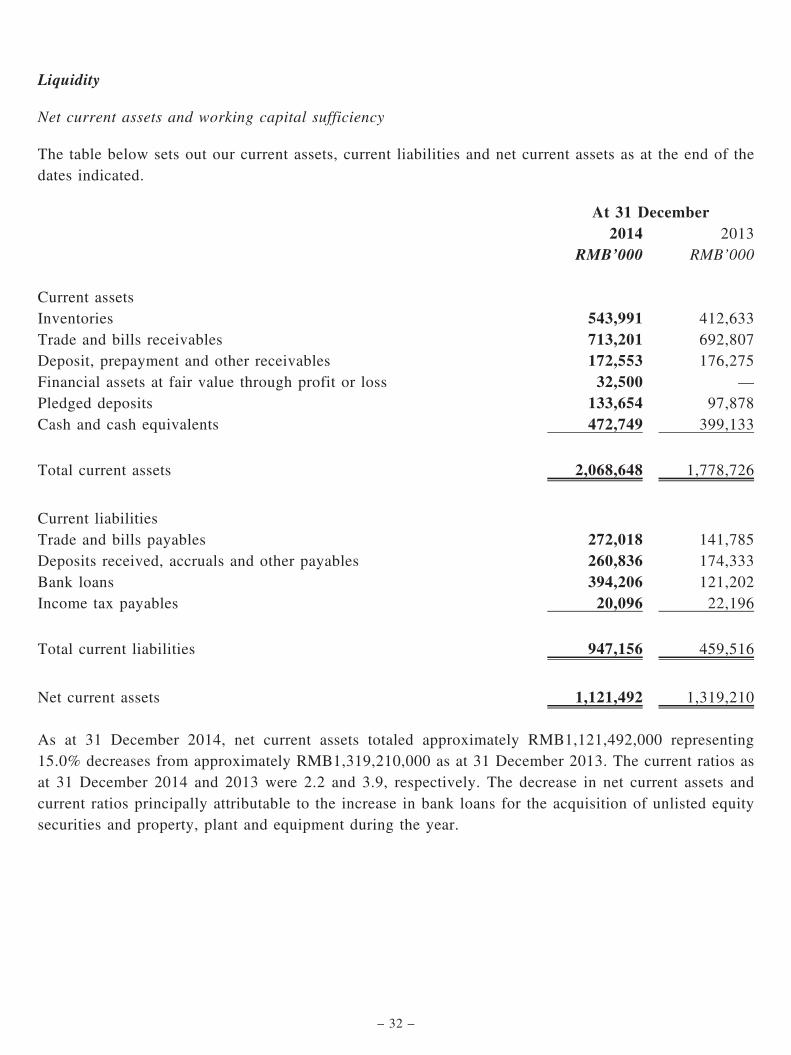
Liquidity
Net current assets and working capital sufficiency
The table below sets out our current assets, current liabilities and net current assets as at the end of thedates indicated.
At 31 December2014 2013
RMB’000 RMB’000
Current assetsInventories 543,991 412,633Trade and bills receivables 713,201 692,807Deposit, prepayment and other receivables 172,553 176,275Financial assets at fair value through profit or loss 32,500 —
Pledged deposits 133,654 97,878Cash and cash equivalents 472,749 399,133
Total current assets 2,068,648 1,778,726
Current liabilitiesTrade and bills payables 272,018 141,785Deposits received, accruals and other payables 260,836 174,333Bank loans 394,206 121,202Income tax payables 20,096 22,196
Total current liabilities 947,156 459,516
Net current assets 1,121,492 1,319,210
As at 31 December 2014, net current assets totaled approximately RMB1,121,492,000 representing15.0% decreases from approximately RMB1,319,210,000 as at 31 December 2013. The current ratios asat 31 December 2014 and 2013 were 2.2 and 3.9, respectively. The decrease in net current assets andcurrent ratios principally attributable to the increase in bank loans for the acquisition of unlisted equitysecurities and property, plant and equipment during the year.
– 32 –
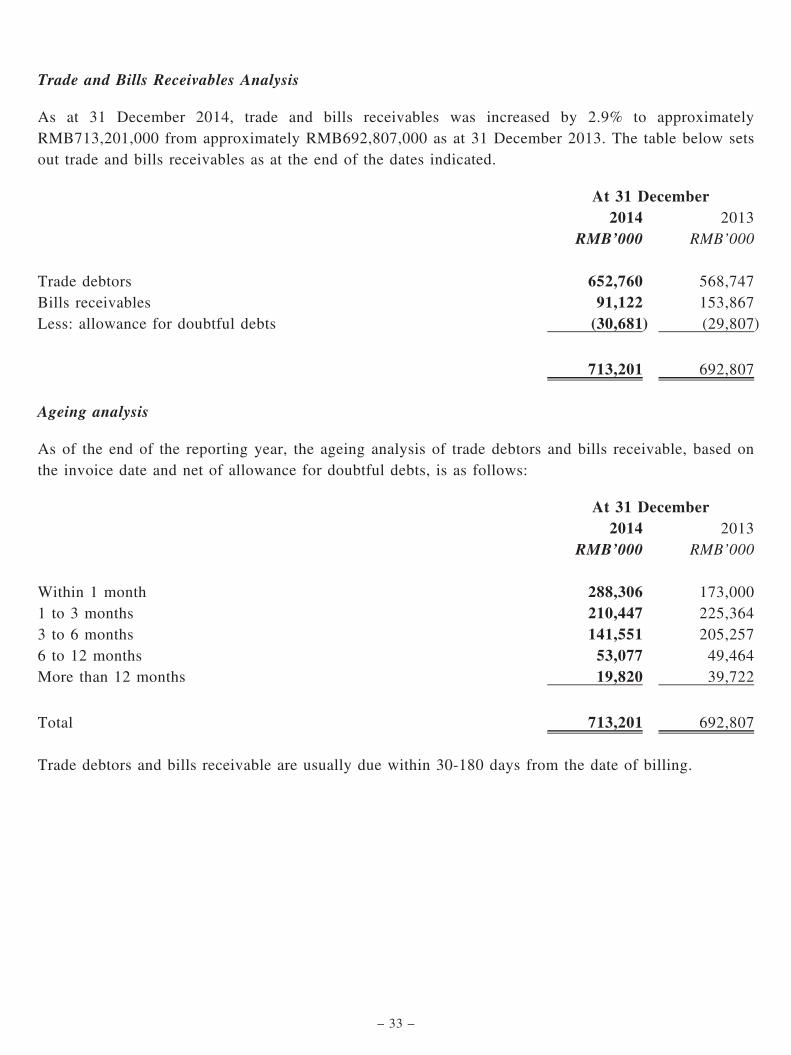
Trade and Bills Receivables Analysis
As at 31 December 2014, trade and bills receivables was increased by 2.9% to approximatelyRMB713,201,000 from approximately RMB692,807,000 as at 31 December 2013. The table below setsout trade and bills receivables as at the end of the dates indicated.
At 31 December2014 2013
RMB’000 RMB’000
Trade debtors 652,760 568,747Bills receivables 91,122 153,867Less: allowance for doubtful debts (30,681) (29,807)
713,201 692,807
Ageing analysis
As of the end of the reporting year, the ageing analysis of trade debtors and bills receivable, based onthe invoice date and net of allowance for doubtful debts, is as follows:
At 31 December2014 2013
RMB’000 RMB’000
Within 1 month 288,306 173,0001 to 3 months 210,447 225,3643 to 6 months 141,551 205,2576 to 12 months 53,077 49,464More than 12 months 19,820 39,722
Total 713,201 692,807
Trade debtors and bills receivable are usually due within 30-180 days from the date of billing.
– 33 –
Biological Assets
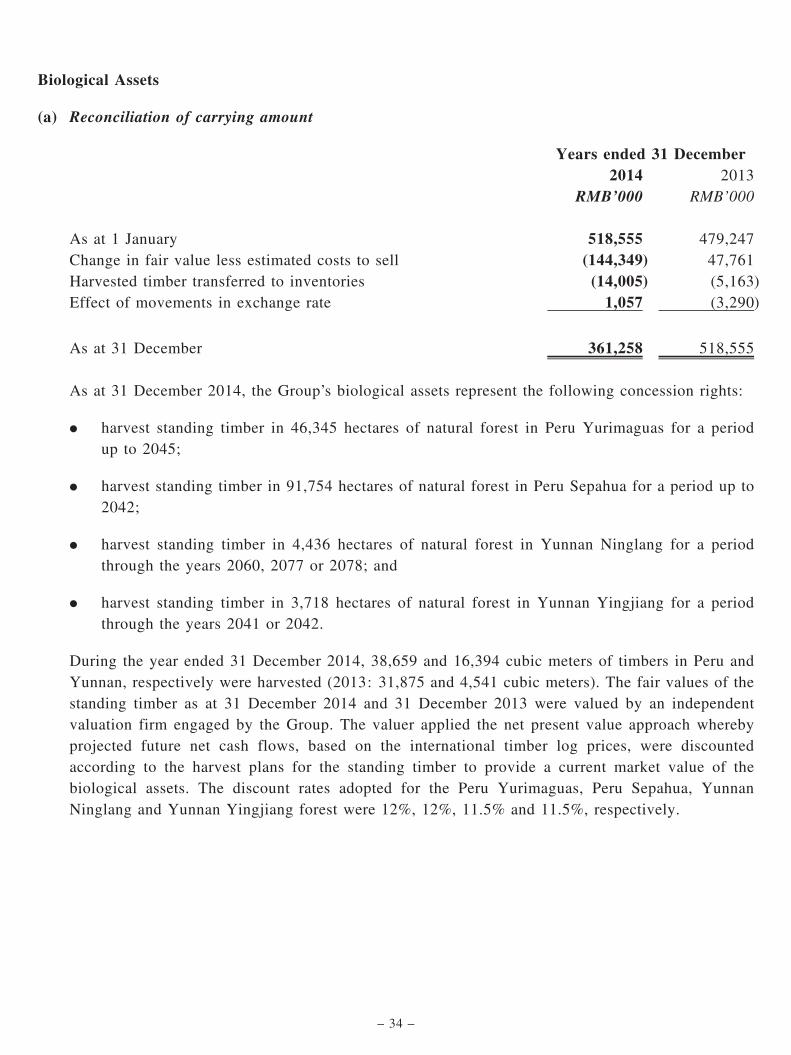
(a) Reconciliation of carrying amount
Years ended 31 December2014 2013
RMB’000 RMB’000
As at 1 January 518,555 479,247Change in fair value less estimated costs to sell (144,349) 47,761Harvested timber transferred to inventories (14,005) (5,163)Effect of movements in exchange rate 1,057 (3,290)
As at 31 December 361,258 518,555
As at 31 December 2014, the Group’s biological assets represent the following concession rights:
. harvest standing timber in 46,345 hectares of natural forest in Peru Yurimaguas for a periodup to 2045;
. harvest standing timber in 91,754 hectares of natural forest in Peru Sepahua for a period up to2042;
. harvest standing timber in 4,436 hectares of natural forest in Yunnan Ninglang for a periodthrough the years 2060, 2077 or 2078; and
. harvest standing timber in 3,718 hectares of natural forest in Yunnan Yingjiang for a periodthrough the years 2041 or 2042.
During the year ended 31 December 2014, 38,659 and 16,394 cubic meters of timbers in Peru andYunnan, respectively were harvested (2013: 31,875 and 4,541 cubic meters). The fair values of thestanding timber as at 31 December 2014 and 31 December 2013 were valued by an independentvaluation firm engaged by the Group. The valuer applied the net present value approach wherebyprojected future net cash flows, based on the international timber log prices, were discountedaccording to the harvest plans for the standing timber to provide a current market value of thebiological assets. The discount rates adopted for the Peru Yurimaguas, Peru Sepahua, YunnanNinglang and Yunnan Yingjiang forest were 12%, 12%, 11.5% and 11.5%, respectively.
– 34 –

(b) Measurement of fair values
(i) Fair value hierarchy
The following table presents the fair value of the Group’s biological assets measured at theend of the reporting period on a recurring basis, categorised into the three-level fair valuehierarchy as defined in IFRS 13, Fair value measurement. The fair value measurement forstanding timber has been categorised as Level 3 fair value (fair value measured usingsignificant unobservable inputs). The fair value of the standing timber as at the end of eachreporting period and the fair value of harvested timber transferred to inventories during theperiod were determined by the valuer engaged by the Group. The valuation reports withanalysis of changes in fair value measurement were prepared by the valuer and were reviewedand approved by the management.
(ii) Level 3 fair values
The following table shows a reconciliation from the opening balances to the closing balancesfor level 3 fair values:
Standing Timber2014 2013
RMB’000 RMB’000
As at 1 January 518,555 479,247Harvested timber transferred to inventories (14,005) (5,163)Included in ‘‘Net change in fair value ofbiological assets’’— Change in fair value (unrealised) (144,349) 47,761
Included in other comprehensive income— Effect of movements in exchange rate 1,057 (3,290)
As at 31 December 361,258 518,555
During the years ended 31 December 2014 and 2013, there were no transfers between Level 1and Level 2, or transfers into or out of Level 3. The Group’s policy is to recognise transfersbetween levels of fair value hierarchy as at the end of the reporting period in which theyoccur.
– 35 –
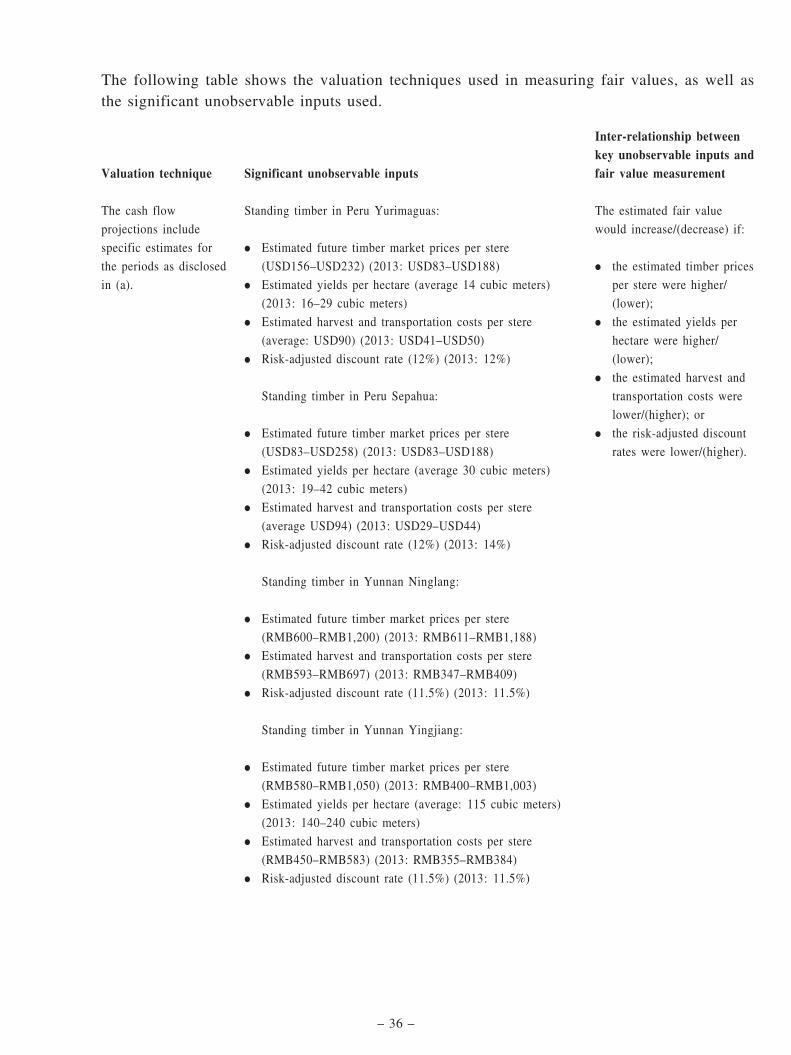
The following table shows the valuation techniques used in measuring fair values, as well asthe significant unobservable inputs used.
Valuation technique Significant unobservable inputs
Inter-relationship betweenkey unobservable inputs andfair value measurement
The cash flow
projections include
specific estimates for
the periods as disclosed
in (a).
Standing timber in Peru Yurimaguas:
. Estimated future timber market prices per stere
(USD156–USD232) (2013: USD83–USD188)
. Estimated yields per hectare (average 14 cubic meters)
(2013: 16–29 cubic meters)
. Estimated harvest and transportation costs per stere
(average: USD90) (2013: USD41–USD50)
. Risk-adjusted discount rate (12%) (2013: 12%)
Standing timber in Peru Sepahua:
. Estimated future timber market prices per stere
(USD83–USD258) (2013: USD83–USD188)
. Estimated yields per hectare (average 30 cubic meters)
(2013: 19–42 cubic meters)
. Estimated harvest and transportation costs per stere
(average USD94) (2013: USD29–USD44)
. Risk-adjusted discount rate (12%) (2013: 14%)
Standing timber in Yunnan Ninglang:
. Estimated future timber market prices per stere
(RMB600–RMB1,200) (2013: RMB611–RMB1,188)
. Estimated harvest and transportation costs per stere
(RMB593–RMB697) (2013: RMB347–RMB409)
. Risk-adjusted discount rate (11.5%) (2013: 11.5%)
Standing timber in Yunnan Yingjiang:
. Estimated future timber market prices per stere
(RMB580–RMB1,050) (2013: RMB400–RMB1,003)
. Estimated yields per hectare (average: 115 cubic meters)
(2013: 140–240 cubic meters)
. Estimated harvest and transportation costs per stere
(RMB450–RMB583) (2013: RMB355–RMB384)
. Risk-adjusted discount rate (11.5%) (2013: 11.5%)
The estimated fair value
would increase/(decrease) if:
. the estimated timber prices
per stere were higher/
(lower);
. the estimated yields per
hectare were higher/
(lower);
. the estimated harvest and
transportation costs were
lower/(higher); or
. the risk-adjusted discount
rates were lower/(higher).
– 36 –

(c) Legal rights with respect of the Group’s biological assets in China and Peru
The PRC laws recognize the following four types of rights with respect of forests in China:
Type of right Descriptions Primary permitted activities
Forestry landownership right
Right to own the forestry land foruse as commercial tree plantations
N/A
Forestry land use right Right to use the forestry land for useas commercial tree plantations
Tree plantation
Forestry tree ownershipright
Right to own the trees on acommercial tree plantation
Tree exploitation
Forestry tree use right Right to use the produce(e.g. fruits) of the trees
Own and use the fruits andproducts extracted from trees
Pursuant of the relevant forestry resources transfer agreements, the Group has obtained the forestryland use right, forestry tree ownership rights and forestry tree use right for its Yunnan forests.Such rights are valid for a period through 2060, 2077 or 2078 and 2041 or 2042 respectively. Withrespect to the forestry land ownership right, all of the forestry land in China is either owned by theState or owned by collective organisations, and is not transferable.
Peruvian laws recognise the following four types of rights with respect to forestry concession withtimber purposes in Peru:
Type of right Descriptions Primary permitted activities
Right to utilize forestproducts
Forest concessions allow the use offorest resources, processing andmarketing
Tree exploitation
Right to own theextracted resources
Right to own the fruits and productsextracted
Own and use the fruits andproducts extracted from trees
Right to use the land Right to use the lands located withinthe area under concession
Tree plantation
Right to use otherresources
Right to use and benefit from thewildlife and wild flora existingwithin the area under concession
Conduct ecotourism activities,utilize carbon creditsgenerated by forests
Under the relevant concession agreements, the Group has obtained the right to sustainable use offorestry timber resources, the right to own the resources and right to use the land for its Peruforests (the ‘‘Rights’’), as long as such use is compatible with the sustainable use of the forestry
– 37 –

resources. The Group has obtained approval from Peru government for its current annualoperational plan. The Rights in respect to the two parcels of forest land located in Loreto Province,Peru and Ucayali Province, Peru are valid through 2045 and 2042 respectively, and can beexercised within the concession area in accordance with the relevant concession agreements, thegeneral forestry management plan and the annual operational plan approved by the relevantforestry authorities.
The Group’s rights in respect of its Yunnan forestry are subject to various regulatory restrictions.For example, the Group is allowed to use the forestry land for related purposes includingplantation, cultivation and ecological tourism etc. In addition, the Group is obligated to complywith regulations relating to logging activities and reforestation. For example, the Group shall applyfor logging permit before conducting any logging activities. For the year ended 31 December 2014,the Group had obtained logging permit for its forestry land located in Yingjiang, Yunnan. Suchpermit is valid through December 2014 and the Group had applied for the renewal of loggingpermit for the year 2015. With respect to its forestry land in Peru, the Group’s entitlement of theRights is subject to the annual operational plan, which must approved by the government beforethe start of the operating year covered the relevant plan. The Group has obtained approval fromPeru government for its current annual operational plan.
(d) The selection of technique on valuations and work done
The manner in which assets are represented in a company’s accounts is guided by a set ofstandards that individually relate to the various asset types. The standard which is specificallyrelevant to the forest assets is HK IAS41. This has been developed for the reporting of biologicalassets.
At the original release of the standard, it provided guidance on the methods of valuation thatshould be employed. In a subsequent initiative, the International Accounting Standards Board hasprepared International Financial Reporting Standard 13 (Fair Value). It is intended that this willprovide the over-arching specification on how fair value is to be determined across multiple assetclasses.
IFRS13’s requirements are largely consistent with wider sets of standards prepared by theadministrative bodies within the valuation profession.
It is the universally promulgated view that the valuer should begin by considering the three mainmethods of valuation — Comparable Sales, the Expectation method and the Cost approach. Inpractice, limitations become apparent in applying either the first of these or the third. It hascorrespondingly become most common practice to narrow the method of valuing large forestholdings to the Expectation Approach. This involves developing cashflow projections for thesubject resources and then discounting these at an appropriate cost of capital (the ‘‘discount rate’’).The procedure provides a net present value (NPV) for the resource.
– 38 –
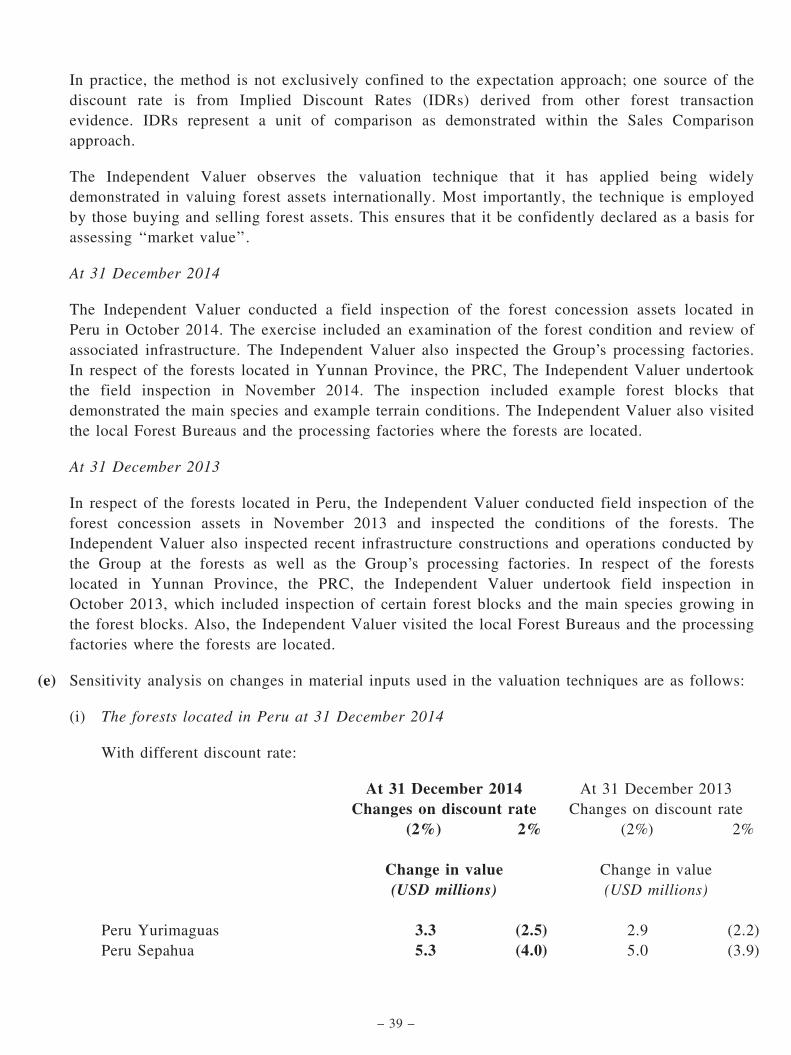
In practice, the method is not exclusively confined to the expectation approach; one source of thediscount rate is from Implied Discount Rates (IDRs) derived from other forest transactionevidence. IDRs represent a unit of comparison as demonstrated within the Sales Comparisonapproach.
The Independent Valuer observes the valuation technique that it has applied being widelydemonstrated in valuing forest assets internationally. Most importantly, the technique is employedby those buying and selling forest assets. This ensures that it be confidently declared as a basis forassessing ‘‘market value’’.
At 31 December 2014
The Independent Valuer conducted a field inspection of the forest concession assets located inPeru in October 2014. The exercise included an examination of the forest condition and review ofassociated infrastructure. The Independent Valuer also inspected the Group’s processing factories.In respect of the forests located in Yunnan Province, the PRC, The Independent Valuer undertookthe field inspection in November 2014. The inspection included example forest blocks thatdemonstrated the main species and example terrain conditions. The Independent Valuer also visitedthe local Forest Bureaus and the processing factories where the forests are located.
At 31 December 2013
In respect of the forests located in Peru, the Independent Valuer conducted field inspection of theforest concession assets in November 2013 and inspected the conditions of the forests. TheIndependent Valuer also inspected recent infrastructure constructions and operations conducted bythe Group at the forests as well as the Group’s processing factories. In respect of the forestslocated in Yunnan Province, the PRC, the Independent Valuer undertook field inspection inOctober 2013, which included inspection of certain forest blocks and the main species growing inthe forest blocks. Also, the Independent Valuer visited the local Forest Bureaus and the processingfactories where the forests are located.
(e) Sensitivity analysis on changes in material inputs used in the valuation techniques are as follows:
(i) The forests located in Peru at 31 December 2014
With different discount rate:
At 31 December 2014Changes on discount rate
At 31 December 2013Changes on discount rate
(2%) 2% (2%) 2%
Change in value Change in value(USD millions) (USD millions)
Peru Yurimaguas 3.3 (2.5) 2.9 (2.2)Peru Sepahua 5.3 (4.0) 5.0 (3.9)
– 39 –
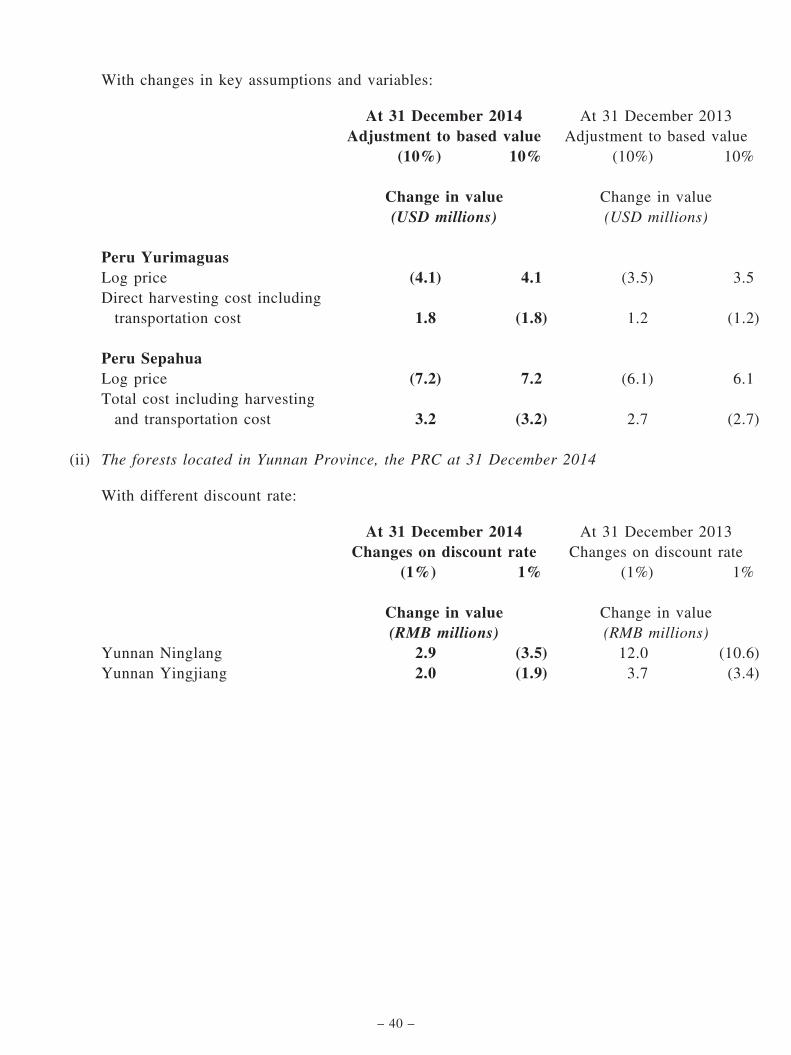
With changes in key assumptions and variables:
At 31 December 2014 At 31 December 2013Adjustment to based value Adjustment to based value
(10%) 10% (10%) 10%
Change in value Change in value(USD millions) (USD millions)
Peru YurimaguasLog price (4.1) 4.1 (3.5) 3.5Direct harvesting cost includingtransportation cost 1.8 (1.8) 1.2 (1.2)
Peru SepahuaLog price (7.2) 7.2 (6.1) 6.1Total cost including harvestingand transportation cost 3.2 (3.2) 2.7 (2.7)
(ii) The forests located in Yunnan Province, the PRC at 31 December 2014
With different discount rate:
At 31 December 2014 At 31 December 2013Changes on discount rate Changes on discount rate
(1%) 1% (1%) 1%
Change in value Change in value(RMB millions) (RMB millions)
Yunnan Ninglang 2.9 (3.5) 12.0 (10.6)Yunnan Yingjiang 2.0 (1.9) 3.7 (3.4)
– 40 –
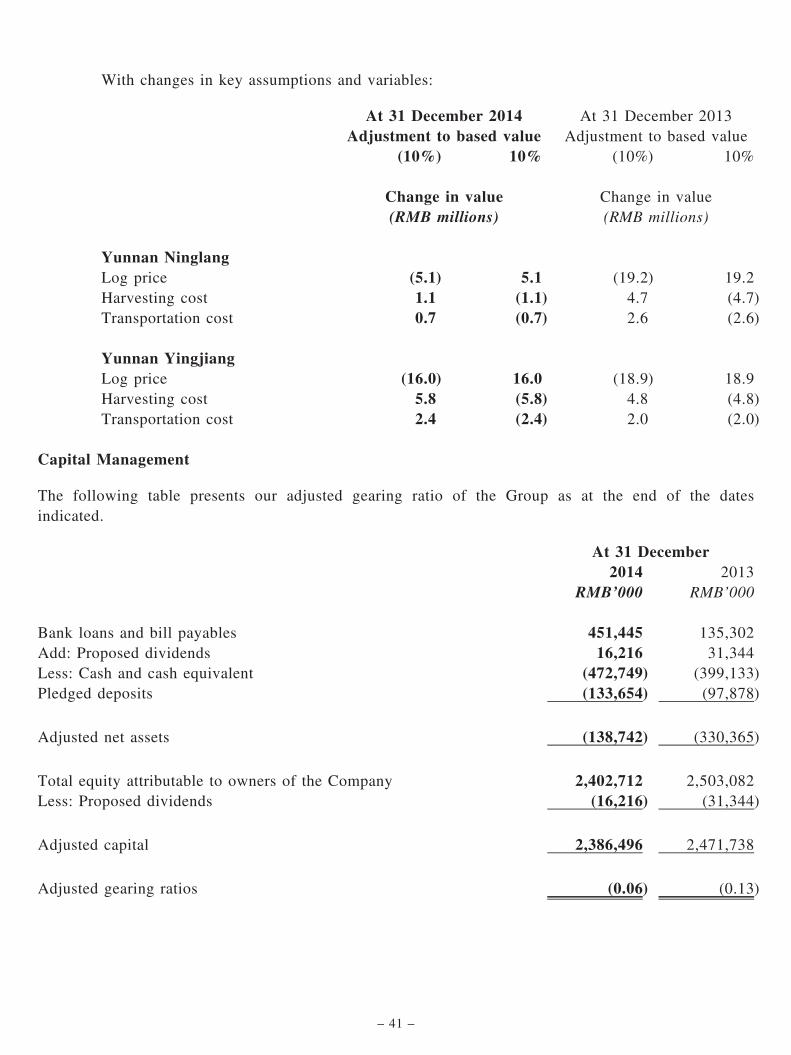
With changes in key assumptions and variables:
At 31 December 2014 At 31 December 2013Adjustment to based value Adjustment to based value
(10%) 10% (10%) 10%
Change in value Change in value(RMB millions) (RMB millions)
Yunnan NinglangLog price (5.1) 5.1 (19.2) 19.2Harvesting cost 1.1 (1.1) 4.7 (4.7)Transportation cost 0.7 (0.7) 2.6 (2.6)
Yunnan YingjiangLog price (16.0) 16.0 (18.9) 18.9Harvesting cost 5.8 (5.8) 4.8 (4.8)Transportation cost 2.4 (2.4) 2.0 (2.0)
Capital Management
The following table presents our adjusted gearing ratio of the Group as at the end of the datesindicated.
At 31 December2014 2013
RMB’000 RMB’000
Bank loans and bill payables 451,445 135,302Add: Proposed dividends 16,216 31,344Less: Cash and cash equivalent (472,749) (399,133)Pledged deposits (133,654) (97,878)
Adjusted net assets (138,742) (330,365)
Total equity attributable to owners of the Company 2,402,712 2,503,082Less: Proposed dividends (16,216) (31,344)
Adjusted capital 2,386,496 2,471,738
Adjusted gearing ratios (0.06) (0.13)
– 41 –

Our adjusted gearing ratios, which are derived by dividing adjusted net debt/(assets) by adjusted capitalattributable to owners of the Company, were negative 0.06 and negative 0.13 as at 31 December 2014and 31 December 2013, respectively. Adjusted net debt/(assets) is defined as total debt which includesbills payable, interest bearing loans and borrowings and add proposed dividends and less cash and cashequivalents and pledged deposits.
Capital Expenditure
Our capital expenditures primarily relate to purchases of property, plant and equipment, leaseprepayments, biological assets and intangible assets. Set forth below is our capital expenditure for theyear indicated:
2014 2013RMB’000 RMB’000
Property, plant and equipment 174,031 225,633Lease prepayment 65,077 10,299Unlisted equity securities 31,077 —
Intangible assets 7,085 893
Total 277,270 236,825
Bank Loans
(a) An analysis of secured and unsecured bank loans is as follows:
2014 2013RMB’000 RMB’000
Current:— secured (note (i)) 258,787 112,454— unsecured 135,419 8,748
394,206 121,202
Non-current:— secured (note (i)) 9,000 —
403,206 121,202
– 42 –

Notes:
(i) At the end of the reporting year, secured bank loans were secured by the following assets of the Group:
At December2014 2013
RMB’000 RMB’000
Pledged deposits 73,000 73,000
Property, plant and equipment 22,162 —
Lease prepayments 71,775 —
Trade receivables and bills receivable 205,800 13,000
Financial assets at fair value through profit or loss 32,500 —
405,237 86,000
(ii) As at 31 December 2014 and 2013, no bank loan was subject to the fulfillment of covenants.
(iii) The unutilized banking facilities as at 31 December 2014 amounted to RMB485,733,000 (31 December 2013:
RMB231,274,000).
(b) The following table details the interest rate profile of the Group’s total borrowings at the end ofthe reporting year:
2014 2013Effective
interest rateCarryingamount
Effectiveinterest rate
Carryingamount
% RMB’000 % RMB’000
Variable rate instrumentsBank loans 2.18% 162,206 2.24% 108,202
Fixed rate instrumentsBank loans 5.50% 241,000 4.25% 13,000
403,206 121,202
– 43 –
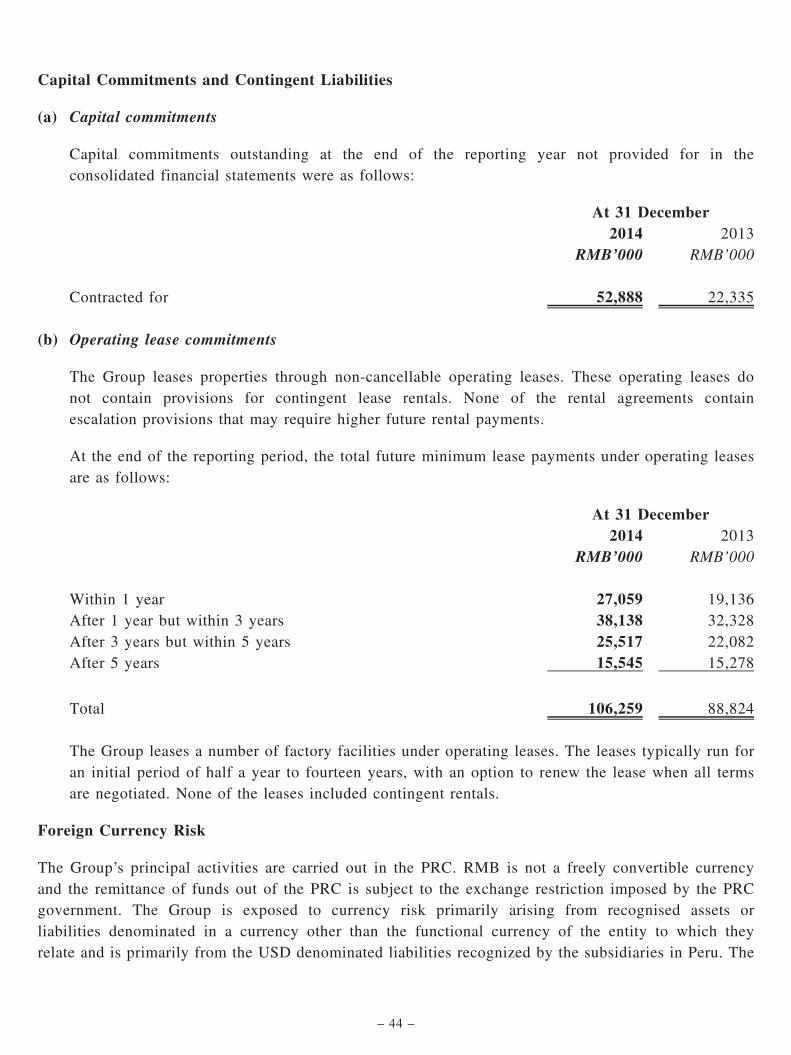
Capital Commitments and Contingent Liabilities
(a) Capital commitments
Capital commitments outstanding at the end of the reporting year not provided for in theconsolidated financial statements were as follows:
At 31 December2014 2013
RMB’000 RMB’000
Contracted for 52,888 22,335
(b) Operating lease commitments
The Group leases properties through non-cancellable operating leases. These operating leases donot contain provisions for contingent lease rentals. None of the rental agreements containescalation provisions that may require higher future rental payments.
At the end of the reporting period, the total future minimum lease payments under operating leasesare as follows:
At 31 December2014 2013
RMB’000 RMB’000
Within 1 year 27,059 19,136After 1 year but within 3 years 38,138 32,328After 3 years but within 5 years 25,517 22,082After 5 years 15,545 15,278
Total 106,259 88,824
The Group leases a number of factory facilities under operating leases. The leases typically run foran initial period of half a year to fourteen years, with an option to renew the lease when all termsare negotiated. None of the leases included contingent rentals.
Foreign Currency Risk
The Group’s principal activities are carried out in the PRC. RMB is not a freely convertible currencyand the remittance of funds out of the PRC is subject to the exchange restriction imposed by the PRCgovernment. The Group is exposed to currency risk primarily arising from recognised assets orliabilities denominated in a currency other than the functional currency of the entity to which theyrelate and is primarily from the USD denominated liabilities recognized by the subsidiaries in Peru. The
– 44 –
currencies giving rise to this risk are primarily United States Dollars (‘‘US$’’), Hong Kong Dollars(‘‘HK$’’), Macau Pataca (‘‘MOP’’), Peruvian Nuevo Sol (‘‘PEN’’) and Euro (‘‘EUR’’). As at 31December 2014, the cash and cash equivalents held by the Group were primarily in RMB, HK$ andUS$, representing 78.8%, 4.0% and 15.0% (2013: 81.9%, 7.5% and 9.2%) of total amounts,respectively. The rest of the amounts were held in MOP, PEN and EUR. On the other hand, as at 31December 2014, our bank loans were in RMB, HK$, US$ and EUR, representing 62.0%, 36.9%, 0.2%and 0.9% (2013: 11.6%, 82.5%, Nil and 5.9%) of total amount, respectively. The Group may enter intoforward foreign exchange contracts to hedge against the exchange rate fluctuation when the exposure issignificant.
Employees
As at 31 December 2014, the Group had 3,504 employees (at 31 December 2013: 2,502). Relevantstaff cost for the years ended 31 December 2014 was approximately RMB234,548,000 (including shareoption expenses of approximately RMB16,885,000) while our staff cost was approximatelyRMB185,772,000 (including share option expenses of approximately RMB19,634,000) for 2013. TheGroup will regularly review remuneration and benefits of its employees accordingly to the relevantmarket practice and individual performance of the employees. In addition to basic salary, employees areentitled to other benefits including social insurance contribution, employee provident fund schemes andshare option schemes.
Material Acquisitions and Disposals of Subsidiaries
The Group did not have any material acquisition or disposal of subsidiaries or associated companies forthe year ended 31 December 2014.
Subsequent Events
On 30 March 2015, the Company entered into an investment agreement, pursuant to which theCompany has conditionally agreed to subscribe for 5,500,000 new shares in the share capital of ALNOAG (‘‘ALNO’’) at a total subscription price of EUR5,775,000 (equivalent to approximatelyRMB38,635,000) (the ‘‘Subscription’’). On the same date, the Company entered into a share purchaseagreement pursuant to which the Company has conditionally agreed to purchase 1,375,000 existingshares in the issued share capital of ALNO from Whirlpool Germany GmbH (‘‘Whirlpool’’), the largestshareholder of ALNO, at a total consideration of EUR412,500 (equivalent to approximatelyRMB2,760,000) (the ‘‘Acquisition’’).
The ALNO Group is listed on the Frankfurt Stock Exchange and is principally engaged in thedevelopment, building and sale of kitchen furniture and accessories. With its headquarters located inPfullendorf, Germany, the ALNO Group has about 6,000 commercial partners in 64 countries.
Upon completion of the the Subscription and Acquisition, the Company will hold an aggregate of6,875,000 Shares, representing approximately 9.09% of the enlarged issued share capital of ALNO, andwill become the third largest shareholder of ALNO. Whirlpool will remain the largest shareholder ofALNO.
– 45 –

For details please refer to the announcement of the Company dated 30 March 2015.
Use of Proceeds from the Global Offering
In May 2011, the Company’s shares were listed on the main board of the Stock Exchange. A total of388,265,000 shares were issued at HK$2.95 per share for a total of approximately HK$1,145 million.The net proceeds raised from the abovementioned global offering of the Company, which areapproximately RMB873.5 million, are and will be used in accordance with the purposes disclosed inthe prospectus of the Company dated 16 May 2011. During the year from the date of listing of theCompany’s shares on the Stock Exchange to 31 December 2014, approximately RMB754.4 millionraised from the global offering of the Company was used for the purposes and approximately in theamounts set out below:
(a) Approximately RMB197.1 million was used for strategic merger and acquisition;
(b) Approximately RMB174.7 million was used for the development of existing brands;
(c) Approximately RMB87.3 million was used for working capital and general corporate purpose;
(d) Approximately RMB76.9 million was used for strengthen the distribution network;
(e) Approximately RMB131.1 million was used for the expansion of existing production facilities; and
(f) Approximately RMB87.3 million was used for the expansion of product portfolio.
As at 31 December 2014, approximately RMB119.1 million raised from the global offering remainsunused.
Future Plans for Material Investments
Save for the Subscription and the Acquisition as mentioned in the Section headed ‘‘Subsequent Events’’above, the Group is also actively seeking other acquisition opportunities to expand its internationalpresence and to further strengthen its products offering in the household products market. As of thedate hereof, no other agreements have been entered into by the Group in relation to any suchacquisitions.
– 46 –

PURCHASES, SALE AND REDEMPTION OF LISTED SECURITIES
During the year ended 31 December 2014, the Company repurchased 13,586,000 shares of theCompany on the Stock Exchange at an aggregate consideration of HK$19,761,261.10 pursuant to theshare repurchase mandate approved by the shareholders of the Company at the annual general meetingheld on 28 May 2013. Details of the repurchases are summarised as follows:
Date of repurchasePrice per share
Number ofordinaryshares of
USD0.001 eachTotal
considerationHighest LowestHKD HKD HKD
4 April 2014 1.27 1.27 70,000 88,900.008 April 2014 1.31 1.31 777,000 1,017,870.009 April 2014 1.34 1.34 454,000 608,360.0010 April 2014 1.37 1.36 293,000 401,292.8011 April 2014 1.39 1.39 783,000 1,088,370.0014 April 2014 1.41 1.38 651,000 916,217.4015 April 2014 1.43 1.43 501,000 716,430.0016 April 2014 1.45 1.40 2,716,000 3,877,904.8017 April 2014 1.48 1.44 800,000 1,169,600.0022 April 2014 1.50 1.45 1,000,000 1,480,800.0023 April 2014 1.52 1.50 2,242,000 3,395,060.6024 April 2014 1.54 1.52 699,000 1,072,615.5025 April 2014 1.55 1.49 1,000,000 1,527,900.0028 April 2014 1.55 1.52 500,000 770,250.0029 April 2014 1.52 1.45 500,000 751,650.002 May 2014 1.48 1.43 600,000 878,040.00
Total: 13,586,000 19,761,261.10
FINAL DIVIDEND
The Board recommends the declaration and payment of a final dividend of HK1.4 cents out of the sharepremium account of the Company, the amount standing to the credit of which was RMB1,126,254,000as at 31 December 2014 based on the audited consolidated financial statements of the Company as atthat date (the ‘‘Share Premium Account’’), per ordinary share for the year ended 31 December 2014.
– 47 –
The payment of the final dividend out of the Share Premium Account is conditional upon thesatisfaction of the following conditions:
(a) the passing of an ordinary resolution by the Shareholders declaring and approving the payment ofthe final dividend out of the Share Premium Account pursuant to Article 134 of the Articles ofAssociation; and
(b) the Directors being satisfied that there are no reasonable grounds for believing that the Companyis, immediately following the date on which the final dividend is paid, unable to pay its debts asthey fall due in the ordinary course of business.
Subject to the fulfilment of the above conditions, it is expected that the final dividend will be paid incash on or about 16 June 2015 to the shareholders whose names appear on the register of members ofthe Company at close of business on 9 June 2015, being the record date for determination ofentitlements to the final dividend.
The conditions set out above cannot be waived. If the conditions set out above are not satisfied, thefinal dividend will not be paid.
REASONS FOR AND EFFECT OF THE PAYMENT OF FINAL DIVIDEND OUT OF SHAREPREMIUM ACCOUNT
As the business and operations of the Group have generated positive earnings and cash flow, the Boardconsiders it appropriate to distribute the final dividend in recognition of Shareholders’ support.
The Company is a holding company and a significant part of the Group’s business is carried outthrough operating subsidiaries of the Company at which level earnings are retained. As such, theCompany may not have sufficient retained earnings to pay the final dividend at the holding companylevel. In addition, despite the fact that the Company recorded a loss for the year ended 31 December2014, the loss was mainly due to recognition of the net decrease in fair value of the Group’s biologicalassets which is non-cash in nature and has no effect on the cash flow of the Group.
Having taken into account a number of factors including cash flow and financial condition of theCompany, the Board considers it appropriate and proposes that final dividend be paid out of theCompany’s Share Premium Account in accordance with Article 134 of the Articles of Association andthe Cayman Companies Law. The Board considers such an arrangement to be in the interests of theCompany and its Shareholders as a whole.
The Board believes that the payment of the final dividend will not have any material adverse effect onthe financial position of the Group and does not involve any reduction in the authorized or issued sharecapital of the Company or reduction in the nominal value of the Shares or result in any change in thetrading arrangements in respect of the Shares.
– 48 –
CLOSURE OF REGISTER OF MEMBERS
The register of members of the Company will be closed from 5 June 2015 to 9 June 2015 (both daysinclusive), during which period no transfer of shares in the Company will be effected. In order toqualify for the proposed 2014 final dividend, all transfers, accompanied by the relevant sharecertificates, must be lodged with the Company’s Hong Kong branch share registrar and transfer office,Computershare Hong Kong Investor Services Limited, Shops 1712–1716, 17th Floor, Hopewell Centre,183 Queen’s Road East, Wan Chai, Hong Kong, not later than 4:30 p.m. on 4 June 2015. The 2014final dividend is subject to the approval of shareholders at the forthcoming annual general meeting, andif approved, will be payable on or about 16 June 2015 to shareholders on the register of members ofthe Company on 9 June 2015. A circular containing further information about the final dividend andthe notice of the forthcoming annual general meeting will be despatched to the shareholders of theCompany as soon as practicable.
CORPORATE GOVERNANCE
The Company is committed to achieving high standards of corporate governance by focusing onprinciples of integrity, accountability, transparency, independence, responsibility and fairness. TheCompany has developed and implemented sound governance policies and measures. The Board willcontinue to review and monitor the corporate governance of the Company with reference to theCorporate Governance Code (the ‘‘Code’’) set out in Appendix 14 to the Rules Governing the Listingof Securities on The Stock Exchange of Hong Kong Limited (the ‘‘Listing Rules’’) so as to maintain ahigh standard of corporate governance of the Company.
During the year ended 31 December 2014, the Company has complied with the applicable codeprovisions of the Code.
MODEL CODE FOR SECURITIES TRANSACTIONS BY DIRECTORS
The Company has adopted the ‘‘Model Code for Securities Transactions by Directors of Listed Issuers’’set out in Appendix 10 to the Listing Rules as its code of conduct regarding directors’ securitiestransactions. All directors have confirmed, following specific enquiry by the Company, that they havecomplied with the Model Code throughout the period commencing from the Listing Date to 31December 2014.
PUBLICATION OF FINAL RESULTS AND ANNUAL REPORT ON THE STOCK EXCHANGE
The f ina l r e su l t s announcemen t i s pub l i shed on the webs i t e s o f the S tock Exchange(http://www.hkexnews.hk) and the Company (http://www.nature-home.com.hk). The annual report willbe dispatched to the shareholders and will be available on the websites of the Stock Exchange and theCompany in due course.
– 49 –
AUDIT COMMITTEE
The Company established an audit committee (the ‘‘Audit Committee’’) with written terms of referencein compliance with the Code. As at the date of this announcement, the Audit Committee consists of thefollowing members:
Independent non-executive Directors
Mr. Chan Siu Wing, Raymond (Chairman)
Mr. Zhang Sen Lin
Mr. Ho King Fung, Eric
The chief responsibilities of the Audit Committee include making recommendations to the Board on theappointment, reappointment and removal of the external auditors and to approve the remuneration andterms of engagement of the external auditors, and any questions of resignation or dismissal of suchauditors; reviewing the interim and annual reports and accounts of the Group; and supervising thefinancial reporting process and effectiveness of internal control system of the Group. The AuditCommittee has reviewed and discussed the financial statements for the year ended 31 December 2014.
APPRECIATION
On behalf of the Board of Directors, I hereby express our sincere gratitude to the outstandingcontributions and endless efforts made by the management and all employees, as well as the strongsupport from all our customers, business partners, and shareholders.
By Order of the BoardNature Home Holding Company Limited
Se Hok PanChairman and Executive Director
Hong Kong, 30 March 2015
As at the date of this announcement, the board of directors of the Company comprises Mr. SE Hok Pan, Mr. Liang Zhihua
Ms. UN Son I and Mr. SHE Jian Bin, as executive directors; Mr. Homer SUN (with Mr. LAW Wing Cheung, Ryan as his
alternate) and Mr. TEOH Chun Ming as non-executive directors; Professor LI Kwok Cheung, Arthur, Mr. ZHANG Sen Lin,
Mr. CHAN Siu Wing, Raymond and Mr. HO King Fung, Eric as independent non-executive directors.
– 50 –