china meets the middle-income trap: the large …faculty.econ.ucdavis.edu/faculty/woo/woo-articles...
TRANSCRIPT

Journal of Chinese Economic and Business StudiesVol. 10, No. 4, November 2012, 313–336
China meets the middle-income trap: the large potholes in the road to
catching-up
Wing Thye Woo*
School of Economics, Fudan University, Shanghai; Penang Institute, George TownEconomics Department, University of California, Davis, USA
(Received 1 July 2012; final version received 11 August 2012)
We follow Woo (2011) in using the Catch-Up Index (CUI) to define themiddle-income trap and identify the countries caught in it. The CUI showsthat China became a middle-income country in 2007–2008. We see fivemajor types of middle-income trap to which China is vulnerable: (a) fiscalstress from the nonperforming loans generated by the interaction betweenthe lending practices of the state banks and the innate desire by stateenterprise managers to over-invest and embezzle; (b) the frequent use ofmacro-stabilization tools that hurt long-term productivity growth; (c) flawsin socio-political governance that exacerbate social tensions; (d) ineffectivemanagement of environmental challenges that threaten sustainable devel-opment; and (e) inept handling of international economic tensions thatcould unleash trade conflict. We recommend new governance principlesand management methods to prevent China from falling into these fivetypes of middle-income trap.
Keywords: middle-income trap; overly-large state sector; urbanizationunder principle of future home ownership; environmental stress; trade war
JEL Classifications: D31; E21; E26; E44; E51; E65; F41; G21; O53; P24;P31; P36; Q50
1. A new stage in China’s economic development but will this be the permanent
stage?
China will stand in 2013 where Argentina had stood in 1913 – the launch pad forhigh income-hood. China in 2013 will have been the fastest growing country for thepast 33 years just as Argentina in 1913 was the fastest growing country for the past43 years (of the 65 countries for which data were available in 1913).1 In 1913, the tworichest countries in the world were USA and Australia, and Argentina was rankedthe 10th richest country. As USA and Australia were lands of recent settlement, likeArgentina, the dominant expectation then was that Argentina would sooncatch up with them and be in the front rank of the rich countries. This was,
*Email: [email protected]
ISSN 1476–5284 print/ISSN 1476–5292 online
� 2012 The Chinese Economic Association – UK
http://dx.doi.org/10.1080/14765284.2012.724980
http://www.tandfonline.com
Dow
nloa
ded
by [
Win
g T
hye
Woo
] at
04:
06 1
6 N
ovem
ber
2012

however, not to be. The Argentina–USA income gap has now widened from 72% ofUS income in 1913 to 35% in 2008; and its income rank in the original group of 65countries had fallen to 28.
Argentina’s failure to catch up is not unique.2 Four of the top 10 countries in1913 are not in the top 10 group in 2008 – New Zealand, UK, Belgium andArgentina were replaced by Ireland, Norway, Hong Kong and Singapore. Theobvious lesson is the well-known observation that the past is not a reliable predictor
of the future. The interesting question for China is that, while it is clear thatArgentina has failed to catch up with the richest countries, in what sense could wesay that Argentina (the star growth performer in the 43 years before 1913) spent thetwentieth century inside the middle-income trap? And how could China (the stargrowth performer in the 33 years before 2013) escape this same fate?
2. Defining the middle-income trap
Possibly the most important consideration in defining the analytical metric to classifya country as high-income, or middle-income, or low-income3 is that the definition of
income categories must have a built-in dynamic element to take into account that theincome of the world’s richest countries has been rising steadily over the last 200years. In the context where the highest potential level of income (output per person)internationally is increasing, due to factors such as technological progress andinstitutional innovation, the boundaries of the income categories should not bedrawn on the basis of absolute levels of income. This is because we believe that mostcountries that are not severely geographically-disadvantaged (e.g. a landlockeddesert with no mineral resources) could come to attain an income level that is close tothe highest international level of potential income after they have adopted andadapted the appropriate policy regimes in the various socio-economic-politicalspheres. For example, a country that denies education to its women is unlikely to
ever achieve the income level of the rich countries because this country is running onone leg – actually, hopping on one leg – to catch up with the moving finishing line.
So to assess whether a country has been making substantial progress in catching-up during the 1960–2008 period, we follow Woo (2011) in defining high-income,middle-income and low-income by the ratio (expressed in percent) of the income levelof the country to the income level of the United States, which is commonly acceptedto have been the economic leader of the world at least since 1920. We call the ratio ofa country’s income level to the US income level the country’s score on the Catch-UpIndex (CUI).4
For the task of benchmarking income levels, we use the GDP (measured in 1990international Geary-Khamis dollars) and population data from the Maddison (2010)dataset that covers the AD 1 to AD 2008 period. After matching the CUI with thecommon notions that most Western European countries are high-income countriesand that most sub-Saharan countries are low-income countries, Woo (2011) defined:
. high-income countries as countries with CUI4 55%;
. middle-income countries as countries with 55%4CUI4 20%; and
. low-income countries as countries with CUI5 20%.5
314 W.T. Woo
Dow
nloa
ded
by [
Win
g T
hye
Woo
] at
04:
06 1
6 N
ovem
ber
2012

In thinking about the probability of China stumbling into the middle-incometrap, we keep in mind that because China is a continent-sized country with a largeproportion of its territory without easy access to cheap water-based transportation
unlike the Netherlands, Ireland and Denmark, we should look more at the growthexperiences of the largest regional economies, and less at small economies that havecaught up.
Figure 1 captures the essence of Latin America being in the middle-income trapby graphing the five-period moving average (centred on the year indicated) of CUIsfor 1962–2006 for the five large Latin American countries: Argentina, Brazil, Chile,
Mexico and Venezuela. There is convergence within the group as shown by thenarrowing of the spread of CUIs from about 60 percentage points in 1960 to about20 percentage points in 2006, but the mean value of the group in 2006 is about thesame as the mean value in 1960, i.e. the group is stuck at CUI equal to 30%. It is in
the sense that these five Latin American countries are showing no signs of catchingup with the living standard of the United States after 50 years that we say they arecaught in the middle-income trap.
Figure 2 graphs the CUIs of the developing members of the Asian group: China,India, Indonesia, Philippines, Thailand and Malaysia. Other than for the Philippines,every developing Asian member has a higher CUI in 2006 than in 1962, moving the
average CUI of the group from 7% to 16%. Unlike in the earlier Figure 1, the endresult is a widening in the spread of CUIs rather than a convergence because therewere three countries that had very high growth: Malaysia, Thailand and China. Bygrowing at more that 4% annually, Malaysia and Thailand are the star performers inthis group, joining the richer half of the Latin American countries by 2008.
10
20
30
40
50
60
70
80
1962 1964 1966 1968 1970 1972 1974 1976 1978 1980 1982 1984 1986 1988 1990 1992 1994 1996 1998 2000 2002 2004 2006
Argentina Brazil Chile Mexico Venezuela
Figure 1. GDP per capita (PPP) of Latin America as a percentage of US level.
Journal of Chinese Economic and Business Studies 315
Dow
nloa
ded
by [
Win
g T
hye
Woo
] at
04:
06 1
6 N
ovem
ber
2012

China had the lowest CUI score (5%) in the group in the 1960–1975 period forvery understandable reasons: the Great Leap Forward economic strategy created afamine in 1960–1962 that killed 25 million people, and the Great Proletarian CulturalRevolution in 1966–1976 closed virtually all high schools and universities, anddisrupted production and normal government functions off and on. China started itscatch-up process in 1978, and accelerated its catch-up speed twice (1992 and 2000) toreach middle-income status in 2007–2008. China’s living standard overtook India’sin 1978, the Philippines’ in 1993, and Indonesia’s in 2000. China’s income pippedColombia’s in 2008 and joined the middle-income club.
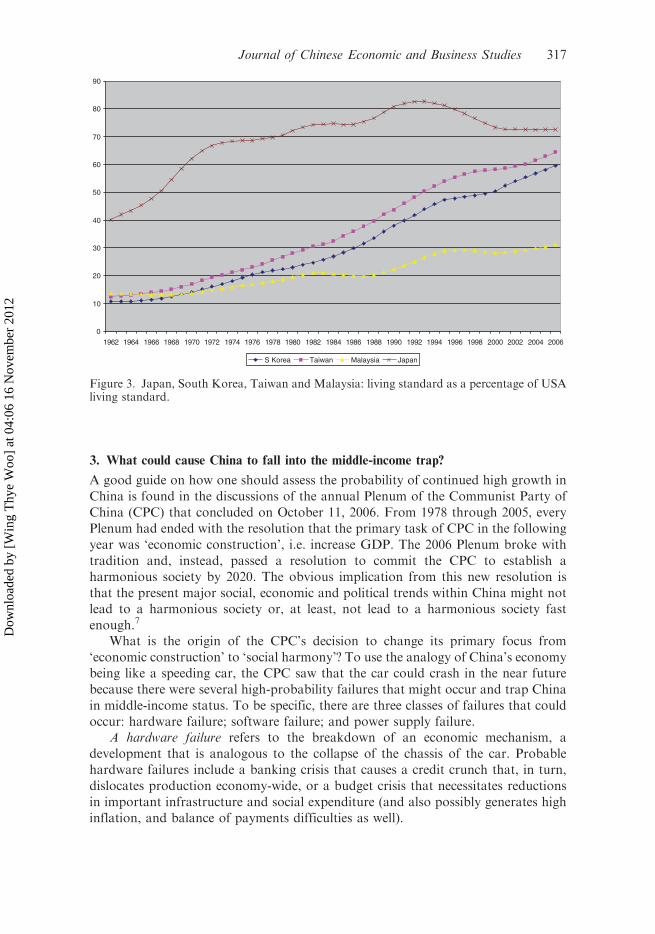
The growth record of the above developing Asian economies depicted in Figure 2might have overstated the impressiveness of the catch-up growth in Malaysian andThailand, however. To be reminded of what is truly impressive economic catch-up,Figure 3 graphs the CUI of Malaysia with the CUIs of Japan, South Korea andTaiwan. Malaysia was actually richer than Taiwan until 1965 and richer than SouthKorea until 1970. And when Malaysian growth accelerated in 1971, its new growthrate was still considerably lower than those of Korea and Taiwan. Furthermore,Malaysian CUI stagnated from 1981 to 1988, and stagnated again from 1997 untilthe present. Korea and Taiwan experienced only a slowdown, not stagnation, in therise of their CUIs upon the onset of the Asian Financial Crisis; and this slowdownwas short-lived.6
With the perspective of the broader canvass in Figure 3, we can recognize thatMalaysia has had respectable, but not outstanding, economic growth, and thatMalaysia is now muddling in the middle-income trap. Which set of its neighbours isChina likely to resemble when it CUI score reaches the 35 mark: Malaysia-Thailandor South Korea-Taiwan?
0
5
10
15
20
25
30
35
1962 1964 1966 1968 1970 1972 1974 1976 1978 1980 1982 1984 1986 1988 1990 1992 1994 1996 1998 2000 2002 2004 2006
China India Indonesia Philippines Thailand Malaysia
Figure 2. GDP per capita (PPP) of developing Asia as a percentage of US level.
316 W.T. Woo
Dow
nloa
ded
by [
Win
g T
hye
Woo
] at
04:
06 1
6 N
ovem
ber
2012
3. What could cause China to fall into the middle-income trap?
A good guide on how one should assess the probability of continued high growth inChina is found in the discussions of the annual Plenum of the Communist Party ofChina (CPC) that concluded on October 11, 2006. From 1978 through 2005, everyPlenum had ended with the resolution that the primary task of CPC in the followingyear was ‘economic construction’, i.e. increase GDP. The 2006 Plenum broke withtradition and, instead, passed a resolution to commit the CPC to establish aharmonious society by 2020. The obvious implication from this new resolution isthat the present major social, economic and political trends within China might notlead to a harmonious society or, at least, not lead to a harmonious society fastenough.7
What is the origin of the CPC’s decision to change its primary focus from‘economic construction’ to ‘social harmony’? To use the analogy of China’s economybeing like a speeding car, the CPC saw that the car could crash in the near futurebecause there were several high-probability failures that might occur and trap Chinain middle-income status. To be specific, there are three classes of failures that couldoccur: hardware failure; software failure; and power supply failure.
A hardware failure refers to the breakdown of an economic mechanism, adevelopment that is analogous to the collapse of the chassis of the car. Probablehardware failures include a banking crisis that causes a credit crunch that, in turn,dislocates production economy-wide, or a budget crisis that necessitates reductionsin important infrastructure and social expenditure (and also possibly generates highinflation, and balance of payments difficulties as well).
0
10
20
30
40
50
60
70
80
90
1962 1964 1966 1968 1970 1972 1974 1976 1978 1980 1982 1984 1986 1988 1990 1992 1994 1996 1998 2000 2002 2004 2006
S Korea Taiwan Malaysia Japan
Figure 3. Japan, South Korea, Taiwan and Malaysia: living standard as a percentage of USAliving standard.
Journal of Chinese Economic and Business Studies 317
Dow
nloa
ded
by [
Win
g T
hye
Woo
] at
04:
06 1
6 N
ovem
ber
2012

A software failure refers to a flaw in governance that creates frequent widespreadsocial disorders that disrupt production economy-wide and discourage privateinvestment. This situation is similar to a car crash that resulted from a fight amongthe people inside the speeding car. Software failures could come from the presenthigh-growth strategy creating so much inequality, and corruption that, in turngenerate severe social unrest, which dislocates economic activities; or from the statenot being responsive enough to rising social expectations, hence causing socialdisorder.
A power supply failure refers to the economy being unable to move forwardbecause it hits either a natural limit or an externally-imposed limit, a situation that isakin, respectively, to the car running out of gas or to the car smashing into a barriererected by an outsider. Examples of power supply failures are an environmentalcollapse, e.g. climate change, or a collapse in China’s exports because of a trade war.
The fact that the CPC chose to emphasise the danger of social disharmonysuggests that it regards software failure as having the highest probability ofhappening. The post-2006 emphasis of the government on generating inclusivegrowth (bao rong xing zeng zhang) supports this interpretation. However, theoccurrence of the Global Financial Crisis in 2008 and the prolonged economicstagnation of the G7 economies that followed have (1) made macroeconomicmanagement in China much more challenging, and (2) strengthened greatly theprotectionist sentiments within G7. These two recent developments have, in short,raised the both the probability of hardware failure and the probability of powersupply failure in China today.8 In the next few sections, I discuss one or two of themost likely precipitating events in each class of failures.
0
5
10
15
20
25
30
35
1990 1991 1992 1993 1994 1995 1996 1997 1998 1999 2000 2001 2002 2003 2004 2005
$0.50 poverty line $0.75 poverty line $1.00 poverty line
Figure 4. Proportion of rural population below poverty line (%). The poverty line is measuredin 1985 PPP US$.
318 W.T. Woo
Dow
nloa
ded
by [
Win
g T
hye
Woo
] at
04:
06 1
6 N
ovem
ber
2012

4. The likely hardware failures: fiscal stress from state banks and low productivity
growth from state enterprises
China began the recapitalization of the state-controlled banks (SCBs) in 2003 and
brought the capital adequacy ratio (CAR) of the four largest SCBs to about 8% at
the end of 2004. The important question is how many more rounds of bank
recapitalization can China afford without generating a fiscal crisis? The simple fact is
that fiscal sustainability lies at the heart of whether a banking crisis would actually
occur. As long as the state is perceived to be able and willing to bail out the SCBs,
depositors would probably retain their confidence in the SCBs regardless of the
actual state of their balance sheets. Since the stock of publicly acknowledged
government debt in 2011 is only about 20% of GDP, it is usual to hear official
assurances that the current fiscal deficits of less than 4% of GDP do not pose a
problem for debt servicing by the state.9 However, the current value of the debt–
GDP ratio is not a good indicator of the sustainability of the existing fiscal policy
regime; a better indicator would involve working out the evolution of the debt–GDP
ratio over time.To put the issue formally, the evolution of the debt-GDP ratio is given by:
d ln Debt=GDP½ �ð Þ=dt ¼ rþ GDP=Debt½ � � ½ f þ b� � y
where
r real interest rate on government debt,f primary fiscal deficit rate,
[state expenditure excluding debt service� state revenue]/GDP,b non-performing loans (NPL) creation rate,
[change in NPL in SCBs]/GDP,y trend growth rate of real GDP.
As long as y4 r, then the Debt/GDP ratio will have a steady-state value that is
non-zero when the sum of (fþ b)4 0. Specifically,
Debt=GDPð Þsteady-state¼ ð f þ bÞ= y� rð Þ when y4 r
China appears to belong to this case because its post-1978 annual growth rate has
averaged 9.8%, its growth rate in the next ten years is likely to be above 8%; and the
real interest rate has been about 4%. For the generation of likely future scenarios, I
will make the conservative assumptions that y is 8%, f is 1%, and r is 6%.10 It is
difficult to predict b, the rate that banks would generate NPLs, because it depends on
the type of banking reform undertaken. If no meaningful reforms are undertaken,
then b is likely to remain at the historic value of 6%.So, conditional on the effectiveness of reforming the SCBs, the steady-state
ratio is:
Debt=GDPð Þsteady-state¼ 350% when b ¼ 6%
Debt=GDPð Þsteady-state¼ 200% when b ¼ 3%
Debt=GDPð Þsteady-state¼ 100% when b ¼ 1%
Journal of Chinese Economic and Business Studies 319
Dow
nloa
ded
by [
Win
g T
hye
Woo
] at
04:
06 1
6 N
ovem
ber
2012

The noteworthy finding from the above scenarios is that China will produce alevel of (Debt/GDP)steady-state that is high by international experience despite theoptimistic assumptions that the long-run growth rate is 8%, and that b will belowered from 6% of GDP to 1%. The most optimistic outcome is still two-thirdslarger than what the European Union has set to be the ‘safe’ debt–GDP target (60%)for its members. The banking system has made China vulnerable to a fiscal crisiseven though there is a theoretical steady-state level for the debt–GDP ratio. Ofcourse, the creation of NPLs cannot be attributed entirely to the SCBs, their chiefcustomers, the embezzlement-ridden and inefficiency-ridden state-controlled enter-prises (SCEs),11 deserve an equal share of the blame.
The important point from this second fiscal feature is that the 2004 recapital-ization of the SCBs was the last time that the government could afford to recapitalizethe SOBs, and possibly the last time that the government can do so without upsettingconfidence in the financial markets about the soundness of China’s fiscal regime.
When the Global Financial Crisis (GFC) erupted in full force in September 2008,the central government fought the fast slowdown of the national economy inNovember 2008 by introducing a two-year four trillion RMB stimulus package,which is equivalent to about 14% of China’s GDP. The central government wouldfund only 1.18 trillion yuan (29.5%) of the total stimulus spending, and the localgovernments would finance the rest of the cost of the stimulus programme by raisingfunds from wherever. The fact that the central government would fund only one-third of the proposed expenditure might prompt one to think of the stimulusprogramme as a work agenda for the government to create the incentives to induceinvestment to reach the stated level, but such an interpretation would be wrong. Thestimulus should be properly understood as permission by the central government toallow additional investments up to the stated level.
This different understanding is based on the reality that a large part of China’seconomy is still state-controlled,12 and that this segment pursues other objectivesbesides the ideal of profit-maximization. Because state-controlled enterprises (SCEs)are usually bailed out when investment decisions turned out to be over-optimistic orderailed by bad luck, this soft-budget practice has created the well-know interest-inelastic phenomenon of ‘thirst for investment’ which makes the economy inflation-prone; see Woo (2006). An expanded SCE yields its state-appointed manager threemajor benefits: higher likelihood of promotion based on the proven ability to handlebigger things, greater patronage power to build a political base; and more resourcesthat could potentially be diverted for personal gains.13 Equally important is that theleaders of the local governments share the enthusiasm of SCE managers for growthfor the same three reasons.
The central government has two lines of defence to maintain macro-stability inChina’s partially-reformed economy. The first line is that all large projects need theapproval of the National Development and Reform Commission (formerly, the StatePlanning Commission). The second line of defence is that all banks are assignedcredit quotas.
So when Premier Wen Jiabao approved the stimulus programme and coveredonly a third of its cost, he was giving permission (1) to the SCEs to invest more inorder to offset the spending slump in the private sector; and (2) to the state-controlled banks (SCBs) to extend the necessary loans to fund the approved projects.
320 W.T. Woo
Dow
nloa
ded
by [
Win
g T
hye
Woo
] at
04:
06 1
6 N
ovem
ber
2012

Herein lies the mechanism for the success of the stimulus programme: the use of non-
profit-maximizing state-controlled production and financial units to boost aggregate
demand. Because the SCEs and the SCBs are implementing a state-assigned mission,
their managers cannot rightly be held responsible should the assigned projects turn
out to be financial busts in the future.Not surprisingly, the public media carried occasional anecdotes about new
investments in industries plagued by overcapacity (e.g. steel, cement, and alumin-
ium); trophy investments – e.g. grand town centres, high-speed rail and stately
administrative buildings – and spontaneous privatization of project funds (e.g.
massive purchase of cars by state bodies).14 Many of these industrial and
infrastructure investments were undertaken by the 8000 local investment companies
established by the local governments. It has been estimated that at the end of 2009,
the loans of these investment vehicles amounted to 51% of GDP in 2009 and the debt
of the central government amounted to 20% of GDP.15 There is thus concern in
some quarters that much of the bank loans to the stimulus programme would end up
as nonperforming loans (NPLs), and that the resulting financial crisis would cause
China to crash as the US and the UK did in 2009.16 Or alternatively, the bailout of
the SCBs by the government would cause a fiscal crisis that would require large
cutbacks on important infrastructure and social programmes.A second common concern about China’s stimulus programme is that the SCBs
were channelling the flood of liquidity to the SCEs and further17 neglecting the
increased financing needs of the private sector brought on by the GFC. Pressed for
working capital, two well-known large private companies, Rizhao (a steel firm) and
Mengniu (a dairy), agreed to be acquired by their state-owned counterparts. As SCEs
are generally less efficient and innovative than private firms, the expansion of the
role of the state firms has rightly raised the issue of whether Premier Wen’s way of
imparting the needed boost to capacity utilization during the GFC would become a
drag on future productivity growth.18
While CPI inflation in 2009 was reassuringly low at �0.7%, ‘land prices . . . dou-
bled in 2009 on a nationwide basis’.19 The first quarter of 2010 saw even more rapid
increases in land prices, especially in the major coastal cities.20 As a real estate bubble
is inevitably socially-alienating (by disappointing new home buyers on the way up
and dismaying existing home owners on the way down), the government sought to
stabilize property prices in mid-April 2010 by making it harder to buy houses, e.g.
requiring first-time home buyers to put a minimum of 30% down payment for
houses larger than 90 square metres; and increasing the mortgage rate on second
homes. The roaring real estate market and the use of non-market means (e.g. ban on
purchases) to tame it are symptoms of some deep economic problems that China will
have to address in order to sustain growth over the long-run.The real estate boom was, of course, only part of a generalized investment boom
unleashed by the 400 trillion RMB stimulus programme. The November 2008
stimulus programme ultimately resulted in strong inflationary pressures appearing in
2010. China applied its monetary brake sharply in 2011, accentuating the financing
difficulties that the private sector had faced since 2004. The result, it appears, could
be a sharp slowdown in GDP growth on the eve of the CPC Congress at the end of
2012, which will see a large-scale change in the top political leadership.21
Journal of Chinese Economic and Business Studies 321
Dow
nloa
ded
by [
Win
g T
hye
Woo
] at
04:
06 1
6 N
ovem
ber
2012

To summarize, there are two hardware failures that are likely at the present time.The large dose of SCE-cum-SCB-based macro-stimulus in 2009–2010 has (a) createdfuture NPLs that could cause either the SCBs to collapse or a fiscal crisis from thebailout of the SCBs, and (b) lowered productivity growth in the future by enablingthe state sector to crowd out the private sector. China’s current instruments ofmacro-stimulus have thus created a potential trade-off between maintenance of fullcapacity utilization in the short-run and sustenance of a high rate of capacityexpansion in the long-run. The important task for Chinese policymakers now is toeliminate this trade-off. This task will require the state to replace the usual macro-stimulus with new market-friendly instruments to maintain an adequate level ofaggregate demand; a topic that we will take up later in the paper.
5. The likely software failures are from flaws in governance
The satisfactory functioning of a market economy requires a wide array ofregulatory institutions that range from straightforward law-and-order administra-tion to complicated legal adjudication. China’s strategy of incremental reformcombined with the fact that institution building is a time-consuming process meantthat many of its regulatory institutions are either absent or ineffective. The resultshave been governance failures on many fronts, of which the most well-known are theviolations against the welfare of consumers, e.g. the addition of poisonoussubstitutes into toothpaste, cough medicine, and animal feed; the application oflead paint to children’s toys; and the over-employment of antifungals andantibacterials in fish farming. Most of these abuses had received enormous attentiononly because these items were exported to other countries and their harmful effectswere reported widely in the international press.
However, besides inadequate institutions of governance, the present economicdevelopment strategy, despite its ability to generate high growth rates, is now alsogenerating high social tensions. This is because the trickling-down mechanism inincome diffusion seems to have slowed down significantly, and is hence unable toreduce extreme poverty further and improve significantly the rural–urban incomedistribution and the regional income distribution.22 In the 1990s, the $1-poverty-rate23 (i.e. the proportion of rural population receiving a daily income of $1 or less),dropped rapidly from 29.1% in 1993 to 11.1% in 1999. But in the following six years,1999–2005, the decline was only 3.9 percentage points, see Figure 3. In fact, the$1-poverty-rate had dropped to only 10.2% in 2003 (a 0.9 percentage point declinefrom 1999) even though the annual GDP growth rate averaged over 8.5 percent inthe 1999–2003 period. It was only after the accumulated effects of the sustainedlarge-scale effort to develop western China began in 2001 and the post-2002 rise inthe GDP growth rate to above 10% had kicked in, that the $1 poverty rate droppedto 7.9% in 2004 and then to 7.2% in 2005.
More troubling is that Figure 3, in fact, shows that the decline in the $1-poverty-rate in the 1999–2005 period overstates the progress in reducing extreme poverty. Inthe 1999–2005 period, there was practically no improvement in the $0.75-povertyrate (4.9% in 1999 and 4.5% in 2005), and an increase (!) in the $0.50-poverty-rate(1.7% in 1999 to 2.8% in 2005). In short, the trickling-down mechanism of
322 W.T. Woo
Dow
nloa
ded
by [
Win
g T
hye
Woo
] at
04:
06 1
6 N
ovem
ber
2012

income-diffusion in China has slowed down for the poorest 5% of the ruralpopulation, and, hence, worsened income inequality.24
Furthermore, the present mode of economic development also generates immenseopportunities for embezzlement of state assets, seizure of farmlands for industrialdevelopment, and corruption because of the absence of effective mechanisms tosupervise government employees. These features certainly make social harmony hardto sustain. Wang and Woo (2011) have found that urban residents have substantialunreported (hidden) income. Table 1 reports their estimates of official income andtrue income in each income group. The official income per capita and true incomeper capita in the richest 10% of households in 2008 was 43,614 RMB and 139,000RMB respectively; official income being one-third of true income. Total householddisposable income in 2008 was RMB 14.0 trillion according to the official databut RMB 23.2 trillion according to the Wang and Woo estimate. And as 63% of thetotal unreported income went to the richest 10% of urban households, the income ofthe richest 10% of Chinese households is really 65 times that of the poorest 10%instead of the 23 times reported in the official data. In short, the Gini coefficient isclearly much higher than the Asian Development Bank’s (2007) figure of 0.47 for2004.
The data on social unrest are consistent with the hypothesis of rising socialdisharmony. The incidence of public disorder, labelled ‘social incidents’, rose steadilyfrom 8700 in 1993 to 32,500 in 1999 and then to 74,000 in 2004; and the averagenumber of persons in a mass incident has also risen greatly, from 8 in 1993 to 50 in2004. Clearly, the number of mass incidents would have been lower and governancewould have been better if the government’s actions had been monitored closely by anindependent mechanism and the government had also been held more accountablefor its performance. The embrace of the Harmonious Society programme by CPC isacknowledgement that democracy, the rule of law, and a stable income distributioncomprise an indivisible combination that is necessary to ensure the social stabilitythat will keep the economy on the high growth path to catch up with the UnitedStates.
Table 1. Disposal income per capita in each income category in 2008.
Category
% ofurban
residents
Officialincome(RMB)
‘‘True’’income(RMB)
Distributionof hiddenincome (%)
Lowest income 10 4754 5350 0.4Low income 10 7363 7430 0.0Lowere middle income 20 10,196 11,970 2.3Middle income 20 13,984 17,900 5.1Upper middle income 20 19,254 27,560 10.9High income 10 26,250 54,900 18.8Highest income 10 43,614 139,000 62.5
All urban dwellers 100 16,885 32,154 100.0
Hidden Income¼Total True Income�Total Official Income.Source: Tables 5 and 6 in Wang and Woo (2010).
Journal of Chinese Economic and Business Studies 323
Dow
nloa
ded
by [
Win
g T
hye
Woo
] at
04:
06 1
6 N
ovem
ber
2012

6. The first type of likely power supply failure is environmental collapse in China
The present mode of economic development has given China the dirtiest air in the
world, is polluting more and more of the water resources, and, is, possibly, changing
the climate pattern within China. The unexpurgated version of a 2007 World BankReport stated that ‘about 750,000 people die prematurely in China each year, mainly
from air pollution in large cities’;25 and a 2007 OECD study has estimated that
‘China’s air pollution will cause 20 million people a year to fall ill with respiratory
diseases.’26
Water shortage appears to pose the most immediate environmental threat to
China’s continued high growth. Presently, China uses 67 to 75% of the 800 to 900
billion cubic metres of water available annually, and present trends in water
consumption would project the usage rate in 2030 to be 78 to 100%.27 The extended
period of semi-drought in northern China combined with the economic and
population growth have caused more and more water to be pumped from the
aquifers, leading the water table to drop three to six metres a year.28 And a study
using measurements from satellites (the Global Positioning System) has established
that the part of China north of the 36th parallel latitude has been ‘sinking at the rate
of 2mm a year.’29
While northern China has been getting drier and experiencing desertification,
nature as if in compensation (or in mockery) has been blasting southern China with
heavier rains, causing heavy floods that have brought considerable deaths and
property damage almost every summer since 1998.30 The sad possibility is that the
northern droughts and southern floods may not be independent events but a
combination caused by black carbon particulates that originate in China.31
Clearly, without water, growth cannot endure. And in response, the government
began implementation in 2002 of Mao Zedong’s 1952 proposal that three canals be
built to bring water from the south to the north: an eastern coastal canal from
Jiangsu to Shandong and Tianjin, a central canal from Hubei to Beijing and Tianjin,
and a western route from Tibet to the north-western province. Each canal will stretch
over a thousand miles.32 This massive construction project will not only be
technically challenging but also extremely sensitive politically and fraught withenvironmental risks. The central canal will have to tunnel through the foot of the
huge dyke that contains the elevated Yellow River, and the western canal will have to
transport water through regions susceptible to freezing and earthquake.The enlargement of the Danjiangkou Dam (in Hubei) to enable it to be the source
of the central canal has already displaced 330,000 people; and many more are
expected to be displaced.33 Moving people involuntarily is certainly potentially
explosive politically. The project could also be politically explosive on the
international front as well. One plan for the western canal calls for ‘damming the
Brahmaputra river and diverting 200 billion cubic metres of water annually to feed
the ageing Yellow river,’ a scenario that is reportedly ‘giving sleepless nights to the
Indian government . . .which is concerned that this ‘‘Great Western Water Diversion
Project’’ could have immense impact on lower riparian states like India and
Bangladesh.’34
The general point is that effective policy-making on the environmental front is
a very difficult task because much of the science about the problem is not known.
324 W.T. Woo
Dow
nloa
ded
by [
Win
g T
hye
Woo
] at
04:
06 1
6 N
ovem
ber
2012

The uncomfortable reality for China is that unless ecological balance is restoredwithin the medium-term, environmental limits could choke off further economicgrowth. And the uncomfortable reality for the rest of the world is that the negativeconsequences of large-scale environmental damage within a geographically largecountry are seldom confined within that country’s borders. The continued march ofChina’s desertification first brought more frequent sand storms to Beijing and then,beginning in April 2001, sent yellow dust clouds not only across the sea to Japan andKorea but also across the ocean to the United States. China’s environmentalmanagement is a concern not only for China’s welfare but for global welfare as well.
There is no doubt, however, that the Chinese government is trying to improve itsperformance in sustainable development. The 12th Five-Year Plan for 2011–2015that was passed by the National People’s Congress in March 2011 has identified‘Green China’ as one of its core objectives. But it is still hard to call China’s greentargets ambitious, e.g. energy intensity is to decline by 17% in the forthcoming 5-yearperiod when it fell 20% in the last 5-year period, and non-fossil fuel will account for11.3% of overall energy use in 2015 up from 8% in 2011.35
7. The second type of likely power supply failure is trade protectionism
It was no April Fool’s Day joke when the Wall Street Journal of 1 April 2011 carriedthe headline ‘China meeting highlights currency conflict’. The list of US grievancesgenerated by the large US–China bilateral imbalances has now expanded from theloss of US jobs to the meltdown of the US financial market in September 2008.36 The‘bad China’ feeling is so strong that even The New York Times (17 March 2010)stooped to oxymoronic rhetoric, calling the fixed RMB–Dollar exchange rate ‘atextbook example of the beggar-thy-neighbour competitive devaluation’ (emphasisadded). The English language is not the only casualty in the discussion of the US–China economic relationship: history has also been given the wrong twist. Accordingto Lardy (1998):
The United States is the addict. We are addicted to consumption . . .China is the dealer.They’re supplying the credit that makes it possible for us to over-consume.37
It is hard not to see in this quote reference to the Opium War of the nineteenthCentury, with the identities of the aggressor and the victim reversed as atransmogrification of history that is quite over the top. What should be very clearfrom the above recent rhetoric is that China–US trade tensions have reached adangerously high level now that the United States is experiencing intractably highunemployment from the Global Financial Crisis.
There are quite a number of China-centric explanations38 for China’s chronictrade surplus, and we will discuss the two that seems the most important (a) thefinancial market theory that attributes the imbalance to the inability of China’slargely unreformed financial system to intermediate all savings into investment; and(b) the industrial policy theory that attributes the trade imbalance to China’spromotion of exports and suppression of imports.
The financial market theory focuses on the aggregate-level accounting identitythat the overall current account balance is determined by the fiscal position of the
Journal of Chinese Economic and Business Studies 325
Dow
nloa
ded
by [
Win
g T
hye
Woo
] at
04:
06 1
6 N
ovem
ber
2012

government, and the savings-investment decisions of the SCEs and the private sector.Specifically:
CA ¼ T� Gð Þ þ SSCE � ISCEð Þ þ Sprivate � Iprivate� �
where CA¼ current account in the balance of payments
CA (X –M)þRX export of goods and non-factor servicesM import of goods and non-factor servicesR net factor earnings from abroad (i.e. export of factor services)T state revenueG state expenditure (including state investment)
SSCE saving of the SCEsISCE investment of the SCEs
Sprivate saving of the private sectorIprivate investment of the private sector
Because the Chinese fiscal position (T-G) has nearly always shown a small deficit,the current account surplus reflects primarily the savings of SCEs, and the privatesector is larger than the sum of their investment expenditures. Why has China’sfinancial system failed to translate the savings into investments? Such an outcomewas not always the case. Before 1994, the voracious absorption of bank loans bySCEs to invest recklessly kept the current account usually negative and the creationof NPLs high. When the government implemented stricter controls on the SCBsfrom 1994 onward (e.g. removing top bank officials whenever their bank lent morethan its credit quota or allowed the NPL ratio to increase too rapidly), the SCBsslowed down the growth of loans to SCEs. This cutback created an excess of savingsbecause the SCB-dominated financial sector did not re-channel the released savings(which were also increasing) to finance the investment of the private sector.
This failure in financial intermediation by the SCBs is quite understandable.First, the legal status of private enterprises was, until recently, less secure than that ofthe state enterprises; and, secondly, there was no reliable way to assess the balancesheets of the private enterprises, which were naturally eager to escape taxation. Theupshot was that the residual excess savings leaked abroad in the form of the currentaccount surplus. Inadequate financial intermediation has made developing China acapital exporting country and put it in conflict with its trade partners!39
The industrial policy explanation for China’s chronic trade surplus views thisanomalous situation as the unintentional outcome of (1) the overriding economicand political priority in China to create jobs for its underemployed (surplus) labourforce; and, two, the widespread belief in the efficacy of infant industry protection –ambiguously labelled as the ‘promotion of indigenous innovation’ – in acceleratingChina’s movement up the value-added ladder. The resulting export subsidies, importbarriers, and undervalued exchange rate worked together to accelerate thesimultaneous growth of export firms (which increased exports) and import-competing firms (which decreased imports), and hence kept the trade balance insurplus.
The industrial policy theory has been challenged on the grounds that itsmicroeconomic plausibility is at odds with economy-wide constraints. Specifically, in
326 W.T. Woo
Dow
nloa
ded
by [
Win
g T
hye
Woo
] at
04:
06 1
6 N
ovem
ber
2012

a two-sector general equilibrium model of exportables and importables, there could
not have been simultaneous growth of the exportable sector and the importable
sector because labour would flow from one to the other depending on the relative
size of the effective export subsidy rate and the effective import tariff rate – and,
hence, the trade balance would not be affected by the industrial policy. However, this
theoretical reasoning about industrial policy does not hold for China, one, because
of the existence of surplus labour in the countryside that could move into both the
exportable sector and the importable sector; and, two, because of the existence of a
sizeable non-tradable sector (e.g. low value-added service activities, and subsistence
agriculture) that would release labour to the ‘policy-favoured’ tradable sector.Clearly, the prevention of a trade war with the US would require that China
accelerates the development of its financial sector if the financial market theory is
correct; and removes the export incentives and import barriers from rent-seeking
industries with low potential to generate dynamic externalities if the industrial policy
theory is correct. However, regardless of which theory is right, both actions should
be undertaken because they both enhance China’s economic welfare, with one of
them also lowering the probability of a trade war with the United States. We will
discuss the details of each action in the last section of this chapter.
8. The hardware reform agenda
We had identified earlier the deleterious consequences of the administration of the
emergency-room medicine of large-scale SCB-funding of hastily approved SCE
projects. We would like to recommend that the present slowdown in June 2012 be
dealt with by unleashing two new interrelated growth drivers that would minimize
the trade-off between full utilization of existing production capacity and viable long-
term growth of production capacity, and they are (1) the creation of more new
private entrepreneurs; and (2) urbanization according to the principle of future home
ownership.The state can partly offset the expanded state sector by mobilizing the inland
migrant workers (nongmin gong) laid-off from the coastal provinces into an
entrepreneurial force. Many of the nongmin gong have sufficient work experience to
start their own factory-workshops to take advantage of the increased cost
competitiveness of the inland provinces created by the explosive extension of the
national transportation network during the GFC. Because the primary barrier to
the emergence of this group of owner-operators is the availability of credit, the
government should legalize small and medium private banks as they have
comparative advantage over the four large state banks in catering to the needs of
these new entrepreneurs.40 Farmland should also be privatized so that the new
businesses can have the collateral to access credit from the new private banks. The
creation of a new large group of private entrepreneurs will bring three major benefits
(1) expenditure by this new group will substitute for the present macro-stimulus
programme in keeping aggregate demand high; (2) private firms are likely to have
higher productivity growth than SCEs; and (3) these small and medium private
enterprises will be more labour-intensive than SCEs.
Journal of Chinese Economic and Business Studies 327
Dow
nloa
ded
by [
Win
g T
hye
Woo
] at
04:
06 1
6 N
ovem
ber
2012

The second new growth driver would be urbanization based on the principle of
affordable future home ownership. The fast growth of the real estate sector, not only
recently but also over the last decade, reflected not just speculative demand but also
genuine pent-up demand for housing and genuine accommodation of the high rate of
the joint industrialization-urbanization process.41 The bulk of the new arrivals from
the countryside cannot qualify for bank mortgages, and so many investors have been
buying multiple housing units to rent to the new arrivals with the intention of raising
the rents over time in line with the income growth of the renters. In this sense, much
of the recent housing demand has been speculative.We propose that China studies the low-cost public housing schemes in Hong
Kong and Singapore and establishes a national housing programme where the new
arrivals would rent homes for seven years and then have the first right to buy these
units at a price based on construction costs. China can afford a massive public
housing programme because the expensive part of such programmes in other
countries is the cost of land and not the cost of the structures, and land in China is
mostly owned by the state.42
Our proposed ‘future-ownership’ form of urbanization will support China’s
growth in three ways (a) the maintenance of real estate investment to supply the
needed housing and to help maintain existing level of aggregate demand (b)
the redirection of bank loans to new rural migrants, with the new housing agency as
the intermediary, to prevent the appearance of NPLs; and (c) this housing scheme
will redistribute income to the rural migrants (which helps in reducing the threat of
software failure), with the positive side-effect that consumption would rise to help
offset the elimination of the macro-stimulus programme.We note that the first new growth driver and second new growth are mutually-
reinforcing. The new enterprises of the former rural migrants would inevitably be
located in or near towns and cities to take advantage of infrastructure and positive
spillovers from agglomeration. We also note that the main institutional adjustments
that must be made to enable the working of the second new growth driver are the
same that would help the development of the first new growth driver: privatization of
farmland, termination of the household registration system, and liberalization of the
financial system. In brief, China now needs to move from macro-stabilization to
macro-sustainability; the 2009–2010 type of macro-stimulus cannot produce
sustainable growth, only economic reforms can do so.
9. The software reform agenda
We agree with the CPC that the probability of a software failure is higher than the
probability of a hardware failure. The former is easier to deal with because, for most
hardware problems, China can learn from the experiences of the rest of the world,
especially those of the richer countries in East Asia, as long as ideological constraints
on methods of economic management continue to wither. The 1868 insight of the
Meiji reformists that success in economic catch-up largely involves a willingness to
adopt and adapt to ‘best international practices’ will continue to apply to China until
its per capita GDP converges with that of Japan and Western Europe.
328 W.T. Woo
Dow
nloa
ded
by [
Win
g T
hye
Woo
] at
04:
06 1
6 N
ovem
ber
2012

Dealing with software failure is harder than dealing with hardware failure for twomajor reasons. The first is that policymaking in China has become more challengingbecause popular expectations of administrative performance have risen dramaticallywith income growth and, more importantly, with increasing knowledge of theoutside world. In this new situation, the greater use of democratic procedures, theestablishment of an independent judiciary, and the restoration of a free press mightbe inevitable if China is to successfully accommodate the rising social expectationsand mediate the emerging differences in social expectations. A Chinese governmentthat consistently fails to deliver progress toward the Harmonious Society vision fastenough to catch up with the rise in social expectations runs an increasing risk ofsocial instability.
The second reason for why fixing software failures is more difficult is thatsuccessful reconfiguration of the administrative software requires not just highlydeveloped political skills but favourable circumstances in the domestic political arenaand a benign international environment – both of which are normally beyond thereach of most politicians. What happens in the future will depend on whether theCPC is politically skilful enough to lead the transition to the democratic, equitable,and law-based Harmonious Society and emerge afterwards as the most importantpolitical force. The practical issue is whether the CPC can do a better job in politicaltransition than the Kuomintang did in Taiwan during 1983–88.
10. Dealing with power supply failure caused by environmental degradation
Effective policy-making on the environmental front is a very difficult task becausemuch of the science about the problem is not known. For example, if the change inChina’s rainfall pattern is indeed due to China-emitted black carbon pollution, thenChina must no longer select its water strategy and it energy strategy separately. Asystems approach to policymaking is necessary because the interaction among theoutcomes from the different sectoral policies can generate serious unintendedenvironmental damage. A sustainable development policy would require a completerethinking about the location of population centres and the types of enhancedinternational cooperation on global environmental management.
In discussing the environmental aspects of the water transfer plan, it is importantto note that there is now an open controversy in China involving a key governmentinfrastructure project, and that this controversy is not limited to members of thetechnocracy. The very public nature of the controversy, and the involvement of morethan just scientists, engineers and economists in it, reveals how very far social attitudeshave progressed. The important point is that this change in social expectations willrequire any government in China to live in harmony with nature. However, anygovernment will have great difficulties in doing so even if it wants to because a green-growth policy involves a systems approach, and scientific understanding of manyecological sub-systems and the nature of their interactions is still rather incomplete.
The global environment is an important area in which China can help to build aharmonious world system.43 Specifically, China should be mobilizing internationalconsensus to form an international research consortium to develop ways to burn coalcleanly because China is now building a power station a week and is hence able to
Journal of Chinese Economic and Business Studies 329
Dow
nloa
ded
by [
Win
g T
hye
Woo
] at
04:
06 1
6 N
ovem
ber
2012

facilitate extensive experimentation on prototype plants to burn coal cleanly.Furthermore, given the growing water shortages in China (especially in the north)and in many of its neighbouring countries, China should start a regional forum onthe joint use of water from the Tibetan plateau before the situation gets too critical.China should also be mobilizing an international scientific research effort on thedesalination of seawater for drinking. If global cooperation on clean energy researchand desalination research is successful, it will unleash sustainable development on thewhole world.
11. Dealing with power supply failure caused by trade protectionism
Finally, we consider how to reduce the probability of the speeding car (that is China)crashing into a road block that takes the form of foreign trade sanctions. It should beimmediately noted that a trade imbalance reflects the economic situation in twocountries: China could not have over-saved if the US had not under-saved. USprofligacy is just as much to be blamed for the trade tensions as Chinese thriftiness,e.g. even today, the US government does not have a credible plan to reduce itsbudget deficit upon the recovery of the economy. The straightforward implication isthat a fair solution to any desired reduction in the trade imbalance would requirecorrective measures to be implemented by both China and the US.
Given that the trade imbalances are produced by a host of factors, anotherstraightforward implication is that the efficient solution will employ more than onepolicy instrument for the task. There would not just be an appreciation of the RMBagainst the USD but also equally large changes in policy measures such as thelowering of Chinese trade barriers, the adoption of a budget deficit reduction by theUS, and expansion of the trade credit facilities of the US ExIm Bank to promote USexports.
What is to be done in China? It is most unfortunate that the trade imbalance issuehas focused overwhelmingly on the amount that the Chinese yuan ought toappreciate.44 It is now forgotten that the much-praised Plaza Accord of September1985, which engineered a sharp appreciation of the Japanese Yen, caused so muchinstability in global financial markets that it became a museum piece after only 17months(!) with the hurried signing of the Louvre Accord in February 1987. As theworld is currently only beginning to get over the trauma of the Global FinancialCrisis of 2008–2009, it verges on irresponsibility to now push China to impart a PlazaAccord-type of shock to the financial markets.
More importantly, the effectiveness of a large appreciation of the RMB–USDexchange rate in reducing the US trade deficit is suspect outside of the textbooksituation of a two-country world. When the Yen–USD exchange rate went from238.5 Yen/USD in 1985 to 128.2 Yen/USD in 1988 (an appreciation of 86% by theIMF definition), the overall US and Japanese trade imbalances saw only smallimprovements. The US trade deficit improved very little when direct Japaneseexports became drastically more expensive in the US market after 1985 because (1)US customers reacted by switching their purchases to similar imports from thirdcountries; and (2) Japanese businesses relocated their production to other Asiancountries and serviced the US market from there.
330 W.T. Woo
Dow
nloa
ded
by [
Win
g T
hye
Woo
] at
04:
06 1
6 N
ovem
ber
2012

Since over 60% of Chinese exports are produced in factories with foreigninvestment, many of these foreign investors would relocate their operations to otherparts of the world if the RMB were to duplicate the dramatic 1985–1988 appreciationof the Yen. Unless accompanied by US actions to raise its low private savings rateand to cut its budget deficit, a second Plaza Accord is unlikely to diminish the UStrade deficit adequately and its primary consequences would be a reconfiguration ofthe sources of US borrowing from abroad, and a new round of global financialmarket instability.
We had outlined earlier the financial market theory and the industrial policytheory about China’s chronic surplus. We are persuaded that, because thedevelopment of the financial sector and the elimination of subsidies-tariffs motivatedby rent-seeking would increase economic efficiency independently regardless of theimpact of each on the trade balance, we should implement both actions. We proposea policy package with three components. First, the steady process of yuanappreciation that begun in July 2005 should be continued, and should also beused more aggressively as an anti-inflation instrument.
Second, import liberalisation should be accelerated and expanded beyond WTOby greatly increasing some new types of imports, e.g. educational services andtourism. With its huge foreign exchange reserves, China should have expanded itsscholarship and student loan programmes tremendously to enable the large numberof qualified Chinese to go abroad to receive better university-level training. It hasbeen a failure of the imagination that China has not increased this method ofimporting human capital prodigiously for productive purposes.
Furthermore, China should recognize that its large indigenous innovationprogramme to incubate high-tech industries has, in fact, been an inequitablemechanism that transfers income from the customers to the makers of the productscovered in the programme. The global experience with indigenous innovationprogrammes has mostly been a negative one. Most of the industries they spawnednever became internationally competitive, showing that most indigenous innovationprogrammes are based either on a misguided sense about the possibilities from‘learning-by-doing’ or on rent-seeking motives. Given this global experience, Chinacould drastically reduce the size of its extensive indigenous innovation programmewithout hurting its capability in technological upgrading.
The third component of China’s trade-imbalance-reduction package is toestablish an improved mechanism for coordinating private savings and privateinvestments. The establishment of a modern financial system will not only achievethe objective of intermediating all of domestic saving into domestic investment, it willalso enhance welfare and lower the savings rate by pooling risks through vehiclessuch as medical insurance and pension insurance. We note that financial sectordevelopment will also help the two new growth drivers of the hardware reformpackage (new entrepreneurs and urbanization) to work better.
So far, we have stressed that US–China trade tensions would be lowered muchmore if both countries undertake corrective policies rather than if China acted alone,and that a wider range of policy instruments should be employed (e.g. budget deficitreduction in US, and import deregulation in China) rather than relying just onexchange rate adjustment alone. We now want to stress that the US and Chinashould also work together to prevent the GATT-WTO free-trade regime from
Journal of Chinese Economic and Business Studies 331
Dow
nloa
ded
by [
Win
g T
hye
Woo
] at
04:
06 1
6 N
ovem
ber
2012

weakening. Specifically, China has benefited immensely from the WTO system, and
yet it has, up to this point, played a very passive role in pushing the Doha Round
negotiations forward to completion. By default, Brazil and India have assumed the
leadership of the developing economies camp in the trade negotiations. According to
Susan Schwab, the US Trade Representative, at the G4 (US, EU, Brazil and India)
meeting in Potsdam in June 2007, Brazil and India retreated from their earlier offers
to reduce their manufacturing tariffs in return for cuts in agricultural subsides by the
developed economies because of ‘their fear of growing Chinese imports.’45
With the US weakening in its resolve to protect the multilateral free trade system,
China should now become more active in the Doha Round negotiations to
deregulate world trade further. Such a role will be very much in China’s interest
because Brazil is now bypassing multilateral trade liberalization by entering into
FTA negotiations with the European Union. The fact is that a growing number of
nations like Brazil ‘are increasingly wary of a multilateral deal because it would
mandate tariff cuts, exposing them more deeply to low-cost competition from China.
Instead, they are seeking bilateral deals with rich countries that are tailored to the
two parties’ needs.’46 It is the time for China to show that it is a responsible
stakeholder by joining in the stewardship of the multilateral free trade system. Such
an international stance would also reduce the threat of this type of power supply
failure to China’s own growth.
12. Final remarks
China has now achieved middle-income status through the marketization and
internationalization of its economy. Our assessment is that the continued high
growth rates that will enable China to catch up with the rich economies can be
generated only if China adopts a new development strategy. This new development
strategy is based not only on the recognition that the marketization and
internationalization processes have to be deepened and made more comprehensive,
but also on the recognition that China has now become an important shaping force
of the global economy (e.g. see McKibbin and Woo 2003), and Chinese civil society
has come to possess more and more of the middle-class aspirations common in the
industrialized world.China must not only build a stronger economic hardware with measures such as
labour market deregulation, land privatization, future-ownership-based urbaniza-
tion, and financial sector development, China must also create a harmonious society
as a primary internal objective and help establish a harmonious world as a primary
external objective. The administrative software that will allow the achievement of a
harmonious society will require an increasing use of free elections, monitoring by a
free press, and adjudication by an independent judiciary. China must start
adopting the global perspective that is required of a world leader who will work
for the protection of the global environmental commons, the global trading system,
and global security, in order to ensure that China’s convergence to high income-
hood is not foiled by the physical environment or the international political
environment.
332 W.T. Woo
Dow
nloa
ded
by [
Win
g T
hye
Woo
] at
04:
06 1
6 N
ovem
ber
2012

Acknowledgements
I am grateful to Yue Ximing for sharing with me his estimates of the rural poverty rate underdifferent poverty lines, and to Wang Liming, Lu Ding, Jane Golley, Yuan Zhigang and ZhangLiqing for their valuable comments on an earlier draft of this paper.
Notes
1. The ranking of income level and growth performance in 1870 and 1913 is restricted to the65 countries in the Maddison (2010) dataset that reported GDP per capita in 1913.
2. Of course, the optimistic expectations about Argentina on the eve of the First World Warwere typical of the joie de vivre of that time. Norman Angell (in The Great Illusion, 1913)had famously predicted that deep economic integration had rendered war among theEuropean powers obsolete because of the huge costs that would be incurred by the victorsand the losers. Angell was awarded the Nobel Peace Prize in 1933.
3. We will use the three terms ‘income’, ‘GDP per capita’, and ‘standard of living’interchangeably in this paper.
4. To minimize noise in the ranking, the value of CUI in any year could be replaced by amoving average centred on that year. In the graphs, we will use a five-period movingaverage centred on the designated year.
5. Woo (2011) finds that the list of countries in each category is almost unchanged when thecut-off scores are set at 60% for high and middle, and 15% for middle and low.
6. The movement of Japan’s CUI is very much what we expected based on the behaviour ofthe CUIs of the large high-income countries. Although Japan’s CUI value in 2008 (73.2)was the same as in 1973, it is still higher than the 2008 values of the CUIs of France (71.3),Germany (66.7), and Italy (63.9).
7. The proposed harmonious socialist society would encompass a democratic society underthe rule of law; a society based on equality and justice; an honest and caring society; astable, vigorous and orderly society; and a society in which humans live in harmony withnature.
8. ‘Today’ refers to August 2012, the time of submission of this article.9. One should really use the consolidated debt of the state sector because it includes at least
some part of the contingent liabilities (e.g. foreign debts of state-controlled enterprisesand banks, and unfunded pension schemes in the state sector) that the state might have toassume responsibility for when the state-owned units default on their financialobligations.
10. f has been above 1.5% for the past seven years. r was 4% in the past only because theinterest rate was regulated. I think that the implementation of financial deregulation thatis necessary for normal healthy development of the financial sector will render r to be atleast 6% because (1) according to Solow (1991), the stylized fact for the real interest ratein the United States is that it is 5 to 6%; and (2) both the marginal rate of return to capitaland the black market loan rate have been more than 20%.
11. See Notes 13 and 14, and their associated sentences.12. State-controlled firms include state-owned firms and publicly-listed firms where the state
and its intermediaries hold the controlling share.13. ‘China finds huge fraud by officials,’ The New York Times, 30 December 2009.14. See, for example, ‘Is China’s economy speeding off the rails?’ The New York Times, 23
December 2009; ‘China: No one home,’ Financial Times, 21 February 2010; ‘China auditfinds misuse of funds tied to stimulus,’ Financial Chronicle, 29 December 2009, http://www.mydigitalfc.com/news/china-audit-finds-misuse-funds-tied-stimulus-821; and‘China boosts auditors’ power as stimulus package spending prompts corruptionconcerns,’ People’s Daily, 21 February 2010, http://english.peopledaily.com.cn/90001/90776/90785/6898354.html
15. The 51% figure is from combining information in Shih (2010), who reported the debt ofthe central government to be 20% of GDP, with the information in the Financial Times
Journal of Chinese Economic and Business Studies 333
Dow
nloa
ded
by [
Win
g T
hye
Woo
] at
04:
06 1
6 N
ovem
ber
2012

(‘China warned of growing ‘‘land loan’’ threat,’ 28 March 2010) that the national totalfigure was 71%.
16. For example, ‘China is heading for a Japan-style bubble,’ Financial Times, 2 November,2009; and ‘Contrarian investor sees economic crash in China,’ The New York Times,8 January 2010.
17. Herrala and Jia (2012) found that bank loans to non-state firms were drastically curtailedfrom 2004 onward.
18. ‘Communist party needs to loosen its grip on China,’ The New York Times, 2 March 2010.This debate over the growth of the state firms at the expense of private ones is conductedover the heading of guojin mintui (the state sector advances, and the private sectorwithdraws).
19. ‘China tells banks to restrict loans to local governments,’ The New York Times, 25February 2010.
20. In 2009, land prices had gone up 200% in Shanghai, 400% in Guangzhou, and 876% inWenzhou; ‘China: No one home,’ Financial Times, 21 February 2010.
21. William Kazer, ‘China PMI falls, points to need for stimulus,’ Wall Street Journal, 21June 2012; Reusters, ‘China data show drops in exports and prices,’ International HeraldTribune, 22 June 2012; and Keith Bradsher, ‘Chinese data mask depth of slowdown,executives say,’ New York Times, 22 June 2012.
22. See, for example, Woo et al. (2004), and Demurger et al. (2002).23. The poverty rates reported in this section are based on 1985 PPP US$. The poverty rates
reported here are from a private communication from Ximing Yue of Renmin University.24. In the 1985–1987 period, China’s Gini coefficient was below 0.3. An Asian Development
Bank (2007) study on income inequality in 22 Asian countries over the 1992–2004 periodfound that for 2004, only Nepal had a Gini coefficient (47.30%) that was higher thanChina’s (47.25). However, in 2004, China’s income ratio of the richest 20% to the poorest20% (11.37) was the highest in Asia; significantly higher than the next highest incomeratio (9.47 for Nepal). China is probably the most unequal country in Asia today.
25. ‘750,000 a year killed by Chinese pollution,’ Financial Times, 2 July 2007. 350,000 to400,000 died prematurely from air pollution in Chinese cities, 300,000 from poor airindoors, and 60,000 (mostly in countryside) from poor-quality water.
26. ‘OECD highlights Chinese pollution,’ Financial Times, 17 July 2007.27. ‘Top official warns of looming water crisis,’ South China Morning Post, 7 November 2006.28. ‘Northern cities sinking as water table falls,’ South China Morning Post, 11 August 2001.29. ‘Northern China sinking . . . as the south rises,’ The Straits Times, 18 March 2002.30. The National Development and Reform Commission (2007) reported: ‘The regional
distribution of precipitation shows that the decrease in annual precipitation wassignificant in most of northern China, eastern part of the northwest, and north-easternChina, averaging 20� 40mm/10a, with decrease in northern China being most severe;while precipitation significantly increased in southern China and south-western China,averaging 20� 60mm/10a.’
31. There is now persuasive evidence that China’s voluminous emission of black carbon(particles of incompletely combusted carbon) has contributed significantly to the shift to aclimate pattern that produces northern droughts and southern floods of increasingintensity; Streets (2005).
32. ‘Ambitious canal network aims to meet growing needs,’ South China Morning Post, 27November 2002.
33. ‘Massive scheme aims to quench China’s thirst,’ Financial Times, 26 July 2004; a lowerestimate of 300,000 is given in ‘China will move waters to quench thirst of cities,’ NewYork Times, 27 August 2002.
34. ‘China’s river plan worries India,’ Times Of India, 23 October 2006.35. ‘12th Five Year Plan hailed as ‘‘Greenest FYP in China’s history’’’ (Posted Tuesday,
2011-04-12 14:54 by China Briefing); http://deltabridges.com/news/prd-news/12th-five-year-plan-hailed-%E2%80%98greenest-fyp-china%E2%80%99s-history%E2%80%99
36. Krishna Guha, ‘Paulson says crisis sown by imbalance.’ Financial Times, 1 January 2009:http://www.ft.com/cms/s/0/ff671f66-d838-11dd-bcc0-000077b07658.html
334 W.T. Woo
Dow
nloa
ded
by [
Win
g T
hye
Woo
] at
04:
06 1
6 N
ovem
ber
2012

37. ‘Winter Institute: China and U.S. joined at the hip,’ St. Cloud State University newsrelease, Monday, 2 March 2009, http://www.stcloudstate.edu/news/newsrelease/default.asp?storyID=28126
38. ‘China-centric’ because they ignore the obvious fact that the current account balance isalso determined by US conditions.
39. See Woo (2008). Savings behaviour is not independent of the sophistication of thefinancial system. An advanced financial system will have a variety of financial institutionsthat would enable pooling of risks by providing medical insurance, pension insurance,and unemployment insurance; and transform savings into education loans, housing loans,and other types of investment loans to the private sector. Ceteris paribus, the moresophisticated a financial system, the lower the savings rate.
40. The system of prudential supervision must also be strengthened, and the interest rate bederegulated.
41. If speculative demand had been the overwhelmingly dominant cause for the propertyboom, then house rents would not have risen substantially (because the speculativeinvestors would tend to rent out their extra units). Instead, rent in Beijing in March 2010was 19.6% above March 2009; see ‘Survey shows house prices still too high,’ China Daily,12 May 2010: http://www.chinadaily.com.cn/metro/2010-05/12/content_9839054.htm
42. It should be noted that (a) housing construction is relatively labour-intensive, and thathome decoration is highly labour-intensive; and (b) that the local governments musthence replace land sales with property taxes as an important source of revenue.
43. See McKibbin, Wilcoxen, and Woo (2008) for an example of an efficient global CO2
emission compact that China and the rest of the world could adopt.44. The only economically meaningful definition of the equilibrium exchange rate is the
market-clearing exchange rate produced in the absence of intervention by any centralbank. This market-clearing exchange rate is characterized by the balance of paymentsposition being zero and not by the trade account balance (or the current account balance)being zero or being at some a priori value. This means that the notion of exchange ratemisalignment that is based on the proposed concept of the Fundamental EquilibriumExchange Rate (FEER) is analytically vacuous because the FEER is not identical to themarket-clearing exchange rate.
45. ‘Schwab surprised by stance of India and Brazil,’ Financial Times, 22 June 2007; and‘China’s shadow looms over Doha failure,’ Financial Times, 22 June 2007.
46. ‘Brazil, others push outside Doha for trade pacts,’ The Wall Street Journal, 5 July 2007.
References
Angell, N. 1913. The great illusion; a study of the military power to national advantage, 4threvision and enlarged edition. New York and London: G.P. Putnam & Sons.
Asian Development Bank. 2007. Key Indicators: Inequality in Asia. Asian Development Bank.Demurger, Sylvie, Jeffrey D. Sachs, Wing Thye Woo, Shuming Bao, Gene Chang, and
Andrew Mellinger. 2002. Geography, economic policy and regional development in
China. Asian Economic Papers 1, no. 1: 146–97.Herrala, Risto and Yandong Jia. 2012. Has the Chinese growth model changed? A view from
the credit market. Bank of Finland’s Institute of Economies in Transition (BOFIT)Discussion Paper No. 5/2012.
Lardy, Nicholas R. 1998. China’s unfinished economic revolution. Washington, DC: BrookingsInstitution.
Maddison, Angus. 2010. Statistics on world population, GDP and per capita GDP, 1-2008 AD.Excel spreadsheet downloaded from: http://www.ggdc.net/MADDISON/oriindex.
htmthat (accessed 7 January 2011)
McKibbin Warwick, J., and Wing Thye Woo. 2003. The consequences of China’s WTOaccession on its neighbours. Asian Economic Papers 2, no. 2: 1–38.
Journal of Chinese Economic and Business Studies 335
Dow
nloa
ded
by [
Win
g T
hye
Woo
] at
04:
06 1
6 N
ovem
ber
2012

McKibbin, Warwick J., Peter J. Wilcoxen, and Wing Thye Woo. 2008. China can grow andhelp prevent the tragedy of the CO2 commons. In China’s dilemma: Economic growth,the environment, and climate change, eds. Ligang Song and Wing Thye Woo, 190–225.Asia Pacific Press, Brookings Institution Press, Social Science Academic Press.
National Development and Reform Commission. 2007. China’s national climate changeprogramme, June.
Shih, Victor. 2010. China’s 8,000 credit risks. The Wall Street Journal, 8 February.
Solow, Robert. 1991. Sustainability: An economist’s perspective. The 18th J. Seward JohnsonLecture to the Marine Policy Center, Woods Hole Oceanographic Institution. Publishedin Robert N. Stavins. 2000. Economics of the environment: Selected readings, 4th edn,
131–8. W.W. Norton, New York.Streets, David. 2005. Black smoke in China and its climate effects. Asian Economic Papers 4,
no. 2: 1–23.
Wang, Xiaolu, and Wing Thye Woo. 2011. The size and distribution of hidden householdincome in China. Asian Economic Papers 10, no. 1: 1–26.
Woo, Wing Thye. 2006. The structural nature of internal and external imbalances in China.Journal of Chinese Economic and Business Studies 4, no. 1: 1–20.
Woo, Wing Thye. 2008. Understanding the sources of friction in U.S.-China trade relations:The exchange rate debate diverts attention away from optimum adjustment. AsianEconomic Papers 7, no. 3: 61–95.
Woo, Wing Thye. 2011. Understanding the middle-income trap in economic development:The case of Malaysia. Invited World Economy Lecture delivered at the University ofNottingham, Globalization and economic policy (GEP) conference, Globalization trends
and cycles: The Asian experiences, Semenyih, Selangor, Malaysia, 13 January 2011.Available at http://www.nottingham.ac.uk/gep/documents/lectures/world-economy-asia-lectures/world-econ-asia-wing-thye-woo-2011.pdf
Woo, Wing Thye, Shi Li, Ximing Yue, Harry Xiaoying Wu, and Xinpeng Xu. 2004. The
poverty challenge for China in the new millennium. Report to the Poverty ReductionTaskforce of the Millennium Development Goals Project of the United Nations.
336 W.T. Woo
Dow
nloa
ded
by [
Win
g T
hye
Woo
] at
04:
06 1
6 N
ovem
ber
2012