china labour migrant jan 5 cs
TRANSCRIPT

8/6/2019 China Labour Migrant Jan 5 Cs
http://slidepdf.com/reader/full/china-labour-migrant-jan-5-cs 1/29
ANALYST CERTIFICATIONS AND IMPORTANT DISCLOSURES ARE IN THE DISCLOSURE APPENDIX. FOR OTHER
IMPORTANT DISCLOSURES, PLEASE REFER TO https://firesearchdisclosure.credit-suisse.com.
China: The turning point of the labour market
Emerging Markets Economics Asia
• Labour force growth has been critical to China’s economic success and
development over the past three decades. In our view, the Chinese economy
is standing at a historical turning point. This is the beginning of the end of an
era – China as the world’s factory. This is the beginning of the end of an era –
China as the anchor of global disinflation.
• China’s labour force and population growth are falling, as shown in Exhibit 1.
Labour force and population growth are projected to turn negative beginning
in 2017 and 2032, respectively. Additionally, China faces large increases in
labour demand, which will lead to a net labour shortage, in our view.
• We project that China will remain a labour surplus country until about 2014,
but that surging demand from the service sector and reluctance of workers to
leave the rural sector will make labour supply appear to be more stretched at
the low end of the labour market. We forecast that the labour demand-supply
gap will be 17.6 million in 2017, as shown in Exhibit 2. This gap of 17.6 million
is equivalent to 11% of the current labour force of the US, 27% of Japan's
labour force and 41% of Germany’s labour force.
• The sharp turning of China’s labour market will not only redefine China’s own
growth model, production, consumption and income distribution, but will also
have a major impact on inflation, financial prices and the manufacturing
outsourcing model for the rest of the world.
Exhibit 1: Population and labour growth Exhibit 2: Total labour supply and demandRate per annum (%) – UN, ILO Projections after 2008 (In millions) – Credit Suisse Projections after 2009
-0.5
0.0
0.5
1.0
1.5
2.0
2.5
3.0
3.5
1980 1985 1990 1995 2000 2005 2010 2015 2020
Population
Labour Force
Forecast
600
650
700
750
800
850
1990 1993 1996 1999 2002 2005 2008 2011 2014 2017
Labour Supply
Labour Demand
Gap:
17.6 million
Forecast
Source: UN, ILO, Credit Suisse Source: UN, ILO, China Labour Statistical Yearbook (2009), China Statistics Yearbook
(2010), Credit Suisse forecasts
05 January 2011Economics Research
http://www.credit-suisse.com/researchandanalytics
Contributors
Dong Tao
+852 2101 7469
Amlan Roy
+44 20 7888 1501
Sonali Punhani
+44 20 7883 4297
Liyan Shi
+44 20 7883 7523
Christiaan Tuntono
+852 2101 7409

8/6/2019 China Labour Migrant Jan 5 Cs
http://slidepdf.com/reader/full/china-labour-migrant-jan-5-cs 2/29
05 January 2011
China: The turning point of the labour market 2
Executive Summary
• We estimate that migrant workers’ salaries will rise on average by 30%-40% in 2010,
and will likely rise by 20%-30% every year for the following three to five years. In our
view, the Chinese economy is standing at a historical turning point. This is the beginning
of the end of an era – China as the world’s factory. This is the beginning of the end of an
era – China as the anchor of global disinflation. It may take a decade for China to see its
export competitiveness erode, but we have seen the beginning of this happening.
• There is a sea change in thinking by the Chinese authorities about salary, in our opinion.
We think that in Beijing’s mind, while raising workers’ salary would reduce competitiveness
and the current account surplus, the benefits would go to Chinese workers. Real exchange
rate appreciation is a better policy option compared to nominal exchange rate
appreciation, through which the benefits will go to trading partner countries. While this
might add inflationary pressure, it could be a huge factor for strengthening domestic
demand and improving the equality of income distribution. Facing heightened cost
pressure, we think that some factories will close, and some will move out of China, but
most will stay, perhaps with many being relocated to inland areas.
• It is our view that China’s migrant worker market is turning, permanently. Since 2005,
the influx of migrant workers has been on the decline. In 2010, factories suddenly
noticed that it had become much harder to find workers, and a 30%-40% salary increase
was almost a must if they were to have any chance of capturing those still interested in
working in the coastal areas. This does not mean that China is suffering a net labour
shortage, but that the labour supply curve is showing a sharp upward trend – higher
salaries are needed in order to attract or incentivize more labour from the working age
population. The situation is expected to worsen, as the service sector attracts more and
more workers. As the inland economy expands and absorbs more labour locally, labour
shortages will likely become more acute at the low-end of the manufacturing sector,
which perhaps may become permanent in the coastal areas.
• China launched its birth control policy in the 1970s and made the ‘one-child policy’ official
in 1980. As the baby boomers enter their fifties and the one-child generation starts to
emerge as mainstream consumers, China is enjoying the last dividend of its demographic
profile – consumption. However, a downside to the shift in demographics has alsoemerged. China’s population growth declined from 1.42% pa in 1980-1985 to 0.63% pa,
currently. According to UN projections, Chinese population growth is expected to turn
negative from 2032 onwards, while China’s labour supply is projected to peak in 2017. The
pinch of labour shortages may get even stronger as demand rises quickly.
• A major swing factor in China’s long-term labour supply is urbanization. We believe that,
over the next two decades, industrialization will be achieved by bringing infrastructure
and credit to rural areas. Industrialization is likely to be localized, with more jobs being
created locally and villages transformed into towns. As urbanization takes place, we
expect a rapid rise in the urban population and a reduced supply of migrant workers. We
assume that the urban population will grow to one billion by 2025 in our projections.
• In this report, based on the theoretical framework of the Lewis model along with China’s
current economic and social trends, we projected labor demand and supply in rural and
urban China for the period 2009-2025. The overall labour supply in China is projected to
peak in 2017 and reach 809.2 million in 2025 from a current figure of 789.2 million. The
rural labour supply is projected to decline at an accelerating pace from 468.8 million in
2009 to 268.4 million in 2025. This is mainly due to outward migration into cities,
urbanization of rural areas, ageing, and increased education of the rural youth. The
urban labour supply is projected to increase from 320.4 million in 2009 to 540.7 million in
2025. We expect that inward migration from rural areas and conversion of villages into
towns will drive the increase.

8/6/2019 China Labour Migrant Jan 5 Cs
http://slidepdf.com/reader/full/china-labour-migrant-jan-5-cs 3/29
05 January 2011
China: The turning point of the labour market 3
• We project that overall labour demand will increase from 780 million (2009) to 857.1
million (2025). Labour demand growth in the next few years will likely be driven by a
massive expansion in the services sector and infrastructure investment, which will
accelerate the transition to a shortage of labour in the future. We estimate that urban
labour demand will rise from 311.2 million (2009) to 588.7 million (2025). This will mainly
be due to increased labour demand by urban services and conversion of villages into
towns, in our view.
• Overall, China appears likely to remain a labour surplus country until about 2014, after
which labour demand will surpass labour supply. We project a (labour demand minus
labour supply) gap of 17.6 million in 2017 that may increase to 47.9 million in 2025.
Effects of the labour shortage are already being felt in China with the rise in wages of
migrant workers. Labour shortages are accelerating at a pace that points to a net
shortage in the immediate future.

8/6/2019 China Labour Migrant Jan 5 Cs
http://slidepdf.com/reader/full/china-labour-migrant-jan-5-cs 4/29
05 January 2011
China: The turning point of the labour market 4
The beginning of the end of an era
We estimate that migrant workers’ salaries will rise on average by 30%-40% in 2010, and
will likely rise by 20-30% every year for the following three to five years. China’s migrant
workers, which account for 93% of the work force in the export sector, have been the pillar
of China’s manufacturing sector. In our view, the Chinese economy is standing at a
historical turning point. This is the beginning of the end of an era – China as the world’s
factory. This is the beginning of the end of an era – China as the anchor of globaldisinflation. It may take a decade for China to see its export competitiveness erode, but we
have seen the beginning of this happening.
In May 2010, it was widely reported that there were 13 cases of workers attempting to
commit suicide at a Hong Kong listed electronics company that is the largest exporter in
China. The company is the sole supplier of iPhones. While an iPhone was being sold for
$499 in the US, that company was paid only $8.47 for each iPhone assembled, according
to industry sources, which covered salaries, rents, shipping costs, and profits. This
highlights China’s awkward position in the global manufacturing sector. China has become
the world’s factory and products printed “made in China” have flooded the world’s
consumer markets. Yet, the benefits accruing to China have been limited, with even less
reaching Chinese workers. The tragic suicides have triggered nationwide debates about
China’s role in the world, workers’ compensation, and humane working environments. Theelectronics company mentioned above has reportedly now almost doubled its workers’
salaries and, since then, salary hikes have been widespread.
Exhibit 3: Minimum wage changes Exhibit 4: Income growth: urban vs rural growth
New minimum % change in 2010 from
City/Province wage (RMB per mth) previous minimum wage
Shanghai 1,120 16.7
Zhejiang 1,100 14.6
Guangzhou 1,030 19.8
Beijing 960 20.0
Tianjin 920 12.0
Dongguan 920 20.0Hainan 830 37.0
Qinghai 750 28.8
-5
0
5
10
15
20
25
1999 2001 2003 2005 2007 2009
Urban: annual income per capita (% yoy)
Rural: annual income per capita (% yoy)
Source: Various local governments, Credit Suisse Source: CEIC, Credit Suisse
It is important to note that salary increases have now transcended the migrant workers
market. Public servants, teachers and military staff have also seen a 20% wage hike on
average this year. The government has been encouraging SOEs (State Owned
Enterprises) to raise staff salaries, as well.
In 2010, all 31 provinces in China passed legislation to raise the minimum wage level. The
average magnitude of minimum salary increase was about 23%, while the inland
provinces saw a 30%-plus increase.
There is a sea change in thinking by the authorities in Beijing about salary, in our opinion.
In the past, the Chinese government had been very cautious and conscious about letting
salaries rise for reasons of competitiveness. But in recent years, Beijing has faced rising
international criticism for not allowing the RMB exchange rate to appreciate. By
appreciating the currency, China would likely see reduced export competitiveness and a
lower current account surplus, as export orders flow to the other countries. We think that in

8/6/2019 China Labour Migrant Jan 5 Cs
http://slidepdf.com/reader/full/china-labour-migrant-jan-5-cs 5/29
05 January 2011
China: The turning point of the labour market 5
Beijing’s mind, while raising workers’ salaries would also reduce competitiveness and the
current account surplus, at least the benefits would go to Chinese workers. While this
might add inflationary pressure, it could be a huge factor for strengthening domestic
demand and improving the equality of income distribution. Labour income as a percentage
of GDP has been on the decline for 21 consecutive years. In our opinion, Beijing has been
aggressive in pursuing real exchange rate appreciation, while being slow and reluctant to
address nominal exchange rate appreciation. Behind that, there is a (sensible) strategy for
economic transformation.
In our view, China is currently standing at a historical turning point. The beginning of the
end of an era has just started. The best time for China as the world’s factory is now behind
us. The best time for China as the anchor of global dis-inflation is now behind us. It may
take a long time for China’s export manufacturing empire to fall, but we are witnessing a
historical moment, in our opinion.
Will FDI stay?
In a recent Credit Suisse survey, 39% of executives from multinational corporates that
have direct investments in China said that they were extremely or very worried about
surging salaries, as against 18% who said the same about exchange rate appreciation.
Given the importance of FDI in China’s economic development, a crucial question is
whether this could trigger a massive exodus of foreign investments from China, or whether
companies will simply move to inland provinces where costs are cheaper.
Exhibit 5: Multinational corporate survey Exhibit 6: Foreign direct investment
On a scale of 1 to 5, how worried are you about the following issues over thenext 12 to 24 months?
18%
29%
46%
7%
39%
21%
29%
11%
29%
36%
32%
4%
0%
5%
10%
15%
20%25%
30%
35%
40%
45%
50%
Very worried Worried Somewhatworried
Not worried at all
Renminbi appreciat ion Wage pressure in China
Transport cost pressure
40
50
60
70
80
90
100
110
120
2003 2004 2005 2006 2007 2008 2009 2010
China: Actual FDI ($ bn, 12m rolling sum)
Source: Credit Suisse. Published in Executive Survey – The Rising Cost of Goods FromChina, 17 August 2010
Source: Ministry of Commerce, Credit Suisse
Facing heightened cost pressure, some factories will likely be closed and some will move
out of China, but we believe most will stay, perhaps with many being relocated to inland
areas. There are four reasons for our view:
1) The supply chain effect will prove to be powerful. For instance, between Kunshan and
Suzhou in Jiangsu province, there is an agglomeration of more than 40,000 electronics
component producers. Almost 70% of the laptops for the world’s market are assembled
there. A mini-truck with electronics components could reach the back-door of an
assembling factory in 15 minutes. Moving out of this area would be suicidal for an
electronics company that wants to be competitive in terms of its supply chain.

8/6/2019 China Labour Migrant Jan 5 Cs
http://slidepdf.com/reader/full/china-labour-migrant-jan-5-cs 6/29
05 January 2011
China: The turning point of the labour market 6
2) From freeway to port, from tax rebate to custom clearance, the efficiency in
infrastructure and government administration is unmatched by any other developing
country that is competing with China. Infrastructure developments such as the high-speed
rail network will further strengthen China’s advantage.
3) While China’s labour environment has tightened noticeably, it is still more pro-capitalist
than many competing countries, such as India, Indonesia, or even Vietnam.
4) The vast domestic market will be a magnet for foreign companies, especially at a timewhen economic growth and consumer demand are generally weak in the world economy.
Still, if migrant workers’ wages rise 20%-30% per year for consecutive years, as we predict,
it would be a huge challenge for export manufacturers to survive. We believe that when
production costs reach a certain threshold, some factories will likely close down or move
out of China, but most will likely move deeper into China. In other words, we think the fall
of China as the world’s factory is unlikely to be a straight-line process, but a step-by-step
process. Of course, China will climb up the export supply chain by producing higher value
added products, (e.g., automobile and telecommunication equipment), committing more
capital investment and introducing further production line automation (it will become easier
to execute when production lines are relocated to new areas), but we think a gradual
fading off of competitiveness is still likely.
A wide range of implications
First, we believe that Beijing has chosen a smart strategy for jump-starting domestic demand.
The rise in salaries means that consumers will have stronger purchasing power, which
should translate into rising domestic demand. This is a justified move after 20-plus
consecutive years of falling labour income as a percentage of GDP. The issue is not just one
of income distribution, but also social stability in the fastest growth economy in the world.
Second, rising wages are expected to create persistent inflationary pressure. As labour
shortages spread from the manufacturing sector to the service sector, the ability of
employers to pass on the increased cost pressure to the end-users increases.
Exhibit 7: World’s CPI inflation Exhibit 8: US and China current account balance
0
5
10
15
20
25
30
35
40
1990 1992 1994 1996 1998 2000 2002 2004 2006 2008 2010
World's CPI inflation (%)
-1,000
-800
-600
-400
-200
0
200
400
600
1991 1993 1995 1997 1999 2001 2003 2005 2007 2009
US current account balance ($ bn)
China current account balance ($ bn)
Source: IMF, Credit Suisse Source: CEIC, Credit Suisse
Third, the transition could be part of the solution to global rebalancing. Salary increases
and urbanization could well create the second ‘half a billion consumers’, on top of the ‘first
half billion’, which refer to urban white-collar workers. In our view, China’s ultimate
contribution to the global rebalancing story is through wage increases, or real exchange
rate appreciation, instead of nominal exchange rate appreciation.

8/6/2019 China Labour Migrant Jan 5 Cs
http://slidepdf.com/reader/full/china-labour-migrant-jan-5-cs 7/29
05 January 2011
China: The turning point of the labour market 7
Fourth, the global outsourcing model in the manufacturing sector that China perfected may
take a turn. There is no another China in the world, in terms of its pro-capitalist attitude,
disciplined workers, smooth infrastructure, and producers’ willingness to absorb rising
costs without raising prices. This may have a lasting impact on the global inflation outlook
in the long run.
Fifth, automation in the manufacturing sector may advance much quicker than before, with
the aim of dampening the effects of rising labour costs.
A stretched migrant worker market
It is our view that China’s migrant worker market is turning, permanently. Since 2005, the
influx of migrant workers has been on the decline. In 2010, factories suddenly noticed that
it had become much harder to find workers, and a 30-40% salary increase was almost a
must if they were to have any chance of capturing those still interested in working in the
coastal areas. Several reasons, in our view, contributed to the sudden shortage, which
started a few years earlier but was masked during the global financial crisis. We list the
reasons below:
a) The domestic sector is booming and is competing with the export sector for low-end
labourers. Cashiers, janitors and domestic helpers have much better working conditions
than factory workers who typically receive lower salaries, and who work longer hours and,often times, in hazardous or unsafe working conditions.
b) Jobs have become available nearer to home, so there is less need to travel to the
coastal areas for jobs. Infrastructure projects are spreading to rural areas and factories are
relocated to nearby locations.
c) Agricultural prices have surged and agricultural taxes have been removed. Farming
may generate lower income, but incomes are not a lot lower anymore, while the quality of
life is better staying at home.
d) The younger generation of migrant workers possesses IT skills and, hence, the market
has become more efficient in terms of information flow. Workers in Guangdong can quickly
learn about salaries in Tianjin through one SMS or email. This information transparency
drives up labor costs across the nation.e) Local governments have become more conscious about protecting labour rights.
Exhibit 9: Annual transfer of agriculture labour to non-agricultural activitiesMillions
-5
0
5
10
15
20
25
1980 1982 1984 1986 1988 1990 1992 1994 1996 1998 2000 2002 2004 2006 2008
Source: Dynamics of non-agricultural transfer of rural labour force in China (Yufen Tong, 2010), Credit Suisse
8/6/2019 China Labour Migrant Jan 5 Cs
http://slidepdf.com/reader/full/china-labour-migrant-jan-5-cs 8/29
05 January 2011
China: The turning point of the labour market 8
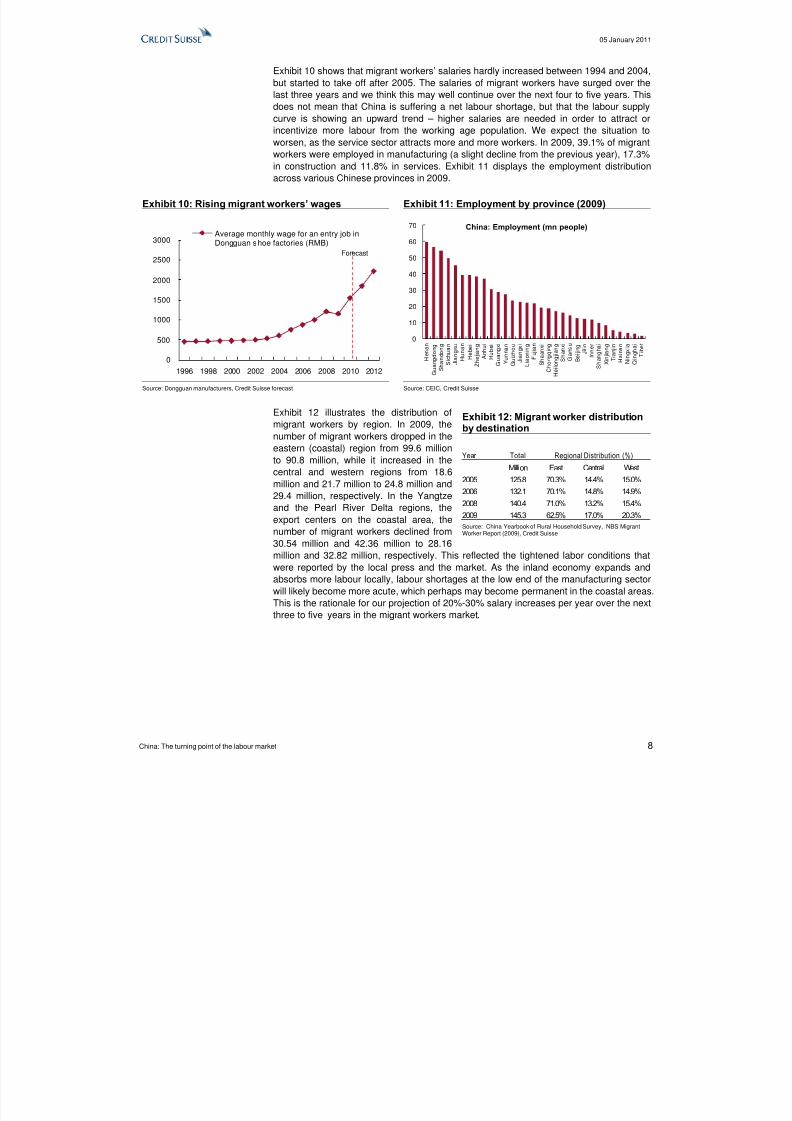
Exhibit 10 shows that migrant workers’ salaries hardly increased between 1994 and 2004,
but started to take off after 2005. The salaries of migrant workers have surged over the
last three years and we think this may well continue over the next four to five years. This
does not mean that China is suffering a net labour shortage, but that the labour supply
curve is showing an upward trend – higher salaries are needed in order to attract or
incentivize more labour from the working age population. We expect the situation to
worsen, as the service sector attracts more and more workers. In 2009, 39.1% of migrant
workers were employed in manufacturing (a slight decline from the previous year), 17.3%in construction and 11.8% in services. Exhibit 11 displays the employment distribution
across various Chinese provinces in 2009.
Exhibit 10: Rising migrant workers’ wages Exhibit 11: Employment by province (2009)
0
500
1000
1500
2000
2500
3000
1996 1998 2000 2002 2004 2006 2008 2010 2012
Average monthly wage for an entry job inDongguan shoe factories (RMB)
Forecast
China: Employment (mn people)
0
10
20
30
40
50
60
70
H e n a n
G u a n g d o n g
S h a n d o n g
S i c h u a n
J i a n g s u
H u n a n
H e b e i
Z h e j i a n g
A n h u i
H u b e i
G u a n g x i
Y u n n a n
G u i z h o u
J i a n g x i
L i a o n i n g
F u j i a n
S h a a n x i
C h o n g q i n g
H e i l o n g j i a n g
S h a n x i
G a n s u
B e i j i n g
J i l i n
I n n e r
S h a n g h a i
X i n j i a n g
T i a n j i n
H a i n a n
N i n g x i a
Q i n g h a i
T i b e t
Source: Dongguan manufacturers, Credit Suisse forecast Source: CEIC, Credit Suisse
Exhibit 12 illustrates the distribution of
migrant workers by region. In 2009, the
number of migrant workers dropped in the
eastern (coastal) region from 99.6 million
to 90.8 million, while it increased in the
central and western regions from 18.6
million and 21.7 million to 24.8 million and
29.4 million, respectively. In the Yangtze
and the Pearl River Delta regions, the
export centers on the coastal area, the
number of migrant workers declined from
30.54 million and 42.36 million to 28.16
million and 32.82 million, respectively. This reflected the tightened labor conditions that
were reported by the local press and the market. As the inland economy expands and
absorbs more labour locally, labour shortages at the low end of the manufacturing sector
will likely become more acute, which perhaps may become permanent in the coastal areas.
This is the rationale for our projection of 20%-30% salary increases per year over the nextthree to five years in the migrant workers market.
Exhibit 12: Migrant worker distributionby destination
Year Total Regional Distribution (%)
Million East Central West
2005 125.8 70.3% 14.4% 15.0%
2006 132.1 70.1% 14.8% 14.9%
2008 140.4 71.0% 13.2% 15.4%
2009 145.3 62.5% 17.0% 20.3%
Source: China Yearbook of Rural Household Survey, NBS MigrantWorker Report (2009), Credit Suisse

8/6/2019 China Labour Migrant Jan 5 Cs
http://slidepdf.com/reader/full/china-labour-migrant-jan-5-cs 9/29
05 January 2011
China: The turning point of the labour market 9
Exhibit 13: Migrant worker age distribution (2009)Exhibit 14: Urban and rural population pyramid(2008)
By age group Survey sample of 0.0887%
41.6%
20.0%
22.3%
11.9%
4.2%
0% 10% 20% 30% 40% 50%
16-25
26-30
31-40
40-50
50+
35,000 25,000 15,000 5,000 5,000 15,000 25,000 35,000
0-4
10-14
20-24
30-34
40-44
50-5460-64
70-74
80+
Rural Female Rural MaleUrban Fem ale Urban Male
Source:NBS Migrant Worker Report (2009), Credit Suisse Source: China Population and Employment Statistics Yearbook (2009), Credit Suisse
The key factors that will impact the prospects and realization of rural-urban migration are
the differences in terms of age distribution across rural versus urban regions, the
differences in hours worked, the wages, the inflation prospects and consumer, as well as
worker, preferences. We highlight some of these issues below.
In 2009, migrant workers worked 26 days per month and 58.4 hours per week on average,
compared with the legal working week of 44 hours. The average number of hours worked
per week was 58.2 in manufacturing and 58.4 in construction.
It is mainly young rural workers that are being employed in urban areas. In 2009, 41.6% of
migrant workers were aged 16-25 (Exhibit 13). In addition, 65.1% of migrant workers were
males. This somewhat reflects the hiring preferences of urban manufacturers and
construction firms, and, hence, points to the places where structural labour shortages exist.
It is also evident in the urban and rural population pyramid (Exhibit 14) that a large part ofworkers in the 20-34 age group have migrated from rural to urban areas. Anecdotally,
while there is still plenty of labour in the rural sector, people in the 20-34 age group are
much less visible in the countryside. In our view, this is one of the key reasons for the
disparity between the perception of abundant labour in rural areas and the reality of an
increasingly stretched migrant workers market.
Demographics cliff-fall: ‘one child policy’
China launched its birth control policy in the 1970s and made the ‘one-child policy’ official
in 1980. Sound economic policies obviously have played an important role in guiding the
economy from a backward-planned economy to the world’s second largest economy, but
demographics have run its course. The footprint of the baby boomer generation (born in
1955-1965) has matched the foot print of the Chinese economy – the production boom in
the 1990s, the housing boom in 2000s and recently the consumption boom.
As the baby boomers enter their fifties and the one-child generation starts to emerge as
mainstream consumers, China is enjoying the last dividend1 of its demographic profile –
consumption2. The baby boomer generation, parents of the one-child generation, are very
generous in helping their ‘only child’ in the family by assisting them in buying homes and cars,
1See Credit Suisse Demographics Research papers that highlight academic and policy research, whichattributes one third to 40 percent of GDP per capita growth in South and East Asia over last threedecades to the "Demographic Dividend"
2See Changing demographics and consumers: EMG6, Credit Suisse Demographic Research (2008)

8/6/2019 China Labour Migrant Jan 5 Cs
http://slidepdf.com/reader/full/china-labour-migrant-jan-5-cs 10/29
05 January 2011
China: The turning point of the labour market 10
which all ended up lowering the aggregate savings rate. The one child generation, on the other
hand, behave very much like the baby boomer generation in the US, who love to spend, chase
branded goods and hardly save. These basic characteristics are the foundation for our
optimism that China is transforming to a more consumption-driven economy.
However, a downside to the shift in demographics has also emerged. China’s population
growth declined from 1.42% pa in 1980-1985 to 0.63% pa, currently. According to UN
projections, Chinese population growth is projected to turn negative from 2032 onwards.The current population pyramid that captures the age structure in China is presented in
Exhibit 15. The highest proportion of the population currently belongs to the 15-24 years
and 35-44 years age groups. The share of the 65+ population is projected to increase from
a current level of 8.2% to 13.4% in 2025.
Exhibit 15: Population pyramid (2010) Exhibit 16: Labour force pyramid (2010)
(In thousands) (In thousands)
60,000 40,000 20,000 0 20,000 40,000 60,000 80,000
15-19
25-29
35-39
45-49
55-59
65+
Female Male
Source: Credit Suisse, UN Source: Credit Suisse, ILO
The ageing of the population will seep into the labour market, as well. As Exhibit 16 shows,
currently the highest proportion of the labour force belongs to 35-44 year age group. China’s
labour supply is projected to peak in 2017, as Exhibit 17 illustrates. The pinch of labourshortage may be felt even more strongly as a result of rapid labour demand increases.
Exhibit 17: Total labour supply(In millions) - Credit Suisse Projections after 2009
600
650
700
750
800
850
1990 1995 2000 2005 2010 2015 2020 2025
Forecast
Source: UN, ILO, China Labour Statistical Yearbook (2009), China Statistics Yearbook (2010), Credit Suisse Projections
80,000 60,000 40,000 20,000 0 20,000 40,000 60,000 80,000
0-4
10-14
20-24
30-34
40-44
50-54
60-64
70-74
80+
Female Male

8/6/2019 China Labour Migrant Jan 5 Cs
http://slidepdf.com/reader/full/china-labour-migrant-jan-5-cs 11/29
05 January 2011
China: The turning point of the labour market 11
Of course, this also has other implications for policy issues including fiscal burden,healthcare system challenges, and the need for a pension system, as the population willnot peak until 2032. While these issues are very important for China in the long run, theyare beyond the scope of this research note3.
Urbanization: two modelsA major swing factor in China’s long term labour supply is urbanization. Over the past two
decades, China’s industrialization model has been built on the strategy of drawing rurallabour to coastal areas. This strategy has made China the world’s factory. Urbanizationwas mainly achieved through absorbing rural people into cities. We believe that over thenext two decades, industrialization will be achieved by bringing infrastructure and credit torural areas. Industrialization is likely to be localized, with and more jobs being createdlocally and villages transformed into towns. This is an alternative model of urbanization. Itis worth noting that urbanization is one of the statistically significant variables explainingthe variation in Asian asset returns4.
Exhibit 18: Average wage levels by province (2009)
Source: China News Agency, CEIC, Credit Suisse
This suggests all of the following:(i) less labour will become available in coastal areas andcities; (ii) more income will be generated and consumed locally, and (iii) as villages aretransformed into towns, productivity will improve. As urbanization takes place, we expect arapid rise in the urban population and a reduced supply of migrant workers.
Urbanization is clearly China’s hope as a source of domestic demand. China hasdeveloped 500 million urban consumers over the past decade. There are more Buicksrunning on the Chinese streets than in the US now. Volkswagen has generated morerevenues from the Chinese market than the German market. China has the biggest mobilephone market in the world. Internet subscription is running at a pace equivalent to creatinga new UK market every year. The Chinese market will continue to grow, but we believe itwill be difficult for the market to double in size again soon.
3See Spotlight on Demographic Giants: China and India , Credit Suisse Demographics Research(November 2010) for a more detailed outlining and discussion of some of these issues
4See Regional Economic Outlook: Asia and Pacific , IMF (November 2008) for more details
57.8
43.927.8
28.1
30.5
30.5
25.9
24.8
58.3
35.2
36.6
28.7
28.4
24.2
29.4
26.9
26.5
26.5
36.5
27.3
24.8
30.5
Chongqin
28.1
27.4
26.2
45.3
29.6
26.7
32.5
32.9
27.6
China: Average salary
(Thousand RMB per year)

8/6/2019 China Labour Migrant Jan 5 Cs
http://slidepdf.com/reader/full/china-labour-migrant-jan-5-cs 12/29
05 January 2011
China: The turning point of the labour market 12
What China can do and, we believe, will do is generate the second 500 million consumersthrough urbanization. The success of the urbanization process will not be judged by howmany farmers come to town, but whether they will arrive with money in their pockets, inour view. We think the urbanization process will be handled gradually, but will still be hugein net terms – we forecast urbanization of 23.8 million people per year on average from2010-2025 to reach an urban population of one billion in 2025 (see Exhibit 19).
Exhibit 19: Urban and rural populations(In millions) - Credit Suisse Projections after 2009
200
300
400
500
600
700
800
900
1000
1990 1995 2000 2005 2010 2015 2020 2025
Urban Population Rural Population
Forecast
Source: UN, Credit Suisse Projections
Central to the migrant worker and urbanization phenomena in China is its ‘Urban-RuralDualism’5, one of the two pillars of the old planned economy, the other being ‘State-
Ownership’. The dualism mechanism is instituted through separate household-registryaccounts in urban and rural areas, where urban residents have access to social benefitsand rural residents have rights to land use. The dualist structure divides urban and ruralproduction, and limits the flow of resources. It further constrains rural productivityimprovements and is the root of the urban-rural inequality problem. We are now observinga burgeoning reform of ‘Urban-Rural Dualism’, involving the Hukou System and the LandSystem. We expect the Hukou System to be removed by 2020, and this should improvethe mobility of production factors including labour and land, transform small-scalehousehold-based agriculture production, and free up excess labour tied to agriculture.
The key to success will require Beijing to grant farmers the right to sell their homes in avillage or mortgage their farm land out for bank credit. Chinese urbanization patterns arevery different from India, Brazil or Russia. We shall discuss the details of urbanization in aseparate note later, but it is our view that urbanization is critical for the success of China’s
consumption-driven model. Another point to note is that urbanization does not necessarilymean that farmers will move into cities and create huge pressure on the mega cities, asexperienced in some Latin American countries and also in India. Urbanization in Chinamay mean converting villages into towns, in our opinion. That should lead to an upgrade ofthe rural areas, in terms of productivity, administrative efficiency, infrastructuredevelopment and economies of scale. This should also lead to a transformation in cultureand social structure in these areas. The gradual and planned process of urbanization islikely to help define the next phase and scale of future Chinese industrialization.
5See Yining Li, The Reform of the Rural-Urban Dualism , Journal of Peking University (2008)

8/6/2019 China Labour Migrant Jan 5 Cs
http://slidepdf.com/reader/full/china-labour-migrant-jan-5-cs 13/29
05 January 2011
China: The turning point of the labour market 13
Demographic Transition & Models of Sectoral LabourMigration
This section briefly discusses the theories of demographic transition and labour movement
in development economies. This is done so as to better understand the economic, social
and demographic changes in China, which have been described above.
The Demographic Transition model6
is a model of population change attributed to WarrenThompson. It represents the transition from high birth and death rates to low birth and
death rates as a country develops from a pre-industrial to an industrialized one. Stages of
the demographic transition theory are described in Exhibit 20 and according to this
framework, China is in Stage 3.
Exhibit 20: Demographic Transition Theory and its application to selected countries
Stages and Current Examples
USA, UK, France,Singapore, South Korea
India, Indonesia, Malaysia,Vietnam
Possible Stage 5
Death rates higher than birth rates
Very low birth rates
Declining population/ Ageing
Brazil, China, Thailand Japan, Germany
High birth rates
Large increase in population
Stage 4Low birth rates
Low death rates
Stable populationStable population growthStationary population numbers
Stage 1High & fluctuating death rates
High & fluctuating birth rates
Stage 3Falling death rates
Falling birth rates **
Stage 2Falling death rates*
Source: Credit Suisse, Demographic Transition Theory , John Caldwell (2006)
*Reasons- Improvements in food supply, sanitation, technology, basic healthcare and education**Reasons- Contraception, increases in wages, urbanization, reduction in subsistence agriculture, increase in the status and education of women, reduction in thevalue of children's work
While the demographic transition theory focuses on population structure changes, the
Lewis model (Sir Arthur Lewis, 1954) looks at labour structure and mobility across sectors
and has been one of the most influential models in development economics. At the core of
the Lewis model is labour market dualism i.e. the presence of two sectors: a ‘formal’,
‘industrial’ or ‘urban’ sector and an ‘informal’, ‘agricultural’ or ‘rural’ sector. Workers in the
formal sector earn higher wages than those in the informal sector.
The novel feature of Lewis’s framework was that the formal sector faces an unlimited
supply of labour as population is large relative to capital and natural resources. In the
informal sector, the marginal product of labour is zero or low. Employment in the formal
sector is determined according to the marginal product of labour. Those not employed in
the formal sector are assumed to take up employment in the informal sector. Thus, there is
no open unemployment, only underemployment.
When economic growth takes place, the marginal product of labour curve shifts rightward
and demand for workers increases in the formal sector. Workers are drawn out of the
informal sector into the formal sector and those who remain in the informal sector each
receive a higher income than before. The rising wage in the informal sector is a cause of
the unlimited supply of labour to the formal sector eventually running out due to improved
wage opportunities in the informal sector. Thus, as long as a labour surplus existed,
economic growth would generate intersectoral shifts of employment but little or no
increase in real wages in the formal sector. Once the unlimited supply of labour isexhausted and the turning point is reached, subsequent economic growth is marked by
rising real wages economy-wide. We have already discussed the emergence of this trend
in China7.
6See David Bloom, David Canning and Jaypee Sevilla, Economic Growth and the Demographic Transition , NBER Working Paper (December 2001)
7 See Gary Fields, Dualism in the Labour Market: A perspective on the Lewis model after half a century ,(2004) for more detailed discussion

8/6/2019 China Labour Migrant Jan 5 Cs
http://slidepdf.com/reader/full/china-labour-migrant-jan-5-cs 14/29
05 January 2011
China: The turning point of the labour market 14
Projections on demand and supply of labour
In an attempt to better understand the economic and social trends discussed above, as wellas trace their future evolution and dynamics better, we conducted an analysis based onprojecting labor demand and supply in rural and urban China over the period 2009-2025.
The labour supply picture
Labour supply is linked to economic activity rates and the 15+ population by the followingequation:
Labour supply = Economic activity rates8 × Population aged 15 years and above............(1)
Hence, in order to project urban and rural labour supply, we need to first understand thefuture evolution of activity rates and 15+ population in the respective areas.
The current economic activity rates across different age groups are presented in Exhibit21 below.
Exhibit 21: Age specific economicactivity rates Exhibit 22: Economic activity rates
(Age groups in years on X axis, Rates on Y axis) - 2009 (Rates) - Credit Suisse Projections after 2009
60.5%
94.4% 94.0%
49.2%
73.7%
0%
10%
20%
30%
40%
50%
60%
70%
80%
90%
100%
15-24 25-34 35-49 50+ Total
(15+)
60%
65%
70%
75%
80%
85%
1990 1995 2000 2005 2010 2015 2020 2025
Total Rural Urban
Forecast
Source: Credit Suisse, International Labour Organization Source: UN, ILO, China Labour Statistical Yearbook (2009), China
Statistics Yearbook (2010), Credit Suisse Projections
We used International Labour Organization projections for age specific9
and overalleconomic activity rates from 2009 to 2020 and further extended this projection to 2025.Our projection assumes a declining economic activity rate for the 15-24 age group (due tomore education of the youth) and the 50+ age group (due to ageing), a slightly increasingeconomic activity rate for the 25-34 age group and a stable economic activity rate for the35-49 age group. The overall economic activity rate is projected to fall from 73.7% (2009)to 68% (2025).
In rural areas, the overall economic activity rate has recently started to decline. In ourprojection, we have assumed that it will decline further at an accelerating pace from 83.4%(2009) to 75.7% (2025). In urban areas, the overall economic activity rate is projected toincrease slightly from 62.6% (2009) to 64.7% (2025). This is shown in Exhibit 22.
We used UN projections for the overall 15+ population in China. We project that the urbanpopulation in China will increase to one billion by 2025. The share of the 15+ population inrural areas tends to be lower due to relatively less strict birth control policies and higherbirth rates. We assume the difference between the percentages of the 15+ population inrural and urban areas to be 5.3% (using the 2005 1% Population Survey result). Due tourbanization and worker migration, the rural 15+ population is projected to fall from 561.8million (2009) to 354.6 million (2025) while the urban 15+ population is projected toincrease from 512.2 million (2009) to 836.1 million (2025).
8Economic activity rates measure the ratio of the economically active population/labour supply to the totalpopulation aged 15 years and above
9 Age specific economic activity rates measure the ratio of the economically active population/laboursupply to the total population in the respective age group

8/6/2019 China Labour Migrant Jan 5 Cs
http://slidepdf.com/reader/full/china-labour-migrant-jan-5-cs 15/29
05 January 2011
China: The turning point of the labour market 15
Using the assumptions and projections above, we calculated the labour supply using
equation (1). The overall labour supply in China is projected to peak in 2017 and reach
809.2 million in 2025 from a current figure of 789.2 million as shown in Exhibit 17.
The rural labour supply is projected to decline at an accelerating pace from 468.8 million in
2009 to 268.4 million in 2025. This is mainly due to outward migration into cities,
urbanization of rural areas, ageing and increased education of the rural youth.
The urban labour supply is projected to increase from 320.4 million (2009) to 540.7 million(2025). We expect inward migration from rural areas and conversion of villages into towns
to drive the increase. Hence, we forecast that the urban-rural labour supply ratio will
increase from a current level of 0.68 to 2.01 in 2025.
The labour demand picture
We projected overall labour demand using the relationship between GDP growth and
employment growth through employment elasticity, as defined below10:
Employment elasticity = Percent change in employment/Percent change in GDP............(2)
Employment elasticity in China was high in the 1990’s as China was engaged in labour-
intensive export-driven manufacturing. Heavy capital investment and the property boom
have lowered employment elasticity in the last few years. The average levels were 0.13
(1996-2004) and 0.07 (2005-2009).
In our view, the expansion of the services sector and infrastructure investment in the next
few years will lead to high labour demand. The share of employment in the services sector
will grow and the services sector will be labour intensive as many jobs will be created
initially at the lower end. This will pull up employment elasticity. However, as the services
sector moves to a higher end, with higher productivity, and the overall labour market
becomes constrained, employment elasticity should decline. Hence, we assume that
employment elasticity will rise from the current level of 0.07 to 0.110 (2014) and fall
thereafter.
GDP growth assumptions used in our calculations are: 9.3% (2010-2014), 8.5% (2015-
2020) and 7.5% (2021- 2025).
We estimate labour demand using equation (2). Overall labour demand is projected toincrease from 780 million (2009) to 857.1 million (2025). The rural sector will continue to
absorb all remaining rural labour and thus we assume rural demand will equate to rural
supply. Urban demand is the difference between total labour demand and rural demand.
Urban labour demand is projected to rise from 311.2 million (2009) to 588.7 million (2025).
This is mainly due to increased labour demand in urban services and conversion of
villages into towns. According to our projections, the urban/rural labour demand ratio will
increase from a current level of 0.66 to 2.19 in 2025. This is a significant and material
increase.
Labour supply gap
Our projections suggest that China will remain a labour surplus country until about 2014,
after which labour demand will surpass labour supply. In 2025, the projected labour
demand-supply gap is 47.9 million as shown in Exhibit 23.
Effects of the labour shortage are already being felt in China with the rise in wages of
migrant workers. The current labour shortage is accelerating at a pace that points to a net
shortage in the immediate future.
10 Mingzhu Qi, Labor Supply and Labor Demand Forecasting in China 2010-2050 , Population Research(2010)

8/6/2019 China Labour Migrant Jan 5 Cs
http://slidepdf.com/reader/full/china-labour-migrant-jan-5-cs 16/29
05 January 2011
China: The turning point of the labour market 16
Exhibit 23: Labour supply and demand projections(In millions) -Credit Suisse Projections after 2009
Total Urban Rural Labour Gap
Labour Demand Labour Supply Labour Demand Labour Supply Labour Supply
(Demand )
(Demand-Supply)
1990 647 651 170 174 477 -3.8
1995 681 686 190 196 490 -5.2
2000 721 727 232 237 489 -6.0
2005 758 767 273 282 485 -8.4
2009 780 789 311 320 469 -9.2
2010 787 798 323 334 464 -10.8
2011 793 803 337 347 456 -9.4
2012 801 808 353 359 448 -6.7
2013 809 811 369 372 440 -2.9
2014 817 815 387 384 430 2.2
2015 824 817 404 397 420 7.1
2016 831 819 423 410 408 12.6
2017 837 819 441 424 396 17.6
2018 841 819 459 437 382 21.9
2019 845 818 476 450 369 26.1
2020 847 817 493 463 354 30.0
2021 849 816 511 478 338 33.6
2022 851 814 530 492 321 37.5
2023 853 812 549 508 304 41.2
2024 855 810 569 524 287 44.8
2025 857 809 589 541 268 47.9
Source: UN, ILO, China Labour Statistical Yearbook (2009), China Statistics Yearbook (2010), Credit Suisse Projections
In 2017, the labour demand-supply gap is projected to be 17.6 million, equivalent to 11%
of the size of the current labour force of the US, 27% of Japan's labour force and 41% of
Germany’s labour force. The gap could be as wide as 47.9 million by 2025, based on our
projections, but we suspect there could be some structural adjustment introduced at thattime to address it.
Adjusted demand-supply gap
The labour demand supply gap is based on assumptions about various economic and
social variables and changing any of the underlying factors will change the gap. In this
section we consider some of these factors in a qualitative fashion to assess how changes
in each of them will affect the gap:
• Increasing retirement age and incentives to work: Labour supply will increase as
economic activity rates for old people rise. This can reduce the demand supply gap. ( ─ )
• Rising income and wealth and higher preference for leisure time: Labour supply will fall
as people prefer to work less. Labour demand will increase as people work fewer hours.
This can increase the demand supply gap. (+)
• Rising wages: Supply can rise as rising wage provide an incentive to work more, but
beyond a point it can fall as people have more income. Demand will fall as labour
becomes more expensive. Effect on the gap is unclear. (+ / ─ )
• Changing Labour laws: Supply will fall as regulations such as minimum legal working
age become stricter. Demand will fall as labour becomes more expensive and inflexible.
Effect on the gap is unclear. (+ / ─ )
• Improved productivity by copying urban living and production model: Demand will fall as
labour productivity rises. This can decrease the demand supply gap. ( ─ )

8/6/2019 China Labour Migrant Jan 5 Cs
http://slidepdf.com/reader/full/china-labour-migrant-jan-5-cs 17/29
05 January 2011
China: The turning point of the labour market 17
• Increased capital intensity, improved infrastructure and automation: Demand will fall as
labour productivity rises. This can decrease the demand supply gap. ( ─ )
• Conversion of rural villages to townships: Urban labour supply will increase. Demand will
increase as the services sector grows. Effect on the gap is unclear. (+ / ─ )
• Growth of the services sector: The
switch from manufacturing to
services will increase demand asservices are more labour intensive
than manufacturing and can
increase the gap (+). Expansion of
the services sector in rural areas will
reduce demand as services are less
labour intensive than agriculture and
reduce the gap ( ─ ). The reduced
impact of the housing boom will
increase demand as services are
more labour intensive than
construction (+). In Exhibit 24 we
show the different employment split
across sectors in four major Asian
economies. We see that the share
of employment in services is still
relatively low in China compared to
Japan and Korea.
Conclusion
The success of China’s economic development over the past thirty years can be attributed
to Deng Xiaoping’s open door policy, a wide range of reforms (including SOE reform,
banking reform, housing reform, and joining the WTO) and the global manufacturing
outsourcing trend, but demographics factor has also played a critical role. The path of
production boom, housing boom and consumption boom coincides with the life cycle of
China’s baby-boomer generation. However, China is increasingly feeling the stress fromthe baby-bust generation, created by the ‘one-child policy’.
Evidently, migrant workers’ salaries started to rise in the mid-2000s, after a period of ‘no pay
hikes’ for more than a decade. Over the past year, salaries have surged and spread from the
manufacturing sector to the service sector. This has lots to do with the softening in new
labour supply in rural areas and is aggravated by production relocation and infrastructure
investment near rural areas. The surging demand from the service sector further bids
workers away. We estimate salary increases of 30%-40% for migrant workers in 2010, and
project 20%-30% per year wage hikes at least over the next three to five years.
We believe that the majority of FDI will remain in China despite rising labour costs. The
supply chain effect, infrastructure and administrative efficiency, and most importantly
domestic market, will keep FDI within China, but production lines moving to inland
provinces seems inevitable.
China has not entered the stage of labour net shortage yet, but the low end of the labour
supply curve has shown an upward shape, meaning that higher salary would be necessary
to draw additional labour. We expect that overall labour supply in China will peak in 2017
and reach 809.2 million in 2025 from a current figure of 789.2 million. The rural labour
supply is projected to decline at an accelerating pace from 468.8 million in 2009 to 268.4
million in 2025. This is mainly due to the urbanization of rural areas, ageing and increased
education of the rural youth. The urban labour supply is projected to increase and reach
540.7 million in 2025 (urban supply in 2009 is 320.4 million). We expect inward migration
from rural areas and conversion of villages into towns to drive the increase.
Exhibit 24: Share of employment indifferent sectors
2008
0%
20%
40%
60%
80%
100%
China India Japan Korea
Agriculture Industry Services
Source: Credit Suisse, NBS, Planning Commission, Korean StatisticalInformation Website, MIAC

8/6/2019 China Labour Migrant Jan 5 Cs
http://slidepdf.com/reader/full/china-labour-migrant-jan-5-cs 18/29
05 January 2011
China: The turning point of the labour market 18
We project that overall labour demand will increase from 780 million (2009) to 857.1
million (2025). Labour demand growth in the next few years will likely be driven by a large
expansion in the services sector and infrastructure investment, which will accelerate the
move to a labour shortage in the future. We estimate that urban labour demand will rise
from 311.2 million (2009) to 588.7 million (2025). This will mainly be due to increased
labour demand by urban services and conversion of villages into towns.
Overall, China appears likely to remain a labour surplus country until about 2014, afterwhich the labour demand will surpass labour supply. We expect the labour demand-supply
gap will be 17.6 million in 2017, equivalent to 11% of the current labour force of the US,
27% of Japan's labour force and 41% of Germany’s labour force. Effects of the labour
shortage are already being felt in China with the rise in wages of migrant workers. The
labour shortage is accelerating at a pace that points to a net shortage in the immediate
future. In our view, the turning of the labour market in China is secular and perhaps
irreversible over the coming decades.
In our view, the sharp turning of China’s labour market will not only redefine China’s own
growth model, production model, consumption pattern and income distribution, but also
have a major impact on inflation and financial prices, as well as the manufacturing
outsourcing model for the rest of the world.
References
Credit Suisse Research, Spotlight on Demographics Giants: China and India (2010)
Credit Suisse Research, The Republic of Korea: Demographic Opportunities and Challenges (2010)
Credit Suisse Research, Changing demographics and consumers: EMG6 (2008)
David Bloom, David Canning and Jaypee Sevilla, Economic Growth and the Demographic Transition , NBER Working Paper (2001)
Gary Fields, Dualism in the labour market: A perspective on the Lewis Model after half a century (2004)
IMF, Regional Economic Outlook: Asia and Pacific (2008)
Mingzhu Qi, Labor Supply and Labor Demand Forecasting in China 2010- 2050 ,Population Research, (2010)
Yining Li, The Reform of the Rural-Urban Dualism , Journal of Peking University, (2008)
8/6/2019 China Labour Migrant Jan 5 Cs
http://slidepdf.com/reader/full/china-labour-migrant-jan-5-cs 19/29
05 January 2011
China: The turning point of the labour market 19
Appendix
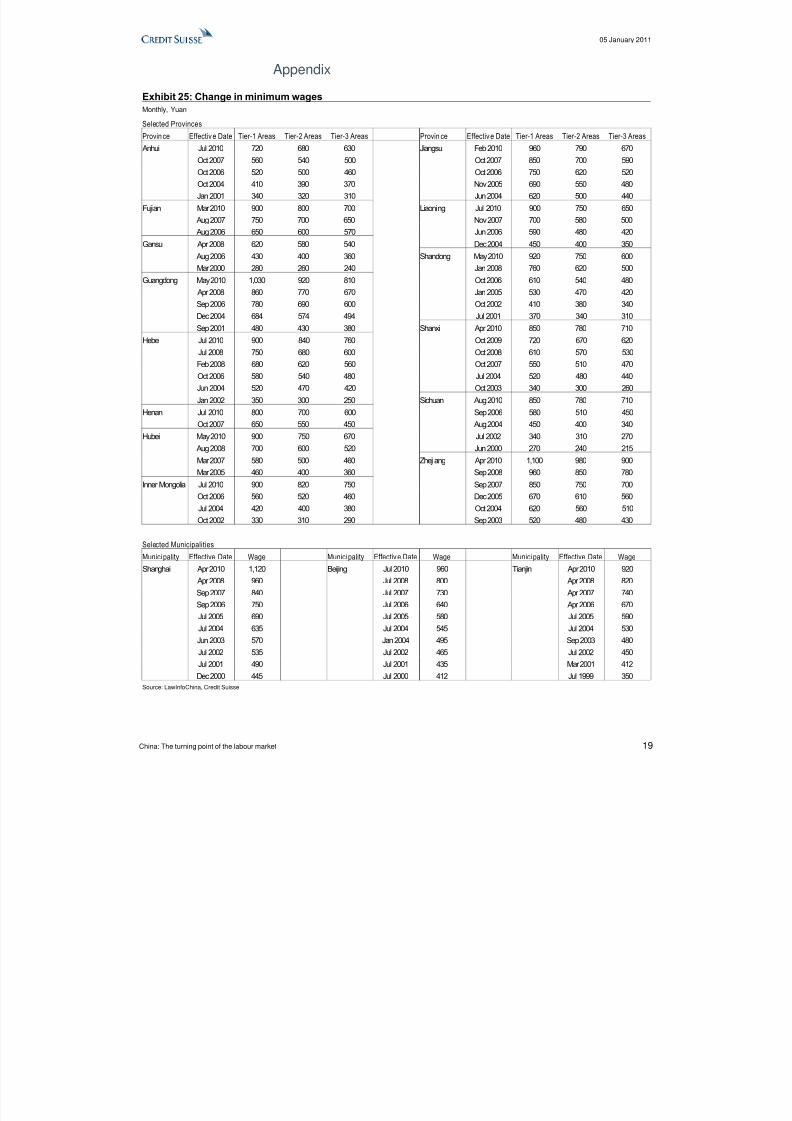
Exhibit 25: Change in minimum wages
Monthly, Yuan
Selected Provinces
Provin ce Effective Date Tier-1 Areas Tier-2 Areas Tier-3 Areas Provin ce Effective Date Tier-1 Areas Tier-2 Areas Tier-3 Areas
Anhui Jul 2010 720 680 630 Jiangsu Feb 2010 960 790 670Oct 2007 560 540 500 Oct 2007 850 700 590
Oct 2006 520 500 460 Oct 2006 750 620 520
Oct 2004 410 390 370 Nov 2005 690 550 480
Jan 2001 340 320 310 Jun 2004 620 500 440
Fujian Mar 2010 900 800 700 Liaoning Jul 2010 900 750 650
Aug 2007 750 700 650 Nov 2007 700 580 500
Aug 2006 650 600 570 Jun 2006 590 480 420
Gansu Apr 2008 620 580 540 Dec 2004 450 400 350
Aug 2006 430 400 360 Shandong May 2010 920 750 600
Mar 2000 280 260 240 Jan 2008 760 620 500
Guangdong May 2010 1,030 920 810 Oct 2006 610 540 480
Apr 2008 860 770 670 Jan 2005 530 470 420
Sep 2006 780 690 600 Oct 2002 410 380 340
Dec 2004 684 574 494 Jul 2001 370 340 310
Sep 2001 480 430 380 Shanxi Apr 2010 850 780 710
Hebei Jul 2010 900 840 760 Oct 2009 720 670 620
Jul 2008 750 680 600 Oct 2008 610 570 530
Feb 2008 680 620 560 Oct 2007 550 510 470
Oct 2006 580 540 480 Jul 2004 520 480 440
Jun 2004 520 470 420 Oct 2003 340 300 260
Jan 2002 350 300 250 Sichuan Aug 2010 850 780 710
Henan Jul 2010 800 700 600 Sep 2006 580 510 450
Oct 2007 650 550 450 Aug 2004 450 400 340
Hubei May 2010 900 750 670 Jul 2002 340 310 270
Aug 2008 700 600 520 Jun 2000 270 240 215
Mar 2007 580 500 460 Zhejiang Apr 2010 1,100 980 900
Mar 2005 460 400 360 Sep 2008 960 850 780
Inner Mongolia Jul 2010 900 820 750 Sep 2007 850 750 700
Oct 2006 560 520 460 Dec 2005 670 610 560
Jul 2004 420 400 380 Oct 2004 620 560 510
Oct 2002 330 310 290 Sep 2003 520 480 430
Selected Municipalities
Munici pality Effective Date Wage Munici pality Effective Date Wage Munici pality Effective Date Wage
Shanghai Apr 2010 1,120 Beijing Jul 2010 960 Tianjin Apr 2010 920
Apr 2008 960 Jul 2008 800 Apr 2008 820
Sep 2007 840 Jul 2007 730 Apr 2007 740
Sep 2006 750 Jul 2006 640 Apr 2006 670Jul 2005 690 Jul 2005 580 Jul 2005 590
Jul 2004 635 Jul 2004 545 Jul 2004 530
Jun 2003 570 Jan 2004 495 Sep 2003 480
Jul 2002 535 Jul 2002 465 Jul 2002 450
Jul 2001 490 Jul 2001 435 Mar 2001 412
Dec 2000 445 Jul 2000 412 Jul 1999 350
Source: LawInfoChina, Credit Suisse

8/6/2019 China Labour Migrant Jan 5 Cs
http://slidepdf.com/reader/full/china-labour-migrant-jan-5-cs 20/29
05 January 2011
China: The turning point of the labour market 20
Exhibit 26: Total, urban and rural populations(In millions) - Estimation and projection after 2008
Total Urban Rural
Total
Population
15+
Population
Total
Population
15+
Population
Total
Population
15+
Population
% of UrbanPopulation
1990 1,142 818 302 228 840 590 26%
1991 1,158 831 315 239 843 593 27%
1992 1,172 844 329 249 843 594 28%
1993 1,186 855 343 261 842 594 29%
1994 1,199 866 359 272 840 593 30%
1995 1,211 877 374 285 837 592 31%
1996 1,223 889 389 297 834 592 32%
1997 1,235 901 404 309 831 591 33%
1998 1,246 913 420 322 826 591 34%
1999 1,257 927 436 337 821 590 35%
2000 1,267 941 453 352 814 589 36%
2001 1,277 957 472 370 804 587 37%
2002 1,286 974 492 389 794 585 38%
2003 1,295 991 513 409 782 582 40%
2004 1,304 1,008 535 431 769 577 41%
2005 1,312 1,024 558 452 754 571 43%
2006 1,321 1,038 573 467 748 570 43%
2007 1,329 1,051 588 482 741 569 44%
2008 1,337 1,063 603 497 734 566 45%
2009 1,346 1,074 619 512 726 562 46%
2010 1,354 1,085 636 527 718 557 47%
2011 1,363 1,095 655 545 707 550 48%
2012 1,371 1,105 675 562 696 542 49%
2013 1,380 1,114 696 580 683 533 50%
2014 1,388 1,122 717 599 670 524 52%
2015 1,396 1,130 739 617 657 513 53%
2016 1,404 1,137 762 636 642 501 54%2017 1,411 1,144 785 655 626 489 56%
2018 1,418 1,151 810 675 609 475 57%
2019 1,425 1,157 834 696 591 461 59%
2020 1,431 1,163 860 717 571 446 60%
2021 1,437 1,169 886 739 550 430 62%
2022 1,442 1,174 913 762 528 412 63%
2023 1,446 1,180 941 786 505 394 65%
2024 1,450 1,185 970 810 480 375 67%
2025 1,453 1,191 1,000 836 453 355 69%
Source: UN, China Population Yearbook, Credit Suisse

8/6/2019 China Labour Migrant Jan 5 Cs
http://slidepdf.com/reader/full/china-labour-migrant-jan-5-cs 21/29
05 January 2011
China: The turning point of the labour market 21
Exhibit 27: Economic activity ratesProjection after 2008
Overall By Age Group
Total (15+) 15-24 25-34 35-49 50+
1990 79.2% 78.3% 94.7% 93.3% 49.3%
1991 79.2% 78.0% 94.6% 93.4% 49.0%
1992 79.1% 77.4% 94.4% 93.5% 48.8%
1993 79.0% 76.8% 94.3% 93.5% 48.6%
1994 78.9% 76.1% 94.2% 93.6% 48.3%
1995 78.8% 75.3% 94.2% 93.6% 48.2%
1996 78.6% 74.4% 94.1% 93.6% 48.1%
1997 78.4% 73.2% 94.1% 93.6% 48.0%
1998 78.1% 71.9% 94.1% 93.6% 48.0%
1999 77.8% 70.5% 94.2% 93.6% 48.1%
2000 77.4% 69.0% 94.2% 93.6% 48.3%
2001 77.0% 67.5% 94.2% 93.7% 48.7%
2002 76.5% 65.9% 94.2% 93.8% 49.1%
2003 75.9% 64.3% 94.3% 93.9% 49.4%
2004 75.3% 62.9% 94.3% 93.9% 49.7%
2005 74.8% 61.8% 94.3% 94.0% 49.8%
2006 74.4% 60.8% 94.4% 94.0% 49.8%
2007 74.0% 60.1% 94.4% 94.1% 49.6%
2008 73.8% 59.8% 94.4% 94.1% 49.4%
2009 73.7% 60.5% 94.4% 94.0% 49.2%
2010 73.5% 60.4% 94.4% 94.0% 49.0%
2011 73.3% 60.2% 94.4% 93.9% 48.8%
2012 73.1% 59.7% 94.3% 93.9% 48.7%
2013 72.9% 59.2% 94.3% 93.9% 48.6%
2014 72.6% 58.6% 94.4% 93.8% 48.5%
2015 72.3% 58.2% 94.4% 93.8% 48.4%
2016 72.0% 57.8% 94.4% 93.8% 48.2%
2017 71.6% 57.6% 94.5% 93.8% 48.1%2018 71.2% 57.4% 94.5% 93.8% 47.9%
2019 70.7% 57.2% 94.6% 93.9% 47.8%
2020 70.3% 57.0% 94.6% 94.0% 47.5%
2021 69.8% 56.8% 94.6% 94.0% 47.2%
2022 69.3% 56.6% 94.6% 94.0% 46.9%
2023 68.8% 56.4% 94.7% 94.0% 46.6%
2024 68.4% 56.2% 94.7% 94.0% 46.3%
2025 68.0% 56.0% 94.7% 94.0% 46.0%
Source: ILO, Credit Suisse

8/6/2019 China Labour Migrant Jan 5 Cs
http://slidepdf.com/reader/full/china-labour-migrant-jan-5-cs 22/29
8/6/2019 China Labour Migrant Jan 5 Cs
http://slidepdf.com/reader/full/china-labour-migrant-jan-5-cs 23/29
05 January 2011
China: The turning point of the labour market 23
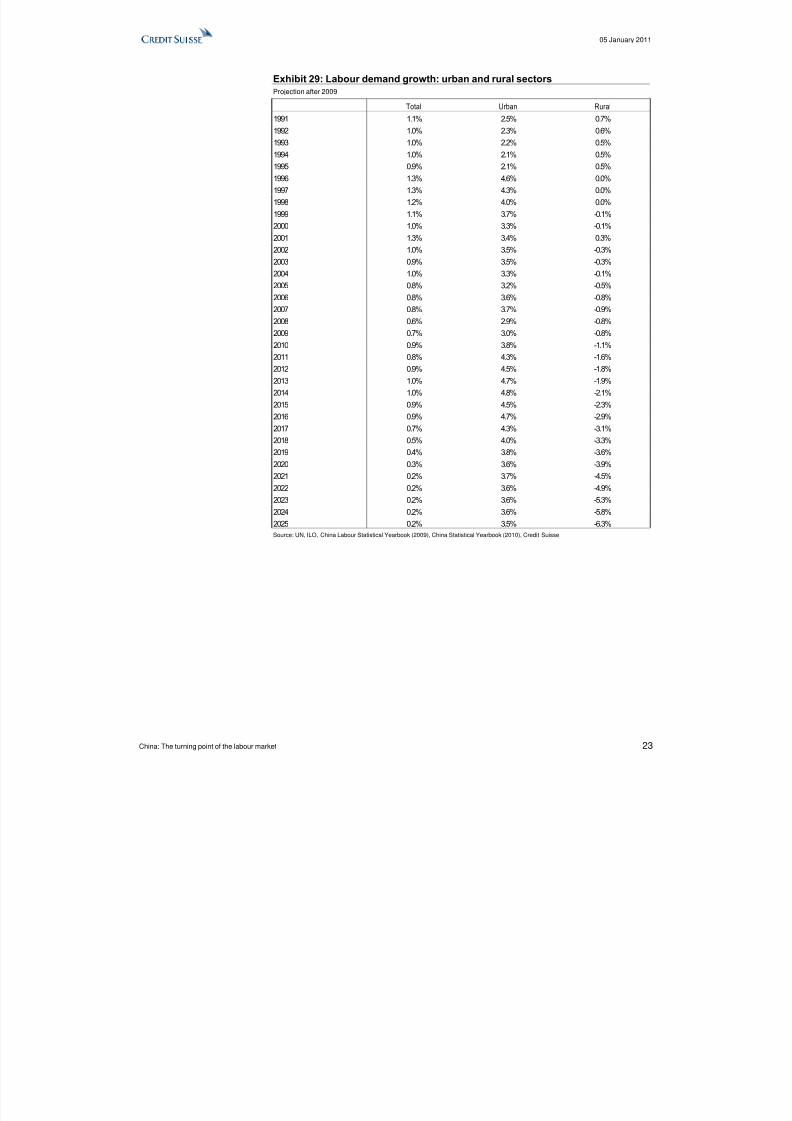
Exhibit 29: Labour demand growth: urban and rural sectorsProjection after 2009
Total Urban Rural
1991 1.1% 2.5% 0.7%
1992 1.0% 2.3% 0.6%
1993 1.0% 2.2% 0.5%
1994 1.0% 2.1% 0.5%
1995 0.9% 2.1% 0.5%
1996 1.3% 4.6% 0.0%
1997 1.3% 4.3% 0.0%
1998 1.2% 4.0% 0.0%
1999 1.1% 3.7% -0.1%
2000 1.0% 3.3% -0.1%
2001 1.3% 3.4% 0.3%
2002 1.0% 3.5% -0.3%
2003 0.9% 3.5% -0.3%
2004 1.0% 3.3% -0.1%
2005 0.8% 3.2% -0.5%
2006 0.8% 3.6% -0.8%
2007 0.8% 3.7% -0.9%
2008 0.6% 2.9% -0.8%
2009 0.7% 3.0% -0.8%
2010 0.9% 3.8% -1.1%
2011 0.8% 4.3% -1.6%
2012 0.9% 4.5% -1.8%
2013 1.0% 4.7% -1.9%
2014 1.0% 4.8% -2.1%
2015 0.9% 4.5% -2.3%
2016 0.9% 4.7% -2.9%
2017 0.7% 4.3% -3.1%
2018 0.5% 4.0% -3.3%
2019 0.4% 3.8% -3.6%2020 0.3% 3.6% -3.9%
2021 0.2% 3.7% -4.5%
2022 0.2% 3.6% -4.9%
2023 0.2% 3.6% -5.3%
2024 0.2% 3.6% -5.8%
2025 0.2% 3.5% -6.3%
Source: UN, ILO, China Labour Statistical Yearbook (2009), China Statistical Yearbook (2010), Credit Suisse

8/6/2019 China Labour Migrant Jan 5 Cs
http://slidepdf.com/reader/full/china-labour-migrant-jan-5-cs 24/29
05 January 2011
China: The turning point of the labour market 24
Exhibit 30: Population growth Exhibit 31: Labour force growthRates per annum (%) – Selected Advanced and Asian countries Rates per annum (%) – Selected Advanced and Asian countries
-0.5
0.0
0.5
1.0
1.5
2.0
2.5
3.0
3.5
1980-1990 1990-2000 2000-2010
Germany Japan S. Korea China USA
Indonesia India Malaysia Singapore
-1.0
0.0
1.0
2.0
3.0
4.0
1980-1990 1990-2000 2000-2010
Japan Germany USA China S. Korea
Indones ia India Malays ia Singapore
Source: Credit Suisse, UN Source: Credit Suisse, ILO
Exhibit 32: Total fertility rate Exhibit 33: Life expectancy at birth
Children per woman – Selected Advanced and Asian countries Years – Selected Advanced and Asian countries
1.0
2.0
3.0
4.0
5.0
1980-1985 1990-1995 2000-2005 2005-2010
S. Korea Japan Singapore Germany Ch ina
USA Indones ia Malays ia India
50.0
55.0
60.0
65.0
70.0
75.0
80.0
85.0
1980-1985 1990-1995 2000-2005 2005-2010
India Indonesia China Malaysia USA
S. Korea Germany Singapore Japan
Source: Credit Suisse, UN Source: Credit Suisse, UN
Exhibit 34: Economic activity rate Exhibit 35: Labour force
2010 – Selected Advanced and Asian countries (%) 2010 – Selected Advanced and Asian Countries (In millions)
6771 72 72
7579 80 81
86
4854
58
5054
44
52
33
67
0
10
20
30
40
50
60
70
80
90
100
G e r m
a n y
J a p a n
U S A
S . K o r e a
S i n g a p
o r e
M a l a
y s i a
C h i n a
I n d i a
I n d o n e
s i a
Men Women
3 12 25 4365
118164
484
798
0
100
200
300
400
500
600
700
800
900
S i n g a p
o r e
M a l a y
s i a
S . K o r e a
G e r m
a n y
J a p a n
I n d o n e s i a
U S A
I n d i a
C h i n a
Source: Credit Suisse, ILO Source: Credit Suisse, ILO

8/6/2019 China Labour Migrant Jan 5 Cs
http://slidepdf.com/reader/full/china-labour-migrant-jan-5-cs 25/29
05 January 2011
China: The turning point of the labour market 25
Exhibit 36: Urban populationPercent of total population – Selected Advanced and Asian countries
0
10
20
30
40
5060
70
80
90
100
1980 1990 2000 2010
India Indonesia China Japan Malaysia Germany USA S. Korea Singapore
Source: Credit Suisse, UN
Exhibit 37: Working minutes needed to buy one Big Mac
Amount of time that an average worker must work to earn enough to buy a Big Mac
136
10088
61
45 4136
30 2720 20 19 14 14 13 12
0
20
40
60
80
100
120
140
160
J a k a
r t a
C N m i g r a
n t w o r k e
r s
M a n i l a
M u m
b a i
B a n g k o k
K u a
l a L u
m p u
r
S i n g a p
o r e
S h a n g h
a i
S e o u l
P a r i s
T a i p
e i
B e r l i n
N e w Y o
r k
H
o n g K o
n g
L o n d
o n
T o k y
o
Minutes of working time for one B ig Mac
China = 50
Source: Credit Suisse, The Economist Magazine
Exhibit 38: Working minutes needed to buy one kilogram of rice
Amount of time that an average worker must work to earn enough to buy one kilogram of rice
47 47
38 37
27
21 20 20
17 17 16 14 13 128 8
0
5
10
1520
25
30
35
40
45
50
J a k a
r t a
C N m i g r
a n t w
o r k e
r s
M a n i l a
M u m
b a i
B a n g k o k
T o k y
o P a
r i s
S e o u l
B e r l i n
S i n g a p
o r e
H o n g
K o n g
S h a n
g h a i
K u a l a
L u m
p u r
T a i p e i
N e w
Y o r k
L o n d
o n
Minutes of working time needed for one kilogram o f rice
China = 23.3
Source: Credit Suisse, The Economist Magazine

8/6/2019 China Labour Migrant Jan 5 Cs
http://slidepdf.com/reader/full/china-labour-migrant-jan-5-cs 26/29
05 January 2011
China: The turning point of the labour market 26
Exhibit 39: Hours per week in manufacturing2008 (*2009 for China migrant workers, **2007 for UK & Brazil, ***2006 for India)
58
4947 47 46
44 44 4442
41 41
38 38 3736
30
35
40
45
50
55
60
C N m i g r
a n t w
o r k e
r s *
M a l a y
s i a
P h i l i p
p i n e s
I n d i a *
* *
M e x i c
o
I n d o n e s i a
S o u t h
K o r e a
B r a z i l * *
J a p a n
U K * * U S
G e r m
a n y
A u s t r a l i a
F r a n
c e
S p a i n
Hours worked per week in Manufacturing
China = 47.9
Source: Credit Suisse, ILO, NBS Migrant Workers Survey
Exhibit 40: Income distributionShare of household disposable income held by different groups ordered by income levels
Lowest 20%
Second 20%
Third 20%
Fourth 20%
Highest 20%
0%
20%
40%
60%
80%
100%
1990 2009
Source: Credit Suisse, Euromonitor

8/6/2019 China Labour Migrant Jan 5 Cs
http://slidepdf.com/reader/full/china-labour-migrant-jan-5-cs 27/29
..
EMERGING MARKETS ECONOMICS AND FIXED INCOME STRATEGY
Kasper BartholdyHead of Strategy and Economics
+44 20 7883 [email protected]
LATIN AMERICA ECONOMICS
Alonso Cervera
Head of Non-BrazilLatin America Economics+52 55 5283 [email protected] Mexico, Chile
Carola Sandy
+1 212 325 [email protected], Peru, Colombia
Casey Reckman
+1 212 325 [email protected], Panama, El Salvador
Lorraine White
+1 212 538 [email protected] Analyst
Nilson Teixeira
Head of Brazil Economics+55 11 3841 [email protected]
Leonardo Fonseca
+55 11 3841 [email protected]
Daniel Lavarda
+55 11 3841 [email protected]
Tales Rabelo
+55 11 3841 [email protected]
EASTERN EUROPE, MIDDLE EAST & AFRICA ECONOMICS
Berna Bayazitoglu
Head of EMEA Economics +44 20 7883 [email protected] Turkey, South Africa
Sergei Voloboev
+44 20 7888 [email protected] Russia, Ukraine, Lebanon
Ivailo Vesselinov
+44 20 7883 [email protected], Israel, Romania
Jacqueline Madu
+44 20 7883 4216 [email protected], GCC, Nigeria
Gergely Hudecz
+44 20 7883 [email protected] Republic, Hungary, Poland
Natig Mustafayev
+44 20 7888 [email protected]
Alexey Pogorelov
+7 495 967 [email protected]
NON-JAPAN ASIA ECONOMICSDong Tao
Head of Non-Japan As ia Economics+852 2101 [email protected] China, Korea
Christiaan Tuntono
+852 2101 [email protected] Kong, Taiwan
Robert Prior-Wandesforde
+65 6212 [email protected], Indonesia, Vietnam
Devika Mehndiratta
+65 6212 [email protected], Philippines
Santitarn Sathirathai
+65 6212 [email protected]
Kun Lung Wu
+65 6212 [email protected], Singapore
STRATEGY
Igor Arsenin
Head of Latin America Strategy+1 212 325 [email protected]
Paul Fage
Head of EMEA Strategy+44 20 7883 [email protected]
Ashish Agrawal
Asia Strategy+65 6212 [email protected]
Daniel Chodos
+1 212 325 [email protected] Local Markets Strategy
Helen Parsons, CFA
+1 212 538 [email protected]
Saad Siddiqui
+44 20 7888 [email protected]
Ray Farris
Head of FX Strategy+44 20 7888 [email protected]
Olivier Desbarres
+65 6212 [email protected] FX Strategy
Daniel Katzive
+1 212 538 [email protected] Strategy

8/6/2019 China Labour Migrant Jan 5 Cs
http://slidepdf.com/reader/full/china-labour-migrant-jan-5-cs 28/29
DEMOGRAPHICS RESEARCH
LONDON
Amlan Roy, Managing Director
+44 20 7888 [email protected]
Sonali Punhani, Analyst
+44 20 7883 [email protected]
Liyan Shi, Analyst
+44 20 7883 [email protected]

8/6/2019 China Labour Migrant Jan 5 Cs
http://slidepdf.com/reader/full/china-labour-migrant-jan-5-cs 29/29
Disclosure Appendix
Analyst Certification Dong Tao, Christiaan Tuntono, Amlan Roy, Sonali Punhani and Liyan Shi each certify, with respect to the companies or securities that he or she analyzes, that (1) the views expressed in this reportaccurately reflect his or her personal views about all of the subject companies and securities and (2) no part of his or her compensation was, is or will be directly or indirectly related to the specificrecommendations or views expressed in this report.
Disclaimer References in this report to Credit Suisse include all of the subsidiaries and affiliates of Credit Suisse AG operating under its investment banking division. For more information on our structure, pleaseuse the following link:https://www.credit-suisse.com/who_we_are/en/.This report is not directed to, or intended for distribution to or use by, any person or entity who is a citizen or resident of or located in any locality, state, country or other jurisdiction where suchdistribution, publication, availability or use would be contrary to law or regulation or which would subject Credit Suisse AG or its affiliates (“CS”) to any registration or licensing requirement within such jurisdiction. All material presented in this report, unless specifically indicated otherwise, is under copyright to CS. None of the material, nor its content, nor any copy of it, may be altered in any way,transmitted to, copied or distributed to any other party, without the prior express written permission of CS. All trademarks, service marks and logos used in this report are trademarks or service marks or registered trademarks or service marks of CS or its affiliates.The information, tools and material presented in this report are provided to you for information purposes only and are not to be used or considered as an offer or the solicitation of an offer to sell or tobuy or subscribe for securities or other financial instruments. CS may not have taken any steps to ensure that the securities referred to in this report are suitable for any particular investor. CS will nottreat recipients of this report as its customers by virtue of their receiving this report. The investments and services contained or referred to in this report may not be suitable for you and it isrecommended that you consult an independent investment advisor if you are in doubt about such investments or investment services. Nothing in this report constitutes investment, legal, accounting or tax advice, or a representation that any investment or strategy is suitable or appropriate to your individual circumstances, or otherwise constitutes a personal recommendation to you. CS does notadvise on the tax consequences of investments and you are advised to contact an independent tax adviser. Please note in particular that the bases and levels of taxation may change.Information and opinions presented in this report have been obtained or derived from sources believed by CS to be reliable, but CS makes no representation as to their accuracy or completeness. CSaccepts no liability for loss arising from the use of the material presented in this report, except that this exclusion of liability does not apply to the extent that such liability arises under specific statutes or regulations applicable to CS. This report is not to be relied upon in substitution for the exercise of independent judgment. CS may have issued, and may in the future issue, other reports that areinconsistent with, and reach different conclusions from, the information presented in this report. Those reports reflect the different assumptions, views and analytical methods of the analysts who
prepared them and CS is under no obligation to ensure that such other reports are brought to the attention of any recipient of this report.CS may, to the extent permitted by law, participate or invest in financing transactions with the issuer(s) of the securities referred to in this report, perform services for or solicit business from suchissuers, and/or have a position or holding, or other material interest, or effect transactions, in such securities or options thereon, or other investments related thereto. In addition, it may make markets in the securities mentioned in the material presented in this report. CS may have, within the last three years, served as manager or co-manager of a public offering of securities for, or currently may makea primary market in issues of, any or all of the entities mentioned in this report or may be providing, or have provided within the previous 12 months, significant advice or investment services in relationto the investment concerned or a related investment. Additional information is, subject to duties of confidentiality, available on request. Some investments referred to in this report will be offered solelyby a single entity and in the case of some investments solely by CS, or an associate of CS or CS may be the only market maker in such investments.Past performance should not be taken as an indication or guarantee of future performance, and no representation or warranty, express or implied, is made regarding future performance. Information, opinionsand estimates contained in this report reflect a judgement at its original date of publication by CS and are subject to change without notice. The price, value of and income from any of the securities or financialinstruments mentioned in this report can fall as well as rise. The value of securities and financial instruments is subject to exchange rate fluctuation that may have a positive or adverse effect on the price or income of such securities or financial instruments. Investors in securities such as ADR’s, the values of which are influenced by currency volatility, effectively assume this risk.Structured securities are complex instruments, typically involve a high degree of risk and are intended for sale only to sophisticated investors who are capable of understanding and assuming the risksinvolved. The market value of any structured security may be affected by changes in economic, financial and political factors (including, but not limited to, spot and forward interest and exchangerates), time to maturity, market conditions and volatility, and the credit quality of any issuer or reference issuer. Any investor interested in purchasing a structured product should conduct their owninvestigation and analysis of the product and consult with their own professional advisers as to the risks involved in making such a purchase.Some investments discussed in this report may have a high level of volatility. High volatility investments may experience sudden and large falls in their value causing losses when that investment isrealised. Those losses may equal your original investment. Indeed, in the case of some investments the potential losses may exceed the amount of initial investment and, in such circumstances, youmay be required to pay more money to support those losses. Income yields from investments may fluctuate and, in consequence, initial capital paid to make the investment may be used as part of thatincome yield. Some investments may not be readily realisable and it may be difficult to sell or realise those investments, similarly it may prove difficult for you to obtain reliable information about the
value, or risks, to which such an investment is exposed.This report may provide the addresses of, or contain hyperlinks to, websites. Except to the extent to which the report refers to website material of CS, CS has not reviewed any such site and takes noresponsibility for the content contained therein. Such address or hyperlink (including addresses or hyperlinks to CS’s own website material) is provided solely for your convenience and information andthe content of any such website does not in any way form part of this document. Accessing such website or following such link through this report or CS’s website shall be at your own risk.This report is issued and distributed in Europe (except Switzerland) by Credit Suisse Securities (Europe) Limited, One Cabot Square, London E14 4QJ, England, which is regulated in the UnitedKingdom by The Financial Services Authority (“FSA”). This report is being distributed in Germany by Credit Suisse Securities (Europe) Limited Niederlassung Frankfurt am Main regulated by theBundesanstalt fuer Finanzdienstleistungsaufsicht ("BaFin"). This report is being distributed in the United States and Canada by Credit Suisse Securities (USA) LLC; in Switzerland by Credit Suisse AG;in Brazil by Banco de Investimentos Credit Suisse (Brasil) S.A; in Mexico by Banco Credit Suisse (México), S.A. (transactions related to the securities mentioned in this report will only be effected incompliance with applicable regulation); in Japan by Credit Suisse Securities (Japan) Limited, Financial Instruments Firm, Director-General of Kanto Local Finance Bureau (Kinsho) No. 66, a member of Japan Securities Dealers Association, The Financial Futures Association of Japan, Japan Securities Investment Advisers Association; elsewhere in Asia/ Pacific by whichever of the following is theappropriately authorised entity in the relevant jurisdiction: Credit Suisse (Hong Kong) Limited, Credit Suisse Equities (Australia) Limited, Credit Suisse Securities (Thailand) Limited, Credit SuisseSecurities (Malaysia) Sdn Bhd, Credit Suisse AG, Singapore Branch, and elsewhere in the world by the relevant authorised affiliate of the above. Research on Taiwanese securities produced by CreditSuisse AG, Taipei Branch has been prepared by a registered Senior Business Person. Research provided to residents of Malaysia is authorised by the Head of Research for Credit Suisse Securities(Malaysia) Sdn Bhd, to whom they should direct any queries on +603 2723 2020. This research may not conform to Canadian disclosure requirements.In jurisdictions where CS is not already registered or licensed to trade in securities, transactions will only be effected in accordance with applicable securities legislation, which will vary from jurisdictionto jurisdiction and may require that the trade be made in accordance with applicable exemptions from registration or licensing requirements. Non-U.S. customers wishing to effect a transaction shouldcontact a CS entity in their local jurisdiction unless governing law permits otherwise. U.S. customers wishing to effect a transaction should do so only by contacting a representative at Credit SuisseSecurities (USA) LLC in the U.S.This material is not for distribution to retail clients and is directed exclusively at Credit Suisse's market professional and institutional clients. Recipients who are not market professional or institutional
investor clients of CS should seek the advice of their independent financial advisor prior to taking any investment decision based on this report or for any necessary explanation of its contents. Thisresearch may relate to investments or services of a person outside of the UK or to other matters which are not regulated by the FSA or in respect of which the protections of the FSA for privatecustomers and/or the UK compensation scheme may not be available, and further details as to where this may be the case are available upon request in respect of this report.CS may provide various services to US municipal entities or obligated persons ("municipalities"), including suggesting individual transactions or trades and entering into such transactions. Any servicesCS provides to municipalities are not viewed as “advice” within the meaning of Section 975 of the Dodd-Frank Wall Street Reform and Consumer Protection Act. CS is providing any such services andrelated information solely on an arm’s length basis and not as an advisor or fiduciary to the municipality. In connection with the provision of the any such services, there is no agreement, direct or indirect, between any municipality (including the officials, management, employees or agents thereof) and CS for CS to provide advice to the municipality. Municipalities should consult with their financial, accounting and legal advisors regarding any such services provided by CS. In addition, CS is not acting for direct or indirect compensation to solicit the municipality on behalf of an unaffiliatedbroker, dealer, municipal securities dealer, municipal advisor, or investment adviser for the purpose of obtaining or retaining an engagement by the municipality for or in connection with MunicipalFinancial Products, the issuance of municipal securities, or of an investment adviser to provide investment advisory services to or on behalf of the municipality.
Copyright © 2011 CREDIT SUISSE AG and/or its affiliates. All rights reserved.
Investment principal on bonds can be eroded depending on sale price or market price. In addition, there are bonds on whichinvestment principal can be eroded due to changes in redemption amounts. Care is required when investing in such instruments.