china home appliance sector
TRANSCRIPT

DISCLOSURE APPENDIX AT THE BACK OF THIS REPORT CONTAINS IMPORTANT DISCLOSURES, ANALYST CERTIFICATIONS, LEGAL ENTITY DISCLOSURE AND THE STATUS OF NON-US ANALYSTS. US Disclosure: Credit Suisse does and seeks to do business with companies covered in its research reports. As a result, investors should be aware that the Firm may have a conflict of interest that could affect the objectivity of this report. Investors should consider this report as only a single factor in making their investment decision.
26 October 2016 Asia Pacific/Hong Kong
Equity Research Consumer Discretionary
China Home Appliance Sector Research Analysts
Raymond Ching
852 2101 7852
Carey Shi
852 2101 7729
ASSUMING COVERAGE
Riding on consumption upgrade and industry consolidation ■ We assume coverage on China's home appliances sector. We forecast
5% sector growth for 2016-18, up from 2% in 2014-15 driven by the end of the air conditioning (AC) price war, product mix enhancement, rising replacement need and strong property cycle starting from 2H15 (delay of 9-12 months). By category, white goods is a mature segment with 3-5% growth. Kitchenware is at a growing stage with a 9% CAGR, supported by low penetration and trade-up. In this report, we initiate on four white goods brands – Midea (OUTPERFORM, TPRmb34.50), Gree (OUTPERFORM, TP Rmb28), QD Haier (OUTPERFORM, TP Rmb12.30), Haier Electronics (NEUTRAL, TP HK$13.40) – and two kitchenware brands – Hangzhou Robam (OUTPERFORM, TP Rmb50.30) and Joyoung (NEUTRAL, TP Rmb21.50).
■ AC rebounds, kitchenware has the fastest growth. AC inventory issues have largely been resolved, and we expect a double-digit sales recovery in 2H16/1H17, which should act as a key share price catalyst for market leaders Gree and Midea. Kitchenware has the highest potential as consumers are trading up. Segment leaders, including Robam, would gain market share with their strong branding and differentiated products.
■ White goods giants eyeing global. With overseas M&As and strong export sales driven by RMB depreciation, we expect overseas sales of QD Haier, Midea and Gree to reach 45%/55%25% in 2017E. Toshiba and GEA acquisitions will help Midea and QD Haier tap into Japan and the US markets while cross-selling their brands to China. KUKA acquisition should enhance Midea's automation and tap into the fast growing robotic market.
■ Our top picks (OUTPERFORMs) are Midea, Robam and Gree. We like Midea for its strongest earnings prospect among white goods players and well-diversified product category, Robam for its strongest momentum as it is the market share taker in the fast-growing imbedded kitchenware segment. We like Gree for its cheap valuation, high dividend yield and accelerated earnings growth on AC restocking. Risks to our rating and TP include consumption trends change, adverse pricing competition and volatile raw material prices.
Figure 1: CAGR forecast for 2016-18
Source: AVC, CMM, IOL, Company data, Credit Suisse estimates
9%
6%
5%
5%
3%
2%
1%
0%
1%
2%
3%
4%
5%
6%
7%
8%
9%
10%
Kitctenware Life smallappliances
AC Water heater Washer Fridge TV

26 October 2016
China Home Appliance Sector 2
Focus charts and tables
Figure 2: Industry growth driven by urbanisation Figure 3: Industry is trading up
Source: AVC,CMM,IOL, Credit Suisse estimates Source: NBS,AVC, r Credit Suisse estimates
Figure 4: We expect margin expansion for most of
our coverage companies Figure 5: AC inventory issues almost solved
Source: Credit Suisse estimates Source: AVC, IOL, Credit Suisse estimates
Figure 6: White goods sector trading at 11x P/E Figure 7: Kitchenware sector trading at 19x P/E
Source: Bloomberg, Credit Suisse estimates Source: Bloomberg, Credit Suisse estimates
Figure 8: TP and highlights
Company Name CS Ticker Rating Last Price TP Upside Mkt Cap Trd vol CAGR P/E P/E PEG P/B ROE DY
/Downside US$mn US$ mn 16-18E 2016E 2017E 2017E 2017E 2017E 2017E
Qingdao Haier 600690.SS O 10.3 12.3 19.6% 9,141 40 15.0% 12.4 10.8 0.9 2.0 19% 2%
Midea Group 000333.SZ O 26.8 34.5 28.7% 25,075 128 14.8% 11.7 10.1 0.8 2.4 24% 4%
Gree Electric 000651.SZ O 23.0 28.0 21.6% 19,892 138 11.3% 9.5 8.7 0.8 2.4 27% 8%
Haier Electronic 1169.HK N 12.5 13.4 7.0% 4,464 6 10.3% 11.5 10.4 1.1 2.0 15% 1%
Robam 002508.SZ O 38.6 50.3 30.3% 4,135 25 28.2% 23.9 18.4 0.8 5.5 30% 2%
Joyoung Co 002242.SZ N 19.9 21.5 8.0% 2,266 15 11.5% 22.1 19.7 1.9 4.0 20% 4%
Source: Company data, Credit Suisse estimates price is as of Oct 25, 2016 market close
The authors of this report wish to acknowledge the contribution made by Yvonne Wu, an employee of
Evalueserve, a third-party provider of offshore research services to Credit Suisse
0
20
40
60
80
100
120
140
Color TV Air Conditioner Refrigerator WashingMachine
Water heater
Urban Rural
0
500
1,000
1,500
2,000
2,500
3,000
3,500
4,000
2012 2013 2014 2015 6M16AC Washer Fridge Gas stove Range hood Sterilizer
Rmb
0%
5%
10%
15%
20%
25%
Midea Gree QD Haier Haier Elec Robam Joyoung
2016 NPM 2018E NPM
30
40
26
-
5
10
15
20
25
30
35
40
45
2014 Jul 2015 Jul 2016 Jul
mn units
0.0
2.5
5.0
7.5
10.0
12.5
15.0
17.5
20.0
Jan10
Apr10
Jul10
Oct10
Jan11
Apr11
Jul11
Oct11
Jan12
Apr12
Jul12
Oct12
Jan13
Apr13
Jul13
Oct13
Jan14
Apr14
Jul14
Oct14
Jan15
Apr15
Jul15
Oct15
Jan16
Apr16
Jul16
Mean: 11
Std: 2.3
Mean
Mean +2 std
Mean -2 std
Mean +1 std
Mean -1 std
0.0
5.0
10.0
15.0
20.0
25.0
30.0
35.0
Jan10
Apr10
Jul10
Oct10
Jan11
Apr11
Jul11
Oct11
Jan12
Apr12
Jul12
Oct12
Jan13
Apr13
Jul13
Oct13
Jan14
Apr14
Jul14
Oct14
Jan15
Apr15
Jul15
Oct15
Jan16
Apr16
Jul16
Mean: 19.3Std: 4.3
Mean -1 std
Mean
Mean +1 std
Mean -2 std
Mean +2 std

26 October 2016
China Home Appliance Sector 3
Riding on consumption upgrade and industry consolidation
Growth: Kitchenware > small appliance > white goods
We expect the home appliance sector growth to accelerate to 5% over 2016-18, faster
than +2% in 2014/15, thanks to the end of the AC price war as channel inventory improves
along with rising replacement needs as sales during 2008-13 driven by government
subsidies program will enter into replacement cycle (normal replacement at 8-10 years for
large appliance). The strong property cycle starting in 2H15 will partially boost sales
demand. We expect the traditional white goods to post stable growth, while we see
strong potential in kitchenware and small appliances categories.
White goods sector: A relatively mature market
White goods segment is at a mature stage. We expect AC, water heater, washing machine
and refrigerator growing at 5%, 5%, 3%, 2% CAGR, respectively. AC and water heater
should have stronger outlook as these two categories are still under penetrated.
Consumption upgrade and replacement needs will be the key drivers. The strong property
market starting in 2H15 will be positive to the sector in 2H16/1H17. Nevertheless,
correlation between property and home appliance sales is gradually diminishing, as
replacement demand is picking up and many new home sales are driven by investment
purpose. In the near term, we see double-digit AC sales growth at the manufacturing
end, which should be key share price catalyst for market leaders Gree and Midea.
White goods giants eyeing global
White goods giants are expanding to overseas through M&As and switching from OEM
(original equipment manufacturer) to OBM (original brand manufacturer). Toshiba and
GEA acquisitions will help Midea and QD Haier tap into Japan and the US markets while
cross-selling their brands to China. KUKA acquisition would enhance Midea's automation
and tap into the fast growing robotic market. Strong R&D capability and RMB depreciation
will strengthen brand image and drive better OBM sales. We forecast overseas to account
for 45%/55%/25% of QD Haier, Midea and Gree in 2017E from 21%/40%/15% in 2015.
Kitchenware: A fast-growing segment
Kitchenware market is at a growing stage. We expect the industry to witnessed a 9%
CAGR over 2016-18 backed by: (1) low penetration rate of 30-40% versus white goods at
70-90%, (2) rising demand driven by aging population and two child policy and (3) upgrade
to better brands and products with more functionality as the Chinese has higher standard
of living. At imbedded kitchenware, consumers are trading up to premium brands such as
Robam and Fotile. At small kitchen appliances, growth is driven by specialisation and
product category expansion. Midea, Joyoung and Supor are the key market players.
Top picks: Midea, Robam, and Gree
With this sector report, we initiate and assume coverage on the four white goods
companies—Midea, Gree QD Haier, Haier Electronic (NEUTRAL) and two kitchenware
companies—Robam (OUTPERFORM) and Joyoung (NEUTRAL). Our top picks are
Midea, Robam and Gree. We like Midea for its strongest earnings outlook at 14.8%
CAGR (0.8 PEG) and well-diversified product categories, Robam for its 28% earnings
CAGR over 2016-18 backed by market share gain in the fast growing kitchenware
segment, and Gree for its attractive valuation at 10.5x P/E (5x ex-cash P/E) along with
accelerating earnings growth of 11.3% 2016-18 CAGR. We rate Joyoung and Haier
Electronic at NEUTRAL as their earnings outlook and valuation are not attractive enough.

26 O
cto
be
r 201
6
Ch
ina H
om
e A
pp
lian
ce
Sec
tor
4
Figure 9: Valuation table
Company Name CS Ticker Price Market Cap Rating TP GPM GPM OPM OPM NPM NPM ROE ROE CAGR P/E PEG P/B
2016E 2017E 2016E 2017E 2016E 2017E 2016E 2017E 16-18E 2017E 2017E 2017E
White good
Qingdao Haier 600690.SS 10.28 9,141 O 12.3 28.8% 29.7% 7.0% 6.7% 4.4% 4.2% 19.1% 18.8% 15% 10.8 0.7 2.0
Hisense Kelon 000921.SZ 11.39 1,893 NC na 24.0% 24.6% 4.8% 5.6% 4.6% 5.3% 24.5% 25.4% 22% 15.6 0.7 3.2
Midea Group Co 000333.SZ 26.8 25,075 O 34.5 29.5% 32.7% 9.5% 10.4% 9.6% 9.9% 24.2% 23.8% 15% 10.1 0.7 2.4
Guangdong Homa 002668.SZ 78.22 1,797 NC na 33.1% 32.2% 8.4% 8.3% 6.2% 6.1% 13.5% 12.6% 18% 30.1 1.7 5.9
Hefei Meiling 000521.SZ 7.02 999 NC na 21.0% 21.4% 2.5% 2.9% 2.0% 2.2% 6.5% 7.3% 20% 21.6 1.1 1.7
Haier Electronic 1169.HK 12.46 4,464 N 13.4 16.7% 16.7% 5.1% 5.3% 4.3% 4.4% 15.3% 14.7% 10% 10.4 1.0 2.0
Whirlpool Chin-A 600983.SS 11.56 1,279 NC na 33.5% 33.7% 6.2% 6.8% 5.9% 6.2% 8.3% 9.1% 24% 19.8 0.8 1.9
Wuxi Little Sw 000418.SZ 34 2,797 NC na 27.1% 27.5% 9.7% 9.9% 7.3% 7.4% 20.0% 20.8% 23% 15.2 0.7 3.6
Gree Electric 000651.SZ 23.03 19,892 O 28.0 36.4% 37.7% 12.3% 14.0% 13.8% 13.7% 27.4% 27.2% 11% 8.7 0.8 2.4
Average 27.8% 28.5% 7.3% 7.8% 6.5% 6.6% 17.6% 17.7% 14% 11.1 0.7 2.2
Kitchenware
Hangzhou Robam 002508.SZ 38.59 4,135 O 50.3 58.9% 59.2% 22.3% 23.7% 20.2% 21.3% 29.0% 29.6% 28% 18.4 0.7 5.5
Zhejiang Supor 002032.SZ 37.26 3,444 NC na 30.0% 30.3% 11.3% 11.8% 9.0% 9.5% 20.3% 20.2% 18% 18.4 1.0 4.5
Joyoung Co 002242.SZ 19.91 2,266 N 21.5 31.9% 31.6% 11.4% 11.1% 9.0% 8.9% 20.2% 20.5% 12% 19.7 1.7 4.0
Guangdong Xinb 002705.SZ 17.34 1,500 NC na 20.1% 20.8% 7.4% 8.5% 5.8% 6.6% 15.6% 17.7% 26% 19.0 0.7 3.5
Zhejiang Meida 002677.SZ 12.62 1,170 NC na 54.3% 56.4% 36.1% 37.7% 31.4% 32.6% 17.9% 20.6% 31% 28.4 0.9 6.7
Vatti Corp Ltd 002035.SZ 25.92 1,383 NC na 42.0% 42.3% 8.1% 9.1% 7.0% 7.7% 17.9% 19.5% 34% 23.5 0.7 5.3
Guangdong Vanward 002543.SZ 17.85 1,130 NC na 33.5% 33.8% 8.9% 9.2% 7.8% 8.0% 12.3% 12.9% 17% 18.2 1.1 2.6
Average 38.7% 39.2% 15.1% 15.9% 12.9% 13.5% 19.0% 20.1% 24% 20.78 1.0 4.6
Note O = Outperform, NC= Not covered. Source: Reuters, Bloomberg estimates for NC companies, Credit Suisse estimates for rated companies

26 October 2016
China Home Appliance Sector 5
Table of contents
Riding on consumption upgrade and industry consolidation 1
Focus charts and tables 2
Riding on consumption upgrade and industry consolidation 3
Growth: Kitchenware > small appliance > white goods 6
White goods: A relatively mature market 8
China white goods giants eyeing global 24
Top picks: Midea, Robam and Gree 36
China Home Appliance Sector through HOLT Lens™ 40
Midea Group Co Ltd (000333.SZ / 000333 CH) 43
Gree Electric Appliances Inc of Zhuhai (000651.SZ / 000651 CH) 59
Qingdao Haier Co., Ltd. (600690.SS / 600690 CH) 72
Haier Electronics Group Co., Ltd. (1169.HK / 1169 HK) 82
Hangzhou Robam Appliances Co Ltd (002508.SZ / 002508 CH) 86
Market share taker in a fast growing industry 86
Joyoung Co Ltd (002242.SZ / 002242 CH) 101

26 October 2016
China Home Appliance Sector 6
Growth: Kitchenware > small appliance > white goods We expect home appliance sector growth to accelerate to 5% over 2016-18 from 2% in
2014-15 led by: (1) the end of the AC price war after inventory overhang issue was
resolved, (2) product mix enhancement and (3) rising replacement demand, as consumer
electronics purchased in 2008-13 during the government subsidies program are entering
into the replacement phase. In addition, the strong property cycle starting from 2H15 will
partially boost sales demand in 2H16 and 1H17, considering the 9-12 months delay effect.
China home appliance sector is made up of multiple categories (see figure 2) and each is
at a different development stage. Overall, when comparing to the developed markets such
as the US, Western Europe and Japan, we still see room for penetration as China’s
urbanisation rate is only 56% versus over 75% for the developed markets.
By category, traditional white goods sector (air conditioning, refrigerator and washing
machines) has entered into a mature stage with stable growth. Traditional TVs are in a
declining stage as consumers are watching media through portable devices such as smart
phones and personal laptops (we have not initiated coverage on TV segment at present).
In contrast, kitchenware and small appliances are in the growing stage supported by new
features and specialisation. Household robots, kitchen waste processor and other
innovative products are in introduction period with huge potential upside, in our view.
Figures 2 and 3 below summarise the growth of major electronic categories as well as
their development cycles.
We expect kitchenware companies including Robam to deliver stronger earnings outlook
than the white goods companies, but we believe that has also reflected in a higher
valuations of kitchenware and small appliance companies.
Figure 10: Home appliances industry growth cycle
Source: Credit Suisse research
Introduction period Growing period Mature period Declining period
Household
robotics
Kitchen-waste
processor
Small
kitctenware
Life small appliances White goods
Traditional TV
Fan
Embedded
kitchenware

26 October 2016
China Home Appliance Sector 7
Figure 11:CAGR forecast for 2016-18
Source: AVC, CMM, IOL, Company data, Credit Suisse estimates
Figure 12: Home appliance sector is expected to
grow at 5% CAGR over 2016-18
Figure 13: TV/AC/Kitchenware are the three biggest
segments in the China market
Source: CMM, Credit Suisse estimates
Source: CMM, Credit Suisse estimates
9%
6%
5%
5%
3%
2%
1%
0%
1%
2%
3%
4%
5%
6%
7%
8%
9%
10%
Kitctenware Life smallappliances
AC Water heater Washer Fridge TV
8,001
-10.0%
-5.0%
0.0%
5.0%
10.0%
15.0%
20.0%
0
1,000
2,000
3,000
4,000
5,000
6,000
7,000
8,000
9,000
2008 2009 2010 2011 2012 2013 2014 2015 2016E 2017E 2018E
Rmb 100 mnAC
20%
Washer7%
Fridge13%
Kitctenware17%
Life small appliances
7%
TV22%
Water heater14%

26 October 2016
China Home Appliance Sector 8
White goods: A relatively mature market China white goods sector is a relatively mature market. We see the industry growing at 3-
5% CAGR over 2016-18 driven by: (1) urbanization, (2) new home sales and (3) product
upgrade/replacement. Based on industry estimate, each factor contributes 25-35%,
20-25%, and 35-45%, respectively.
1) Urbanization drives penetration
In China, the penetration rate for urban area for most appliances are close to the level of
the developed countries, which is more than or close to 100%, and thus volume growth is
capped (see figure 5). We believe urban market growth will be mainly driven by mix and
replacement (average white goods replacement cycle in China is around eight years).
However, AC is a special segment where China's urban area still lags that of developed
countries. China's average AC penetration rate is only 85% versus Hong Kong, Japan,
Taiwan at 223%/147%/135%. Given AC penetration can go up to 200-300% (e.g. two to
three ACs per household), we see room for solid volume growth even in urban areas. In
contrast, we believe washing machine and refrigerator growth in urban areas to be driven
by replacement demand.
We see large growth potential in rural areas of China as the penetration of AC, washing
machine and refrigerator is only at 76%, 14%, and 11%, respectively. We see room for
their penetration rates to catch up to urban area rates during urbanization progress as
income increases.
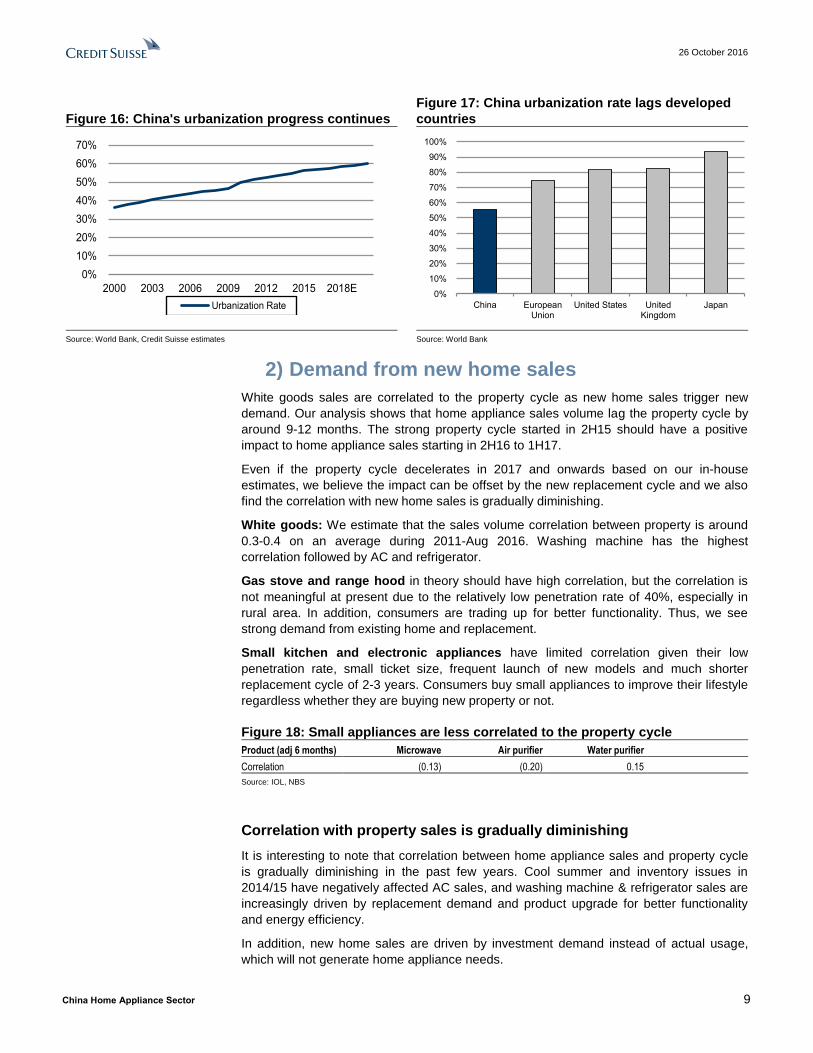
Overall, urbanization rate in China is only 56% in 2015—it is expected that urbanization
rate will increase to 60% by 2020 based on government target. Rising urbanization and
penetration in rural area will be one of the key drivers of white goods' segment growth.
Figure 14: Rural area home appliances are still
underpenetrated Figure 15: AC penetration can go up to 200-300%
Source: NBS, AVC, Credit Suisse Source: Euromonitor
0
20
40
60
80
100
120
140
Color TV Air Conditioner Refrigerator WashingMachine
Water heater
Urban Rural
85
135147
223
0
50
100
150
200
250
China Taiwan Japan Hong Kong
%
26 October 2016
China Home Appliance Sector 9
Figure 16: China's urbanization progress continues
Figure 17: China urbanization rate lags developed
countries
Source: World Bank, Credit Suisse estimates Source: World Bank
2) Demand from new home sales
White goods sales are correlated to the property cycle as new home sales trigger new
demand. Our analysis shows that home appliance sales volume lag the property cycle by
around 9-12 months. The strong property cycle started in 2H15 should have a positive
impact to home appliance sales starting in 2H16 to 1H17.
Even if the property cycle decelerates in 2017 and onwards based on our in-house
estimates, we believe the impact can be offset by the new replacement cycle and we also
find the correlation with new home sales is gradually diminishing.
White goods: We estimate that the sales volume correlation between property is around
0.3-0.4 on an average during 2011-Aug 2016. Washing machine has the highest
correlation followed by AC and refrigerator.
Gas stove and range hood in theory should have high correlation, but the correlation is
not meaningful at present due to the relatively low penetration rate of 40%, especially in
rural area. In addition, consumers are trading up for better functionality. Thus, we see
strong demand from existing home and replacement.
Small kitchen and electronic appliances have limited correlation given their low
penetration rate, small ticket size, frequent launch of new models and much shorter
replacement cycle of 2-3 years. Consumers buy small appliances to improve their lifestyle
regardless whether they are buying new property or not.
Figure 18: Small appliances are less correlated to the property cycle
Product (adj 6 months) Microwave Air purifier Water purifier
Correlation (0.13) (0.20) 0.15
Source: IOL, NBS
Correlation with property sales is gradually diminishing
It is interesting to note that correlation between home appliance sales and property cycle
is gradually diminishing in the past few years. Cool summer and inventory issues in
2014/15 have negatively affected AC sales, and washing machine & refrigerator sales are
increasingly driven by replacement demand and product upgrade for better functionality
and energy efficiency.
In addition, new home sales are driven by investment demand instead of actual usage,
which will not generate home appliance needs.
0%
10%
20%
30%
40%
50%
60%
70%
2000 2003 2006 2009 2012 2015 2018E
Urbanization Rate0%
10%
20%
30%
40%
50%
60%
70%
80%
90%
100%
China EuropeanUnion
United States UnitedKingdom
Japan

26 October 2016
China Home Appliance Sector 10
Property sales picked up since 2H15, with sales volume rising by 8% in 2H15 and 27%
YTD; we expect it will trigger better white goods sentiment in 2H16/1H17 taking into
account the 9-12 months lagging effect.
Figure 19: Property market will pick up in 2016E and
slow down in 2017/18E
Figure 20: White goods have diminishing
correlation with property market
Source: NBS, Credit Suisse estimates Source: NBS,IOL Credit Suisse estimates
After the strong momentum in 2H15 and 2016E, our property team is turning more
conservative into 2017E/2018E with projected sales volume to decline by 0.9%/3.5%. We
agree that would have a slightly negative effect to white goods companies in 2H17/2018E
and onwards. Nevertheless, we are not overly concerned, especially for leading white
goods companies given the following:
Correlation is only 0.3 in the past and is on a diminishing trend
A large percentage of property, especially in Tier 1-3 cities are for investment
purpose, which do not generate home appliance sales.
Home appliance segment is entering a replacement cycle starting 2017. The
normal replacement cycle is around eight to ten years—many home appliances
that were bought between 2007 and 2013 triggered by government subsidy
programs are now entering the replacement cycle. The aggregate sales during
2007 to 2013 amounted to Rmb4,800 bn, which is 6.8 times larger than the
annual industry sales of Rmb700 bn, and it's expected to release new demand
gradually.
The strong white goods sales driven by RMB depreciation, stronger Chinese branding and technology should offset a potential domestic sales weakness.
Replacement cycle is shortening as consumers trade up on high-end products
with better functionality and energy efficiency. Many consumers nowadays
replace their home appliance before it is broken/non-functional.
Leading white goods companies are gaining market shares as consumers' trade
up to better brands and quality. We see market consolidation toward the
top 5 companies.
Through M&As and developing own brand sales in foreign market, overseas sales
now accounts for an increasing percentage of the leading white goods companies'
sales. Midea, Gree and QD Haier have strong present in the SE. Asia which is a
growing market.
-30.0%
-20.0%
-10.0%
0.0%
10.0%
20.0%
30.0%
40.0%
50.0%
60.0%
-
200
400
600
800
1,000
1,200
1,400
1999 2001 2003 2005 2007 2009 2011 2013 2015 2017E
China residential property sold (mn sqm) -LHS YoY change-RHS
mn sqr
-50%
-30%
-10%
10%
30%
50%
70%
1/2012 7/2012 1/2013 7/2013 1/2014 7/2014 1/2015 7/2015 1/2016 7/2016
Property sales YoY AC sales YoY WM sales YoY Fridge sales YoY

26 October 2016
China Home Appliance Sector 11
3) Consumption upgrade drives ASP growth
We see white goods and kitchenware ASP growing at 3%/5% CAGR for the next three
years, compared to 2%/6% CAGR in the past few years. Consumers are trading up for
better functionality, smart features and energy efficiency.
In our view, the consumption upgrade trend will continue and kitchenware will continue to
outgrow white goods as trade-up to high-end brands is more obvious. Among domestic
players, we prefer high-end kitchenware brands such as Robam. Consumers are willing to
pay a premium to buy stylish products, as they see imbedded kitchenware (e.g., range
hood and stove) as part of the renovation.
We also like QD Haier and Midea as they have the broadest smart product offerings (see
table 21), which is one of the key driver of industry ASP growth. Gree has less upside due
to single product category, where it is hard to create a smart eco system and its AC selling
price is already at a 15% premium due to its strong branding.
Figure 21: Home appliances sector is trading up with steady ASP increase
Source: CMM, Credit Suisse estimates
Product mix enhancement
Over the last two years, we see product upgrades in AC/washer/refrigerator in terms of
functionality. Better product mix will engine ASP growth. For example, consumers now buy
AC with low noise, larger size and front load washers, and multiple-door refrigerators for
better food management. The below chart summarise the product mix change in various
key appliance categories.
0
500
1,000
1,500
2,000
2,500
3,000
3,500
4,000
2012 2013 2014 2015 6M16
AC Washer Fridge Gas stove Range hood Sterilizer
Rmb

26 October 2016
China Home Appliance Sector 12
Figure 22: Inverter AC increased from 57% to 63%
Figure 23: Large size washer increased from 16% to
39%
Source: CMM Source: CMM
Figure 24: Front-load washer increased from 32% to
41%
Figure 25: Multi-door refrigerator increased from 8%
to 18%
Source: CMM Source: CMM
Smart home market—early stage with huge potential
The smart home appliances market is at Rmb90bn, representing 13% of total industry
sales. We expect total smart home market size to double by 2018 with a 26% CAGR due
to low penetration rate. On an average, smart appliances have 20% premium over normal
products. Rising smart appliance will drive industry ASP growth.
Penetration in China is low at 6%/12%/16% for refrigerator, washing machines and AC.
Smart kitchenware penetration is almost zero. CMM expects smart refrigerator/washing
machines/AC penetration to reach 20%/45%/55% in 2020. For Haier, the leading smart
appliances manufacturer only has 15% smart products sales in 2015. We believe the 26%
CAGR is achievable with reference to 78% penetration rate for smart TVs.
57%63%
0%
10%
20%
30%
40%
50%
60%
70%
80%
90%
100%
2014 7M16Inverter non-inverter
16%
39%
0%
10%
20%
30%
40%
50%
60%
70%
80%
90%
100%
2014 7M16
>8KG 7-7.9KG 6-6.9KG 5-5.9KG <4.9KG
32%41%
0%
10%
20%
30%
40%
50%
60%
70%
80%
90%
100%
2014 7M16
Front load Tumbling box Double cylinder Single cylinder
8%
18%
0%
10%
20%
30%
40%
50%
60%
70%
80%
90%
100%
2014 7M16
side by side multiple door 3 door 2 door single door

26 October 2016
China Home Appliance Sector 13
Figure 26: Smart home market will grow at a fast
pace
Figure 27: Smart home appliances have low
penetration rate
Source: Haier.com, Credit Suisse estimates Source: AVC, CMM
We conducted a channel check and found that for a similar model, products with smart
features are priced at around 15-25% price premium over non-smart products. That said,
consumer preference to smart products will increase ASP for 2% for the next three years.
Figure 28: Retail price for smart and non-smart products
Product Smart price Non-smart price Premium for smart
function
AC Inverter /3rd grade efficiency 3,466 2,932 18.2%
Refrigerator Two door/530L/non-inverter 3,499 3,099 12.9%
Washing machine 7KG/drum type/non-inverter 1898 1498 26.7%
Source: Tmall, GOME, JD
Midea/Haier leading the trend in smart products
Midea and Haier are the leading domestic players with integrated smart appliances
platform. They are the initial domestic brands to develop integrated smart system back in
2014 (U+ for Haier and M+ for Midea), and they offer the largest smart product categories.
90
180
0
20
40
60
80
100
120
140
160
180
200
2015 2020E
26%
Rmb bn
4% 6%
20%
5%
12%
45%
8%
16%
55%
73%78%
93%
0%
10%
20%
30%
40%
50%
60%
70%
80%
90%
100%
2015 1H16 2020E
Fridge WM AC TV

26 October 2016
China Home Appliance Sector 14
Figure 29: Haier and Midea have broadest smart product categories
Haier Midea TCL Gree Xiaomi Roban Joyoung Skyworth LeTV
Air conditioner Y Y Y Y Y
Air purifier Y Y Y Y Y
Cordless home appliance Y Y
Game Console Y
Refrigerator Y Y Y Y
Smartphone Y Y Y Y
Oven Y Y
Washing machine Y Y
Water heater Y Y
TV Y Y Y Y Y
Robot vacuum cleaner Y Y Y Y
Plug Y
Rice cooker Y Y Y
Kitchen Y
Hood Y
Soymilk machine
Source: Company data, Credit Suisse estimates
Until today, both companies have partnered with Ali, Huawei, Wechat, JD, etc., as well as
international giants including Apple. Midea has also led in Xiaomi with 1.288% stock
offering while Haier has partnered with Meizu.
Amongst white goods leaders, Gree is less active on smart application due to product
concentration. It has partnered with Ali and JD to develop smart ACs. In 2013, the firm
also launched its own Gree smart phone to enlarge its smart product categories. However,
sales of Gree smart phone are way below management and market expectations.
No new government subsidy program at present
We see no new government subsidy program to trigger sales at present. In Nov 2015, the
government launched a new program known as "Energy Top Runner". This program
chose the most energy efficient products and awarded them "Top Runner". It is a
reputational reward rather than monetary benefits.
The passing of government subsides during 2007-13 resulted in a strong 10% sales
CAGR during the period. These subsides partly front loaded the market demand but also
increased penetration, especially in rural areas. This to some extent explained in the
slower market growth in 2014/15 after the program ended. We believe the market should
normalise in 2H16 and onwards.
In 2016, National Development and Reform Commission published a target that by 2020,
two-level efficiency home appliances need to take up at least 50%. Up to August 2016,
two-level efficiency penetration was 32% for AC. Channel check suggests that one-level
efficiency and two-level efficiency are 35% and 15% more expensive than three-level
efficiency ACs , which implies 4% ASP for ACs.
In our view, large brands such as Midea, Haier, and Gree with high production standards
and large R&D investments will benefit from energy-efficiency trends.

26 October 2016
China Home Appliance Sector 15
Figure 30: Government subsidy programs
Time Subsidy Program Applicable products Size
Dec 2007 - Jan 2013 Home appliance to rural (家电下乡) TV, white goods, mobile phone, PC Cumulative sales over Rmb 720bn and sales
volume of ~300mn units
Jun 2009 - Dec 2011 Old for new program (以旧换新) TV, white goods, PC stimulated over Rmb340bn home appliances
consumption
June 2009 - May 2011 Energy saving subsidy (节能惠民) AC, auto, light, motor, etc. stimulated over Rmb70bn home appliances
consumption
June 2012 - May 2013 New energy saving subsidy (新节能惠民) TV, white goods, water heater stimulated over Rmb250bn home appliances
consumption
Nov 2015 - current Top runner (领跑者) White goods that meet the most stringent
energy saving standards
NA
Source: Company data, Credit Suisse estimates
Figure 31: Room to grow for energy-efficient
products
Figure 32: One-level and two-level efficient products
have 35% and 15% price premium
Source: NDRC, CMM Source: CMM,
50%
32%
0%
10%
20%
30%
40%
50%
60%
Government target Current penetration 0
20
40
60
80
100
120
140
160
3-level efficiency 2-level efficiency 1-level efficiency
price index

26 October 2016
China Home Appliance Sector 16
AC: The worst is over, manufacturing sales picking up
With the inventory overhang situation largely over and central AC demand picking up, we
believe the AC sector is ready for a 5% CAGR over 2016-18 at the retail level. Based on
the Jul-Sep IOL data, China domestic AC shipments increased 16%/23%/37% from a low
base versus 32%/10% decline in 1H16 and 2015. Our discussions with major AC
manufacturers suggest a strong expected rebound in AC manufacturing sales in 2H16 and
1H17 driven by low base and solid retail demand.
Market highly concentrated led by Gree
Currently, the market size of AC is around Rmb137 bn, which is 175% and 57% larger
than washing machines and refrigerators, respectively. The market is highly concentrated,
with top three leaders taking 68% share. By value, Gree is the No.1 player with 33%
market share, followed by Midea at 25% and Haier at 11%.
Domestic and foreign brands are priced at similar levels, which to some extent reflect
refined technique and well-established brand image for domestic players. Among domestic
players, Gree has the largest price premium due to strong branding.
Figure 33: AC market size growth
Figure 34: Market breakdown by retail volume
(8M16)
Source:IOL, Credit Suisse estimates Source: CMM
Figure 35: Market break down by retail value (8M16)
Figure 36: Gree has 15% price premium due to
branding
Source: CMM Source: CMM
-12%
-6%
0%
6%
12%
18%
24%
30%
36%
42%
0
20
40
60
80
100
120
140
160
2009 2010 2011 2012 2013 2014 2015
AC market size (LHS) YoY chg (RHS)
Rmb bn
Error! Use the Home tab to apply Report Date to the text that you want
to appear here.
Gree29%
Midea24%
Haier10%
Hisense6%
Aux5%
TCL4%
Chigo5%
Whirpool3%
Others14%
Gree33%
Midea25%
Haier11%
Hisense6%
Aux4%
TCL2%Chigo
3%
Whirpool2%
Others14%
178
115 105 102 102 100 100 95
86 77 73 73
60 49
0
20
40
60
80
100
120
140
160
180
200
Misubishi
Gree
Haier
Foreign
Midea
Industry
Dom
estic
Hisense
Aux
Kelon
Chigo
Whirlpool
TC
L
Electrolux

26 October 2016
China Home Appliance Sector 17
Destocking has largely completed
With record-breaking hot weather in summer 2016 and the aggressive destocking by
leading players since 2Q15, we believe AC inventory level should see significant
improvement after August. Current inventory level is around 26 mn units, compared to 40
mn units a year ago (down 35% YoY and also 10% below the end of summer inventory
level in 2014). Companies are trying to reduce to three-month inventory versus four-/five-
month now, which we believe will take another one to two quarters to achieve.
AC domestic sales volume grew 16%/23%/37% over July-Sep, after 13 months of
consecutive decline. Surging sales brought down more than 10 mn units of inventory
between August 2015 and July 2016.
Companies continue to rationalise their inventory level by reducing shipments to
distributors and shortening production cycle. We believe the destocking process will
continue to help new product sales and increase ASP and margin subsequently.
Figure 37: AC sales surged in June/July this year
Figure 38: Inventory has decreased more than 10mn
units
Source: IOL Source: CMM, IOL, Credit Suisse estimates
Figure 39: Channel inventory problem has improved significantly from 2H15 to
1H16
Source: IOL, CMM, Credit Suisse estimates
-50%
-40%
-30%
-20%
-10%
0%
10%
20%
30%
40%
50%
0
100
200
300
400
500
600
700
800
900
1,000
Jul 14 Oct 14 Jan 15 Apr 15 Jul 15 Oct 15 Jan 16 Apr 16 Jul 16
Domestic shipments YoY change
mn units
30
40
26
-
5
10
15
20
25
30
35
40
45
2014 Jul 2015 Jul 2016 Jul
mn units
-
100
200
300
400
500
600
700
800
900
1,000
Dec-13 Jun-14 Dec-14 Jun-15 Dec-15 Jun-16
Shipments Retail sales volume
10K units
Destocking
Stocking
CMM, IOL, Credit Suisse estimates

26 October 2016
China Home Appliance Sector 18
Central AC—domestic brands catching up
Central AC market is around Rmb69 bn. We expect central AC to witness a 7% CAGR in
the next three years, slightly faster than household ACs. Domestic leading brands such as
Midea, QD Haier and Gree should enjoy faster growth due to market share gains.
Foreign brands still dominate the market at this stage, but domestic brands are capturing
market share rapidly. We see the domestic brand share increasing gradually from 34% in
2014 to 45% in 1H16.
A central AC has more elegant display than a traditional one and does a better job in
matching overall in-house decoration. It is also more energy-efficient, which coincides with
the consumption trend and government guidance. Individual housing, commercial areas
including offices, shopping malls, subways, etc., can use central ACs.
Daikin, Midea and Gree are the leading brands with 18%, 17% and 16% market share,
respectively. We expect the central AC business to outgrow the residential business for
Midea and Gree's, as the central AC business has high entry barrier and requires strong
reputation.
Figure 40: Midea, Daikin, Gree led central AC market Figure 41: Domestic brands gaining market share
Source: IOL Source: Aircon.con
Washing machine/refrigerator—stable growth driven
by replacement needs and export sales
Washing machine and refrigerator are mature segments with less growth potential due to
high penetration. Segment growth will be mainly driven by replacement needs and export
sales. We expect replacement needs to increase starting from 2017, as sales boosted by
government subsidies programs in 2007-13 will enter into the replacement cycle. Strong
export sales is another growth driver, as domestic brands are stronger and develop better
sales channels overseas. We see washer/refrigerator record 4%/9% export sales growth
YTD.
QD Haier is No.1 in both segments, with 27%/28% market share in washer/refrigerator.
We expect its leading position to remain, backed by mid-to-high end position in the context
of consumer trade-up and strong presence in smart appliance. Starting in late 2015, QD
Haier also launched more SKUs with price below Rmb2,000 for washer/refrigerator to take
shares of customers who are more price sensitive.
Daikin+McQuay18%
QD Haier7%
Midea17%
Gree16%
York5%
Carrier4%
Hitachi8%
Others25%
34%
45%
0%
5%
10%
15%
20%
25%
30%
35%
40%
45%
50%
2011 1H16

26 October 2016
China Home Appliance Sector 19
Figure 42: Washing machine market share (8M16 in
value) Figure 43: Refrigerator market share (8M16 in value)
Source: CMM Source: CMM
Figure 44: Refrigerator has 9% export growth YTD
(volume)
Figure 45: Washer has 4% export growth YTD
(volume)
Source: IOL Source: IOL
Haier27%
Little Swan17%
Midea5%
Siemens14%
Sanyo6%
Panasonic8%
Hisense2%
Samsung5%
Others16%
Haier28%
Midea11%
Rongsheng11%
Meiling9%
Hisense4%
Siemens12%
Xinfei2%
Electrolux1%
Others22%
-20%
-10%
0%
10%
20%
30%
40%
50%
0
50
100
150
200
250
300
350
Jul 14 Oct 14 Jan 15 Apr 15 Jul 15 Oct 15 Jan 16 Apr 16 Jul 16
Sales volumn YoY
10k units
-30%
-20%
-10%
0%
10%
20%
30%
40%
0
20
40
60
80
100
120
140
160
180
Jul 14 Oct 14 Jan 15 Apr 15 Jul 15 Oct 15 Jan 16 Apr 16 Jul 16
Export sales volume (LHS) YoY (RHS)
10k units

26 October 2016
China Home Appliance Sector 20
Upgrade drives GPM, raw material is controllable
In general, home appliance companies' GPM has been rising in the past few years driven
by higher ASP from stronger branding and product mix enhancement, cheaper raw
material costs, efficiency enhancement and economies of scale. Among the key
categories, kitchenware saw the highest margin expansion driven by consumption
upgrade, followed by AC, refrigerator, and washing machine.
Raw material cost accounts for about 70% of COGS for white goods. Major raw materials
include plastic, steel, copper, and aluminum. Comparing prices in 2013 versus now,
copper/aluminum, cold-rolled steel, stainless steel and polypropylene have decreased by
28%, 12%, 26%, 23%, and 43%, respectively. We see a slight raw material price increase
since 2016, but still within the historical low range.
We conducted a sensitivity analysis on the raw material hike impact to white goods GPM
and summarised on the table below. Overall, we believe that raw material is a controllable
risk. In the worst case scenario, where all raw material prices go up together (which in our
view is highly unlikely based on historical trend), we estimate that a 1% ASP increase can
offset a 2% increase in overall raw material prices (see figure 48).
As the white goods market is highly concentrated and all major players are listed
companies, we expect the white goods companies to likely raise prices to pass through
cost pressure to end consumers.
Overall, we expect the industry ASP to increase by 3% per annum driven by the positive
factors that we discussed above. We continue to see industry GPM to slightly increase
going forward and raw material should be a controllable risk, in our view.
Figure 46: GPM of our coverage companies
Company Ticker 2013 2014 2015 2016E 2017E 2018E
Midea 000333.SZ 23% 25% 25% 30% 33% 33%
Gree 000651.SZ 23% 25% 25% 30% 33% 33%
QD Haier 600690.SS 25% 27% 28% 29% 30% 30%
Haier Electronics 1169.HK 15% 15% 16% 17% 17% 17%
Robam 002508.SZ 54% 57% 58% 60% 60% 60%
Joyoung 002242.SZ 34% 33% 32% 33% 32% 32%
Source: Company data, Credit Suisse estimates
Figure 47: GPM sensitivity to the change in raw materials and ASP
Gross margin chg (%)
Factor change AC Washing machine Refrigerator
Plastic -0.07 -0.11 -0.18
Copper -0.17 -0.04 -0.11
Steel -0.15 -0.32 -0.18
Labor -0.08 -0.09 -0.09
ASP 0.68 0.7 0.71
Source: Company data, Credit Suisse estimates

26 October 2016
China Home Appliance Sector 21
Figure 48: AC COGS breakdown Figure 49: Washing machine COGS breakdown
Source: Company data, Credit Suisse estimates Source: Company data, Credit Suisse estimates
Figure 50: Refrigerator COGS breakdown Figure 51: Copper/aluminum price trend
Source: Company data, Credit Suisse estimates Source: CEIC
Figure 52: Steel and plastic price trend Figure 53: Raw material price YoY change
Source: CEIC, Thomson Reuters Datastream Source: CEIC, Thomson Reuters Datastream
Steel22%
Plastics10%
Copper25%
Labour12%
Others31%
Steel44%
Plastics15%
Copper6%
Labor13%
Others22%
Copper15%
Steel25%
Plastics25%
Labor13%
Others22%
0
10,000
20,000
30,000
40,000
50,000
60,000
70,000
80,000
2011 2012 2013 2014 2015 2016
Copper aluminum
Rmb/ton
0
5,000
10,000
15,000
20,000
25,000
30,000
2011 2012 2013 2014 2015 2016
Stainless steel Cold rolled steel Polypropylene
-70%
-60%
-50%
-40%
-30%
-20%
-10%
0%
10%
20%
2012 2013 2014 2015 2016
Copper YoY Aluminum YoY Polypropylene YoY
Stainless steel YoY Cold rolled steel YoY
26 October 2016
China Home Appliance Sector 22
Slight margin premium over international brands is sustainable
Compared to the global brands, China white goods sector GPM/OPM was 28%/7%,
compared to 27%/6% for the international players. In our view, the slight margin premium
for the domestic brands is attributed to: (1) almost 100% in-house production, (2)
economies of scale and (3) stronger bargaining power against the channel operators.
Domestic brands manufacture almost 100% in-house and they also do OEM/ODM for
international companies. Meanwhile, their production scales are also larger than many
international brands which lead to stronger raw material power and production efficiency.
On the channel front, for domestic players only 20% of sales are contributed to chain
channels (such as Gome and Suning), while the rest of the sales go towards distributors
and e-commerce platform. In contrast, chain channel is the dominating channel for
international brands, where channel players have stronger bargaining power. This partly
explains the slightly lower OPM for the international brands.
Based on our discussions with industry players, OPM for e-commerce, traditional
distribution and key accounts (chains stores such as Gome and Suning) are similar, while
kitchenware companies generate higher OPM from e-commerce channel as they are self-
operated. Looking forward, we expect e-commerce and traditional channels to be growing
faster than key accounts channel as: (1) the young generation tends to shop online and (2)
e-commerce is under-penetrated in rural areas. We believe the channel changes are
neutral to white goods companies but are positive to kitchenware players as higher sales
mix from e-commerce will increase group GPM.
Export margin is expanding
We expect overseas sales to contribute a larger percentage to white goods companies'
revenue and have higher margin going forward. Majority of the revenue increase is driven
by acquisitions of international brands, which makes similar margin to the existing
business. We see room for margin expansion from sourcing and production synergies. For
the pure export business, their NPM is around half of the domestic business, but their
GPM has been improving from 2012 to 1H16. We expect the rising trend to be sustainable
because of: (1) higher sales mix from better margin OBM model (from ODM/OEM) as
Chinese brands are having stronger brand image globally, (2) RMB depreciation which
also boosted export GPM as export prices are mainly settled in USD and (3) overall export
ASP which has been rising as Chinese players' quality and technology are
becoming better.

26 October 2016
China Home Appliance Sector 23
Figure 54: Chinese companies have slight margin
premium over international brands
Figure 55: Export GPM is expanding for domestic
white goods players
Source: Bloomberg, Credit Suisse estimates Source: Company data, Credit Suisse estimates
Note: 1H2016 data for QD Haier is not available. 2015 leap for QD Haier is mainly due to revenue calculation method change
0.0%
5.0%
10.0%
15.0%
20.0%
25.0%
30.0%
GPM OPM NPM
China International
0.0%
5.0%
10.0%
15.0%
20.0%
25.0%
30.0%
2012 2013 2014 2015 6M2016
Gree Midea Haier

26 October 2016
China Home Appliance Sector 24
China white goods giants eyeing global With overseas M&A, asset injection from parent companies, and increasing OBM shares,
overseas markets are increasingly becoming important for Chinese white goods giants. In
2015, overseas market accounted for 21%, 40%, and 15% of QD Haier, Midea and Gree,
respectively, and we expect it to expand to 45%/55%/25% in 2017.
At present, we see limited overseas exposure in kitchenware brands due to different
dietary habits. Meanwhile, the kitchenware companies are relatively smaller versus the
white goods giants with less capex for overseas acquisitions.
While overseas GPM is much lower than domestic market at present, we expect overseas
gross margin to trend upwards due to better pricing power, channel expansion, and brand
building. With recent overseas acquisitions e.g. Toshiba, KUKA and GE, we expect more
synergies will kick in and further boost export sales and margin in the future. We will
provide more details in our company discussions.
Figure 56: White goods export sales share picked
up since 2015 Figure 57: Leading brands export share increases
Source: IOL Source: Company data, Credit Suisse estimates
0.0%
5.0%
10.0%
15.0%
20.0%
25.0%
30.0%
35.0%
40.0%
45.0%
50.0%
2011 2012 2013 2014 2015 8M2016
AC Washing machines Fridge
0.0%
5.0%
10.0%
15.0%
20.0%
25.0%
30.0%
35.0%
40.0%
45.0%
50.0%
2010 2011 2012 2013 2014 2015 6M2016
Gree Midea QD Haier

26 October 2016
China Home Appliance Sector 25
Figure 58: Export margin improved for Midea, Gree, and QD Haier
Source: Company data
Note: 1H2016 data for QD Haier is not available. 2015 leap for QD Haier is mainly due to revenue calculation method change
From OEM to OBM
Looking forward, home appliance companies will focus on expanding their own branding
business overseas as their technology and R&D are now comparable or exceeded
international companies after many years of development. Meanwhile, companies can also
leverage on their overseas acquisitions' channel to launch their brands.
In 1H16, overseas accounted for 30% of the leading white goods companies sales, of
which around 30% were own brand sales (OBM) with the rest being ODM and OEM. Haier
was the exceptional case with all its overseas sales coming from the OBM business. Its
core markets are SE. Asia and African countries.
At present, OBM does not have a huge margin advantage over ODM and OEM as Chinese
brands have relatively low brand premium in overseas market. However, OBM is crucial for
brand establishment and beneficial for higher margin in the long run.
Figure 59: Midea has the highest overseas revenue share
(1H16) Overseas revenue % GM of export business * OEM% of export sales
Midea 43.8% 24.8% 1/3
Gree 24.2% 21.2% 1/3
QD Haier 28.7% 17.3% All own brand sales
Joyoung 1.9% 24.2% All own brand sales
Robam 1% na na
Source: Company data, Credit Suisse estimates
Overseas volume growth driven by M&A
Besides overseas OBM and ODM, almost all major domestic brands have initiated M&A to
expand their overseas business. We see good export business upside as cost synergies
will kick in through sharing R&D/sourcing and product offering expansion. By acquiring
local brands, domestic manufacturers are able to utilize local production landscape and
leverage sales network of acquired brands.
Midea acquired Toshiba's white goods section in early 2016, which will increase Midea's
turnover by 5-10% going forward. QD Haier acquired GE appliances in January 2016,
which will increase its turnover by 25-45% starting from 2H16. We expect two to three
years for these international brands to be fully integrated into parent-co and realise
maximum synergies. The below table summarises the recent overseas acquisitions.
0.0%
5.0%
10.0%
15.0%
20.0%
25.0%
30.0%
2012 2013 2014 2015 6M2016
Gree Midea Haier

26 O
cto
be
r 201
6
Ch
ina H
om
e A
pp
lian
ce
Sec
tor
26
Figure 60: Recent domestic brands M&A
Ticker Time Target Sector Consideration Financing Current Stage
600060 CH 7/31/2015 100% of Sharp Mexico TV USD 23.7M; Sharp Mexico 2014 net assets
around RMB345.32M to use "sharp" brand
and all its channel resources in America
Internal resources Completed
000333 CH 3/17/2016 80.1% of Toshiba White goods Sector
(Japan)
Appliances JPY53.7B for 40 yrs trademark authorisation
rights & over 5K patents
Internal resource & debt
financing
Completed in June, Financial statements
consolidated in 1H16
5/26/2016 KUKA (Germany) Robotics EUR115/shr, 35% premium to stock price;
EUR 3.7B if transaction complete
Internal resource & debt
financing
Pending reviews; deal will complete in March
2017 at the latest; 81.04% agreed to sell
+13.51% original stake=94.55% share in total if
complete
6/21/2016 80% of Clivet (Italy) Central AC specific consideration not disclosed; 2015
Clivet sales is EUR120M -3% of European
chillers
No disclosure Definitive agreement assigned, pending anti-
monopoly reviews; expect to complete before
2016 YE
600690 CH 1/14/2016 GE Appliances Sector (US) Appliances USD 5.58bn, 10x EV/EBITDA internal resources & USD3.3B
loan from Chinese development
bank
Conducting audit on target assets; board
meeting/US/Mexica competition premerger office
approved
7/28/2011 White goods section in Japan and
Indonesia of Sanyo (Japan)
Home Appliances JPY 10B No disclosure Completed, was injected to QD Haier in 2015
9/10/2011 80% of Fisher& Paykel (New Zealand) Home appliances 9.87 NZD; 12.56x EV/EBITDA, 1.53x P/B No disclosure Completed, plan to inject assets to QD Haier in
2020
751 HK 6/10/2014 Sinoprima (South Africa) TV/ display monitor Rmb30M for net asset negative Rmb62M net
asset
No disclosure Completed
5/7/2015 METZ (Germany) partial asset
including LCD/LED TV sections
TV no disclosure No disclosure Completed
9/25/2015 Toshiba Appliances no specific number for 5% of Toshiba Nanhai
& Toshiba Shenzhen companies
No disclosure Completed
12/21/2015 Toshiba Consumer Products
Indonesia factory
TV/Washing machines USD25M-30M, no specific disclosure No disclosure Completed on May 16, 2016, but Midea acquired
Toshiba white goods sector later so co-operation
with Toshiba may not continue
00810 CH 7/21/2015 Strong Media (Europe) TV set up boxes EUR 30M Offshore bank financing Completed
2317 TW started in 2012
and completed
in 2016
Sharp (Japan) TV JPY 88B (about USD3.5B) for 66% of Sharp No disclosure Completed in March 2016
300172 CH 7/26/2016 Vizio (US) Smart TV USD2B No disclosure Completed
1070 HK 3/31/2014 90% Stake of Sanyo Mexico Electronic products USD15.22M Internal resource Completed
Source: Company data, Credit Suisse
26 October 2016
China Home Appliance Sector 27
Kitchenware: a fast-growing segment In 2015, kitchenware market revenue was Rmb11.6bn (built-in kitchenware and kitchen
small appliances), representing 18% of the total home appliance market. We believe that
kitchenware is at fast growing stage with a 9% CAGR backed by: (1) a low penetration
rate; (2) population growth and aging problems; and (3) an increase in health awareness.
Among the domestic players, we like Robam due to its high-end position, strong pricing
power and a dominant market share in built-in large kitchen appliances. We also like
Midea for its broad product categories within small appliances.
Huge long-term growth potential
We believe that the kitchenware market is in a growth stage, similar to the white goods
market from 2009-13 when volume saw a CAGR of more than 10%.
From 2009-13, the white goods segment bred three home appliances giants: Midea, Haier
and Gree. In our view, the fast-growing kitchenware segment may breed new home
appliance leaders in the next few years. Small lifestyle appliances and other new
segments, such as household robots, also have great growth potential, but since the
segment is relatively small at this stage, giants are unlikely to emerge.
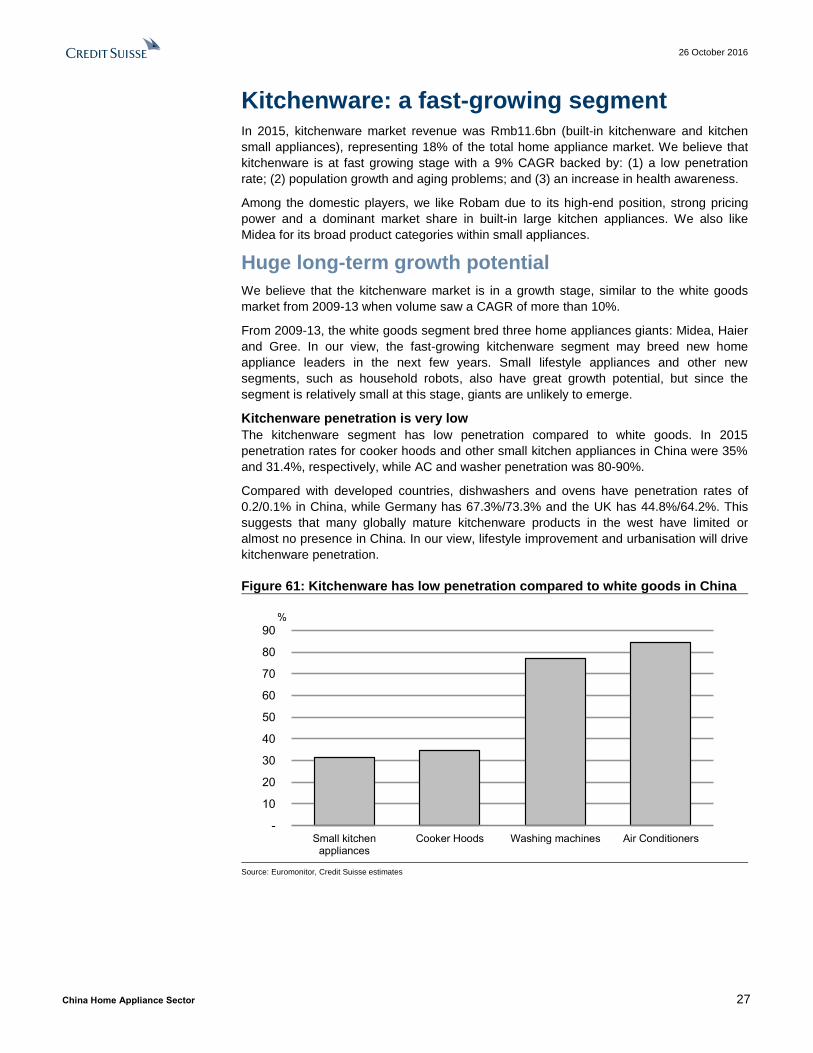
Kitchenware penetration is very low
The kitchenware segment has low penetration compared to white goods. In 2015
penetration rates for cooker hoods and other small kitchen appliances in China were 35%
and 31.4%, respectively, while AC and washer penetration was 80-90%.
Compared with developed countries, dishwashers and ovens have penetration rates of
0.2/0.1% in China, while Germany has 67.3%/73.3% and the UK has 44.8%/64.2%. This
suggests that many globally mature kitchenware products in the west have limited or
almost no presence in China. In our view, lifestyle improvement and urbanisation will drive
kitchenware penetration.
Figure 61: Kitchenware has low penetration compared to white goods in China
Source: Euromonitor, Credit Suisse estimates
-
10
20
30
40
50
60
70
80
90
Small kitchenappliances
Cooker Hoods Washing machines Air Conditioners
%

26 October 2016
China Home Appliance Sector 28
Figure 62: China kitchenware penetration lags developed countries
2015 penetration rate
(%)
China US France Japan Germany UK
Dishwashers 0.2 63.1 44.9 18.7 67.3 44.8
Ovens 0.1 10.3 38.1 3.5 73.3 64.2
Microwaves 22.8 84.9 86.2 84.5 71.8 91.5
Food processor 24.9 170 124.3 29.5 103 98.3
Coffee Machines 0.1 154.6 103.6 7.6 95.6 50
Source: Euromonitor
Aging population and two child policy drive kitchenware demand
In our view, the two-child policy and aging problems will contribute to kitchenware sector
growth. Babies and elderly require additional care due to food safety issues in China. We
expect new-born babies and the aging population to require more in-home cooking thus
benefiting kitchenware sales.
According to our in-house estimates, the two-child policy will bring an additional 3-5 mn
babies from 2017 onwards, assuming an annual application rate of 5-10% for the currently
eligible 60 mn couples. This means a population boost of 17-33% from the current 16.5
mn new-born babies per year from 2017 onwards.
China's population is aging. In 2015, people aged over 65 years old amounted to 144 mn,
10.5% of the total population. We expect this number to see a CAGR of 5.1% over the
next five years and reach 180 mn in 2020, representing 13% of the total population.
Figure 63: We expect 3-5 mn new babies starting
from 2017E
Figure 64: We expect the elderly population to see a
5.1% CAGR from 2016-20
Source: NBS, Credit Suisse estimates Source: NBS, Credit Suisse estimates
Rising health cautiousness
According to a Boston Consulting Group survey, Chinese consumers have very strong
health awareness, with 73% willing to pay a premium for healthier products, which is 12%
more than the global average.
With increasing food safety issues, in the 2016 BCG survey food safety is the top choice
among all other factors that interviewees were unsatisfied with. Therefore, we see robust
growth of health-related appliances, such as blenders, that can break food cells and slow-
speed juicers that can better maintain fruit nutrition. We see continuous growth in the
kitchenware segment, especially small appliances.
14
15
16
17
18
19
20
21
22
23
2010 2011 2012 2013 2014 2015 2016E 2017E
Born under one-child policy additional babies
mnn
0.0%
2.0%
4.0%
6.0%
8.0%
10.0%
12.0%
14.0%
-
20
40
60
80
100
120
140
160
180
200
2010 2011 2012 2013 2014 2015 2016E 2017E 2018E 2019E 2020E
People above 65 years old Growth % of total population
13%mn
26 October 2016
China Home Appliance Sector 29
Figure 65: Chinese consumers have high health awareness
Source: BCG
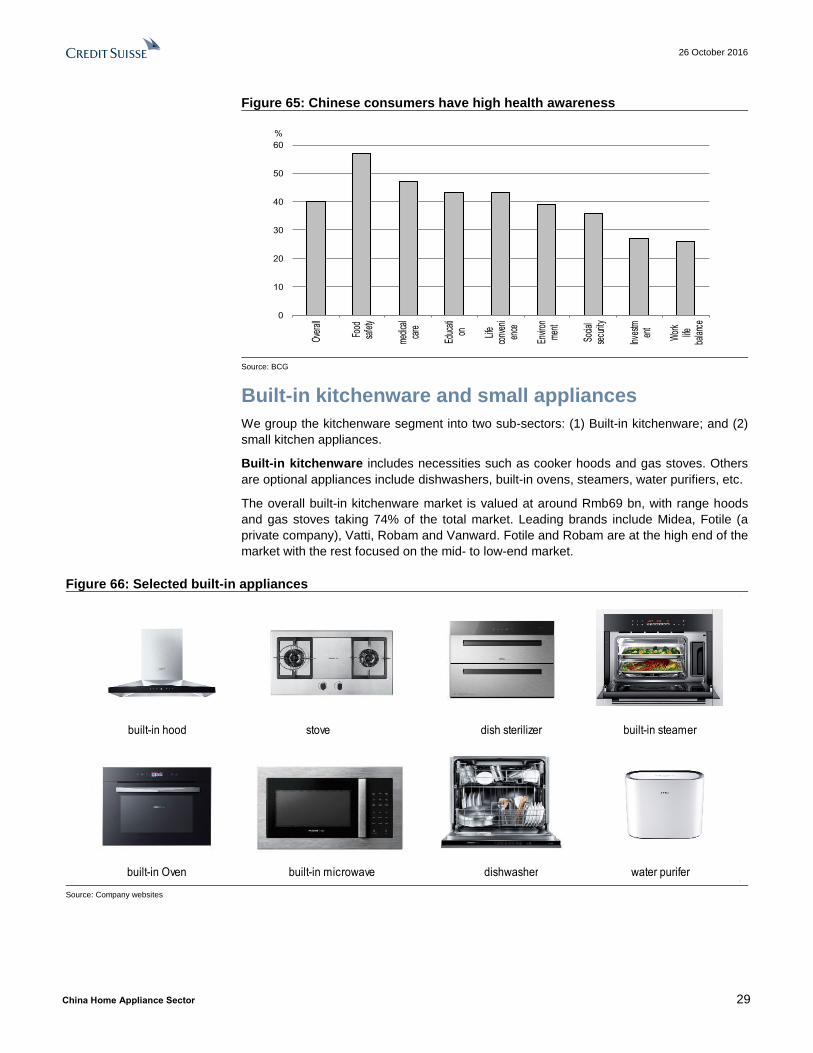
Built-in kitchenware and small appliances
We group the kitchenware segment into two sub-sectors: (1) Built-in kitchenware; and (2)
small kitchen appliances.
Built-in kitchenware includes necessities such as cooker hoods and gas stoves. Others
are optional appliances include dishwashers, built-in ovens, steamers, water purifiers, etc.
The overall built-in kitchenware market is valued at around Rmb69 bn, with range hoods
and gas stoves taking 74% of the total market. Leading brands include Midea, Fotile (a
private company), Vatti, Robam and Vanward. Fotile and Robam are at the high end of the
market with the rest focused on the mid- to low-end market.
Figure 66: Selected built-in appliances
Source: Company websites
0
10
20
30
40
50
60
Ove
rall
Food
safe
ty
med
ical
care
Educ
ati
on Life
conv
eni
ence
Envir
onm
ent
Socia
lse
curit
y
Inve
stmen
t
Wor
klife
bala
nce
%
built-in hood stove dish sterilizer built-in steamer
built-in Oven built-in microwave dishwasher water purifer

26 October 2016
China Home Appliance Sector 30
Figure 67: Built-in kitchenware market
breakdown(value)
Figure 68: Built-in kitchenware market breakdown
(shipments)
Source: CMM Source: Euromonitior
Figure 69: Range hood market brand share(8M16
value)
Figure 70: Gas stove market brand share
(8M16value)
Source: CMM Source: CMM
Small kitchen appliances feature much more selection. The market size is around
Rmb47 bn. Popular appliances include necessities, such as rice cookers and water
heaters, which constitute around 45% of total small appliances. The rest are noodle
machines, soybean makers, juicers, bread makers, etc. Leading brands include Midea,
Supor, Joyoung and Donlim.
By volume, Euromonitor expects small kitchen appliance will to experience a 5% CAGR
from 2016-18E. Given average selling price (ASP) increases, we expect the market size to
see a 9% CAGR.
dishwasher1%
microwave10%
gas stove28%
range hood46%
sterilizer9%
oven6%
2,000 1,900
1,026
787
400
20
-
500
1,000
1,500
2,000
2,500
range hood gas stove microwave oven sterilizer dishwasher
10k units
Robam31%
Fotile28%
Midea12%
Vatti11%
Vanward4%
Macro4%
Siemens6%
Sacon4%
Robam23%
Fotile22%
Midea7%
Vatti12%
Vanward4%
Macro3%
Siemens5%
Others24%

26 October 2016
China Home Appliance Sector 31
Figure 71: Selected kitchen small appliances
Source: Company websites
Figure 72: Small kitchen appliance breakdown by
value Figure 73: Small appliance brand share
Source: CMM, Credit Suisse Source: CMM, Credit Suisse
Figure 74: selected kitchen small appliances brand share
Rice cooker Electric
kettle
Pressure
cooker
Induction
cooker
Soymilk
machine
Electric pot Juicer Blender Baking pan
Midea 41% 30% 42% 46% 21% 26% 24% 31% 40%
Joyoung 27% 21% 28% 19% 14% 11% 16% 7% 21%
Supor 14% 20% 19% 21% 62% 11% 44% 49% 16%
Others 18% 29% 11% 14% 3% 52% 16% 13% 23%
Source: Company data, CMM
deep fryer coffee machine soybean machine water heater
rice cooker induction cooker pressure cooker electric pot
Rice cooker32%
Induction cooker16%
Pressure cooker13%
soymilk maker12%
juicer9%
electric kettle8%
Blender5%
coffee machine3%
Others2%
OUTPERFORM
Midea41%
Joyoung27%
Supor14%
Others18%

26 October 2016
China Home Appliance Sector 32
Consumers are trading up
We expect ASPs to see a 5% CAGR from 2016-18E as consumers trade up to high-end
functional products We see more room for ASP increases in kitchenware than the
traditional white goods segment due to more new model launches and more obvious
market consolidation. In short, kitchenware is still in a growing phase.
Kitchenware ASPs have surged 20-30% in the past four years. In the built-in-kitchenware
segment, consumers are more inclined to buy high-end products with high air flow rates,
low noise and modern appearance. In the small appliance segment, we see major
upgrade progress in rice cookers from non-induction heating (IH) to IH due to rising
requirements by Chinese for food quality.
The high-end market is expected to benefit most from this trend. Premium brands Fotile
and Robam expanded their market share from 25% in 2008 to more than 40% in 2015. We
continue to see market share gains from high-end brands and prefer Robam.
Figure 75: Kitchenware ASPs have been rising
steadily from 2012
Figure 76: High-end brand market share has
increased
Source: CMM, Credit Suisse estimates Source: CMM
Range hoods: European style and high air flow rates
We see rising interest in European-style hoods with large air flows. European-style hoods
are stylish with a modern appearance. The market share increased to 48% in 2016 from
42% in 2012. Moreover, European-style range hoods have a 16% price premium.
Due to different cooking habits, Chinese families have a greater demand for higher air flow
rates, or suction power, than Western families. Usually a 15-17m3/min air flow rate is
enough for a normal Chinese family. As consumers have higher living standards, we see
the market shares of range hoods with above 17m3/min suction power rising to 40% in
2016 from 15% in 2012. Given their stronger functionality, they are priced at a 25%
premium over the market average.
-
500
1,000
1,500
2,000
2,500
3,000
2012 2013 2014 2015 6M2016
Gas stove Range hood Sterilizer
Rmb
28%
48%
25%
43%
0%
10%
20%
30%
40%
50%
60%
2008 2015
Range hood total share Gas stove total share

26 October 2016
China Home Appliance Sector 33
Figure 77: European-style range hoods are the most popular
Source: Company website
Figure 78: Rising interest in European-style range
hoods
Figure 79: Large suction powered range hoods rise
rapidly
Source: CMM Source: CMM
Figure 80: High-end products have ~20% premium over the industry average
Suction power Price Price premium Style Price Price premium
Industry average 2,853 0% Industry average 2,853 0%
<13 m3/min 1,134 -60% Flat 1,261 -56%
13-14.9 m3/min 1,610 -44% Deep cover 954 -67%
15-16.9 m3/min 2,984 5% Inclined 2,804 -2%
>17 m3/min 3,529 24% European 3,322 16%
Source: CMM
Rice cooker—upgrade to IH
Rice cooker is the largest category in the small appliance sector with a Rmb15 bn market
size and 32% of market sales. Consumers are upgrading to IH rice cookers, which have
witnessed 6.7% and 14.7% growth in volume and value, respectively, in 2015. We expect
market size will continue to see a 13-15% value CAGR from 2016E-18E. Value growth is
expected to be significantly faster than volume growth, as the price of an IH rice cooker is
more than double a normal rice cooker.
IH uses induction to heat rice and thus improve rice texture. The IH rice cooker market in
China only started in 2013 but has already taken a 13% market share.
European style Inclined style Deep covered style Flat style
42% 45% 46% 48%
0%
10%
20%
30%
40%
50%
60%
70%
80%
90%
100%
2013 2014 2015 6M2016
European style Inclined style Chinese style Flat style
15% 19%25%
34%40%
0%
10%
20%
30%
40%
50%
60%
70%
80%
90%
100%
2012 2013 2014 2015 6M2016
>17 m3/min 15-16.9 m3/min 13-14.9 m3/min <13 m3/min
26 October 2016
China Home Appliance Sector 34
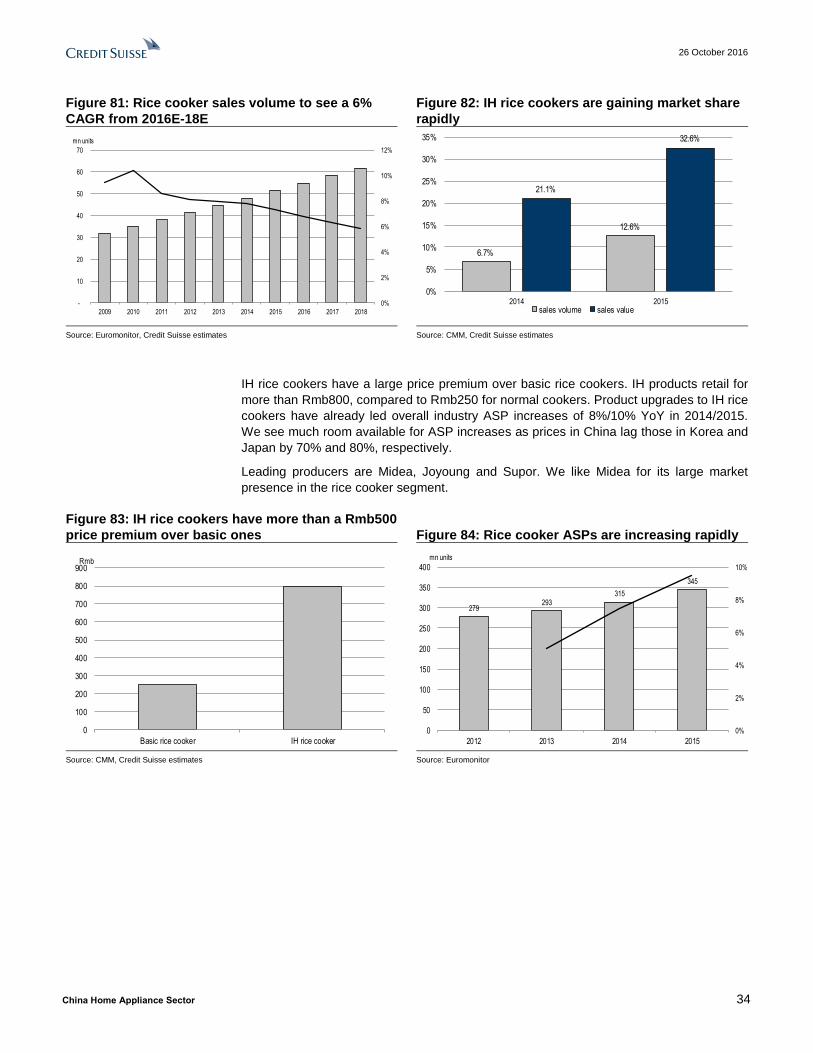
Figure 81: Rice cooker sales volume to see a 6%
CAGR from 2016E-18E
Figure 82: IH rice cookers are gaining market share
rapidly
Source: Euromonitor, Credit Suisse estimates Source: CMM, Credit Suisse estimates
IH rice cookers have a large price premium over basic rice cookers. IH products retail for
more than Rmb800, compared to Rmb250 for normal cookers. Product upgrades to IH rice
cookers have already led overall industry ASP increases of 8%/10% YoY in 2014/2015.
We see much room available for ASP increases as prices in China lag those in Korea and
Japan by 70% and 80%, respectively.
Leading producers are Midea, Joyoung and Supor. We like Midea for its large market
presence in the rice cooker segment.
Figure 83: IH rice cookers have more than a Rmb500
price premium over basic ones Figure 84: Rice cooker ASPs are increasing rapidly
Source: CMM, Credit Suisse estimates Source: Euromonitor
0%
2%
4%
6%
8%
10%
12%
-
10
20
30
40
50
60
70
2009 2010 2011 2012 2013 2014 2015 2016 2017 2018
mn units
6.7%
12.6%
21.1%
32.6%
0%
5%
10%
15%
20%
25%
30%
35%
2014 2015sales volume sales value
0
100
200
300
400
500
600
700
800
900
Basic rice cooker IH rice cooker
Rmb
279293
315
345
0%
2%
4%
6%
8%
10%
0
50
100
150
200
250
300
350
400
2012 2013 2014 2015
mn units

26 October 2016
China Home Appliance Sector 35
Figure 85: ASPs still have large room to grow
Figure 86: Midea has the largest rice cooker market
share
Source: Euromonitor Source: CMM
Market consolidation to continue
We have seen market consolidation in kitchenware in the past two years. The top-three
brands (in terms of volume) in both imbedded built-in kitchenware and small appliances
saw 3-6% market share gains from 2014-15.
We see faster consolidation in the imbedded built-in kitchenware segment due to relatively
low concentration. The market is scattered with more than 300 players. The top-three
brands only have a 40-45% market share, lagging the white good market's 55-65%.
In this consumption upgrade era, we expect leading brands with strong R&D capability and
premier product quality to stand out and continue to expand market share. Many
uncompetitive brands will be filtered out, in our r view.
Figure 87: We have seen market consolidation in
the past two years
Figure 88: We see further consolidation from the
built-in kitchenware segment
Source: CMM Source: CMM
34
57
119
170
0
20
40
60
80
100
120
140
160
180
China Hong Kong Korea Japan
USD/unit
Midea
41%
Joyoung
27%
Supor
14%
Others
18%
40%36%
48%
76%
65%
43%39%
46%
82%
71%
0%
10%
20%
30%
40%
50%
60%
70%
80%
90%
Range hood Gas stove Sterilizer Rice cooker Electric kettle
2014 2015
64%
53%50%
45% 44%40%
0%
10%
20%
30%
40%
50%
60%
70%
AC Washing machine Fridge Sterilizer Range hood Gas stove

26 October 2016
China Home Appliance Sector 36
Top picks: Midea, Robam and Gree Consumers are trading up in the home appliance sector, which has accelerated industry
consolidation. We believe that the segment leaders, which have reputable brand names,
solid channel execution and strong R&D capability, will stand out from peers. With this
sector report, we assume coverage on four white goods companies—Midea
(OUTPERFORM), Gree (OUTPERFORM), QD Haier (OUTPERFORM), Haier Electronic
(NEUTRAL) and initiate on two kitchenware companies—Robam (OUTPERFORM) and
Joyoung (Neutral).
Our top Buys are Midea, Robam and Gree. We like: (1) Gree for its attractive valuation
of 8.6x P/E (5x ex. cash P/E), 8% dividend yield and accelerating CAGR growth of 11.3%
for 2016-18 vs. a 7.4% CAGR for 2014-16; (2) Midea for its strongest earnings outlook
with a 14.8% CAGR (0.8x PEG) and well-diversified product categories; and (3) Robam for
its fastest growing outlook—a 28% EPS CAGR in 2016-18 backed by its market share
gains in the fast-growing kitchenware segment.
We rate Joyoung and Haier Electronic NEUTRAL, as we expect their earnings outlooks to
be largely in line with the industry and their valuations and dividend yields are not
attractive which cap their share price upside.
Figure 89: Revenue breakdown of our coverage companies
Company Ticker Revenue breakdown Export %
AC
Washer
Refrigerator
Water heater
Kitchenware and
small appliance
Midea 000333.SZ 43.8% 9.5% 8.6% 0.3% 26.1% 43.8%
Gree 000651.SZ 83.8% 0.0% 1.0% 0.0% 1.5% 24.0%
QD Haier 600690.SS 19.5% 16.5% 29.3% 5.0% 2.3% 29.0%
Haier Electronics 1169.HK 0.0% 18.0% 0.0% 7.0% 0.0% 4.0%
Robam 002508.SZ 0.0% 0.0% 0.0% 0.0% 98.0% 2.0%
Joyoung 002242.SZ 0.0% 0.0% 0.0% 0.0% 97.0% 2.0%
Source: Company data, Credit Suisse estimates
Figure 90: Valuation comp of our coverage companies
Company Name CS Ticker Rating Last Price TP Upside Mkt Cap Trd vol CAGR PE PE PEG PB ROE DY
/Downside US$mn US$ mn 16-18E 2016E 2017E 2017E 2017E 2017E 2017E
Qingdao Haier 600690.SS O 10.3 12.3 19.6% 9,249 40 15.0% 12.4 10.8 0.9 2.0 19% 2%
Midea Group Co 000333.SZ O 26.8 34.5 28.7% 25,407 128 14.8% 11.7 10.1 0.8 2.4 24% 4%
Gree Electric 000651.SZ O 23.0 28.0 21.6% 20,442 138 11.3% 9.5 8.7 0.8 2.4 27% 8%
Haier Electronic 1169.HK N 12.5 13.4 7.0% 4,487 6 10.3% 15.1 13.7 1.5 2.0 15% 1%
Robam 002508.SZ O 38.6 50.3 30.3% 4,157 25 28.2% 23.9 18.4 0.8 5.5 30% 2%
Joyoung Co 002242.SZ N 19.9 21.5 8.0% 2,255 15 11.5% 22.1 19.7 1.9 4.0 20% 4%
Source: Company data, Credit Suisse estimates
Investment recommendations
■ Midea Group (00033.SZ, OUTPERFORM, TP: Rmb34.50). We initiate on Midea with
an OUTPERFORM rating and target price of Rmb34.50. Excluding acquisitions; we
believe Midea will be the fastest-growing large appliance company driven by a strong
sales outlook for the washing machine, refrigerator and small appliance segments. We
see margin upside from rising automation and efficiency enhancement. Toshiba's
acquisition helps Midea to quickly enter the Japan market and enhance its technology.
We expect this business to contribute earnings in 2017. We forecast 15% earnings
growth for 2016-18E. The valuation appears attractive at 10.2x 2017E P/E (6.8x ex.

26 October 2016
China Home Appliance Sector 37
cash P/E), a slight discount to the China white goods sector despite its above-industry
earnings growth and ROE. Its 3% dividend yield also appears attractive.
■ Gree (000651.SZ, OUTPERFORM, TP: Rmb28). We initiate on Gree with an
OUTPERFORM rating and TP of Rmb28. We like Gree for its cheap valuation and
dividend yield. Gree is trading at 8.6x 2017E P/E, a 20% discount to the white goods
sector. With net cash equivalent to 40% of market cap, the stock is trading at 5x ex.
cash P/E. Gree's 8% dividend yield is the highest in the whole consumer appliance
industry. We believe that the AC sales recovery starting in 2H16 will drive share price
and P/E multiple expansion. We have a mixed view on the Yinlong acquisition. This
acquisition helps Gree enter the fast-growing and high-upside new energy vehicle
market, but this transaction is expected to be EPS dilutive at least for the next five
years and result in significant 24% share dilution.
■ QD Haier (600690.SS, OUTPERFORM, TP: Rmb12.30). We initiate on QD Haier with
an OUTPERFORM rating and TP of Rmb12.30. We like the company for its influential
global branding, solid earnings CAGR outlook of 15% for 2016-18 and undemanding
valuation. The inclusion of GEA has significantly lifted its presence in North America.
■ Haier electronic (1169 HK, Neutral, TP: HK$13.40). We initiate on Haier Electronic
with a NEUTRAL rating (OUTPERFORM previously) and a TP of HK$13.40 based on
industry average 11x P/E. While we expect ICS revenue will return growth in 2H16 on
better retail sales, 2017 earnings are expected to see moderate growth of ~10%, which
is slower than other white goods companies. At 11x 2017E P/E (1x PEG), and 2% yield,
valuations do not appear attractive, in our view.
■ Robam (002508.SZ, OUTPERFORM, TP: Rmb48.30). We initiate coverage on Robam
with an OUTPERFORM rating. Robam is our top pick in the kitchenware sector, given
its strong earnings growth outlook and undemanding valuation. It also trades at the
industry’s average valuation yet has the highest market shares, industry-best margins,
ROE and earnings outlook. We forecast a 28% earnings CAGR over 2016-18E driven
by a 22% sales CAGR which is much faster than the industry’s estimated average 9%
CAGR.
■ Joyoung (002242.SZ, Neutral, TP Rmb21.50). We initiate coverage on Joyoung with
a NEUTRAL rating. In our view, the company is in the middle of a category transition
phase which will likely to cap its earnings growth and reduce visibility in the next two
years. We expect 11% earnings growth for 2016-18, slower than industry peers’. Its
valuation is not cheap, at 1.8x 2017E PEG, but its 3% dividend yield, one of the
industry’s best margins and ROE should provide good share price support, in our view.
Sector valuation
China’s consumer electronic sector now trades at 14x forward P/E (market cap weighted),
which is largely in line with its five-year average. The industry comprises different sub
sectors, including white goods, TV, kitchenware as well as small electronic appliances.
The sector de-rated sharply from its 26x at the market peak in May-June 2015. This sharp
derating was attributed to the weak A and H stock markets as well as weak white good
company performances in 2015/1H16 due to the negative impact from AC destocking.
By sub-sector, the white goods and kitchenware sectors are trading at 11x P/E and 19x
P/E, respectively. Investors have awarded the kitchenware sector a higher multiple given
its stronger long-term prospects.
As discussed in our industry session, the kitchenware sector is in a growing phase while
the white goods sector has reached a mature phase. We expect the kitchenware industry
to see a 9% revenue CAGR from 2016-18E which is faster than the white goods sector’s

26 October 2016
China Home Appliance Sector 38
3-5% for the same period. Based on consensus as well as our forecasts,
kitchenware/white goods companies are estimated to deliver 23%/14% earnings CAGRs
for 2016-18 implying a 0.9x/0.8x PEG for the respective segments.
Figure 91: China’s consumer electronic sector now trades at 14x forward P/E
Source: Bloomberg, Credit Suisse estimates
Figure 92: Kitchenware sector trades at 19x P/E Figure 93: White goods sector trades at 11 P/E
Source: Bloomberg, Credit Suisse estimates Source: Bloomberg, Credit Suisse estimates
Target price and valuation
Our valuation basis is forward P/E multiple and our valuation base year is 2017E. In
general, we set our target P/E multiple with reference to industry average and cross check
with PEG (e.g. 1x PEG). We assign a higher multiple (e.g., one standard deviation above
industry average) to companies that have stronger earnings outlook and ROE. For
companies that are expected to deliver market average earnings growth, margin and ROE
are assigned to industry P/E.
We valued white goods companies and kitchenware companies with reference to their
respective sector P/E multiples instead of the overall consumer appliance sector multiple.
This is because the kitchenware sector deserves a higher multiple, as this sector is in a
growth phase, while the white goods sector is already at a mature stage with lower
multiples.
0.0
5.0
10.0
15.0
20.0
25.0
30.0
Jan10
Apr10
Jul10
Oct10
Jan11
Apr11
Jul11
Oct11
Jan12
Apr12
Jul12
Oct12
Jan13
Apr13
Jul13
Oct13
Jan14
Apr14
Jul14
Oct14
Jan15
Apr15
Jul15
Oct15
Jan16
Apr16
Jul16
Mean: 14
Std: 3.2
0.0
5.0
10.0
15.0
20.0
25.0
30.0
35.0
Jan
10
Ap
r10
Jul1
0
Oct1
0
Jan
11
Ap
r11
Jul1
1
Oct1
1
Jan
12
Ap
r12
Jul1
2
Oct1
2
Jan
13
Ap
r13
Jul1
3
Oct1
3
Jan
14
Ap
r14
Jul1
4
Oct1
4
Jan
15
Ap
r15
Jul1
5
Oct1
5
Jan
16
Ap
r16
Jul1
6
Mean: 19.3Std: 4.3
Mean -1 std
Mean
Mean +1 std
Mean -2 std
Mean +2 std
0.0
2.5
5.0
7.5
10.0
12.5
15.0
17.5
20.0
Jan10
Apr10
Jul10
Oct10
Jan11
Apr11
Jul11
Oct11
Jan12
Apr12
Jul12
Oct12
Jan13
Apr13
Jul13
Oct13
Jan14
Apr14
Jul14
Oct14
Jan15
Apr15
Jul15
Oct15
Jan16
Apr16
Jul16
Mean: 11
Std: 2.3
Mean
Mean +2 std
Mean -2 std
Mean +1 std
Mean -1 std
26 October 2016
China Home Appliance Sector 39
Midea (OUTPERFORM, TP: Rmb34.50)
Our target price of RMB34.50 is based on a target 13x 2017E P/E, which is one standard
deviation above the white goods sector. The valuation premium is warranted by its
stronger earnings outlook and above-industry ROE and NPM. At our target price, the stock
would be also trading at 0.8x PEG, which suggests our valuation is not demanding given
the company's earnings growth potential.
Gree (OUTPERFORM, TP: Rmb28)
Our target price of Rmb28 is based on 10.5x 2017E P/E, which is in line with the white
goods sector average. At our target price, Gree would be trading at 1x PEG or only 5x ex.
cash 2017E P/E which suggests our valuation is not demanding.
QD Haier (OUTPERFORM, TP: Rmb12.30)
Our target price of Rmb12.30 is based on a target 13x 2017E P/E, which is based on one
standard deviation above industry average. We believe the valuation is warranted by its
stronger earnings outlook and above-industry ROE and NPM. At our target price, the stock
would be also trading at 0.8x PEG, which appears fair, in our view.
Haier Electronic (Neutral, TP: HK$13.40)
Our TP of HK$13.40 is based on 11x P/E, which is referenced to the white goods sector
average. The earnings CAGR is slower than industry, but its par-to-industry multiple is
justified by its unique integrated channel services (40% of 2017E operating profit), which
has higher long-term prospects than the traditional white goods sector.
Robam (OUTPERFORM, TP: Rmb50.30)
Our TP of Rmb50.30 is based on 24x 2017E P/E, which is one standard deviation over the
kitchenware segment which we believe is justified by its market leadership and best
operating matrices. At our TP, the stock would be trading at 0.9x PEG based on our 28%
2016-18 earnings CAGR, which further justifies our valuation premium with its strong
earnings outlook.
Joyoung (NEUTRAL, TP: Rmb21.50)
Our TP of Rmb21.50 is based on 21.5x 2017E P/E, which is in line with kitchenware
industry players. While Joyoung's earnings outlook is slower than other kitchenware
companies, its higher margin, ROE and dividend yield can justify the stock trading at par to
the industry.

26 October 2016
China Home Appliance Sector 40
China Home Appliance Sector through HOLT Lens™ The HOLT methodology uses a proprietary performance measure known as Cash Flow
Return on Investment (CFROI®). This is an approximation of the economic return, or an
estimate of the average real internal rate of return, earned by a firm on the portfolio of
projects that constitute its operating assets. A firm's CFROI can be directly compared
against its real cost of capital (the investors' real discount rate) to see if the firm is creating
economic wealth. By removing accounting and inflation distortions, CFROI allows for
global comparability across sectors, regions and time. It is also a more comprehensive
metric than the traditional ROIC and ROE.
Home Appliance Sector vs China Market Aggregate
HOLT aggregates the economic returns of the Home Appliance sector (using the six
companies covered by Credit Suisse equity research) to show a 15-year perspective of
value creation relative to the broader China market aggregate (ex. Financials).
The CFROI for the Home Appliance sector has improved significantly since 2003, more
than quadrupling from 4% to reach 17% in recent years. This return profile is particularly
impressive considering that the broader China market CFROI has fallen from 7% to 4%
over the same period. The sector has also grown at a much faster pace compared to the
broader market in recent years, as shown in the Asset Growth chart in Figure 93.
The sector also stands out with its conservative market expectations (depicted by the
green dots). While consensus EPS indicates that the sector could continue to earn a high-
teen CFROI in 2016 and 2017, investors are pricing for it to decline to just 10% by 2020. In
contrast, the broader China market is already pricing in a substantial level of CFROI
improvements over the next five years.

26 October 2016
China Home Appliance Sector 41
Figure 94: The Home Appliance sector has superior economic returns (CFROI) and higher asset growth
rates
Source: Credit Suisse HOLT Lens TM
Return Drivers
The sector’s CFROI® is mostly driven by higher asset efficiency compared to the broader
market. In recent years, while asset turns have moderated, CFROI has been resilient due
to the strong improvement in operating margins.

26 October 2016
China Home Appliance Sector 42
Figure 95: Home Appliance sector CFROI driven by higher asset turns and more recently improving
margins
Source: Credit Suisse HOLT Lens TM
Peer benchmarking
In Figure 95, HOLT shows the historical and forecast CFROI for each company as well as
the market-implied expectation based on the current share price. While implied CFROIs
are low for all six companies, Gree and Hangzhou Robam stand out in the analysis with
their strong CFROI improvement trend over the past ten years. Credit Suisse equity
research has OUTPERFORM ratings on both stocks.
Midea and Qingdao Haier are the other stocks rated OUTPERFORM in the sector. Both
companies also exhibit an attractive combination of high/improving CFROI, low implied
expectations and stronger price and CFROI revisions in the HOLT model.
Figure 96: Historical, forecast and market implied CFROI by company
Source: Credit Suisse HOLT Lens TM

26 October 2016
China Home Appliance Sector 43
Asia Pacific/China Household Durables
Midea Group Co Ltd (000333.SZ / 000333 CH) Rating OUTPERFORM Price (24 Oct 16, Rmb) 26.66 Target price (Rmb) 34.50 Upside/downside (%) 29.4 Mkt cap (Rmb/US$ mn) 171,289 / 25,289 Enterprise value (Rmb mn) 158,913 Number of shares (mn) 6,425 Free float (%) 55.4 52-wk price range (Rmb) 28.65-17.23 ADTO-6M (US$ mn) 154.5 *Stock ratings are relative to the relevant country benchmark.
¹Target price is for 12 months.
Research Analysts
Raymond Ching
852 2101 7852
Carey Shi
852 2101 7729
Likely the fastest growing white goods giant
■ We initiate coverage with an OUTPERFORM rating and an Rmb34.50
target price. We believe Midea will be the fastest-growing large appliance
company, driven by the strong outlook in washing machine, refrigerator and
small appliance segments. We see margin upside from rising automation and
efficiency enhancement. We forecast 14.8% earnings growth in 2016-18.
Midea has the strongest management incentive among peers.
■ Multiple growth drivers in white goods categories. We expect AC sales to
rebound in 2H16 as destocking has largely completed. For refrigerator and
washing machine, we expect double-digit growth to continue, driven by its
market share gain thanks to its value for money positioning. Small appliance
sales will also accelerate driven by consumption upgrade and new product.
■ Positive on Toshiba and KUKA acquisitions. Toshiba acquisition should
help Midea to quickly enter the Japanese market and enhance its technology
through R&D sharing. We expect Toshiba to break even and start
contributing profit in 2018. KUKA transaction will be a stepping stone to
expand into the fast-growing robotics market and also enhance the group's
automation, which lead to long-term GPM improvement. If the KUKA deal is
approved, we expect it to contribute additional 4%/5% earnings in 2017/18.
■ Valuation appears attractive. Midea now trades at 10.2x P/E, a 10%
discount to the white goods industry. Excluding net cash, it is trading at 7.7x
2017E ex-cash P/E. With the best earnings outlook and ROE, we believe
Midea deserves to trade at industry premium. Our target price of Rmb34.50 is
based on 13x 2017E P/E, which is one standard deviation above industry
average. Risks to our valuation include (1) volatile raw material price, (2)
acquisition not going through, and (3) worse-than-expected industry growth.
Share price performance
The price relative chart measures performance against the
Shanghai Shenzhen CSI300 index which closed at
3,327.80 on 24/10/16. On 24/10/16 the spot exchange rate
was Rmb6.77/US$1
Performance 1M 3M 12M Absolute (%) 1.5 -3.2 45.0 Relative (%) -0.1 -5.0 51.8
Financial and valuation metrics
Year 12/15A 12/16E 12/17E 12/18E Revenue (Rmb mn) 138,435.8 153,127.6 173,114.3 187,025.9 EBITDA (Rmb mn) 15,819.7 17,973.4 21,741.9 24,950.4 EBIT (Rmb mn) 12,967.7 14,604.6 17,933.4 20,835.8 Net profit (Rmb mn) 12,706.7 14,691.1 17,103.7 19,360.7 EPS (CS adj.) (Rmb) 2.99 2.29 2.66 3.01 Change from previous EPS (%) n.a. - - - Consensus EPS (Rmb) n.a. 2.25 2.57 2.92 EPS growth (%) 19.9 (23.4) 16.4 13.2 P/E (x) 8.9 11.7 10.0 8.8 Dividend yield (%) 4.5 3.5 4.0 4.6 EV/EBITDA (x) 10.3 8.8 6.5 5.0 P/B (x) 2.31 2.82 2.38 2.03 ROE (%) 28.7 26.7 25.8 24.8 Net debt/equity (%) Net Cash Net Cash Net Cash Net Cash
Source: Company data, Thomson Reuters, Credit Suisse estimates

26 October 2016
China Home Appliance Sector 44
Midea Group Co Ltd (000333.SZ / 000333 CH)
Price (24 Oct 2016): Rmb26.66; Rating: OUTPERFORM; Target Price: Rmb34.50; Analyst: Raymond Ching
Income Statement (Rmb mn) 12/15A 12/16E 12/17E 12/18E
Sales revenue 138,436 153,128 173,114 187,026 Cost of goods sold 103,227 107,897 116,576 125,792 EBITDA 15,820 17,973 21,742 24,950 EBIT 12,968 14,605 17,933 20,836 Net interest expense/(inc.) (325) (725) (857) (1,258) Recurring PBT 16,051 18,612 21,642 24,493 Profit after tax 13,625 15,820 18,396 20,819 Reported net profit 12,707 14,691 17,104 19,361 Net profit (Credit Suisse) 12,707 14,691 17,104 19,361
Balance Sheet (Rmb mn) 12/15A 12/16E 12/17E 12/18E
Cash & cash equivalents 11,862 34,704 51,726 72,717 Current receivables 23,261 25,404 27,716 29,673 Inventories 10,449 11,909 10,974 10,972 Other current assets 47,796 55,538 55,898 56,148 Current assets 93,368 127,555 146,314 169,510 Property, plant & equip. 19,685 19,960 20,272 20,609 Investments 6,329 6,771 7,235 7,722 Intangibles 5,785 5,969 6,177 6,401 Other non-current assets 3,675 8,396 8,163 7,953 Total assets 128,842 168,652 188,160 212,195 Current liabilities 72,004 92,548 99,581 109,690 Total liabilities 72,810 99,944 106,977 117,086 Shareholders' equity 49,202 60,749 71,932 84,400 Minority interests 6,830 7,959 9,251 10,709 Total liabilities & equity 128,842 168,652 188,160 212,195
Cash Flow (Rmb mn) 12/15A 12/16E 12/17E 12/18E
EBIT 12,968 14,605 17,933 20,836 Net interest 0 0 0 0 Tax paid (2,529) (2,827) (2,928) (3,375) Working capital 12,251 (116) 1,199 679 Other cash & non-cash items 3,559 (762) 8,187 7,384 Operating cash flow 26,248 10,900 24,390 25,524 Capex (3,131) (3,369) (3,809) (4,115) Free cash flow to the firm 23,117 7,531 20,582 21,410 Investing cash flow (17,989) (2,135) (2,067) (2,343) Equity raised 0 0 0 0 Dividends paid (4,908) (5,120) (5,921) (6,893) Financing cash flow (8,877) 14,077 (5,302) (2,190) Total cash flow (618) 22,842 17,022 20,991 Adjustments 17 0 0 0 Net change in cash (601) 22,842 17,022 20,991
Per share 12/15A 12/16E 12/17E 12/18E
Shares (wtd avg.) (mn) 4,255 6,425 6,425 6,425 EPS (Credit Suisse) (Rmb) 2.99 2.29 2.66 3.01 DPS (Rmb) 1.20 0.92 1.07 1.21 Operating CFPS (Rmb) 6.17 1.70 3.80 3.97
Earnings 12/15A 12/16E 12/17E 12/18E
Growth (%) Sales revenue (2.2) 10.6 13.1 8.0 EBIT (1.7) 12.6 22.8 16.2 EPS 19.9 (23.4) 16.4 13.2 Margins (%) EBITDA 11.4 11.7 12.6 13.3 EBIT 9.4 9.5 10.4 11.1
Valuation (x) 12/15A 12/16E 12/17E 12/18E
P/E 8.9 11.7 10.0 8.8 P/B 2.31 2.82 2.38 2.03 Dividend yield (%) 4.5 3.5 4.0 4.6 EV/sales 1.2 1.0 0.8 0.7 EV/EBITDA 10.3 8.8 6.5 5.0 EV/EBIT 12.6 10.8 7.9 6.0
ROE analysis (%) 12/15A 12/16E 12/17E 12/18E
ROE 28.7 26.7 25.8 24.8 ROIC 23.3 24.0 28.6 35.3
Credit ratios 12/15A 12/16E 12/17E 12/18E
Net debt/equity (%) (13.9) (19.5) (36.7) (48.5) Net debt/EBITDA (x) (0.49) (0.75) (1.37) (1.85)
Company Background
A leading Chinese home appliances manufacturer covering various product categories. It also engages in property management, logistics and finance business. It is the major shareholder of Little Swan (000418.SZ) and Welling Holding (0382.Hk).
Blue/Grey Sky Scenario
Our Blue Sky Scenario (Rmb) 41.90
TP upside RMB41.9 – Our upside scenario assumes 2017 EPS to be 5% higher than our base case driven on better market sales and cheaper raw material. Our TP is based on + 2 standard deviation above industry average.
Our Grey Sky Scenario (Rmb) 26.50
TP downside: RMB26.5 – Our downside scenario assume 2017 EPS to be 5% lower than our base case given weaker sales sentiment and market competition. Our TP is based on industry average.
Share price performance
The price relative chart measures performance against the Shanghai
Shenzhen CSI300 index which closed at 3,327.80 on 24-Oct-2016
On 24-Oct-2016 the spot exchange rate was Rmb6.77/US$1
Source: Company data, Thomson Reuters, Credit Suisse estimates

26 October 2016
China Home Appliance Sector 45
Focus charts and tables
Figure 97: Midea revenue breakdown(1H16)
Figure 98: Midea and Little Swan have gained
market share steadily
Source: Company data Source: CMM
Figure 99: Midea's export business is growing
rapidly
Figure 100: Toshiba will strengthen Midea's position
in Japan
Source: Company data, Credit Suisse estimates Source: Company data
Figure 101: KUKA's robotics and automation
solutions (System and Swisslog) will create multiple
synergies with Midea Figure 102: Midea P/E band chart
Source: Company data, Credit Suisse estimates Source: Company data, Credit Suisse estimates
Air Conditioning44%
Refrigerators9%
Washing Machines
9%
Small Appliances26%
Motor3%
Logistics1%
Non-core business
8%
1314 14
1615
16 17
3 4 34 5 5 5
8 7
9 810 10
11
0
2
4
6
8
10
12
14
16
18
1H13 2H13 1H14 2H14 1H15 2H15 1H16
Little Swan Midea washer Midea refrigerator
%
38% 36% 38%44%
50%
0%
10%
20%
30%
40%
50%
60%
70%
80%
90%
100%
2014 1H15 2015 1H16 2016E
Export Domestic
Japan70%
Others30%
Robotics30%
Systems49%
Swisslog21%
4.0
5.0
6.0
7.0
8.0
9.0
10.0
11.0
12.0
Se
p1
3
No
v13
Jan
14
Ma
r14
Ma
y14
Jul1
4
Se
p1
4
No
v14
Jan
15
Ma
r15
Ma
y15
Jul1
5
Se
p1
5
No
v15
Jan
16
Ma
r16
Ma
y16
Jul1
6
Se
p1
6
Mean+2 std
Mean+1 std
Mean
Mean-1 std
Mean-2 std
Mean 8.2
Std 1.6

26 October 2016
China Home Appliance Sector 46
Likely the fastest-growing white goods giant
Since Midea's relisting, the firm has been growing faster than its key competitors Qingdao
Haier and Gree, and we expect the trend to continue in the next few years. The group has
been gaining market share across all categories – AC, refrigerators, washing machines as
well as most categories in small appliances. Even during the AC destocking period, the
group's sales performance is still better than Gree given its diversified sales category.
In our view, the key drivers for market share gain are value for money positioning with a
strong brand name, and good product quality. It is priced at a discount to the market
leader in most categories, and this partly explains why its OPM is lower than industry
leaders in the respective segment but yet gradually improving.
Despite being one of the largest consumer appliance brands globally, Midea only ranks
second in air conditioner and washing machine and fourth in refrigerator. Its revenue in
these segments are 19%/8%/53% lower than the industry leaders, which implies more
room for growth driven by market consolidation and launch of innovative products.
We see multiple growth drivers for Midea's core business driven by both industry growth
and market share gain. We forecast revenue growth of 11%/13%/8% for
2016E/2017E/2018E.
Figure 103: Midea has the largest market share in global home appliance market
%
Midea 4.4
Philips 4.4
Panasonic 2.6
Haier 2.4
Conair 1.7
Black+Decker 1.7
Gree 1.6
LG 1.4
Joyoung 1.4
Oral-B 1.4
Source: Euromonitor
Figure 104: Midea has top market share in multi categories in China
Category 2015 market share Rank
Air-conditioner 25.2 2
Refrigerator 9.6 4
Washing machine 21.3 2
Rice cooker 42.3 1
Induction cooker 48.6 1
Pressure cooker 42.7 1
Electric kettle 32.2 1
Microwave oven 44.6 2
Water purifier 27.9 1
Kitchen stove 7.2 4
Range hood 8.8 4
Vacuum cleaner 11.3 3
Electric fan 12.2 3
Source: Company data

26 October 2016
China Home Appliance Sector 47
Multiple growth drivers at white goods category
AC sales rebound as channel inventory improves
AC is the largest revenue contributor to Midea with a 44% revenue share. As inventory
situation normalises, we expect Midea's sales to rebound by 15%/26% from the low base
of -30% in 2H15 and -20% in 1H16. As discussed in the industry section, we expect
China's AC industry to witness a 5%sales CAGR, and we expect the firm to outperform
industry growth thanks to market share gain.
Based on our discussions with various companies, we estimate that industry AC inventory
has reduced to 26 mn units by the end of August, down 35% from the peak level and 15%
from the end of summer inventory in 2014. Based on IOL, which measures industry
manufacturing sales, AC sales for domestic market climbed 16%/23%/37% in
July/Aug/Sep from the low base of a 14% decline in the corresponding period last year.
Now Midea's inventory is at the lowest level since 2008 at around four to five months. The
company is actively rationalising its inventory level by controlling shipments and changing
from the traditional inventory-pile-up production mode to T+3 production mode which is
driven by retail demand. The changes should reduce the risk of inventory overhang in the
future.
Washing machine and refrigerator are gaining market share
Washing machine and refrigerator contribute 9% each to Midea's revenue. Midea is
aggressively taking market share in these two segments and is delivering above industry
revenue due to strong branding and good product quality.
Little Swan and Midea have gained 4% and 2% market share, respectively, and
refrigerator also gained 3% market share in 2013-1H16. We expect Midea's washer and
refrigerator to continue outperforming the market with 17% and 10% CAGR, respectively.
Small appliance benefits from fast market growth
Small appliances (include both kitchenware appliances and other life small appliances)
account for 26% of Midea's total revenue. We expect this segment to witness an 8%
CAGR, mainly driven by ASP growth. We expect consumption upgrade, such as traditional
rice cooker to IH rice cooker to drive up ASP 5%. As Midea enjoys a dominant position in
multiple small appliance categories, there is limited room for further market share
expansion.
Export sales driven by RMB depreciation and stronger branding
Thanks to RMB depreciation, Chinese home appliances export business achieved strong
growth in 8M16. As 70-80% of export sales are settled in USD, the strengthening USD
makes China home appliance export more competitive. There will also be temporary GPM
benefits from production costs reduction as production costs are mainly denominated in
RMB.
Midea has strong export business as its share of revenue has increased from 38% to 44%
from 2014 to 1H16, and is expected to reach 50% in 2016 year-end, partly boosted by the
consolidation of Toshiba.
Midea also targets to focus more on OBM instead of OEM, which is crucial for brand
establishment. At present, only about one-third of export business is OBM, compared to
Haier at 100%. We see plenty of room for Midea to further develop original brand business
overseas, and we expect export business to outgrow domestic business and reach 60%
revenue share in 2018 due to better product mix.

26 October 2016
China Home Appliance Sector 48
Figure 105: Sales CAGR for different segments
Figure 106: Inventory has decreased more than
10mn units
Source:CMM, IOL, AVC, Credit Suisse estimates Source: IOL, AVC, Credit Suisse estimates
Figure 107: Midea has increased market share in
range hood/gas stove by 3%/2% from 2013
Figure 108: Midea has the largest rice cooker market
share
Source: CMM, Credit Suisse Source: CMM, Credit Suisse
Figure 109: Midea and Little Swan have been
gaining market share steadily
Figure 110: Midea's export business is growing
rapidly
Source: CMM Source: Company data, Credit Suisse
9.0%
6.0%
5.0%
4.3%
3.0% 3.0%
1.0%
0.0%
1.0%
2.0%
3.0%
4.0%
5.0%
6.0%
7.0%
8.0%
9.0%
10.0%
Kitctenware AC Life smallappliances
Bathroomelectricalappliance
Fridge Washer TV
30
40
26
-
5
10
15
20
25
30
35
40
45
2014 Jul 2015 Jul 2016 Jul
mn units
8%
10%
11% 11%
9%
10%
11% 11%
0%
2%
4%
6%
8%
10%
12%
14%
2013 2014 2015 6M16
range hood gas stove
Midea
41%
Joyoung
27%
Supor
14%
Others
18%
1314 14
1615
16 17
3 4 34 5 5 5
8 7
9 810 10
11
0
2
4
6
8
10
12
14
16
18
1H13 2H13 1H14 2H14 1H15 2H15 1H16
Little Swan Midea washer Midea refrigerator
%
38% 36% 38%44%
50%
0%
10%
20%
30%
40%
50%
60%
70%
80%
90%
100%
2014 1H15 2015 1H16 2016E
Export Domestic

26 October 2016
China Home Appliance Sector 49
Room for margin expansion
Midea expanded gross margin and net profit margin by 3% and 9% in 2011-2015,
respectively, due to better product mix, economies of scale and operational efficiency. We
expect these factors to continue driving up gross margin in 2016 and beyond and forecast
a 40 bp margin expansion in 2017/18. Compared to the market leaders (e.g., Gree in AC
and QD Haier in Washing Machine and refrigerator), Midea's margin in respective
products is still significantly behind, which suggests room for improvement. Among the
three categories, we see more margins upside for refrigerator and washer.
Better product mix
Midea has lower ASP than the lead player in all white goods segments due to its low end
position before 2011. Since repositioning, Midea has been focusing on profitability and set
high margin product share of sales as a KPI. As industry is trading up, consumers trend for
smart products/energy efficient products and other functional products, which should all
drive up gross margin. Midea still has ample room for margin improvements, as its
washing machine and refrigerator segments' margin still lag Haier for 5% and 8% in 1H16.
Operation efficiency/scale effect
At this stage, Midea lags 19%/53%/8% behind industry No.1 player in
AC/refrigerator/washer segments. As Midea's revenue size enlarges, we expect more
economies of scale to boost margin. Midea has invested over Rmb5 bn in automation
since 2012, which should also help for production optimisation and efficiency
enhancement. Looking forward, Midea will continue to spend around Rmb1-2 bn per
annum on automation with the help of KUKA. We expect higher efficiency and labour cost
reduction to further boost margin in the long term.
Figure 111: Midea 's revenue scale/gross margin still lag industry leaders
Category Brand Revenue (Rmb mn) Difference Gross margin
AC Midea 34,200 -19% 33%
Gree 41,982 40%
Refrigerator Midea 6,701 -53% 26%
Haier 14,280 34%
Washer Midea 7,381 -8% 29%
Haier 8,050 34%
Source: Company data, Credit Suisse

26 October 2016
China Home Appliance Sector 50
Toshiba – promising outlook
We are positive on Toshiba acquisition due to (1) R&D synergies on washing machines
and refrigerators, (2) channel leverage between the two companies (e.g., Midea to Japan
market and Toshiba to China), and (3) future profit contribution from Toshiba.
Toshiba is expected to have generated Rmb7,300 mn revenue (5% of group sales) and
US$500 mn loss in 2H16, but we expect a profit turnaround at 2017 due to (1) Midea's
successful integration track record, (2) long-term relationship with Toshiba, and (3) cost
savings on supply chain and sourcing integration (e.g., using Midea's production line to
manufacture Toshiba's products).
Transaction at a glance
In March this year, Midea acquired 80.1% of Toshiba's home appliance business for
US$693 mn (US$473 mn plus US$220 mn liabilities), which equals around Rmb4.5 bn.
The transaction was funded by a USD debt at 2.375% interest rate, meaning that Toshiba
needs to achieve at least US$16 mn to cover the interest costs. In addition to the asset,
Midea will get 40 years of Toshiba brand authorisation rights and over 5,000 patents.
In 2014, the acquired business had around Rmb23.7 bn revenue, including white goods
segment of Rmb13.7 bn and non-white goods segment of Rmb10 bn. White goods
segment include washer, vacuum cleaner, AC, refrigerator and kitchenware, and non-
white goods segment include sales and repairmen service for TV, PC and lighting, etc.
Toshiba's white goods unit has over 70% revenue from Japan and has a strong position
there, with a top-five market share position in multiple categories.
Toshiba's lifestyle segment (which contains Target Company in this transaction) has seen
revenue decline and increasing operating loss from 2013-2015 due to rising competition
and rising cost in OEM supplies on a weaker JPY. Target Company's balance sheet has
been incorporated into Midea's 1H16 financial statement, and its P&L will be consolidated
in 2H16. We have factored in US$500 mn loss from Toshiba in 2H16 but assume profit
breakeven in 2017 due to multiple synergies.
Figure 112: Toshiba has most revenue coming from
Japan
Figure 113: Refrigerator and washer are the most
important categories for Toshiba
Source: Company data Source: Company data
Japan70%
Others30%
Fridge26%
Washer23%AC
15%
Vacumn13%
Microwave10%
Other small appliances
13%

26 October 2016
China Home Appliance Sector 51
Figure 114: Toshiba lifestyle revenue breakdown
Figure 115: Toshiba lifestyle net sales and operating
profit are decreasing
Source: Company data Source: Company data
Multiple synergies with Toshiba
Market expansion. Before the acquisition, Midea had a small presence in
Japan, and Japan was mainly dominated by domestic brands. Toshiba has
strong branding locally with more than 3,600 Toshiba stores, and thus Midea
can quickly tap into the Japan and SE Asia markets and obtain local channels.
R&D synergies. This transaction includes more than 500 patents, which will
strengthen Midea's product competitiveness. Midea is relatively weak in the
refrigerator segment with a No.4 market share position, while Toshiba's
refrigerator segment is the largest among all. Toshiba's 's patent in DD motor,
inverter control patents as well as refrigerator insulation board will be crucial for
Midea's technological improvements
Visible profit turnover. Toshiba's profit turnover would be highly visible as (1)
Midea has scale advantage and upstream business, which can help Toshiba
reduce sourcing costs, (2) Midea has a strong track record of successful brand
acquisition, such as Little Swan, (3) Toshiba and Midea have long strong co-
operation history which reduce integration risks.
Figure 116: Midea and Toshiba have long collaboration history
1993 Midea and Toshiba co-operated in residential AC
1996 Midea and Toshiba co-operated in compressor
1998 GD Midea acquired 60% equity interest in Toshiba Macro, stepping into AC compressor industry.
2000 Midea and Toshiba formed strategic partnership
2002 Midea and Toshiba co-established a AC lab
2004 Established partnership with Toshiba Carrier in commercial AC and residential AC
2008 Midea and Toshiba Carrier established Anhui Meizhi Company for Refrigerator compressor business
Source: Company data, Credit Suisse research
PC61%
TV18%
White goods21%
-20,000
0
20,000
40,000
60,000
80,000
100,000
2013 2014 2015
Net sales Operating revenue
Rmb mn

26 October 2016
China Home Appliance Sector 52
KUKA – way to a new market
We believe the major purpose of the KUKA acquisition is to tap into fast-growing robotics
industry in China. Midea has long aimed for engaging in this business, starting from its
joint venture with Yaskawa. This transaction may mark the start of a new chapter for
Midea.
China's robotics market has been witnessing a CAGR of 35% in 2010-15. Today, China
has the most number of industrial robots at 0.68 mn units, which make up for 27% of
global market share. However, due to low penetration rate, we see huge room for
industrial robotics business to grow. For every 10,000 workers, China has 36 robots while
Japan/Korea have 315/478, respectively. It is expected by the International Federation of
Robotics (IFR) that by 2020 industrial robots sales in China will reach 2.3 mn units,
implying a 28% CAGR.
At this stage foreign robots still dominate the Chinese market with around 70% market
share. By taking over KUKA, Midea can leverage its resources instead of starting from
zero, which would require significant investment in R&D and take multiple years to
achieve. On the other hand, Midea's strong channels and network can help KUKA
accelerate penetration in China.
We expect KUKA's financials to be consolidated in 2017, which will increase Midea's
revenue by around 14% and net profit by 4%, taking into consideration finance cost.
Figure 117: China has low penetration of industrial
robots
Figure 118: Chinese industrial robotics market will
continue to grow at a fast pace
Source: IFR Source: IFR, CRIA,askci.com
Transaction at a glance
Midea's tender offer to purchase 81% of KUKA's shares with €115/share, implies 36%
premium over its closing price and at 48x 2015 P/E. The transaction will be financed by an
overseas loan at 0.65% and internal cash. We expect KUKA's financials to be
consolidated in 2017 if the transaction goes through.
If the offer is successfully approved, Midea will hold 94.55% (with original 13.5% share) of
KUKA. KUKA will remain independent, meaning that its database would not be accessed
by Midea.
Tender offer is still pending approvals from European/Mexico anti-monopoly reviews,
CFIUS, and DDTC. These approvals would be completed before March 2017.
0
100
200
300
400
500
600
China USA Germany Japan Korea
units/10000 workers
0%
10%
20%
30%
40%
50%
60%
0
50
100
150
200
250
2011 2012 2013 2014 2015 2020E
units (000)

26 October 2016
China Home Appliance Sector 53
What does KUKA do?
KUKA is a leading robot manufacturer and automation solution provider. It is one of the
industrial robots "Big Four" families, together with ABB, Fanuc, and Kawasaki. KUKA's
business includes robotics, systems, and Swisslog. KUKA's robotics business includes
industrial and medical robotics, and industrial robots take about 9% of market share.
Around 50% of revenue comes from the auto industry. Systems segment provides
automation strategy for various clients. Swisslog was purchased by KUKA in 2014 and
specialises in automation solutions.
In 2015, KUKA's revenue was around €3 bn (Rmb21.7 bn) with €86.8 mn (Rmb0.5 bn) net
profit. The company generated 20% revenue CAGR and 30.6% earnings CAGR during
2011-2015. Net profit margin was low at 3% in 2015 due to strong pricing power of
customers. Industry net margin was below 5%. Among the three categories, robotics has
the highest gross margin with 39% gross margin, followed by systems (17.3%) and
Swisslog (15.7%).
Figure 119: KUKA revenue breakdown Figure 120: KUKA margin comparison
Source: Company data, Bloomberg Source: company data
Figure 121: Industrial robotics market share
Figure 122: KUKA has smallest revenue size among
the " Big Four"
Source: Company data, Bloomberg, Credit Suisse research Source: Bloomberg, Credit Suisse research
Synergies with Midea
Besides earnings accretion, KUKA's transaction would help Midea with market expansion
and efficiency enhancement. If the transaction gets approved, we expect it to take one to
two years for these synergies to kick in.
Robotics30%
Systems49%
Swisslog21%
0%
5%
10%
15%
20%
25%
30%
2011 2012 2013 2014 2015
GPM OPM NPM
ABB11%
Fanuc17%
Yaskawa9%
Kuka9%
Others54%
0
500
1,000
1,500
2,000
2,500
3,000
3,500
4,000
Kuka Yaskawa Fanuc ABB
mn USD

26 October 2016
China Home Appliance Sector 54
Possibly expand to service robotics industry. KUKA can possibly expand
into service robots industry, which is at an early stage and contains large
potential, in our view.
Further automation and efficiency enhancement for Midea. KUKA should
further improve Midea's production efficiency in addition to existing investments.
Midea has invested Rmb5 bn in automation with 1,200 units of industrial robots.
Its production staff number has decreased by 17% from 2013. KUKA's
experience in automation advisory (systems segment) and storage
management (Swisslog) can further enhance Midea's automation and product
efficiency which will boost GPM.
Figure 123: Midea cut staff number by 17% thanks
to automation
Figure 124: We expect KUKA to contribute 4%/5%
earnings to Midea in 2017E/2018E
Source: Company data Source: the BLOOMBERG PROFESSIONAL™ service, Credit Suisse estimates
Note: Kuka earnings is based on Bloomberg consensus
95,506 94,779
78,731
0
20,000
40,000
60,000
80,000
100,000
120,000
2013 2014 2015
Rmb mn 2017E 2018E
Kuka estimated earnings 1,013 1,160
After tax finance cost (at 0.65% interest rate) -331 -138
Midea earnings 18,396 20,819
Contribution to Midea's earnings 4% 5%

26 O
cto
be
r 201
6
Ch
ina H
om
e A
pp
lian
ce
Sec
tor
55
Figure 125: Comparison between global industrial robot companies
Main business Main clients Sales in 2015 Net Profit in 2015 GPM OPM NPM Sales CAGR
16-18E
Kuka Offer customized automation solutions from
industrial robots to complete production lines.
Major segments include Swisslog (supplier of
automated intralogistics solutions)
Auto industry, hospitals,
warehouses and distribution
centers
€2,965.9mn € 86.8mn 23.5% 4.5% 2.9% 6%
Yaskawa The Yaskawa Electric Group consists of 77
subsidiaries and 25 affiliates with Yaskawa Electric
as the core company. Core business units include
1) motion control 2) robotics 3) system engineering
and 4) other such as IT related services and
logistics etc.
Semiconductor, LCD
manufacturing, steel plants, water
supply plants and home appliance
companies etc.
¥ 411.26 bn ¥ 22.365 bn 31.7% 8.9% 5.4% 1.7%
ABB ABABB is a global leader in power and automation
technologies. Its core business units include 1)
electrification products 2) discrete automation and
motion 3) Process automation and 4) power grids.
Oil and gas, power, chemicals
and pharmaceuticals, pulp and
paper, metals and minerals etc.
US$ 35,481 mn US$ 1,933 mn 28.6% 8.6% 5.4% 0.7%
FANUC FANUC manufactures factory automation systems
& equipment's, with three core business segments
consisting of 1) the FA Business Division, based on
its basic technologies of NC and SERVO,2) the
ROBOT Business Division and 3) ROBOMACHINE
Business Division which apply these basic
technologies
Machinery ¥ 623.418 bn ¥159.7 bn 47.6% 34.6% 25.6% -4.2%
Source: Company data, the BLOOMBERG PROFESSIONAL™ service, Credit Suisse estimates, sales forecasts are based on Bloomberg market consensus

26 October 2016
China Home Appliance Sector 56
Strong employee incentives
In our view, Midea has the strongest management incentive plan among the three players.
At present, management holds 4% Midea shares. Together with three incentive options
scheme and two partnership plans for core management, management/employees would
have 10.2% Midea shares if all share scheme conditions are met.
Haier has a strong track record of management incentives with four past management
options scheme. Recently, Haier launched an employee share scheme which amounts to
0.6% total shares.
Gree has the weakest management incentive as it does not have much share schemes
except for the recent employee share plan after the Yinlong transaction. If the deal is
passed through, Gree management will have 2.7% of enlarged capital.
Figure 126: Midea has the strongest employee incentive pans among domestic three players
Midea Gree Haier
Existing shares 3.9% 0.80% 0.4%
Current Share scheme 4.9% 2.0%* 0.6%
past share scheme 1.4% 7%
Source: Company data, Credit Suisse estimates * as enlarged capital
Figure 127: Midea management incentive plan
Stock rewarding plan Partnership plan
plan1 plan2 plan3 plan1 plan2
Announcement date 2014/01 2015/03 2016/05 2015/04 2016/03
No. of benefited employees 562 639 929 15 15
No of shares (mn) granted 122.3 108.7 127.3 6.6 2.6
As % of 1H16 shares outstanding 2.4% 1.7% 2.0% 0.2% 0.04%
Exercise price 11.01 19.56 21.35 stock purchased at
34.85 on average
amounted RMB 230M
Stock purchased at
Rmb 30.69/share
Vesting/assigning period 2015,2016,2017 2016,2017,2018 2017,2018,2019 April 2018,2019,2020 April 2019
conditions phase1 *2015:2014 NP
growth>15%,
ROE>20%
*2016:2015 NP
growth>15%,
ROE>20%
2017: 2016 net profit>
avg last 3 yrs
2015 NP growth to
equity holders
>15%;ROE>20%
2016 weighted avg
ROE>20%
phase2 *2016:2015 NP
growth>15%,
ROE>20%
2017:2016 NP
growth>15%,
ROE>20%
2018: 2017 net profit>
avg last 3 yrs
TBA TBA
phase3 2017:2016 NP
growth>15%,
ROE>20%
2018:2017 NP
growth>15%,
ROE>20%
2019: 2018 net profit>
avg last 3 yrs
TBA TBA
* condition met
Source: Company data, Credit Suisse

26 October 2016
China Home Appliance Sector 57
Figure 128: Haier past incentives plan
plan1 plan2 plan3 plan4
Announcement Date 5/1/2009 9/1/2010 5/1/2012 4/12/2014
No. of benefited employees 49 68 200 3/29/1901
No of shares (mn) granted 35.0 22.0 26.0 54(47.6mn options and
6.9mn restricted shares)
As % of 1H16 shares outstanding 2.6% 1.6% 1.0% 1.8%
Exercise price (RMB) 5.24 10.11 10.36 Stock options: 16.63
Restrictive stock: 7.73
Vesting period 2010,2011,2012,2013 2012,2013,2014 2013,2014 2016,2017
conditions phase1 *2010:2009 core profit
growth>18% (actual 35%),
ROE>10% (actual 14%)
*2012:2011 core profit
growth>18% (actual 48%),
ROE>10% (actual 25.6%)
*2013:2012 core profit
growth>18% (actual 30%),
ROE>10% (actual 24.2%)
*2015:2014 core profit
growth>15% (actual 15%),
ROE>20% (actual 27.58%)
phase2 *2011:2010 core profit
growth>18% (actual 54%),
ROE>10% (actual 22.2%)
*2013:2012 core profit
growth>18% (actual 30%),
ROE>10% (actual 24.2%)
*2014:2013 core profit
growth>18% (actual 18%),
ROE>10% (actual 23.5%)
2016:2015 core profit
growth>15% (actual -
15.0%), ROE>20% (actual
16.2%)
phase3 *2012:2011 core profit
growth>18% (actual 48%),
ROE>10% (actual 25.6%)
*2014:2013 core profit
growth>18% (actual 18%),
ROE>10% (actual 23.5%)
phase4 *2013:2012 core profit
growth>18% (actual 30%),
ROE>10% (actual 24.2%)
Source: Company data, Credit Suisse
Valuation
Midea is currently trading at 10.2x P/E, which is 1 standard deviation above its historical
average and 10% discount to the white goods industry. Excluding net cash, the stock is
only trading at 7.7 ex-cash P/E with a 3.5% dividend yield.
With the strongest earnings outlook among the three white goods companies, we believe
Midea deserves to trade at a premium. Our target price of Rmb34.50 is based on 13x
2017E P/E, which is one standard deviation above industry peers which we believe is
warranted by its stronger earnings outlook and above-industry ROE. At our target price,
Midea will be trading at 0.8x PEG, which appear fair, in our view.
Risks
Major risks to our target price and rating include the following:
Slower-than-expected macro environment Slower macro environment will have
negative impact on home appliance spending in general
Raw material price volatility unexpected raw material price hike will cause
margin erosion
worse-than expected property market slow property market growth will delay
refurbishment and reduce home appliance spending
KUKA acquisition not going through. Kuka acquisition not going through could
be a market surprise and have negative impact on Midea's automation progress.

26 October 2016
China Home Appliance Sector 58
Shareholding structure
Figure 129: Shareholding structure
Source: Company data, Credit Suisse research Note: as of June 30,2016
Midea Group美的集团股份有限公司
(000333.SZ)
34.93%
Mr. He Xiangjian(Founder)
Ningbo Kailian Enterprise
宁波开联实业
Public
1.75%
Ningbo Meisheng宁波美晟
Midea Holdings美的控股
Zhuhai Ruirong
CDH鼎辉投资
Strategic investors94.55% 70%
1.14% 2.63% 4.56% 46.14%
30%
Mr. Fang Hongbo(CEO)
2.13%

26 October 2016
China Home Appliance Sector 59
Asia Pacific/China Household Durables
Gree Electric Appliances Inc of Zhuhai
(000651.SZ / 000651 CH) Rating OUTPERFORM Price (24 Oct 16, Rmb) 22.55 Target price (Rmb) 28.00 Upside/downside (%) 24.2 Mkt cap (Rmb/US$ mn) 135,655 / 20,028 Enterprise value (Rmb mn) 82,858 Number of shares (mn) 6,016 Free float (%) 72.8 52-wk price range (Rmb) 23.93-17.30 ADTO-6M (US$ mn) 284.6 *Stock ratings are relative to the relevant country benchmark.
¹Target price is for 12 months.
Research Analysts
Raymond Ching
852 2101 7852
Carey Shi
852 2101 7729
Attractive valuation, sales recovery starting
from 2H16
■ We initiate coverage on Gree with an OUTPERFORM rating and a TP of
28, implying 24.2% potential upside. Gree is our top pick in the white
goods segment, given its cheap valuation, attractive yield and accelerating
earnings growth starting in 2H16 as the firm and industry largely completed
AC destocking. We forecast earnings to increase by 11.4% CAGR in 2016-
18. We have not factored in the Yinlong contribution as the deal is subject to
further approvals.
■ Core business benefits from industry recovery. We believe that industry-
wide AC channel inventory is back to normal and industry sell-in has turned
positive in 3Q16 versus the declining trend since July 2015. RMB
depreciation also supports its export business growth. We expect Gree's AC
sales to increase by 12% in 2H16 and witness 9% CAGR in 2016-18, up from
flat and -29% in 1H16 and 2015. We expect Gree to take market share in the
AC industry.
■ Mixed view on Yinlong deal. While Yinlong and NEV sector offers strong
long-term potential, this acquisition is expected to be EPS dilutive at least for
the next five years mainly due to the huge capex investment and a significant
24% share dilution to finance the deal. The share price discount to finance
the Yinlong deal (Equity fund raising price: Rmb15.57 vs Rmb22 today) seem
to be more favourable to Yinlong's shareholders, in our view.
■ Valuation and risks. Gree is trading at 8.6x 2017E P/E, a 20% discount to
the home appliance sector. Dividend yield is also attractive at 8%. Excluding
its net cash, its core business is trading at 5x P/E despite solid outlook. Our
target price of Rmb28 is based on 10.5x 2017E P/E, in line with the large cap
consumer appliance companies. Risks to our valuation include (1) weak
property cycle, (2) worse-than-expected industry growth, and (3) raw material
volatility.
Share price performance
The price relative chart measures performance against the
Shanghai Shenzhen CSI300 index which closed at
3,327.80 on 24/10/16. On 24/10/16 the spot exchange rate
was Rmb6.77/US$1
Performance 1M 3M 12M Absolute (%) 5.2 17.3 23.9 Relative (%) 3.6 15.5 30.7
Financial and valuation metrics
Year 12/15A 12/16E 12/17E 12/18E Revenue (Rmb mn) 99,812.6 105,077.4 116,152.8 126,523.7 EBITDA (Rmb mn) 13,905.1 14,108.1 17,587.9 20,028.5 EBIT (Rmb mn) 12,587.4 12,941.7 16,298.6 18,624.1 Net profit (Rmb mn) 12,532.4 14,512.7 15,921.4 17,989.7 EPS (CS adj.) (Rmb) 2.08 2.41 2.65 2.99 Change from previous EPS (%) n.a. - - - Consensus EPS (Rmb) n.a. 2.36 2.59 2.89 EPS growth (%) (11.5) 15.8 9.7 13.0 P/E (x) 10.8 9.3 8.5 7.5 Dividend yield (%) 6.7 7.7 8.5 9.5 EV/EBITDA (x) 4.0 6.3 4.7 3.8 P/B (x) 2.85 2.56 2.32 2.09 ROE (%) 27.3 28.9 28.6 29.1 Net debt/equity (%) Net Cash Net Cash Net Cash Net Cash
Source: Company data, Thomson Reuters, Credit Suisse estimates
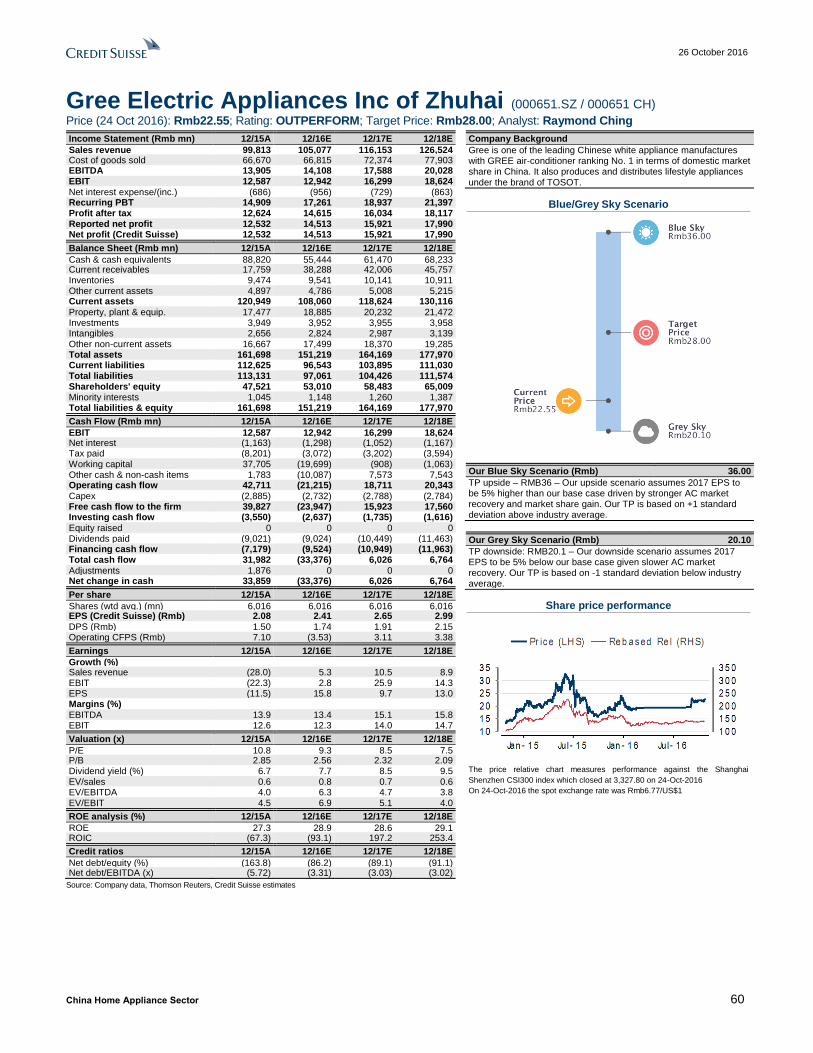
26 October 2016
China Home Appliance Sector 60
Gree Electric Appliances Inc of Zhuhai (000651.SZ / 000651 CH)
Price (24 Oct 2016): Rmb22.55; Rating: OUTPERFORM; Target Price: Rmb28.00; Analyst: Raymond Ching
Income Statement (Rmb mn) 12/15A 12/16E 12/17E 12/18E
Sales revenue 99,813 105,077 116,153 126,524 Cost of goods sold 66,670 66,815 72,374 77,903 EBITDA 13,905 14,108 17,588 20,028 EBIT 12,587 12,942 16,299 18,624 Net interest expense/(inc.) (686) (956) (729) (863) Recurring PBT 14,909 17,261 18,937 21,397 Profit after tax 12,624 14,615 16,034 18,117 Reported net profit 12,532 14,513 15,921 17,990 Net profit (Credit Suisse) 12,532 14,513 15,921 17,990
Balance Sheet (Rmb mn) 12/15A 12/16E 12/17E 12/18E
Cash & cash equivalents 88,820 55,444 61,470 68,233 Current receivables 17,759 38,288 42,006 45,757 Inventories 9,474 9,541 10,141 10,911 Other current assets 4,897 4,786 5,008 5,215 Current assets 120,949 108,060 118,624 130,116 Property, plant & equip. 17,477 18,885 20,232 21,472 Investments 3,949 3,952 3,955 3,958 Intangibles 2,656 2,824 2,987 3,139 Other non-current assets 16,667 17,499 18,370 19,285 Total assets 161,698 151,219 164,169 177,970 Current liabilities 112,625 96,543 103,895 111,030 Total liabilities 113,131 97,061 104,426 111,574 Shareholders' equity 47,521 53,010 58,483 65,009 Minority interests 1,045 1,148 1,260 1,387 Total liabilities & equity 161,698 151,219 164,169 177,970
Cash Flow (Rmb mn) 12/15A 12/16E 12/17E 12/18E
EBIT 12,587 12,942 16,299 18,624 Net interest (1,163) (1,298) (1,052) (1,167) Tax paid (8,201) (3,072) (3,202) (3,594) Working capital 37,705 (19,699) (908) (1,063) Other cash & non-cash items 1,783 (10,087) 7,573 7,543 Operating cash flow 42,711 (21,215) 18,711 20,343 Capex (2,885) (2,732) (2,788) (2,784) Free cash flow to the firm 39,827 (23,947) 15,923 17,560 Investing cash flow (3,550) (2,637) (1,735) (1,616) Equity raised 0 0 0 0 Dividends paid (9,021) (9,024) (10,449) (11,463) Financing cash flow (7,179) (9,524) (10,949) (11,963) Total cash flow 31,982 (33,376) 6,026 6,764 Adjustments 1,876 0 0 0 Net change in cash 33,859 (33,376) 6,026 6,764
Per share 12/15A 12/16E 12/17E 12/18E
Shares (wtd avg.) (mn) 6,016 6,016 6,016 6,016 EPS (Credit Suisse) (Rmb) 2.08 2.41 2.65 2.99 DPS (Rmb) 1.50 1.74 1.91 2.15 Operating CFPS (Rmb) 7.10 (3.53) 3.11 3.38
Earnings 12/15A 12/16E 12/17E 12/18E
Growth (%) Sales revenue (28.0) 5.3 10.5 8.9 EBIT (22.3) 2.8 25.9 14.3 EPS (11.5) 15.8 9.7 13.0 Margins (%) EBITDA 13.9 13.4 15.1 15.8 EBIT 12.6 12.3 14.0 14.7
Valuation (x) 12/15A 12/16E 12/17E 12/18E
P/E 10.8 9.3 8.5 7.5 P/B 2.85 2.56 2.32 2.09 Dividend yield (%) 6.7 7.7 8.5 9.5 EV/sales 0.6 0.8 0.7 0.6 EV/EBITDA 4.0 6.3 4.7 3.8 EV/EBIT 4.5 6.9 5.1 4.0
ROE analysis (%) 12/15A 12/16E 12/17E 12/18E
ROE 27.3 28.9 28.6 29.1 ROIC (67.3) (93.1) 197.2 253.4
Credit ratios 12/15A 12/16E 12/17E 12/18E
Net debt/equity (%) (163.8) (86.2) (89.1) (91.1) Net debt/EBITDA (x) (5.72) (3.31) (3.03) (3.02)
Company Background
Gree is one of the leading Chinese white appliance manufactures with GREE air-conditioner ranking No. 1 in terms of domestic market share in China. It also produces and distributes lifestyle appliances under the brand of TOSOT.
Blue/Grey Sky Scenario
Our Blue Sky Scenario (Rmb) 36.00
TP upside – RMB36 – Our upside scenario assumes 2017 EPS to be 5% higher than our base case driven by stronger AC market recovery and market share gain. Our TP is based on +1 standard deviation above industry average.
Our Grey Sky Scenario (Rmb) 20.10
TP downside: RMB20.1 – Our downside scenario assumes 2017 EPS to be 5% below our base case given slower AC market recovery. Our TP is based on -1 standard deviation below industry average.
Share price performance
The price relative chart measures performance against the Shanghai
Shenzhen CSI300 index which closed at 3,327.80 on 24-Oct-2016
On 24-Oct-2016 the spot exchange rate was Rmb6.77/US$1
Source: Company data, Thomson Reuters, Credit Suisse estimates

26 October 2016
China Home Appliance Sector 61
Focus charts and tables
Figure 130: Gree has No.1 AC market share
Figure 131: Inventory has decreased more than
10mn units
Source: Company data, Credit Suisse estimates Source: IOL, CMM, AVC, Credit Suisse estimates
Figure 132: Gree remains competitive at retail
market
Figure 133: Gree will tap into fast-growing NEV
industry
Source: CMM Source: Company data
Figure 134: Gree has increasing dividend payout
ratio and 8% dividend yield
Figure 135: Gree is trading at 20% discount to
industry average P/E
Source: Company data Source: the BLOOMBERG PROFESSIONAL™ service, Credit Suisse estimates
Gree33%
Midea25%
Haier11%
Hisense6%Aux
4%
TCL2%Chigo
3%
Whirpool2%
Others14%
30
40
26
-
5
10
15
20
25
30
35
40
45
2014 Jul 2015 Jul 2016 Jul
mn units
31.0%
33.1%
27.6%
28.7%
24%
25%
26%
27%
28%
29%
30%
31%
32%
33%
34%
8M15 8M16
share of value share of volume
57%
38%
324%
343%
0%
50%
100%
150%
200%
250%
300%
350%
400%
0
50,000
100,000
150,000
200,000
250,000
300,000
350,000
2011 2012 2013 2014 2015
units
20%
29%
41% 42%
64%
72%
0%
10%
20%
30%
40%
50%
60%
70%
80%
2010 2011 2012 2013 2014 2015
0.0
2.0
4.0
6.0
8.0
10.0
12.0
14.0
Jan
10
Ap
r10
Jul1
0
Oct1
0
Jan
11
Ap
r11
Jul1
1
Oct1
1
Jan
12
Ap
r12
Jul1
2
Oct1
2
Jan
13
Ap
r13
Jul1
3
Oct1
3
Jan
14
Ap
r14
Jul1
4
Oct1
4
Jan
15
Ap
r15
Jul1
5
Oct1
5
Jan
16
Ap
r16
Jul1
6
Oct1
6
Mean+2 std
Mean+1 std
Mean
Mean-1 std
Mean-2 std
Mean 6.7Std 1.45

26 October 2016
China Home Appliance Sector 62
Core business benefits from industry recovery
With the company and industry AC channel inventory largely back to normal, we expect
Gree's AC sales (84% of group revenue) to increase by 12% in 2H16 and a 9% CAGR for
2016-18E, which is faster than our expected industry's 5% CAGR driven by market
consolidation as consumers trade up to better brands and functionality; solid export sales
growth is partly supported by RMB depreciation.
Figure 136: Gree revenue breakdown (1H16) Figure 137: Gree AC sales forecast
Source: Company data Source: Company data, Credit Suisse estimates
Industry destocking likely to complete soon
The AC channel inventory situation has improved much, thanks to the harsh summer in
2016, with AC retail sales up 16/23% YoY in July/Aug and continuous destocking effort of
leading companies since 2Q15. Based on our estimate, domestic channel inventory
stands at 26 mn, which is down 35% from industry's peak and also 10% lower than the
end of summer inventory in 2014.
Based on our industry checks, we believe that the current industry channel inventory
stands at four months, and it will take another one to two quarters to reach a reasonable
level. Therefore, it is general market expectation that industry inventory destocking should
be completed by the end of 2016.
Although destocking is likely to continue in 2H16, we expect Gree's AC sales to return to
12% growth given the low base of 40% decline in 2H15. We expect export sales to
increase by 15% while domestic sales to increase by 11%.
AC and parts84%
Small appliances
1%
Other products3%
Non-core business
12%
-40%
-30%
-20%
-10%
0%
10%
20%
30%
0
20,000
40,000
60,000
80,000
100,000
120,000
140,000
2012 2013 2014 2015 2016E 2017E 2018E
sales revenue (LHS) YoY (RHS)
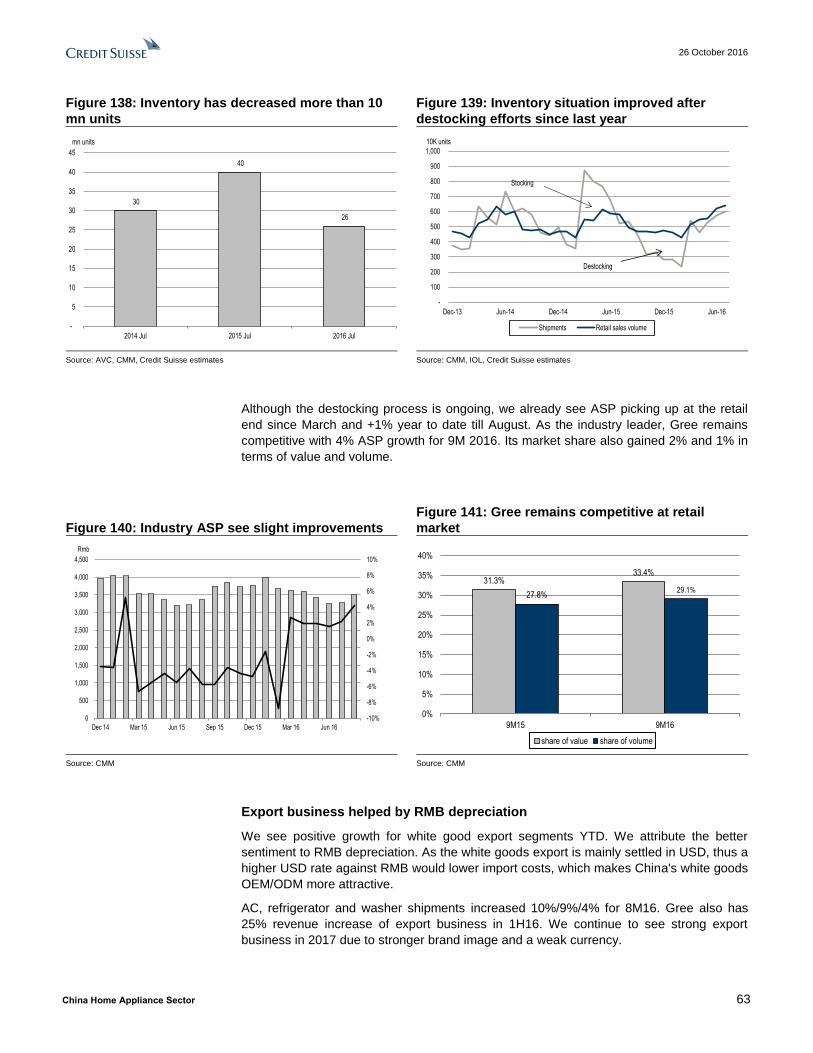
26 October 2016
China Home Appliance Sector 63
Figure 138: Inventory has decreased more than 10
mn units
Figure 139: Inventory situation improved after
destocking efforts since last year
Source: AVC, CMM, Credit Suisse estimates Source: CMM, IOL, Credit Suisse estimates
Although the destocking process is ongoing, we already see ASP picking up at the retail
end since March and +1% year to date till August. As the industry leader, Gree remains
competitive with 4% ASP growth for 9M 2016. Its market share also gained 2% and 1% in
terms of value and volume.
Figure 140: Industry ASP see slight improvements
Figure 141: Gree remains competitive at retail
market
Source: CMM Source: CMM
Export business helped by RMB depreciation
We see positive growth for white good export segments YTD. We attribute the better
sentiment to RMB depreciation. As the white goods export is mainly settled in USD, thus a
higher USD rate against RMB would lower import costs, which makes China's white goods
OEM/ODM more attractive.
AC, refrigerator and washer shipments increased 10%/9%/4% for 8M16. Gree also has
25% revenue increase of export business in 1H16. We continue to see strong export
business in 2017 due to stronger brand image and a weak currency.
30
40
26
-
5
10
15
20
25
30
35
40
45
2014 Jul 2015 Jul 2016 Jul
mn units
-
100
200
300
400
500
600
700
800
900
1,000
Dec-13 Jun-14 Dec-14 Jun-15 Dec-15 Jun-16
Shipments Retail sales volume
10K units
Destocking
Stocking
-10%
-8%
-6%
-4%
-2%
0%
2%
4%
6%
8%
10%
0
500
1,000
1,500
2,000
2,500
3,000
3,500
4,000
4,500
Dec 14 Mar 15 Jun 15 Sep 15 Dec 15 Mar 16 Jun 16
Rmb
31.3%33.4%
27.8%29.1%
0%
5%
10%
15%
20%
25%
30%
35%
40%
9M15 9M16
share of value share of volume

26 October 2016
China Home Appliance Sector 64
Figure 142: White good segments performed well
YTD thanks to weak RMB
Figure 143: Gree has strong export business
growth
Source: IOL Source: Company data
Further forex gains in 2H16 are expected
Gree has a large foreign currency position with US$2.7 bn (Rmb17 bn) and ¥196 bn
(Rmb11 ¥bn) by the end of June 2016. In 1H16, Gree recorded Rmb2.3 bn forex thanks to
RMB depreciation. We see a possible forex gain in 2H16 as RMB continues to appreciate.
Based on our in-house forecasts, USD is expected to appreciate against RMB and JPY by
2%/5.3%, respectively. Assuming Gree's foreign cash position remains unchanged, we
forecast Rmb1 bn forex gains in 2H16.
Figure 144: Rmb has depreciated 7% against the USD since 2013
Source: Company data, Credit Suisse estimates
-4%
-7%
10%11%
3%
9%
3%
-9%
4%
-10%
-5%
0%
5%
10%
15%
2014 2015 8M16
Residential AC Refrigerator Washing machine
19% 24%
0%
20%
40%
60%
80%
100%
120%
1H15 1H16export domestic
5.60
5.80
6.00
6.20
6.40
6.60
6.80
Jan-13 Jul-13 Jan-14 Jul-14 Jan-15 Jul-15 Jan-16 Jul-16

26 October 2016
China Home Appliance Sector 65
Figure 145: Gree is expected to have Rmb1 bn forex gains in 2H16
Currency Amount FX rate RMB equivalent Gain (Rmb)
2015 USD 2,659 6.49 17,267
JPY 195,737 0.05 10,550
1H16 USD 4,013 6.63 26,611 459
JPY 115,439 0.06 7,446 1,649
Sum 2,108
2H16 USD 4,013 6.79 27,248 637
JPY 115,439 0.07 7,838 392
Sum 1,030
Source: Company data, Credit Suisse estimates
Mixed view on Yinlong acquisition
We have a mixed view on the recent Yinlong acquisition. On the positive side, we see (1)
possible R&D synergies, (2) entrance to the promising new energy vehicle (NEV) market
and (3) private placement including employee shareholding scheme, which better aligns
the company and senior to middle management's interest, which in our view is important to
a SOE.
On the negative side, we see (1) uncertainties on the long-term application on the LTO
technology, (2) risks on government subsidies program and (3) the share price discount on
equity financing appears deep, which results in a 24% share dilution.
Based on the current pipeline, Yinlong will be consolidated to the group in early 2017. At
present, this transaction is still pending approvals from general shareholder meetings,
Ministry of Commerce, and CSRC. Assuming a full consolidation in 2017, we expect the
deal to be 15%/14%/13% EPS dilutive in 2017/18/19 based on the guaranteed earnings of
Rmb0.72 bn/Rmb1 bn/1.4 bn in 2017/18/19 against the 24% share dilution. As Gree is a
much larger company than Yinlong and the 24% share dilution is substantial, we estimate
that Yinlong needs to reach Rmb3.5 bn profit alone (2016E: Rmb720 mn) in 2017 in order
to become EPS accretive to Gree.
Background of Yinlong acquisition
In August 2016, Gree announced to acquire 100% stake of Zhuhai Yinlong for a total
consideration of Rmb13 bn. Yinlong is an integrated company from upstream battery
material and battery to downstream new energy vehicle (NEV) production. Its core
competency lies in LTO battery after acquiring 53.2% of a US public company Altairnano.
Yinlong is one of the top NEV companies in China with No.7 market share in electric
buses and 2,996 electric buses sales. Around 90% of its revenue comes from electric
business sales.

26 October 2016
China Home Appliance Sector 66
Figure 146: Yinlong's core business
Source: Company filling, Credit Suisse research
Figure 147: Yinlong revenue breakdown
Figure 148: Yinlong ranks No.7 in 2015 China
electric buses market share
Source: Company data Source: Company data
The transaction involves two stock financing plans. One is for Yinlong's shareholders
totaling Rmb13 bn to purchase. The second plan is private placements to eight
shareholders (including Gree and employee share scheme) for Yinlong's future
developments to raise Rmb9.69 bn. These two plans are estimated to dilute Gree's total
outstanding shares by 14% and 10%, respectively.
LTO battery
NEV
Battery charge service
LTO battery
LTO battery
LTO battery
LTO battery
Energy storage system
New energy vehicle
Battery charging service
Motor
LTO material
Electric buses89.4%
Bettery8.2%
Charging service1.0%
Energy storage0.4%
Materials1.1%
Yutong15%
Nanjing Kinglong10%
Zhongtong9%
Suzhou Kinglong8%
BYD6%Dongfeng Motor
6%
Yinlong4%
Golden Dragon3%
Others39%

26 October 2016
China Home Appliance Sector 67
Figure 149: Transaction structure for Yinlong acquisition
Consideration
(Rmb bn)
Issue price Shares
no.
Shareholders no. Lock up Dilution Purpose
Stock financing for Yinlong 13 (28.5x/18.1x/13x
P/E for 15/16/17)
15.57 834,939,974 21 12-36 months 14% Yinlong acquisition
Private placements 9.69 15.57 622,632,934 8 36 months 10% Li-on battery production line
32K NEV production plan
Yinlong R&D center upgrade, etc.
Source: Company data, Credit Suisse research
Profit guarantee by Yinlong: Yinlong's management offers profit guarantee that
Yinlong's net profit should be no less than Rmb0.72 bn/1 bn/1.4 bn in 2016/17/18E, which
implies 18.1x 2016E P/E or 13x 2017E P/E for Rmb13 bn transaction consideration.
Yinlong's core management will remain after the acquisition. The profit guarantee is based
on Yinlong's original assets without considering the additional Rmb9.69 bn capex
investment.
Figure 150: Shareholdings structure before and after Yinlong transaction
Name Before transaction After transaction
Gree Group 18.2% 18.3%
Heibei Jinghai 8.9% 7.2%
Yintong investment group 0.0% 3.5%
Dong Mingzhu 0.7% 1.4%
Management incentive scheme (ex-chairlady) 0.0% 1.2%
Other management 0.1% 0.1%
Public 72.0% 68.3%
Source: Company data, Credit Suisse
Pros and cons on this Yinlong acquisition
As highlighted in the previous section, we have a mixed view on the Yinlong acquisition.
While Yinlong and NEV sector offer strong long-term growth potential, this acquisition is
expected to be EPS dilutive at least for the next five years mainly due to huge capex
investment and a significant 24% share dilution to finance the deal. The share price
discount to finance the Yinlong deal (Equity fund raising price: Rmb15.57 vs Rmb22.2 at
present) seems to be more favourable to Yinlong 's shareholders, in our view.
Our positive view includes:
Possible synergies between Gree and Yinlong. We see synergies in R&D
and sales channel between these two companies. Both companies have
expertise in energy storage and new energy application. In addition, we believe
Yinlong can also leverage of Gree's strong relationship with the central
government to increase its sales to public transportation system and
government transportation usage.
Expansion into a fast-developing industry. Gree can diversify its business
from a single product company. This acquisition allows Gree to tap into the
promising NEV market. NEV unit sales jumped 300% growth in 2014/15 and it is
expected to sustain its strong growth momentum driven by government policy
supports and consumer preferences.

26 October 2016
China Home Appliance Sector 68
Figure 151: NEV sales remains strong growth
Source: Gree filings
Better employee incentives. The private placement shareholders include an
employee incentive scheme with Rmb2.37 bn, which equals 2.5% of current
capital or 2% of enlarged capital. After this transaction, Gree's senior
management will hold 2.7% of total share.
In contrast, we are negative on the deal due to the following.
Inefficient usage of cash/shares dilution. With almost Rmb80 bn net cash in
2015, its internal cash is more than enough to finance the Yinlong acquisition at
Rmb13 bn. Therefore, we do not think that Gree needs to place new shares to
finance the deal which results in a significant share dilution. Management
explained that Yinlong's shareholders would prefer to receive Gree's shares
instead of cash.
Although the valuation of Yinlong acquisition does not appear expensive at 18x
2016E P/E and 13x 2017E P/E based on profit guarantee, it requires an
additional Rmb9.7 bn capex investment. In addition, the capex is also funded by
new shares instead of internal cash. Share issue price was Rmb15.57/share,
equivalent to a 12% discount to the last trading price 17.72 (ex Rmb1.5
dividend) when Gree suspended trading. During Gree's trading suspension, the
white goods sector re-rated with Midea and Qingdao Haier share price rallying
by 47%/29%, respectively. This makes the new share issue price appear
undervalued. Overall, this transaction resulted in a significant 24% share
dilution.
In our view, the firm should finance part of the deal by cash to avoid extensive
share dilution.
Limited application of LTO technology. Yinlong's core competency lies in
LTO technology. At present, the dominating battery technology for new energy
bus is LFP (lithium iron phosphate). Compared to LFP technology, LTO has
advantages of (1) high speed charging, (2) more charging no of times, (3)
adjustable to wide temperature range (-50º - 60 º). It also has some
disadvantages of (1) low energy density and (2) relatively high cost due to lack
of economies of scale.
Due to LTO battery's characteristics, it is mostly used in buses where the route
is fixed and busses can recharge more often. Technological improvements are
required before LTO technology can be expanded to other vehicles on a large
scale.
57%
38%
324%
343%
0%
50%
100%
150%
200%
250%
300%
350%
400%
0
50,000
100,000
150,000
200,000
250,000
300,000
350,000
2011 2012 2013 2014 2015
units

26 October 2016
China Home Appliance Sector 69
Policy risk. NEV business still largely relies on government subsidies. Current
policy subsidises NEV based on mileage after full charging; Yinlong may be put
into disadvantage as LTO battery can only take short distance per charge due
to low battery density.
Another risk is a downtrend in government subsidies. As the government
intends to decrease subsidies to address "subsidy cheating" issues (2017-2018
down 20% subsidies YoY), we see future risks of policy headwinds.
Valuation is cheap with large cash position
Gree trades at 8.6x 2017E P/E, a 20% discount to the industry P/E. Considering its 11.3%
EPS CAGR in 2016-18, we believe valuation appears attractive. With expected Rmb47 bn
cash by the end of 2016, which is 40% of its market cap, the ex-cash P/E valuation for its
core business is only 5x. We believe Gree is undervalued and deserves a multiple re-
rating, as we see a rebound in AC segment. Its 72% dividend payout and 8% dividend
yield will support a multiple re-rating, especially in the current low yield environment.
Target price at Rmb28
Our target price of Rmb28 is based on 10.5x 2017E P/E, largely in line with the white
goods industry multiple. At our target price, the stock will be trading at 7x ex-cash P/E,
which still appears inexpensive.
Figure 152: Gree has increasing dividend payout
ratio over the last 5 years Figure 153: White goods sector is trading at 11x P/E
Source: Company data, Credit Suisse Source: Bloomberg, Credit Suisse estimates
20%
29%
41% 42%
64%
72%
0%
10%
20%
30%
40%
50%
60%
70%
80%
2010 2011 2012 2013 2014 2015 0.0
2.5
5.0
7.5
10.0
12.5
15.0
17.5
20.0
Jan10
Apr10
Jul10
Oct10
Jan11
Apr11
Jul11
Oct11
Jan12
Apr12
Jul12
Oct12
Jan13
Apr13
Jul13
Oct13
Jan14
Apr14
Jul14
Oct14
Jan15
Apr15
Jul15
Oct15
Jan16
Apr16
Jul16
Mean: 11Std: 2.3
Mean
Mean +2 std
Mean -2 std
Mean +1 std
Mean -1 std

26 October 2016
China Home Appliance Sector 70
Figure 154: Gree is trading at 8.6x P/E, 20%
discount to white good segment Figure 155: Gree is trading at 5x ex-cash P/E
Source: the BLOOMBERG PROFESSIONAL™ service, Credit Suisse estimates Source: the BLOOMBERG PROFESSIONAL™ service, Credit Suisse estimates
Risks
Major risks to our target price and rating include the following:
Slower-than-expected macro environment. Slower macro environment will
have negative impact on home appliance spending in general
Raw material price volatility. Unexpected raw material price hike will cause
margin erosion
Worse-than expected property market. Slow property market growth will delay
refurbishment and reduce home appliance spending
Yinlong acquisition not going through. Yinlong acquisition not going through
may be a market surprise and hinder Gree's business expansion.
0.0
2.0
4.0
6.0
8.0
10.0
12.0
14.0
Jan10
Apr10
Jul10
Oct10
Jan11
Apr11
Jul11
Oct11
Jan12
Apr12
Jul12
Oct12
Jan13
Apr13
Jul13
Oct13
Jan14
Apr14
Jul14
Oct14
Jan15
Apr15
Jul15
Oct15
Jan16
Apr16
Jul16
Oct16
Mean+2 std
Mean+1 std
Mean
Mean-1 std
Mean-2 std
Mean 6.7Std 1.45
0.0
1.0
2.0
3.0
4.0
5.0
6.0
7.0
8.0
9.0
Jan
10
Ap
r10
Jul1
0
Oct1
0
Jan
11
Ap
r11
Jul1
1
Oct1
1
Jan
12
Ap
r12
Jul1
2
Oct1
2
Jan
13
Ap
r13
Jul1
3
Oct1
3
Jan
14
Ap
r14
Jul1
4
Oct1
4
Jan
15
Ap
r15
Jul1
5
Oct1
5
Jan
16
Ap
r16
Jul1
6
Oct1
6
Mean+2 std
Mean+1 std
Mean
Mean-1 std
Mean-2 std
Mean 3.8Std 1.6

26 October 2016
China Home Appliance Sector 71
Shareholding structure
Figure 156: Gree shareholding structure
Source: Company data, Credit Suisse research
Note: assuming the Yinlong transaction goes through
Gree Group
格力集团
Zhuhai SASAC珠海市国有资产委员会
100%
Gree Electric Appliances of Zhuhai
珠海格力电器股份有限公司(000651.SZ)
18.27%
Air-conditioner
Hebei Jinghai Guaranteed Investment
河北京海担保投资有限公司Public
Small appliancesCompressor,
motor and other components
Finance servicesGree-Daikin JV(Precision mold &
electric device)
7.17% 71.02%
(Alliance of 10 distributors)
3.54%
Management
51%

26 October 2016
China Home Appliance Sector 72
Asia Pacific/China Household Durables
Qingdao Haier Co., Ltd. (600690.SS / 600690 CH) Rating OUTPERFORM Price (24 Oct 16, Rmb) 10.29 Target price (Rmb) 12.30 Upside/downside (%) 19.5 Mkt cap (Rmb/US$ mn) 62,745 / 9,264 Enterprise value (Rmb mn) 66,017 Number of shares (mn) 6,098 Free float (%) 45.1 52-wk price range (Rmb) 10.94-7.48 ADTO-6M (US$ mn) 47.0 *Stock ratings are relative to the relevant country benchmark.
¹Target price is for 12 months.
Research Analysts
Raymond Ching
852 2101 7852
Carey Shi
852 2101 7729
Global leader with solid earnings outlook
■ We initiate coverage on QD Haier with an OUTPERFORM rating and TP
of Rmb12.30. We like the company for its influential global branding, solid
15% 2016-18 earnings CAGR and undemanding valuation. In our view, QD
Haier is the strongest globally present brand among the white good
companies; the inclusion of GEA has significantly lifted its presence in North
America.
■ Organic sales growth improving in 2H16. We see sales accelerating
starting in 2H on AC sales recovery from low base, decent water heater sales
and better sales momentum for washing machine and refrigerator with market
shares gain at mid to low end segment supported by its initiative to broaden
low to mid-end SKUs. We expect 2H16/2017 organic sales growth to
accelerate to 9%/6% from -4% and -7.4% in 1H16/2015.
■ GEA is a major step up in global layout. We believe the GE home
appliance acquisition is a major step in enhancing global layout and multi
brandings. We see sourcing, R&D, channel expansion, and revenue
synergies in both near term and long term. With full consolidation, we
estimate that overseas would account for 45% of group revenue in 2017E
from 21% in 2015. We expect GEA to contribute ~30% revenue and ~25%
earnings in 2017/2018E.
■ Valuation appears undemanding. QD Haier trades at 10.7x 2017E P/E,
largely at par with the industry. We see stronger organic sales growth, GEA
inclusion as well as their synergies as share price catalysts. Our TP of
Rmb12.30 is based on one standard deviation above industry average, which
is justified by its stronger earnings outlook, margin and ROE. At our TP, the
stock will be trading at 0.8x PEG. Risks include raw material volatility, worse-
than-expected industry growth, low intense price competition, and slower-
than-expected integration of GEA.
Share price performance
The price relative chart measures performance against the
Shanghai Shenzhen CSI300 index which closed at
3,327.80 on 24/10/16. On 24/10/16 the spot exchange rate
was Rmb6.77/US$1
Performance 1M 3M 12M Absolute (%) -1.3 -0.6 3.7 Relative (%) -2.9 -2.4 10.5
Financial and valuation metrics
Year 12/15A 12/16E 12/17E 12/18E Revenue (Rmb mn) 89,351.1 114,061.5 139,076.4 149,954.6 EBITDA (Rmb mn) 6,369.0 8,866.7 10,331.4 11,696.4 EBIT (Rmb mn) 5,042.1 8,011.3 9,288.3 10,571.7 Net profit (Rmb mn) 4,300.8 5,060.6 5,786.4 6,630.2 EPS (CS adj.) (Rmb) 0.70 0.83 0.95 1.09 Change from previous EPS (%) n.a. - - - Consensus EPS (Rmb) n.a. 0.83 0.97 1.09 EPS growth (%) (18.9) 17.7 14.3 14.6 P/E (x) 14.6 12.4 10.8 9.5 Dividend yield (%) 2.1 2.4 2.8 3.2 EV/EBITDA (x) 6.5 8.1 6.5 5.2 P/B (x) 2.78 2.37 2.04 1.76 ROE (%) 18.2 20.6 20.2 20.0 Net debt/equity (%) Net Cash 23.5 9.2 Net Cash
Source: Company data, Thomson Reuters, Credit Suisse estimates

26 October 2016
China Home Appliance Sector 73
Qingdao Haier Co., Ltd. (600690.SS / 600690 CH)
Price (24 Oct 2016): Rmb10.29; Rating: OUTPERFORM; Target Price: Rmb12.30; Analyst: Raymond Ching
Income Statement (Rmb mn) 12/15A 12/16E 12/17E 12/18E
Sales revenue 89,351 114,062 139,076 149,955 Cost of goods sold 64,658 81,185 97,800 104,893 EBITDA 6,369 8,867 10,331 11,696 EBIT 5,042 8,011 9,288 10,572 Net interest expense/(inc.) (498) 695 1,096 1,071 Recurring PBT 6,975 8,454 9,710 10,907 Profit after tax 5,922 6,763 7,574 8,507 Reported net profit 4,301 5,061 5,786 6,630 Net profit (Credit Suisse) 4,301 5,061 5,786 6,630
Balance Sheet (Rmb mn) 12/15A 12/16E 12/17E 12/18E
Cash & cash equivalents 24,715 21,509 26,346 32,032 Current receivables 18,815 35,560 33,026 40,924 Inventories 8,559 13,070 12,652 14,361 Other current assets 2,778 3,139 3,504 3,663 Current assets 54,867 73,278 75,529 90,980 Property, plant & equip. 9,890 25,035 26,579 28,004 Investments 7,796 7,796 7,796 7,796 Intangibles 1,846 21,570 21,348 21,048 Other non-current assets 1,562 1,610 1,661 1,715 Total assets 75,961 129,290 132,914 149,543 Current liabilities 39,783 68,306 65,356 74,988 Total liabilities 43,558 91,417 88,988 98,850 Shareholders' equity 22,694 26,462 30,727 35,618 Minority interests 9,708 11,411 13,198 15,075 Total liabilities & equity 75,961 129,290 132,914 149,543
Cash Flow (Rmb mn) 12/15A 12/16E 12/17E 12/18E
EBIT 5,042 8,011 9,288 10,572 Net interest (525) (111) (115) (141) Tax paid (1,743) (1,734) (2,181) (2,447) Working capital (114) (1,573) (364) (134) Other cash & non-cash items 2,918 907 830 534 Operating cash flow 5,580 5,501 7,459 8,385 Capex (2,068) (1,815) (1,851) (1,685) Free cash flow to the firm 3,512 3,686 5,608 6,700 Investing cash flow (10,273) (34,466) (1,100) (960) Equity raised 342 0 0 0 Dividends paid (1,764) (1,293) (1,521) (1,739) Financing cash flow (1,896) 25,759 (1,521) (1,739) Total cash flow (6,589) (3,206) 4,837 5,686 Adjustments 152 32 32 32 Net change in cash (6,437) (3,174) 4,869 5,718
Per share 12/15A 12/16E 12/17E 12/18E
Shares (wtd avg.) (mn) 6,100 6,098 6,098 6,098 EPS (Credit Suisse) (Rmb) 0.70 0.83 0.95 1.09 DPS (Rmb) 0.21 0.25 0.29 0.33 Operating CFPS (Rmb) 0.91 0.90 1.22 1.38
Earnings 12/15A 12/16E 12/17E 12/18E
Growth (%) Sales revenue (7.4) 27.7 21.9 7.8 EBIT (27.6) 58.9 15.9 13.8 EPS (18.9) 17.7 14.3 14.6 Margins (%) EBITDA 7.1 7.8 7.4 7.8 EBIT 5.6 7.0 6.7 7.0
Valuation (x) 12/15A 12/16E 12/17E 12/18E
P/E 14.6 12.4 10.8 9.5 P/B 2.78 2.37 2.04 1.76 Dividend yield (%) 2.1 2.4 2.8 3.2 EV/sales 0.5 0.6 0.5 0.4 EV/EBITDA 6.5 8.1 6.5 5.2 EV/EBIT 8.2 8.9 7.2 5.8
ROE analysis (%) 12/15A 12/16E 12/17E 12/18E
ROE 18.2 20.6 20.2 20.0 ROIC 54.1 22.2 15.3 17.0
Credit ratios 12/15A 12/16E 12/17E 12/18E
Net debt/equity (%) (65.9) 23.5 9.2 (3.2) Net debt/EBITDA (x) (3.35) 1.00 0.39 (0.14)
Company Background
QD Haier is a Chinese white appliance conglomerate with leading market share in refrigerators, air cons, washing machines and water heaters. It is the major shareholder of Haier Electronics (1169.HK).
Blue/Grey Sky Scenario
Our Blue Sky Scenario (Rmb) 14.90
TP upside – RMB14.9 – Our upside scenario assumes 2017 EPS to be 5% higher than our base case driven by stronger than expected synergy with GEA. Our TP is based on +2 standard deviation above industry average.
Our Grey Sky Scenario (Rmb) 9.50
TP downside: RMB9.5 – Our downside scenario assumes 2017 EPS to be 5% lower than our base case due to softer washing machine and refrigerator sales and weaker GEA performance. Our TP is based on industry average.
Share price performance
The price relative chart measures performance against the Shanghai
Shenzhen CSI300 index which closed at 3,327.80 on 24-Oct-2016
On 24-Oct-2016 the spot exchange rate was Rmb6.77/US$1
Source: Company data, Thomson Reuters, Credit Suisse estimates

26 October 2016
China Home Appliance Sector 74
Focus chart and tables
Figure 157: QD Haier revenue breakdown
Figure 158: AC channel inventory has significantly
improved
Source: company data(1H16) note: GEA is included since June Source: IOL, AVC, CMM, Credit Suisse estimate
Figure 159: After inclusion of GEA, QD Haier will
become a global leader with comprehensive
coverage Figure 160: GE revenue breakdown (9M15)
Source: company data, Credit Suisse research, outline.map.com Source: Company data
Figure 161: QD Haier's margin has been increasing
due to better product mix
Figure 162: Company is trading close to historical
average
Source: Company data Source: Bloomberg, Credit Suisse estimates
Air conditioner19%
Refrigerators29%
Kitchenw are (including w ater
heater)
7%
Washing machines
17%
Equipment Product
3%
ICS17%
Non-core business
1%
GEA7%
30
40
26
-
5
10
15
20
25
30
35
40
45
2014 Jul 2015 Jul 2016 Jul
mn units
Kitchenware34%
Fridge29%
Washer19%
Dishwasher10%
Others8%
0%
5%
10%
15%
20%
25%
30%
35%
2011 2012 2013 2014 2015 1H16
Gross margin Operating margin Net margin0.0
5.0
10.0
15.0
20.0
25.0
Jan
11
Ap
r11
Jul1
1
Oct1
1
Jan
12
Ap
r12
Jul1
2
Oct1
2
Jan
13
Ap
r13
Jul1
3
Oct1
3
Jan
14
Ap
r14
Jul1
4
Oct1
4
Jan
15
Ap
r15
Jul1
5
Oct1
5
Jan
16
Ap
r16
Jul1
6
Oct1
6
Mean+2 std
Mean+1 std
Mean
Mean-1 std
Mean-2 std
Mean 10
Std 3.0

26 October 2016
China Home Appliance Sector 75
Global leader with solid earnings outlook
We see solid earnings backed by organic growth and GEA acquisition. We expect the firm
to deliver 15% earnings growth in 2016-18E. For its existing business, we see sales
acceleration starting in 2H on AC sales recovery from low base, decent water heater sales
and better sales momentum for washing machine and refrigerator, with market shares gain
at mid to low end segments supported by its initiative to broaden low to mid-end SKUs to
service price-sensitive customers.
In the overseas market, QD Haier is the most influential brand among the three white
goods giants, with 100% OBM and top three market share in AC/washer/refrigerator in the
world. GEA inclusion will further strengthen the company's global positioning and product
offerings, as this transaction will provide multiple synergies including R&D, sourcing and
sales channel. We expect GEA to contribute ~30% revenue and ~25% earnings in
2017/2018E.
Figure 163: QD Haier has leading market share in white good sector in in the world
2014 2015
market share rank market share rank
washer 18.50% 1 18.9% 1
AC 8.90% 3 8.6% 3
refrigerator 11.20% 2 11.9% 2
Source: Euromonitor
Organic sales growth is improving starting 2H
We believe the industry recovery in AC, extending product coverage to low to mid end
segment for washing machines and refrigerators, as well as its leading position in smart
products would lead to a 6% sales CAGR for existing business, faster than the overall
market growth of 3-4%.
AC sales to rebound in 2H16/1H17 on low base effect
We believe QH Haier's AC segment should see a recovery in 2H16 and 1H17 against the
easy base (2H15: -29%, 1H17: -8%), and the industry destocking cycle is close to
completion.
Based on IOL data, Haier's overall shipment (including domestic and export) in July/Aug
was up 42%/26%, which is faster than industry shipment growth of 16%/27%. We expect
its AC sales (excluding GEA) to increase by 21%/10% in 2H16/2017, and a high single
digit growth on a normalised basis in 2018
In our view, QD Haier has the best inventory management system among the three
domestic brands as its sales channels are managed by its subsidiary Haier Electronic.
Its current AC inventory remains low at 900k units or just around 13% of its full-year sales
volume. In our view, the low inventory level should pave way for QD Haier's ASP increase
and free up distributors' resources to develop other electronic categories. We see GPM
upside for its AC segment as its GPM is only at ~30% versus at 33% and Gree at 40%.

26 October 2016
China Home Appliance Sector 76
Figure 164: AC channel inventory has significantly
improved
Figure 165: Domestic AC sales picked up in
July/August/Sep this year
Source: AVC, CMM, Company data, Credit Suisse estimates Source: IOL, Credit Suisse estimates
Extending mass market SKUs at washing machine/refrigerator to drive growth
QD Haier is positioned at the mid to high end in AC/refrigerator/washing machine
segments, with 5%/15%/3% price premium, respectively. The brand has strong position in
the high-end market but this also affects its retail sales as the market's competition
intensifies. Its competitors such as Little Swan and Midea are aggressively taking share in
mid to low end market using a value for money positioning.
In order to penetrate into the mass market, QD Haier started to allocate more resources
since end of 2015 by expanding products below Rmb2,000 to serve consumers that are
more price sensitive. These new products still make a good GPM. Based on our channel
checks, we see washing machine and refrigerator sales growth to pick up in 2H16 with
refrigerator returning to positive growth (1H16: -5%) and washing machine growth
accelerating.
We expect the group to outperform industry growth driven by its leverage on its multi
brand strategy (Casarte at high end, Haier at mid to high end, Leader for young
customers) and the addition of value for money products. We expect its refrigerator and
washing machine sales to grow by mid-single digit, slightly faster than industry growth at
low single digit.
Figure 166: Qingdao Haier targets the mid-to-high end market
Industry QD Haier premium
AC 3,430 3,600 5.00%
Washer 2,429 2,494 2.70%
Refrigerator 3,146 3,609 14.70%
Source: Company data, Credit Suisse estimates
Leader in smart appliances
QD Haier is a pioneer in smart appliances with seven smart factories (800 production line)
and broad smart product categories. It was the first domestic company to launch an
integrated smart platform U+ in 2014, and it was selected as the only home appliance
company to help set national standards for smart production.
Smart appliances contribute around 15% revenue to Haier's total revenue. We expect this
number to reach 30% in the next three years, as consumers are trading up for more
advanced products. Also, smart products have 15-25% price premium over non-smart
ones.
30
40
26
-
5
10
15
20
25
30
35
40
45
2014 Jul 2015 Jul 2016 Jul
mn units
-50%
-40%
-30%
-20%
-10%
0%
10%
20%
30%
40%
50%
0
100
200
300
400
500
600
700
800
900
1,000
Jul 14 Oct 14 Jan 15 Apr 15 Jul 15 Oct 15 Jan 16 Apr 16 Jul 16
Series1 Series2
mn units

26 October 2016
China Home Appliance Sector 77
Figure 167: Retail price for smart and non-smart products
Product Smart price Non-smart price Premium for smart
function
AC Inverter /3rd grade
efficiency
3,466 2,932 18.2%
Refrigerator Two door/530L/non-
inverter
3,499 3,099 12.9%
Washing machine 7KG/drum type/non-
inverter
1898 1498 26.7%
Source: Company data, Credit Suisse estimates
Expansion to imbedded kitchenware products via GEA
Kitchenware accounted for 7% of sales with water heater contributing 70% of this
segment. As discussed in the industry session, imbedded large kitchen appliance has
huge potential, but the group has limited presence in this space at present.
GEA is strong on kitchenware with this segment contributing around 25% sales. Starting in
2017, the group will leverage on its China channel platform to introduce GE brand into the
imbedded kitchenware market. GE brand will mainly target the mid - high end customers.
We believe it is too early to provide an estimate on the additional revenue contribution
from GE in kitchenware but it is fair to expect this segment to be the fastest growing
category in the group, as existing water heater sales outlook is already faster than other
categories given relatively low penetration rate.

26 October 2016
China Home Appliance Sector 78
GEA acquisition – a major step in global layout
In our view, the inclusion of GE will significantly expand Haier's market share in United
States and its global presence. With full year consolidation of GEA, we estimate that
overseas sales will contribute 45% of group's revenue in 2017E, up from 21% in 2015.
QD Haier has 3% volume share of major appliances in the US, while GE ranks No.2 in US
market with 17% volume share. The transaction would instantly give Haier substantial
presence in kitchenware, washer, and dishwasher in the US. QD Haier already has
multiple brands to target various countries globally (see Figure 165 below; GEA will
become an extended piece for its complete global mapping).
We see multiple near-term synergies in R&D, sourcing, and network expansion. On top of
organic growth for each individual business, management targets to achieve Rmb10 bn
revenue synergy (8% of 2016 revenue) in five years between the two brands via
leveraging each other's local channels to cross sell (e.g., selling Haier brand to the US and
GE brand to China). Management indicated that majority of the revenue synergy will come
from GE. GEA's financial statements were consolidated in June 2016. We expect it to
contribute 20%/30%/32% revenue in 2016/2017/2018E.
Figure 168: GE inclusion significantly expands the group's US market shares
Source: Company data, outline-world-map.com
Figure 169: GE is the 2nd
largest electronic brand in United States (volume wise)
Brand 2013 2014 2015 Rank
Whirlpool 26.3% 26.5% 26.3% 1
GE 16.8% 16.6% 16.7% 2
Sears 12.9% 12.1% 11.8% 3
Electrolux 8.0% 7.9% 8.0% 4
LG 6.3% 6.8% 7.0% 5
Samsung 6.4% 6.4% 6.6% 6
Broan-Nutone 3.7% 3.5% 3.4% 7
Sharp 3.0% 2.9% 2.9% 8
Haier 2.9% 3.0% 2.9% 9
Panasonic 2.0% 2.0% 2.0% 10
Source: Euromonitor

26 October 2016
China Home Appliance Sector 79
Financials – expect to contribute 25% earnings in 2017/18
QD Haier acquired GE home appliance business for US$55.8 bn with 40 years of
trademark usage. Transaction implies a 10.1x EV/EBITDA and 2.7x P/B. If we consider
US$1 bn tax shield amortised over 15 years, the multiples would become 8x EV/EBITDA
and 2.2x P/B. The transaction was financed by a five-year US$33 bn loan from Chinese
Development Bank at 3% interest rate, and the rest from internal cash. Based on our
estimate, GEA acquisition is earnings accretive after considering the additional interest
expenses. There is a one-off Rmb400-500 mn acquisition transaction fee booking into
2H16. We estimate GE will contribute ~25% earnings to the group in 2017/18.
GEA Business background
GE Appliances is a leading home appliance brand in the US with 90% revenue generated
from the US and 20% market share. Its main products include kitchenware and white
goods, and most products have a top three market share in the US.
The US home appliance market is a relatively mature market with a high penetration rate.
Consumption demand comes more from replacement and upgrade needs than new
purchase. Euromonitor forecasts a 3.4% market size CAGR in 2016E-20E.
Figure 170: GEA has top ranking in multiple categories in US
2014 Rank 2015 Rank
AC 12% 1 13% 1
Refrigerator 18% 2 18% 2
Washing machine 10% 4 10% 4
Large kitchenware 24% 1 24% 1
Dish washer 15% 2 16% 2
Microwave 22% 1 22% 1
Total home appliance 20% # 2
Source: Euromonitor
Figure 171: GEA mainly focuses on US market Figure 172: GEA Revenue breakdown
Source: Company data Source: Company data
US90%
Others10%
Kitchenware34%
Fridge29%
Washer19%
Dishwasher10%
Others8%

26 October 2016
China Home Appliance Sector 80
Figure 173: US home appliance market is mature
with a high penetration rate
Figure 174: US home appliance to see a 3.4%
CAGR from 2016E-20E
Source: Euromonitor Source: Euromonitors
Synergies between the two companies
Besides revenue/earnings contribution from GEA, we also see multiple near-term and
long-term synergies of GEA acquisition in the following aspects.
R&D/sourcing synergies GEA has four global research centers and over 1,000 patents.
Its technology in kitchenware (e.g., fast baking) and washing machines will strengthen
Haier's R&D capability. The two companies also share 40% product components, thus we
expect cost saving in raw material purchase. Management aims to achieve a total of Rmb1
bn sourcing cost savings via sourcing consolidation for three years, which is equivalent to
around 1.5% of its COGS in 2016E. The synergy will drive a slight GPM expansion going
forward.
Channel synergies GEA can leverage on QD Haier's strong sales network in China to
expand into China market. QD Haier has plans to introduce GEA as a high-end
kitchenware brand in 2017. On the flipside, GE has strong logistic resources in the US with
40% from contracts with property companies. QD Haier can also strengthen its presence
in US. Overall, management targets to achieve Rmb10 bn revenue synergy in five years.
Product complements GE has strong position in kitchenware, which can complete QD
Haier's product offerings.
Valuation
QD Haier trades at 10.7x 2017E P/E, largely at par with the industry and around its five-
year average trading multiple. Price catalysts would include stronger organic sales growth,
GEA inclusion as well as their synergies.
Our target price of Rmb12.30 is based on one standard deviation above industry average,
which is justified by its stronger earnings outlook, margin and ROE. At our TP, the stock
would be trading at 0.8x PEG, which suggest our valuation is not aggressive.
0
50
100
150
200
250
300
350
400
Smallappliance
Fridge Washer AC Microwave Dishwasher
USA China
%
0
10
20
30
40
50
60
70
80
2011
2012
2013
2014
2015
2016E
2017E
2018E
2019E
2020E
US$ bn
3.4% CAGR
4.7% CAGR

26 October 2016
China Home Appliance Sector 81
Risks
Major risks to our target price and rating include the following:
Slower-than-expected macro environment. Slower macro environment will
have negative impact on home appliance spending in general.
Raw material price volatility. Unexpected raw material price hike will cause
margin erosion.
worse-than expected property market. Slow property market growth will delay
refurbishment and reduce home appliance spending.
slower-than-expected integration of GEA. Slower-than-expected integration of
GEA could have negative impact on future revenue and profit.
Shareholding structure
Figure 175: QD Haier shareholding structure
Source: Company data, Credit Suisse
Air conditioner business
51.2%
Haier Group海尔集团
Small appliancebusiness
Equipmentbusiness
Haier Electronics海尔电器集团 有限公司
(1169.HK)
43.84%
Qingdao Haier
青岛海尔股份有限公司(600690.SS)
Others & public
49.3%
Refrigeratorbusiness
Washing machine business
Water heater business
Integrated channel services
Haier VC Consultant
Haier Electronics International
2.6% 20.6%17.6%
100% 100%
Acting in concert
KKR Home Investment
9.9%
Collectively owned
Qingdao State-Owned Assets Administration office

26 October 2016
China Home Appliance Sector 82
Asia Pacific/China Household Durables
Haier Electronics Group Co., Ltd. (1169.HK /
1169 HK) Rating NEUTRAL Price (24 Oct 16, HK$) 12.72 Target price (HK$) 13.40 Upside/downside (%) 5.3 Mkt cap (HK$/US$ mn) 35,528 / 4,580 Enterprise value (Rmb mn) 20,907 Number of shares (mn) 2,793 Free float (%) 43.8 52-wk price range (HK$) 15.74-11.00 ADTO-6M (US$ mn) 5.3 *Stock ratings are relative to the relevant country benchmark.
¹Target price is for 12 months.
Research Analysts
Raymond Ching
852 2101 7852
Carey Shi
852 2101 7729
Expect moderate growth but valuation
unattractive
■ We initiate coverage of Haier Electronic with a NEUTRAL rating and a
TP of HK$13.40. While we expect ICS revenue will likely to return positive in
2H on better retail sales, 2017 earnings are expected to see moderate growth
of ~10%, which is slower than other white goods companies. At 11x 2017E
P/E (1xPEG) and 2% yield, valuations do not appear attractive, in our view.
■ ICS revenue likely to turn positive in 2H. We expect ICS revenue to return
to growth in 2H16 (vs. -7% in 2015 and -9% in 1H16) driven by better retail
sales of Haier products and stronger logistics demand on more e-commerce
promotion events. In 2017, we expect ICS revenue to grow 7% on mid-single-
digit channel sales growth (offline+e-commerce) and ~10% logistic revenue
growth. We expect slight margin improvement from the logistics business
■ Moderate growth for washing machines and water heaters. We expect
washing machine and water heater sales to rise by mid- to high-single digits,
respectively, largely in line with 1H16. As these two categories are already in
a mature phase, we expect white good manufacturing to achieve mid- to
high-single digit growth going forward, slightly faster than the industry’s.
■ Valuation not attractive enough. Haier Electronics is trading at 11x 2017E
P/E, slightly higher than white goods sector. As the ICS segment is only
expected to achieve mid- to single-digit growth in 2017 and the logistics
contribution to operating profit is too small at 7-8%, we believe it is hard to
justify a large premium over white good sector. Our TP of HK$13.40 is
referenced to segment average 11xP/E. Risks include raw material volatility,
worse-than–expected industry growth, increased price competition.
Share price performance
The price relative chart measures performance against the
MSCI CHINA F IDX which closed at 6,532.39 on 24/10/16.
On 24/10/16 the spot exchange rate was HK$7.76/US$1
Performance 1M 3M 12M Absolute (%) -2.8 -0.5 -19.1 Relative (%) -1.3 -10.4 -19.2
Financial and valuation metrics
Year 12/15A 12/16E 12/17E 12/18E Revenue (Rmb mn) 62,826.1 61,672.1 65,400.1 69,236.0 EBITDA (Rmb mn) 3,398.8 3,370.8 3,732.7 4,126.3 EBIT (Rmb mn) 3,139.5 3,129.9 3,477.3 3,855.9 Net profit (Rmb mn) 2,703.0 2,630.1 2,902.4 3,199.2 EPS (CS adj.) (Rmb) 0.97 0.93 1.03 1.13 Change from previous EPS (%) n.a. - - - Consensus EPS (Rmb) n.a. 0.98 1.07 1.18 EPS growth (%) 8.2 (3.8) 10.2 10.1 P/E (x) 11.4 11.9 10.8 9.8 Dividend yield (%) 0.9 0.9 1.0 1.1 EV/EBITDA (x) 6.5 6.1 5.2 4.3 P/B (x) 2.07 1.80 1.56 1.37 ROE (%) 20.7 16.5 15.7 15.1 Net debt/equity (%) Net Cash Net Cash Net Cash Net Cash
Source: Company data, Thomson Reuters, Credit Suisse estimates

26 October 2016
China Home Appliance Sector 83
Haier Electronics Group Co., Ltd. (1169.HK / 1169 HK)
Price (24 Oct 2016): HK$12.72; Rating: NEUTRAL; Target Price: HK$13.40; Analyst: Raymond Ching
Income Statement (Rmb mn) 12/15A 12/16E 12/17E 12/18E
Sales revenue 62,826 61,672 65,400 69,236 Cost of goods sold 52,833 51,366 54,455 57,636 EBITDA 3,399 3,371 3,733 4,126 EBIT 3,140 3,130 3,477 3,856 Net interest expense/(inc.) (193) (225) (225) (225) Recurring PBT 3,344 3,355 3,702 4,081 Profit after tax 2,734 2,684 2,962 3,265 Reported net profit 2,703 2,630 2,902 3,199 Net profit (Credit Suisse) 2,703 2,630 2,902 3,199
Balance Sheet (Rmb mn) 12/15A 12/16E 12/17E 12/18E
Cash & cash equivalents 10,244 11,552 12,930 14,523 Current receivables 4,971 5,167 5,405 5,787 Inventories 4,399 4,044 4,311 4,690 Other current assets 3,673 3,530 3,597 3,795 Current assets 23,288 24,293 26,242 28,795 Property, plant & equip. 3,322 4,203 5,136 6,124 Investments 1,611 1,611 1,611 1,611 Intangibles 531 527 523 518 Other non-current assets 1,545 1,665 1,792 1,926 Total assets 30,297 32,299 35,304 38,974 Current liabilities 13,002 12,588 12,924 13,654 Total liabilities 14,575 14,165 14,510 15,248 Shareholders' equity 14,788 17,146 19,747 22,614 Minority interests 879 933 992 1,057 Total liabilities & equity 30,297 32,299 35,304 38,974
Cash Flow (Rmb mn) 12/15A 12/16E 12/17E 12/18E
EBIT 3,140 3,130 3,477 3,856 Net interest 0 0 0 0 Tax paid (582) (741) (817) (901) Working capital (295) (128) (249) (244) Other cash & non-cash items 267 545 536 552 Operating cash flow 2,530 2,807 2,947 3,263 Capex (1,306) (1,167) (1,234) (1,303) Free cash flow to the firm 1,224 1,639 1,713 1,959 Investing cash flow (2,373) (1,162) (1,229) (1,298) Equity raised 1 1 0 0 Dividends paid (253) (273) (302) (332) Financing cash flow (402) (337) (340) (371) Total cash flow (245) 1,308 1,377 1,593 Adjustments 26 0 0 0 Net change in cash (219) 1,308 1,377 1,593
Per share 12/15A 12/16E 12/17E 12/18E
Shares (wtd avg.) (mn) 2,841 2,852 2,852 2,852 EPS (Credit Suisse) (Rmb) 0.97 0.93 1.03 1.13 DPS (Rmb) 0.10 0.10 0.11 0.12 Operating CFPS (Rmb) 0.89 0.98 1.03 1.14
Earnings 12/15A 12/16E 12/17E 12/18E
Growth (%) Sales revenue (6.4) (1.8) 6.0 5.9 EBIT 4.4 (0.3) 11.1 10.9 EPS 8.2 (3.8) 10.2 10.1 Margins (%) EBITDA 5.4 5.5 5.7 6.0 EBIT 5.0 5.1 5.3 5.6
Valuation (x) 12/15A 12/16E 12/17E 12/18E
P/E 11.4 11.9 10.8 9.8 P/B 2.07 1.80 1.56 1.37 Dividend yield (%) 0.9 0.9 1.0 1.1 EV/sales 0.4 0.3 0.3 0.3 EV/EBITDA 6.5 6.1 5.2 4.3 EV/EBIT 7.0 6.6 5.5 4.6
ROE analysis (%) 12/15A 12/16E 12/17E 12/18E
ROE 20.7 16.5 15.7 15.1 ROIC 53.0 34.6 33.0 31.7
Credit ratios 12/15A 12/16E 12/17E 12/18E
Net debt/equity (%) (57.4) (57.1) (56.4) (56.2) Net debt/EBITDA (x) (2.66) (3.07) (3.14) (3.23)
Company Background
Haier Electronics Group is a home appliances manufacturer covering washing machines, water heaters, and integrated channel services. It is a subsidiary of Qingdao Haier (600690.SS)
Blue/Grey Sky Scenario
Our Blue Sky Scenario (HK$) 17.50
TP upside – RMB17.5 – Our upside scenario assumes 2017 EPS to be 5% higher than our base case driven by stronger ICS performance and margin expansion. Our TP is based on +1 standard deviation above its historical 5 year average.
Our Grey Sky Scenario (HK$) 10.00
TP downside – RMB10 – Our downside scenario assumes 2017 EPS to be 5% lower than our base case on worse than expected ICS performance and weaker white good manufacturing sales. Our TP is based on -1 standard deviation below its historical 5 year average.
Share price performance
The price relative chart measures performance against the MSCI CHINA F IDX
which closed at 6,532.39 on 24-Oct-2016
On 24-Oct-2016 the spot exchange rate was HK$7.76/US$1
Source: Company data, Thomson Reuters, Credit Suisse estimates

26 October 2016
China Home Appliance Sector 84
Focus chart and tables
Figure 176: ICS contributes 72% for Haier
Electronics' revenue
Figure 177: We expect ICS revenue to grow 7% in 2017
on better channel sales growth and logistics growth
Source: company data Source: Company data, Credit Suisse estimates
Figure 178: We estimate moderate growth for water
heaters and washing machines
Figure 179: Haier Electronics has the No.2 market
share in water heaters (value)
Source: Company data, Credit Suisse estimates Source: CMM
Figure 180: We see slight margin improvements due
to better ICS business
Figure 181: The company is trading at par with the
white goods sector
Source: Company data, Credit Suisse estimates Source: Bloomberg, Credit Suisse estimates
Washing machines
22%
Water heaters6%
ICS72%
-20%
-10%
0%
10%
20%
30%
40%
50%
60%
0
20,000
40,000
60,000
80,000
2011 2012 2013 2014 2015E 2016E 2017E 2018E
ICS revenue YoY
(Rmbmn)
-10%
-8%
-6%
-4%
-2%
0%
2%
4%
6%
8%
0
1,000
2,000
3,000
4,000
5,000
6,000
2013 2014 2015E 2016E 2017E 2018E
Washing machines Water heater revenue WM YoY WH YoY
RMB mnHaier15%
Midea13%
AO Smith26%Vanward
7%
Macro7%
Whirpool2%
Vatti3%
Rinnai7%
Noritz4%
Others16%
0%
2%
4%
6%
8%
10%
12%
14%
16%
18%
2013 2014 2015E 2016E 2017E 2018E
GPM OPM NPM
5.0
7.0
9.0
11.0
13.0
15.0
17.0
19.0
21.0
23.0
Jan11
Apr11
Jul11
Oct11
Jan12
Apr12
Jul12
Oct12
Jan13
Apr13
Jul13
Oct13
Jan14
Apr14
Jul14
Oct14
Jan15
Apr15
Jul15
Oct15
Jan16
Apr16
Jul16
Oct16
Mean+2 std
Mean+1 std
Mean
Mean-1 std
Mean-2 std
Mean 13.4Std 3.6

26 October 2016
China Home Appliance Sector 85
Valuation
Our TP of HK$13.40 is referenced to its five-year historical trading average 13xP/E.
Haier Electronics is trading at 12x 2017E P/E, slightly higher than white goods sector. As
the ICS segment is only expected to achieve mid- to single-digit growth in 2017 and the
logistics contribution to operating profit is too small at 7-8%, we believe it is hard to justify
a large premium over white good sector.
Risks
Major risks to our target price and rating include the following:
Slower-than-expected macro environment Slower macro environment will have
negative impact on home appliance spending in general
Raw material price volatility unexpected raw material price hike will cause
margin erosion
worse-than expected property market slow property market growth will delay
refurbishment and reduce home appliance spending
Shareholding structure
Figure 182: Shareholding structure
Source: Company data, Credit Suisse research
Haier Group
JP Morgan
Integrated Channel Services Business
Washing Machine Business
5%43.8%
Haier Electronics Group Co., Ltd.(1169.HK)
40.8%
51%
Water Heater Business
Distribution LogisticsAfter-sales
serviceE-commerce
Other public shareholders
Qingdao Haier (600690.SH)

26 October 2016
China Home Appliance Sector 86
Asia Pacific/China Household Durables
Hangzhou Robam Appliances Co Ltd
(002508.SZ / 002508 CH) Rating OUTPERFORM Price (24 Oct 16, Rmb) 38.93 Target price (Rmb) 50.30 Upside/downside (%) 29.2 Mkt cap (Rmb/US$ mn) 28,421 / 4,196 Enterprise value (Rmb mn) 25,855 Number of shares (mn) 730.06 Free float (%) 97.2 52-wk price range (Rmb) 41.27-25.00 ADTO-6M (US$ mn) 26.4 *Stock ratings are relative to the relevant country benchmark.
¹Target price is for 12 months.
Research Analysts
Carey Shi
852 2101 7729
Raymond Ching
852 2101 7852
Market share taker in a fast growing industry
■ We initiate coverage on Hangzhou Robam with an OUTPERFORM rating
and TP of Rmb 50.30. Robam is our top pick in the kitchenware sector. We
like the company for its strong CAGR outlook of 28% for 2016-18E and
undemanding valuation. We believe that both its strong sales growth and
high margin are sustainable in the coming few years.
■ Market share taker in a fast-growing segment. Robam reported a 32%
CAGR from 2011-15. Despite this high base, we believe a 21% revenue
CAGR is achievable on: (1) ~9% market growth; (2) share gains as
consumers trade up; (3) channel expansion in high/low tier cities; and (4)
rising contribution from new categories. Robam only has 10%/7% volume
shares in range hoods and gas stoves, substantially lower than the 30-40%
shares for white goods leaders. We see ample potential for share gains.
■ Sustainable margin on strong branding and trade up. Robam's industry
high margin is attributed to its premium pricing and scale effect. We expect
the high margin to sustain, backed by: (1) obvious market trades-up for better
quality and stylishness; (2) its top industry branding; and (3) the highest
investment in marketing and branding. We see mild margin expansion on
rising e-commerce contribution and operating leverage.
■ Valuation and risks. Robam trades at 19x 2017E P/E, on par with the
industry. With its dominant market shares, best industry operating matrix and
robust earnings outlook, we see room for a multiple re-rating. Our TP of
Rmb50.30 is based on 24x 2017E P/E, one standard deviation above the
kitchenware sector, which is justified by its best-of-breed performance.
Risks: Weak property cycle, macro weakness and intensifying market
competition.
Share price performance
The price relative chart measures performance against the
Shanghai Shenzhen CSI300 index which closed at
3,327.80 on 24/10/16. On 24/10/16 the spot exchange rate
was Rmb6.77/US$1
Performance 1M 3M 12M Absolute (%) -0.2 -2.7 49.3 Relative (%) -1.8 -4.5 56.2
Financial and valuation metrics
Year 12/15A 12/16E 12/17E 12/18E Revenue (Rmb mn) 4,496.2 5,831.4 7,180.9 8,659.6 EBITDA (Rmb mn) 949.0 1,360.7 1,772.6 2,233.5 EBIT (Rmb mn) 902.9 1,300.9 1,698.9 2,144.6 Net profit (Rmb mn) 830.5 1,177.8 1,531.6 1,936.3 EPS (CS adj.) (Rmb) 1.15 1.61 2.10 2.65 Change from previous EPS (%) n.a. - - - Consensus EPS (Rmb) n.a. 1.57 2.02 2.55 EPS growth (%) 44.6 39.9 30.0 26.4 P/E (x) 33.8 24.1 18.6 14.7 Dividend yield (%) 1.5 1.5 1.9 2.4 EV/EBITDA (x) 27.5 19.0 14.1 10.8 P/B (x) 8.92 7.07 5.54 4.36 ROE (%) 29.4 32.6 33.2 33.0 Net debt/equity (%) Net Cash Net Cash Net Cash Net Cash
Source: Company data, Thomson Reuters, Credit Suisse estimates
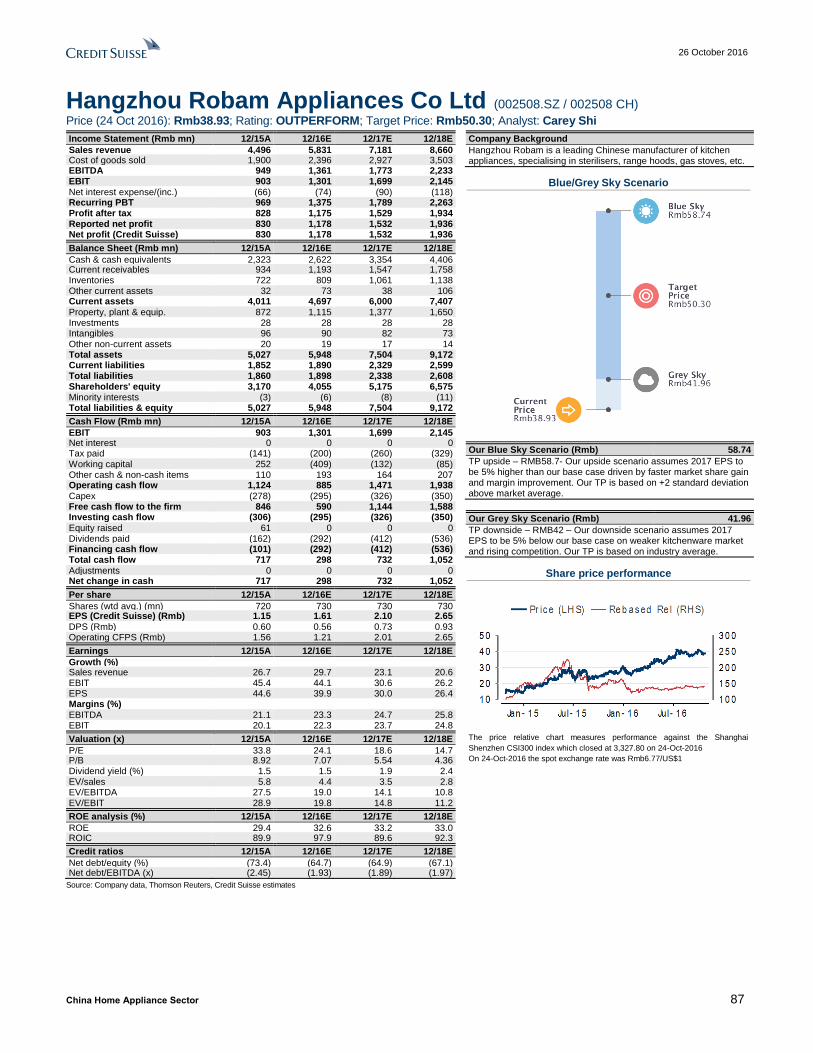
26 October 2016
China Home Appliance Sector 87
Hangzhou Robam Appliances Co Ltd (002508.SZ / 002508 CH)
Price (24 Oct 2016): Rmb38.93; Rating: OUTPERFORM; Target Price: Rmb50.30; Analyst: Carey Shi
Income Statement (Rmb mn) 12/15A 12/16E 12/17E 12/18E
Sales revenue 4,496 5,831 7,181 8,660 Cost of goods sold 1,900 2,396 2,927 3,503 EBITDA 949 1,361 1,773 2,233 EBIT 903 1,301 1,699 2,145 Net interest expense/(inc.) (66) (74) (90) (118) Recurring PBT 969 1,375 1,789 2,263 Profit after tax 828 1,175 1,529 1,934 Reported net profit 830 1,178 1,532 1,936 Net profit (Credit Suisse) 830 1,178 1,532 1,936
Balance Sheet (Rmb mn) 12/15A 12/16E 12/17E 12/18E
Cash & cash equivalents 2,323 2,622 3,354 4,406 Current receivables 934 1,193 1,547 1,758 Inventories 722 809 1,061 1,138 Other current assets 32 73 38 106 Current assets 4,011 4,697 6,000 7,407 Property, plant & equip. 872 1,115 1,377 1,650 Investments 28 28 28 28 Intangibles 96 90 82 73 Other non-current assets 20 19 17 14 Total assets 5,027 5,948 7,504 9,172 Current liabilities 1,852 1,890 2,329 2,599 Total liabilities 1,860 1,898 2,338 2,608 Shareholders' equity 3,170 4,055 5,175 6,575 Minority interests (3) (6) (8) (11) Total liabilities & equity 5,027 5,948 7,504 9,172
Cash Flow (Rmb mn) 12/15A 12/16E 12/17E 12/18E
EBIT 903 1,301 1,699 2,145 Net interest 0 0 0 0 Tax paid (141) (200) (260) (329) Working capital 252 (409) (132) (85) Other cash & non-cash items 110 193 164 207 Operating cash flow 1,124 885 1,471 1,938 Capex (278) (295) (326) (350) Free cash flow to the firm 846 590 1,144 1,588 Investing cash flow (306) (295) (326) (350) Equity raised 61 0 0 0 Dividends paid (162) (292) (412) (536) Financing cash flow (101) (292) (412) (536) Total cash flow 717 298 732 1,052 Adjustments 0 0 0 0 Net change in cash 717 298 732 1,052
Per share 12/15A 12/16E 12/17E 12/18E
Shares (wtd avg.) (mn) 720 730 730 730 EPS (Credit Suisse) (Rmb) 1.15 1.61 2.10 2.65 DPS (Rmb) 0.60 0.56 0.73 0.93 Operating CFPS (Rmb) 1.56 1.21 2.01 2.65
Earnings 12/15A 12/16E 12/17E 12/18E
Growth (%) Sales revenue 26.7 29.7 23.1 20.6 EBIT 45.4 44.1 30.6 26.2 EPS 44.6 39.9 30.0 26.4 Margins (%) EBITDA 21.1 23.3 24.7 25.8 EBIT 20.1 22.3 23.7 24.8
Valuation (x) 12/15A 12/16E 12/17E 12/18E
P/E 33.8 24.1 18.6 14.7 P/B 8.92 7.07 5.54 4.36 Dividend yield (%) 1.5 1.5 1.9 2.4 EV/sales 5.8 4.4 3.5 2.8 EV/EBITDA 27.5 19.0 14.1 10.8 EV/EBIT 28.9 19.8 14.8 11.2
ROE analysis (%) 12/15A 12/16E 12/17E 12/18E
ROE 29.4 32.6 33.2 33.0 ROIC 89.9 97.9 89.6 92.3
Credit ratios 12/15A 12/16E 12/17E 12/18E
Net debt/equity (%) (73.4) (64.7) (64.9) (67.1) Net debt/EBITDA (x) (2.45) (1.93) (1.89) (1.97)
Company Background
Hangzhou Robam is a leading Chinese manufacturer of kitchen appliances, specialising in sterilisers, range hoods, gas stoves, etc.
Blue/Grey Sky Scenario
Our Blue Sky Scenario (Rmb) 58.74
TP upside – RMB58.7- Our upside scenario assumes 2017 EPS to be 5% higher than our base case driven by faster market share gain and margin improvement. Our TP is based on +2 standard deviation above market average.
Our Grey Sky Scenario (Rmb) 41.96
TP downside – RMB42 – Our downside scenario assumes 2017 EPS to be 5% below our base case on weaker kitchenware market and rising competition. Our TP is based on industry average.
Share price performance
The price relative chart measures performance against the Shanghai
Shenzhen CSI300 index which closed at 3,327.80 on 24-Oct-2016
On 24-Oct-2016 the spot exchange rate was Rmb6.77/US$1
Source: Company data, Thomson Reuters, Credit Suisse estimates

26 October 2016
China Home Appliance Sector 88
Focus charts and tables
Figure 183: Robam has the largest built-in
kitchenware sales of public companies (2015) Figure 184: Robam’s revenue breakdown (1H16)
Source: Company data, Credit Suisse estimates Source: Company data
Figure 185: Robam lags white-good top players in
share of volume
Figure 186: We see further room for margin
improvement
Source: Company data, Credit Suisse estimates Source: Company data, Credit Suisse estimates
Figure 187: Robam has a high advertisement
spending ratio
Figure 188: Robam is trading at par with the industry
average
Source: Company data, Credit Suisse research Source: Bloomberg, Credit Suisse research
-
0.5
1.0
1.5
2.0
2.5
3.0
3.5
4.0
4.5
5.0
Robam Vanward vatti Macro Midea Meida
Rmb bn
Range hood58%
Gas stove28%
Disinfecting cabinet
7%
Small appliances and
others7%
710
3033
43
0
5
10
15
20
25
30
35
40
45
50
Robam in gasstove
Robam inrange hood
Haier in Fridge Haier in washer Gree in AC
%
52.5% 53.6% 54.4%56.5% 58.2% 59.3% 59.7% 60.0%
12.6% 14.1% 15.4%17.3%
19.9%22.1% 23.4% 24.5%
12.2% 13.7% 14.5% 16.0%18.3% 20.0% 21.1% 22.1%
0.0%
10.0%
20.0%
30.0%
40.0%
50.0%
60.0%
70.0%
2011 2012 2013 2014 2015 2016E 2017E 2018E
GPM OPM NPM
9%8%
8%
6%
4%
1% 1%
0%
1%
2%
3%
4%
5%
6%
7%
8%
9%
10%
Robam Supor Joyoung Vatti GuangdongTonze
Vanward Macro9.0
14.0
19.0
24.0
29.0
34.0
Jan11
Apr11
Jul11
Oct11
Jan12
Apr12
Jul12
Oct12
Jan13
Apr13
Jul13
Oct13
Jan14
Apr14
Jul14
Oct14
Jan15
Apr15
Jul15
Oct15
Jan16
Apr16
Jul16
Oct16
Mean+2 std
Mean+1 std
Mean
Mean-1 std
Mean-2 std
Mean 16.2Std 3.3

26 October 2016
China Home Appliance Sector 89
Market share taker in a fast growing market
We initiate coverage on Robam with an OUTPERFORM rating and TP of Rmb50.30,
implying 29% potential upside. Robam is our top pick in the kitchenware sector given its
robust earnings growth outlook and undemanding valuation, trading at the industry’s
average valuation yet with the highest market shares, industry-best margins and ROE, and
most promising earnings outlook.
Robam is the leader in built-in kitchenware segment. The company is the market leader in
range hoods (17.4% volume, 25% value), gas stoves (15.4% volume and 22.6% value)
and sterilisers (11.6% volume, 21% value) in urban areas, according to CMM.
We forecast a 28% earnings CAGR over 2016-18E driven by a 22% sales CAGR which is
much faster than the estimated 9% industry-average CAGR. We are aware of investors'
concerns about the sustainability of its high growth and margins. Based on our research
and industry checks, we believe both are sustainable in the next few years.
Expecting market share gains to continue
Robam reported 30% sales CAGR in 2011-1H16 and we expect this strong sales growth
will continue driven by: (1) 9% industry growth; (2) market share gains, as consumers
trade up to better brands for high quality; (3) deeper channel penetration in both high- and
low-tier cities; and (4) robust growth for the new imbedded built-in kitchenware category
including ovens and steamers. The kitchenware segment is still relatively fragmented, as
the market leader, Robam, only has 10/7% volume market shares in range hoods and gas
stoves in China. This compares with 30-40% volume market shares for the market leader
in the white goods category, suggesting room for market consolidation. In addition,
Robam's distributors’ interests are well aligned with those of the company, with the group
announcing a distributor stock plan in August. This drives incentives higher for distributors
to support the company’s growth.
Sustainable margin driven by strong branding and industry trading up
Robam's margins are much higher than those of other large and small appliance
companies in the kitchenware industry. We believe that the high margin is attributed to its
price premium, economies of scale and operating leverage. In our view, the high margin is
sustainable on the back of: (1) an obvious trade-up for large built-in kitchenware products
for their quality and product appearance; (2) its top industry branding; and (3) its highest
investment in marketing and brand building. We expect OPM to expand to 25% in 2018E
from 22% in 2016E, mainly driven by GPM improvement on rising e-Commerce
contribution and operating leverage.
Valuation appears undemanding with its industry best matrices
Robam now trades at 19x 2017E P/E, on par with the industry. We see room for a multiple
re-rating driven by the company’s dominant market shares and best-industry operating
matrix e.g. (2016E: Robam NPM: 20%, industry: 14%; Robam ROE: 28%, industry:19%)
and strongest earnings CAGR for 2016-18 (Robam: 28%, industry: 23%). Considering its
28% earnings CAGR for 2016-18, Robam is trading only at 0.7x PEG compared to the
industry’s 1x PEG.
Our target price of Rmb50.30 is based on 24x 2017E P/E, one standard deviation above
the kitchenware sector P/E and is justified by its best-of-breed performance.

26 October 2016
China Home Appliance Sector 90
Expect market share gain to continue
We expect Robam to maintain a 22% sales CAGR in 2016-18E, a slowdown from the 32%
CAGR from 2011-15 given the higher base, but still faster than industry growth as well as
most listed consumer electronic companies.
In our view, this strong growth is expected to be driven by: (1) 9% industry growth; (2)
market share gains as consumer trade up; (3) deepening network penetration in both high-
and lower-tier cities; and (4) robust growth for the new built-in kitchenware category, such
as oven and steamers, which now comprises 3% of group sales.
Kitchenware is still in a growth phase, room for rising
To recap from the previous industry session, the kitchenware segment is still in a growth
phase, with a much lower penetration rate in both rural and urban areas. We expect the
industry to grow at 9% CAGR from 2016-18, faster than the 3-6% growth for the mature
white goods segment.
Figure 189: The kitchenware segment has the
highest forecast CAGR
Figure 190: The kitchenware segment has lower
penetration than for white goods
Source: CMM, IOL, Credit Suisse estimates Note: we use 2014 data for range hood and 2015 data for others due to unavailability of data Source: NBS, Credit Suisse estimate
Market share has room to grow
We see an obvious consumer trade-up to high-end brands in range hoods and gas stoves
(together accounting for 86% of Robam's revenue) in China with industry ASP having
increased 20-30% since 2012. Robam as a leader in the high-end segment has also
witnessed robust market share gains in the past few years.
Consumers have shown growing interest in range hoods, with higher suction power for
range hoods and gas stoves with rapid and powerful heating. In addition, consumers have
more requirements for the product appearance of built-in kitchen appliances as open
kitchens are more common. We expect this consumer trade-up will continue, as high-end
brands including Robam offer higher functionality and quality, and more importantly are
more stylish.
Compared to the mature white goods segment, the market for range hoods and gas
stoves is still fragmented. Even the No.1 player Robam only has around 10%/7% volume
shares in the range hood and gas stove segments, significantly below the market leaders’
30-40% shares in the white goods segment. We see large market share gain potential for
Robam.
9%
6%
5%
4%
3% 3%
1%
0%
1%
2%
3%
4%
5%
6%
7%
8%
9%
10%
Kitctenware Life smallappliances
AC Bathroomelectricalappliance
Fridge Washer TV
0
20
40
60
80
100
120
140
Range hood Color TV Refrigerator AirConditioner
WashingMachine
Urban Rural

26 October 2016
China Home Appliance Sector 91
Figure 191: Robam lags white-good top players in
share of volume Figure 192: Robam is gaining market share (volume)
Note: CMM only measure less than 15% of off-line POS, so we use IOL here to compare shipment numbers Source: Company data, IOL, Credit Suisse estimates
Source: CMM
Diversified channels continue to expand
Robam has diversified sales channels, including KA, exclusive stores, B2B, TV shopping
and e-commerce. Offline growth will be mainly driven by expansion to lower-tier cities, in
our view.
At present, Robam covers only 65% of tier-three cities, but close to 100% for first and
second tier ones. Robam will target to reach 80% of tier-three cities by opening up more
exclusive stores in low-tier cities. In order to maintain its high-end brand image, Robam
offers the same set of products across China. The firm only targets affluent consumers in
both urban and rural areas.
The firm has been steadily increasing its exclusive stores over the years. Management
targets to open another 400-500 stores in 2016 and we expect more stores to be open in
the next few years.
Figure 193: Channel sales breakdown (value)
Figure 194: Channel expansion by opening
exclusive stores
Source: Company data, Credit Suisse research Source: Company data, Credit Suisse estimates
710
3033
43
0
5
10
15
20
25
30
35
40
45
50
Robam in gasstove
Robam inrange hood
Haier in Fridge Haier in washer Gree in AC
%
10%
11%
13%
15%16%
17%
0%
2%
4%
6%
8%
10%
12%
14%
16%
18%
20%
2013 7M2016
sterilizer gas stove range hood
KA27%
specialty stores28%
e-Commerce30%
TV shopping3%
B2B6%
local supermarket
6%
2,000
2,450
3,000
0
500
1,000
1,500
2,000
2,500
3,000
3,500
2014 2015 2016E

26 October 2016
China Home Appliance Sector 92
Distributors' interests are well aligned
Robam’s headquarters directly manages 82 distributors and sub-distributors (also known
as city companies). Robam used to expand distribution by setting up more first-tier
distributors (from 62 distributors in 2014 to 82 in 2016), but this year the company aims to
maintain distributor numbers and encourage them to open up more city companies
instead.
City companies are usually in tier 3/4 cities. Distributors are encouraged to award city
company managements with shareholdings. In this way, distributors are able to rapidly
expand channel coverage while city company managers receive substantial incentives.
Robam announced a distributor stock plan in August 2015, which is worth 1.5% of
Robam's total share.
Figure 195: Robam's distribution channel
Source: Company data, Credit Suisse estimates
Newly rising built-in kitchenware
Ovens and steamers contribute a small percentage of Robam’s sales. These categories
are growing fast given low penetration rates and a low base. Oven penetration is only
0.2%, compared to 1.5%/3%/9%/15.2% for Taiwan/Japan/Korea/Hong Kong. In 2015,
ovens’ and steamers’ aggregated sales were less than 0.1 mn units, significantly lagging
the 2mn units each for range hoods and gas stoves.
Robam normally bundles other built-in kitchenware with range hoods and gas stoves. If we
assume every one customer in 20 will purchase a bundled set instead of a single product
range hood/gas stove, oven and steamer sales would double.
82 distributorsE-Commerce B2B
Robam
Local channel/exclusive
storesCity companies

26 October 2016
China Home Appliance Sector 93
Figure 196: Oven penetration in China significantly lags developed areas
Source: Euromonitor
Figure 197: Gas stoves and range hoods comprise
74% of built-in kitchenware (2015)
Figure 198: High-end brands Robam and Fotile lead
the range hood market (7M16)
Source: CMM, Credit Suisse estimates Source: CMM
Figure 199: High-end brands Robam and Fotile lead
the gas stove market (7M16) Figure 200: Robam gaining market share (volume)
Source: CMM Source: CMM
0.2
1.5
3.0
9.0
15.2
0
2
4
6
8
10
12
14
16
China Taiwan Japan Korea Hong Kong
%
dishwasher1%
microwave10%
gas stove28%
range hood46%
sterilizer9%
oven6%
Robam25%
Fotile23%
Midea10%
Vatti9%
Vanward3%Macro
3%Siemens
5%Sacon3%
Others19%
Robam23%
Fotile22%
Midea7%
Vatti12%
Vanward4%
Macro3%
Siemens5%
Others24%
10%
11%
13%
15%16%
17%
0%
2%
4%
6%
8%
10%
12%
14%
16%
18%
20%
2013 7M2016
sterilizer gas stove range hood

26 October 2016
China Home Appliance Sector 94
Sustainable margin on strong branding and industry
trade-up
Robam's margin is much higher than other large and small appliance companies in the kitchenware industry. The group's high margin is attributed to its premium pricing, economies of scale and operating leverage on its large revenue scale.
Figure 201: Robam's OPM is expected to reach 25%
in 2018E
Figure 202: Robam has outstanding OPM supported
by a high GPM (2015)
Source: Company data, Credit Suisse estimates Source: Company data, Credit Suisse estimates
In our view, Robam's high margin is sustainable on 1) an obvious trade up at imbedded kitchenware products for better quality and product appearance, 2) its top industry brandings and 3) its highest investment in marketing and brand building. We expect OPM to expand to 25% in 2018E from 22% in 2016E mainly driven by GPM expansion on rising e-commerce contribution and operating leverage.
Premium brand benefits from consumer trade-up
We see an obvious trading up in the kitchenware segment. ASPs rose 22%36%23% for
gas stoves/range hoods/sterilisers from 2012-1H16. Consumers were upgrading their
kitchen equipment (European-style hoods, large suction power range hoods, and rapid
and powerful heating for gas stoves). High-end brands, such as Robam and Fotile, should
benefit most in this context.
52.5% 53.6% 54.4%56.5% 58.2% 59.6% 59.8% 60.1%
12.6% 14.1% 15.4%17.3%
19.9%21.9% 23.5% 25.0%
12.2% 13.7% 14.5% 16.0%18.3% 20.0% 21.1% 22.2%
0.0%
10.0%
20.0%
30.0%
40.0%
50.0%
60.0%
70.0%
2011 2012 2013 2014 2015 2016E 2017E 2018E
GPM OPM NPM
0.00%
5.00%
10.00%
15.00%
20.00%
25.00%
HangzhouRobam
Supor Joyoung Vanward Vatti Macro

26 October 2016
China Home Appliance Sector 95
Figure 203: Industry ASPs have been rising steadily
Figure 204: Robam has more than a 40% price
premium over the industry average (1H16)
Source: CMM Source: CMM
Strong brand recognition
Built-in range hoods and gas stoves are large ticket items and are normally used for 8 -10
years. Therefore, consumers are less price sensitive and willing to pay a brand premium
for better quality. Robam has the one of the strongest brand images in the kitchenware
segment. We believe that its outstanding branding justifies its price premium and will
support ongoing high margins.
We analysed the Baidu index and "Asian top 500 brands" rankings, which both
demonstrate Robam's high brand mindshare and influence. The Baidu index measures
the number of times a word was searched. We found that "Robam range hood" has the
highest daily search queries among competitors from 2012-15.
Another measure is "Asian top 500 brands" which rank the most influential brands by
World Brand Lab. Robam is the only Chinese kitchenware brand that was selected in the
top 500 for the past 10 years. In 2015 and 2016, Robam, ranked 265 and 262, the highest
among Chinese kitchenware brands.
Figure 205: Robam range hood has the highest daily search queries at Baidu
index
2011 2012 2013 2014 2015
Robam 218 265 495 420 440
Fotile 188 218 239 360 420
Vatti 153 186 233 197 277
Vanward 128 143 149 157 231
Sacon 214 171 219 260 345
Macro 109 177 142 124 195
Canbo 31 107 153 147 216
Chinadee 172 208 199 162 382
Haotaitai 124 146 247 151 166
Source: Baidu index
-
500
1,000
1,500
2,000
2,500
3,000
2012 2013 2014 2015 6M2016
Gas stove Range hood Sterilizer
Rmb152
142138
101 100 98
81
71 6862
0
20
40
60
80
100
120
140
160
Fotie Robam Siemens Foreign industry Vatti Midea Haier Macro Vanward
price index

26 October 2016
China Home Appliance Sector 96
Figure 206: Robam has a strong brand influence
2015 2016
Ranking Ranking
Haier 30 18
Midea 122 47
Changhong 50 67
Gree 109 72
Robam 265 262
Fotile NA 364
Source: World Brand Lab
Stylish product with better appearance
Besides branding and functionality, product appearance is important with regard to large
built-in kitchenware products. Open kitchens are increasingly common in China; therefore,
range hoods and gas stoves are also part of home furnishings.
Based on end consumer feedback, part of the reason for buying the market leaders,
Robam and Fotile, is due to its stylishness. We believe Robam's stylish product
appearance should help the brand justify its price premium as well as market share gains.
Figure 207: Robam products have stylish appearance
Source: Robam website
Highest investment in marketing and brand building
Robam spent around 8-9% of sales in marketing or Rmb390mn in 2015, which is the
highest in the imbedded built-in kitchenware segment. With its large revenue scale and
high GPM, Robam is able to significantly outspend its competitors to maintain its strong
branding and justify its price premium.
Range hood Gas stove Sterilizer

26 October 2016
China Home Appliance Sector 97
Figure 208: Robam has a high advertisement
spending ratio (2015)
Figure 209: Robam has the highest A&P expense
among built-in kitchenware companies (2015)
Note: Joyoung's A&P expense include gift fees. Supor's A&P expense include channel and after-sale expense Source: Company data
Source: Company data, Credit Suisse estimates
Market leaders normally price at a premium for consumer appliances
There is usually a 15-35% price premium for No.1 players in other home appliance sectors
given their top branding and mid- to high-end brand positioning. As Robam focuses on the
high-end segment, with strong branding, better quality, better product appearance and
heavy investment in marketing, we see its price premium is justified.
Figure 210: Top brands have a price premium over industry average
AC Washer Refrigerator Range hood
Domestic average price (Rmb) 3,577 2,750 1,940 2,853
No.1 volume share brand price (Rmb) 4,100 3,647 2,393 4,064
Market share 34% 27% 27.50% 25%
Price premium 15% 33% 23% 42%
Source: Company data, Credit Suisse estimates
E-commerce contributes to high margin
Besides the above, a rising e-commerce contribution is also a key driver for margin
expansion as well as sustainability. Robam directly operates its e-commerce business
which leads to higher margins. Most kitchenware leaders (Robam, Fotile, Vatti and
Vanward) choose to self-operate their e-commerce platforms.
E-commerce now contributes around 30% of Robam's revenue, one of the highest among
peers and 15% above the industry average. Over the past few years, Robam's online
business share has expanded to 30% in 2016 from 10% in 2012. The company expects its
e-commerce share to rise 1% every year from 2017-19 until the number reaches 33%,
which implies 0.2% margin upside annually.
For the built-in kitchenware segment, online products are priced at a 20% discount to off-
line products as they target different customers. Despite the lower ASP, the online channel
earns a 15-20% higher GPM than the traditional off-line channel due to a smaller
distribution layer. We estimate a 70% GPM for Robam’s online business versus 55% for
its offline business. Thus, a rising e-commerce sales contribution should also boost GPM.
9%8%
8%
6%
4%
1% 1%
0%
1%
2%
3%
4%
5%
6%
7%
8%
9%
10%
Robam Supor Joyoung Vatti GuangdongTonze
Vanward Macro
392 364
222
4818
902
563
0
100
200
300
400
500
600
700
800
900
1,000
Robam Vanward Vatti Macro GuangdongTonze
Supor Joyoung
Rmb mn
Imbedded kitchenware small kitchenware

26 October 2016
China Home Appliance Sector 98
Figure 211: Robam's online/offline scenario
(price) Cost Ex. factory price Retail price GPM
Online 18 64 80 72%
Offline 18 40 100 55%
Source: Company data, Credit Suisse research
Figure 212: Robam has the highest online business
share (2015) Figure 213: e-Commerce share growth
––Source: Company data, Credit Suisse estimates Source: Company data, Credit Suisse estimates
Figure 214: Imbedded kitchenware has the highest channel mark up
TV <20%
White goods 20%-30%
Small appliances 30%-50%
Imbedded kitchenware >60%
Source: Company data, Credit Suisse estimates
Valuation appears inexpensive with its industry best
matrices
Robam now trades at 19x 2017E P/E, at par to the industry. We see room for multiple re-
rating driven by its dominant market shares and best industry operating matrix e.g.
(2016E: Robam NPM: 20%, industry: 14%, Robam ROE: 29%, industry:19%) and
strongest earnings CAGR in 2016-18 ( Robam : 28%, industry: 23%). Considering its 28%
earnings CAGR in 2016-18, Robam is trading only at 0.7 PEG compared to industry at 1
PEG.
Our TP of Rmb50.30 is based on 24x 2017E P/E, which is equivalent to one standard
deviation above kitchenware sector P/E, which is justified in our view by its best of breed
performance.
0%
5%
10%
15%
20%
25%
30%
35%
Robam Vatti Vanward Industry0%
5%
10%
15%
20%
25%
30%
35%
40%
2012 2013 2014 2015 2016E 2017E 2018E
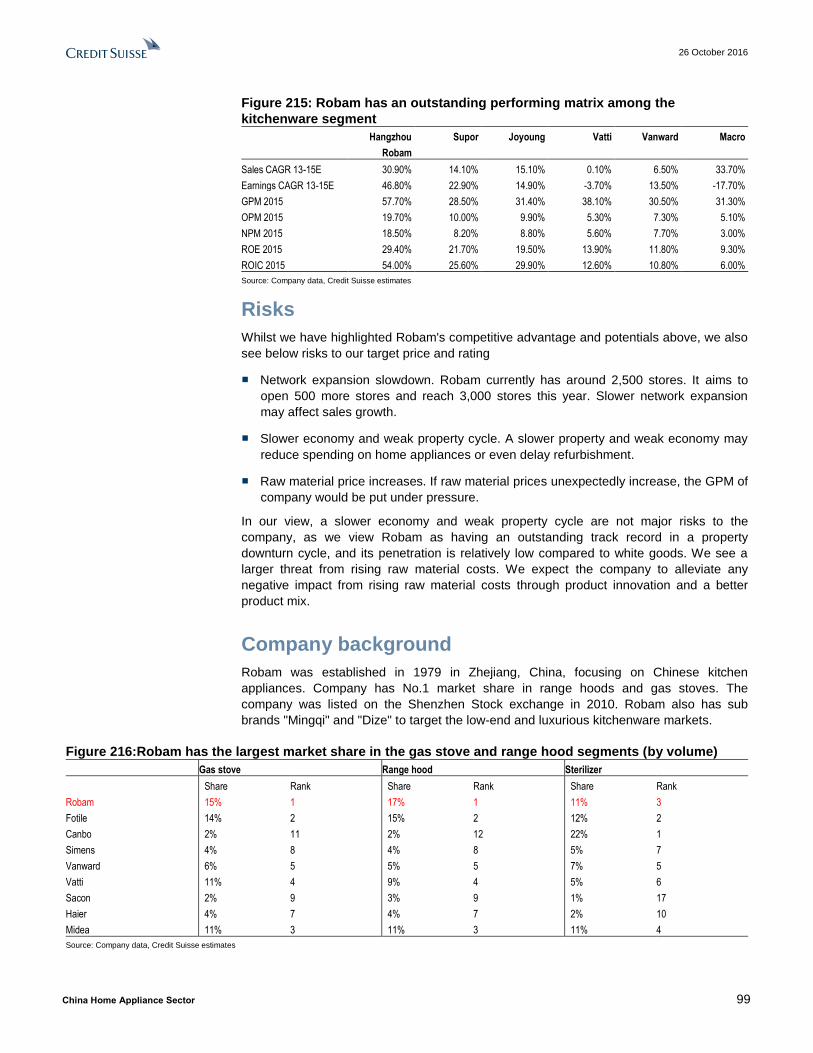
26 October 2016
China Home Appliance Sector 99
Figure 215: Robam has an outstanding performing matrix among the
kitchenware segment
Hangzhou
Robam
Supor Joyoung Vatti Vanward Macro
Sales CAGR 13-15E 30.90% 14.10% 15.10% 0.10% 6.50% 33.70%
Earnings CAGR 13-15E 46.80% 22.90% 14.90% -3.70% 13.50% -17.70%
GPM 2015 57.70% 28.50% 31.40% 38.10% 30.50% 31.30%
OPM 2015 19.70% 10.00% 9.90% 5.30% 7.30% 5.10%
NPM 2015 18.50% 8.20% 8.80% 5.60% 7.70% 3.00%
ROE 2015 29.40% 21.70% 19.50% 13.90% 11.80% 9.30%
ROIC 2015 54.00% 25.60% 29.90% 12.60% 10.80% 6.00%
Source: Company data, Credit Suisse estimates
Risks
Whilst we have highlighted Robam's competitive advantage and potentials above, we also
see below risks to our target price and rating
■ Network expansion slowdown. Robam currently has around 2,500 stores. It aims to
open 500 more stores and reach 3,000 stores this year. Slower network expansion
may affect sales growth.
■ Slower economy and weak property cycle. A slower property and weak economy may
reduce spending on home appliances or even delay refurbishment.
■ Raw material price increases. If raw material prices unexpectedly increase, the GPM of
company would be put under pressure.
In our view, a slower economy and weak property cycle are not major risks to the
company, as we view Robam as having an outstanding track record in a property
downturn cycle, and its penetration is relatively low compared to white goods. We see a
larger threat from rising raw material costs. We expect the company to alleviate any
negative impact from rising raw material costs through product innovation and a better
product mix.
Company background
Robam was established in 1979 in Zhejiang, China, focusing on Chinese kitchen
appliances. Company has No.1 market share in range hoods and gas stoves. The
company was listed on the Shenzhen Stock exchange in 2010. Robam also has sub
brands "Mingqi" and "Dize" to target the low-end and luxurious kitchenware markets.
Figure 216:Robam has the largest market share in the gas stove and range hood segments (by volume)
Gas stove Range hood Sterilizer
Share Rank Share Rank Share Rank
Robam 15% 1 17% 1 11% 3
Fotile 14% 2 15% 2 12% 2
Canbo 2% 11 2% 12 22% 1
Simens 4% 8 4% 8 5% 7
Vanward 6% 5 5% 5 7% 5
Vatti 11% 4 9% 4 5% 6
Sacon 2% 9 3% 9 1% 17
Haier 4% 7 4% 7 2% 10
Midea 11% 3 11% 3 11% 4
Source: Company data, Credit Suisse estimates

26 October 2016
China Home Appliance Sector 100
Management
Ren Jianhua (age 60), Chairman. Mr. Ren has over 38 years of working experience. He
worked as sales department head and manager of Yu Hang Hong Xing Hardware Factory
(Robam's predecessor). Mr. Ren is also a Hangzhou's People's Congress member.
Ren Fujia (age 33), Vice-Chairman and general manager. Mr. Ren’s previous roles
include the group's marking department manager, deputy manager of the R&D centre and
deputy general manager of the group, etc. Mr. Ren holds a bachelor degree.
Zhao Jihong (age 54), a board director of the company. Prior to this, Mr. Zhao held
various senior management positions in the listed company and related entities. Mr. Zhao
holds a master’s degree.
Ren Luozhong (age 54), a board director of the company. Prior to this position, Mr. Ren
held various senior management positions in the listed company and related entities. Mr.
Ren holds an EMBA degree.
Wang Gang (age 41), board director, deputy general manager, board secretary and
director of investment. Prior to joining Robam, Mr. Wang held various senior positions in
other listed/private companies. Mr. Wang is a CFA and holds a master degree.
Shen Guoliang (age 51), board director. Mr. Shen was Robam Group's director, CFO,
deputy general manager and head of transportation department of Yu Hang Hong Xing
Hardware Factory. Mr. Shen has over 34 years of working experience.
Shareholding structure
Figure 217: Shareholding structure
Note: As of 30 Jun 2016 Source: Company data, Credit Suisse research,
Robam Appliances老板电器
(002508.SZ)
Ms. Shen Guoying (Chairman’s spouse)
Public
46.86%
75.00%
Disinfection cabinet
Robam GroupJinchuang Investment
Other kitchenware
Mr. Ren Jianhua(Chairman)
69.19%
49.86% 0.69% 1.11% 1.48%
Range hoods Gas stove

26 October 2016
China Home Appliance Sector 101
Asia Pacific/China Household Durables
Joyoung Co Ltd (002242.SZ / 002242 CH) Rating NEUTRAL [V] Price (24 Oct 16, Rmb) 19.81 Target price (Rmb) 21.50 Upside/downside (%) 8.5 Mkt cap (Rmb/US$ mn) 15,206 / 2,245 Enterprise value (Rmb mn) 14,103 Number of shares (mn) 767.58 Free float (%) 51.8 52-wk price range (Rmb) 26.50-14.91 ADTO-6M (US$ mn) 20.8 *Stock ratings are relative to the relevant country benchmark.
¹Target price is for 12 months.
[V] = Stock Considered Volatile (see Disclosure Appendix)
Research Analysts
Carey Shi
852 2101 7729
Raymond Ching
852 2101 7852
In the middle of category transitioning
■ We initiate coverage on Joyoung with a NEUTRAL rating and TP of
Rmb21.50. Joyoung is a leading small kitchen-appliance brand in China. In
our view, the company is in the middle of a category transition phase which
should cap its earnings growth and reduce visibility in the next two years. We
expect 11% earnings growth from 2016-18, slower than industry peers’.
Valuation and earnings outlook are not attractive, in our view.
■ Product category transitioning. We expect strong sales momentum for its
Western small appliance and nutritious pot category (IH rice cookers) (~45%
sales) driven by a low penetration rate and rising requirements for food
quality. However, weak soymilk machine and induction cooker (40% of sales)
sales, which are in an industry declining phase, would drag on overall
revenue growth in 2017/18E.
■ Stable margin outlook. We expect core OPM to be largely stable in
2017/18. We expect the GPM to see marginal erosion due to the lower sales
mix of higher margin soymilk machines (10% above average). On the positive
side, the negative effect will be offset by a lower A&P ratio by allocating more
advertising to the social media channel and adding more offline experience
stores, while reducing the expensive TV channel.
■ Valuation is rich, but dividend yield is high. Joyoung trades at 20x P/E,
largely in line with the kitchenware industry. Although its 11% earnings CAGR
is slower than the industry’s, it makes one of the highest ROE/NPM and
dividend yields of 4%, which in our view justifies it trading on par with the
industry’s P/E. Our TP of Rmb21.50 is based on 21.5x 2017E P/E, which is in
line with industry peers’. Risks: (1) raw material price hikes; (2) a sharp
decline in mature product sales; and (3) quality issues.
Share price performance
The price relative chart measures performance against the
Shanghai Shenzhen CSI300 index which closed at
3,327.80 on 24/10/16. On 24/10/16 the spot exchange rate
was Rmb6.77/US$1
Performance 1M 3M 12M Absolute (%) 0.7 -2.8 -21.8 Relative (%) -0.9 -4.6 -15.0
Financial and valuation metrics
Year 12/15A 12/16E 12/17E 12/18E Revenue (Rmb mn) 7,060.1 7,732.7 8,715.1 9,751.2 EBITDA (Rmb mn) 864.8 971.0 1,074.2 1,177.4 EBIT (Rmb mn) 781.9 878.2 969.6 1,060.3 Net profit (Rmb mn) 620.0 693.2 776.8 861.9 EPS (CS adj.) (Rmb) 0.81 0.90 1.01 1.12 Change from previous EPS (%) n.a. - - - Consensus EPS (Rmb) n.a. 0.92 1.05 1.20 EPS growth (%) 16.6 11.8 12.1 10.9 P/E (x) 24.5 21.9 19.6 17.6 Dividend yield (%) 3.5 2.7 3.1 3.4 EV/EBITDA (x) 16.3 14.5 12.9 11.5 P/B (x) 4.64 4.43 4.01 3.63 ROE (%) 19.5 20.7 21.5 21.6 Net debt/equity (%) Net Cash Net Cash Net Cash Net Cash
Source: Company data, Thomson Reuters, Credit Suisse estimates

26 October 2016
China Home Appliance Sector 102
Joyoung Co Ltd (002242.SZ / 002242 CH)
Price (24 Oct 2016): Rmb19.81; Rating: NEUTRAL; Target Price: Rmb21.50; Analyst: Carey Shi
Income Statement (Rmb mn) 12/15A 12/16E 12/17E 12/18E
Sales revenue 7,060 7,733 8,715 9,751 Cost of goods sold 4,855 5,262 5,964 6,731 EBITDA 865 971 1,074 1,177 EBIT 782 878 970 1,060 Net interest expense/(inc.) (9) (14) (15) (19) Recurring PBT 791 892 985 1,079 Profit after tax 671 748 832 917 Reported net profit 620 693 777 862 Net profit (Credit Suisse) 620 693 777 862
Balance Sheet (Rmb mn) 12/15A 12/16E 12/17E 12/18E
Cash & cash equivalents 1,148 1,092 1,330 1,657 Current receivables 1,650 1,826 2,058 2,302 Inventories 538 551 624 704 Other current assets 1,041 1,045 1,046 1,049 Current assets 4,377 4,513 5,057 5,713 Property, plant & equip. 697 728 763 802 Investments 574 574 574 462 Intangibles 160 148 134 118 Other non-current assets 82 80 78 189 Total assets 5,891 6,043 6,607 7,284 Current liabilities 2,508 2,450 2,597 2,823 Total liabilities 2,532 2,474 2,621 2,847 Shareholders' equity 3,275 3,431 3,792 4,188 Minority interests 83 138 194 249 Total liabilities & equity 5,891 6,043 6,607 7,284
Cash Flow (Rmb mn) 12/15A 12/16E 12/17E 12/18E
EBIT 782 878 970 1,060 Net interest 0 0 0 0 Tax paid (120) (143) (152) (162) Working capital 166 (250) (159) (102) Other cash & non-cash items 33 75 84 96 Operating cash flow 861 560 742 893 Capex (71) (108) (122) (137) Free cash flow to the firm 790 452 620 756 Investing cash flow (855) (79) (88) (99) Equity raised 6 0 0 0 Dividends paid (547) (537) (416) (466) Financing cash flow (233) (537) (416) (466) Total cash flow (227) (56) 237 327 Adjustments 0 0 0 0 Net change in cash (227) (56) 237 327
Per share 12/15A 12/16E 12/17E 12/18E
Shares (wtd avg.) (mn) 768 768 768 768 EPS (Credit Suisse) (Rmb) 0.81 0.90 1.01 1.12 DPS (Rmb) 0.70 0.54 0.61 0.67 Operating CFPS (Rmb) 1.12 0.73 0.97 1.16
Earnings 12/15A 12/16E 12/17E 12/18E
Growth (%) Sales revenue 18.8 9.5 12.7 11.9 EBIT 5.6 12.3 10.4 9.4 EPS 16.6 11.8 12.1 10.9 Margins (%) EBITDA 12.2 12.6 12.3 12.1 EBIT 11.1 11.4 11.1 10.9
Valuation (x) 12/15A 12/16E 12/17E 12/18E
P/E 24.5 21.9 19.6 17.6 P/B 4.64 4.43 4.01 3.63 Dividend yield (%) 3.5 2.7 3.1 3.4 EV/sales 2.0 1.8 1.6 1.4 EV/EBITDA 16.3 14.5 12.9 11.5 EV/EBIT 18.0 16.1 14.3 12.8
ROE analysis (%) 12/15A 12/16E 12/17E 12/18E
ROE 19.5 20.7 21.5 21.6 ROIC 31.6 31.4 31.9 33.2
Credit ratios 12/15A 12/16E 12/17E 12/18E
Net debt/equity (%) (34.2) (30.6) (33.4) (37.3) Net debt/EBITDA (x) (1.33) (1.12) (1.24) (1.41)
Company Background
Joyoung Co., Ltd is a China-based company principally engaged in the research, development, production and distribution of soymilk makers and small kitchen appliances.
Blue/Grey Sky Scenario
Our Blue Sky Scenario (Rmb) 25.50
TP upside – RMB25.5 – Our upside scenario assumes 2017 EPS to be 5% higher than our base case on stronger rice cooker and western appliance sales. Our TP is based on +1 standard deviation above market average.
Our Grey Sky Scenario (Rmb) 14.50
TP downside- RMB14.5 – Our downside scenario assumes 2017 EPS to be 5% below our base case on weaker sales and larger than expected drop in soybean machine sales. Our TP is based on -1 standard deviation to market average.
Share price performance
The price relative chart measures performance against the Shanghai
Shenzhen CSI300 index which closed at 3,327.80 on 24-Oct-2016
On 24-Oct-2016 the spot exchange rate was Rmb6.77/US$1
Source: Company data, Thomson Reuters, Credit Suisse estimates

26 October 2016
China Home Appliance Sector 103
Focus charts and Tables
Figure 218: Joyoung’s revenue breakdown (2015)
Figure 219: IH rice cookers are becoming more
popular
Source: CMM Source: Company data
Figure 220: Joyoung’s IH rice cooker sales volume
tripled in 2015
Figure 221: Joyoung is the second-largest rice
cooker brand (2015)
Source: CMM Source: CMM, Credit Suisse estimates
Figure 222: Soymilk makers’ slow growth has
negative impact on gross margin
Figure 223: Joyoung is trading at one standard
deviation above the historical average
Source: Company data, Credit Suisse research Source: Bloomberg, Credit Suisse estimates
Food processor
50%
Nutritious pot 28%
Western small appliance
8%
Induction cooker11%
7%
13%
21%
33%
0%
5%
10%
15%
20%
25%
30%
35%
2014 2015sales volume sales value
0.3
0.9
0.0
0.1
0.2
0.3
0.4
0.5
0.6
0.7
0.8
0.9
1.0
2014 2015
mn units
Midea41%
Joyoung27%
Supor14%
Others18%
70%
40%38%
32%
0%
10%
20%
30%
40%
50%
60%
70%
80%
2008 2015
soymilk machine % GPM
0.0
5.0
10.0
15.0
20.0
25.0
30.0
35.0
40.0
45.0
Jan
11
Ap
r11
Jul1
1
Oct1
1
Jan
12
Ap
r12
Jul1
2
Oct1
2
Jan
13
Ap
r13
Jul1
3
Oct1
3
Jan
14
Ap
r14
Jul1
4
Oct1
4
Jan
15
Ap
r15
Jul1
5
Oct1
5
Jan
16
Ap
r16
Jul1
6
Oct1
6
Mean+2 std
Mean+1 std
Mean
Mean-1 std
Mean-2 std
Mean 14.5Std 5.1

26 October 2016
China Home Appliance Sector 104
Product category transitioning
We expect strong sales momentum for its western small appliance and nutritious pot
category (IH rice cooker) (~45% sales) driven by low penetration rate and rising
requirement for food quality. Joyoung is transitioning from a soybean machine producer to
multi-category brand, including built-in kitchenware, small kitchenware, and water heater.
Rice cooker will be the next highlight for the company. Currently Joyoung is the No.2 rice
cooker brand in China with 10% revenue generated from that category. We see a major
upgrade trend for IH rice cookers from non-IH ones. IH rice cookers volume share and
value share increased 6%/10% respectively in 2015. Joyoung's "Tiefu" IH rice cooker has
tripled sales in 2015 and company recently launched a RMB900mn private placement plan
for IH rice cooker capex. We expect a 21%/30% CAGR for nutritious pot and western
small appliances segments in 2016-18, respectively.
However, soymilk machine and induction cooker (40% of sales) sales are in an industry
declining phase due to consumer preference change and longer replacement cycles. We
expect 4%/-2% sales CAGR for food processor and induction cooker categories in 2016-
18, respectively, which would drag weight on overall revenue growth in 2017/18E.
Figure 224: Joyoung has complete product offering
Source: Company website
soybean machine blender food processor electric kettle One Cup
rice cookerelectric pressure
cooker
Induction
cookernoodle maker
pastry
makerOven Air fry machine
pot water purifier range hood gas stove sterilizer wataer heater

26 October 2016
China Home Appliance Sector 105
Figure 225: We see IH rice cooker is becoming
more popular in China
Figure 226: Joyoung's "Tiefu" IH rice cooker has
tripled sales in 2015
Source: CMM Source: Company data
Stable margin outlook
Overall OPM should be stable in 2017/18. Soymilk machine has 10% more GPM than
other products due to Joyoung's dominant market share and strong pricing power. Soymilk
machine's share dropped from around 80% in 2008 to around 30% now. As share of
soymilk machine decreased, we see slight margin erosion.
Positively, management will spend more resources on social media and off-line
experiencing stores for promotion than traditional off-line retail stores. Therefore, we see
lower A&P ratio going forward. We expect A&P ratio dropped from 8% in 2015 to 7.5% in
2018E.
Figure 227: Soymilk maker (included in food
processor ) has around 10% margin premium than
other products (1H16)
Figure 228: Margin has been negatively affected by
soymilk machine share decrease
Source: Company data Source: Company data, Credit Suisse estimates
Valuation
Our TP of Rmb21.50 is based on 21.5x 2017E P/E, which is in line with industry peers.
Joyoung now is trading at 20x P/E, largely in line with the kitchenware industry.
Although its 11% earnings CAGR is slower than the industry’s, it makes one of the
highest ROE/NPM and dividend yields of 4%, which in our view justifies it trading on
par with the industry’s P/E.
6.7%
12.6%
21.1%
32.6%
0%
5%
10%
15%
20%
25%
30%
35%
2014 2015sales volume sales value
0.3
0.9
0.0
0.1
0.2
0.3
0.4
0.5
0.6
0.7
0.8
0.9
1.0
2014 2015
mn units
38%
30%29% 28%
25%
0%
5%
10%
15%
20%
25%
30%
35%
40%
Foodprocessor
Western smallappliance
Nutritious pot Inductioncooker
Otherappliance
35.4% 35.0% 34.4%32.6% 31.9% 32.5% 32.2% 31.6%
13.0% 12.5% 12.7% 12.5%11.1% 11.4% 11.1% 10.9%
9.6% 9.2% 8.8% 8.9% 8.8% 9.0% 8.9% 8.8%
0.0%
5.0%
10.0%
15.0%
20.0%
25.0%
30.0%
35.0%
40.0%
2011 2012 2013 2014 2015 2016E 2017E 2018E
GPM OPM NPM

26 October 2016
China Home Appliance Sector 106
Risks
We see below risks to our rating and TP:
Intensifying competition. Although Joyoung has a strong position in the
kitchenware segment, it is not the no.1 player. If competitors decide to change
pricing strategy, Joyoung may have to follow, which could cause margin erosion.
Slower economy. A slower economy may reduce spending on home appliances
in general.
Raw material price increases. Unexpected raw material price increases could
have a negative impact on the company's margin. We believe Joyoung would
reduce such impact by improving its product mix and having greater product
differentiation.
Management
Wang Xuning (age 47), has been the company's chairman and general manager since
the company’s establishment. Mr. Wang holds an MBA degree from CEIBS.
Huang Shuling (age 52),has been the company's vice-chairman since the company’s
establishment. Ms. Huang is also the chairman of Shandong Joyoung Development, and
executive director and general manager of Shanghai Li Hong. Ms. Huang holds an MBA
degree from CKGSB.
Jiang Guangyong (age 46), a board director of the company. Before this, Mr. Jiang was
the board secretary. Mr. Jiang also holds various senior management positions in
Joyoung's related entities. Mr. Jiang holds an MBA degree from CKGSB.
Yang Ningning (age 37), a board director and deputy general manager of the company.
She was in charge of the group's financials before. Ms. Yang is a CFA and holds a BS
from Shandong Economics University.
Jiao Shuge (age 50), a board director. Mr. Jiao is also a director of CDH Investment
Management (Hong Kong ) Ltd. Mr. Jiao holds an MS degree from the Ministry of
Aerospace Industry Second Research Institute.
Shareholding structure
Figure 229: Shareholding structure
Note: As of 06/30/2016 Source: Company data, Credit Suisse estimates
Joyoung 九阳股份
(002242.SZ)
BILTING Development Public
37.79%
75.43%
Shanghai Lihong New Technology Investment上海力鸿新技术投资有限公司
Founders – Wang Xuning, Zhu Hongtao, Huang Shuling & Zhu Zechun
(王旭宁、朱宏韬、黄淑玲、朱泽春四人创业团队)
46.04% 16.17%

26 October 2016
China Home Appliance Sector 107
Companies Mentioned (Price as of 24-Oct-2016) Conair (CNGA.PK, $0.35) Gree Electric Appliances Inc of Zhuhai (000651.SZ, Rmb22.55, OUTPERFORM, TP Rmb28.0) Haier Electronics Group Co., Ltd. (1169.HK, HK$12.72, NEUTRAL, TP HK$13.4) Hangzhou Robam Appliances Co Ltd (002508.SZ, Rmb38.93, OUTPERFORM, TP Rmb50.3) Joyoung Co Ltd (002242.SZ, Rmb19.81, NEUTRAL[V], TP Rmb21.5) LG Corp (003550.KS, W62,700) Macro (000533.SZ, Rmb11.87) Midea Group Co Ltd (000333.SZ, Rmb26.66, OUTPERFORM, TP Rmb34.5) Panasonic (6752.T, ¥1,079) Philips (PHG.AS, €27.32) Procter & Gamble Co. (PG.N, $84.1) Qingdao Haier Co., Ltd. (600690.SS, Rmb10.29, OUTPERFORM, TP Rmb12.3) Stanley Black & Decker, Inc. (SWK.N, $119.52) Supor (002032.SZ, Rmb36.89) Vanward (002543.SZ, Rmb17.75) Vatti (002035.SZ, Rmb24.9)
Disclosure Appendix
Important Global Disclosures I, Raymond Ching, certify that (1) the views expressed in this report accurately reflect my personal views about all of the subject companies and securities and (2) no part of my compensation was, is or will be directly or indirectly related to the specific recommendations or views expressed in this report.
3-Year Price and Rating History for Gree Electric Appliances Inc of Zhuhai (000651.SZ)
000651.SZ Closing Price Target Price
Date (Rmb) (Rmb) Rating
23-Oct-14 13.78 19.50 O
24-Oct-14 13.67 *
31-Oct-14 14.20 20.75 O
12-Jan-15 21.10 29.00
30-Apr-15 28.50 33.00
31-Aug-15 18.45 26.20
27-Oct-15 17.58 23.00
02-Nov-15 17.64 24.00
30-Aug-16 19.22 NC
* Asterisk signifies initiation or assumption of coverage.
Effective July 3, 2016, NC denotes termination of coverage.
O U T PERFO RM
N O T CO V ERED
3-Year Price and Rating History for Haier Electronics Group Co., Ltd. (1169.HK)
1169.HK Closing Price Target Price
Date (HK$) (HK$) Rating
21-Jan-14 24.05 30.00 O *
14-Jul-14 21.85 27.60
27-Aug-14 21.50 26.80
28-Aug-14 21.95 25.50
26-Aug-15 15.14 20.00
12-Jan-16 12.88 19.00
23-Mar-16 12.70 18.50
30-Aug-16 13.14 NC
* Asterisk signifies initiation or assumption of coverage.
Effective July 3, 2016, NC denotes termination of coverage.
O U T PERFO RM
N O T CO V ERED
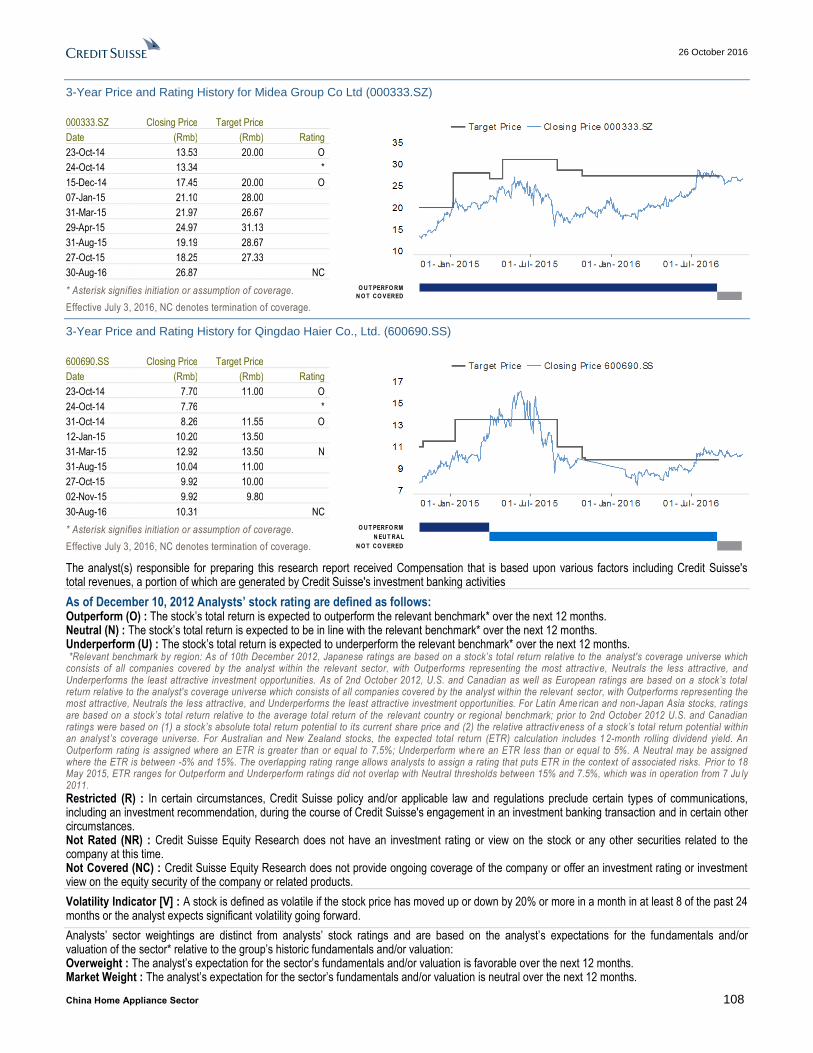
26 October 2016
China Home Appliance Sector 108
3-Year Price and Rating History for Midea Group Co Ltd (000333.SZ)
000333.SZ Closing Price Target Price
Date (Rmb) (Rmb) Rating
23-Oct-14 13.53 20.00 O
24-Oct-14 13.34 *
15-Dec-14 17.45 20.00 O
07-Jan-15 21.10 28.00
31-Mar-15 21.97 26.67
29-Apr-15 24.97 31.13
31-Aug-15 19.19 28.67
27-Oct-15 18.25 27.33
30-Aug-16 26.87 NC
* Asterisk signifies initiation or assumption of coverage.
Effective July 3, 2016, NC denotes termination of coverage.
O U T PERFO RM
N O T CO V ERED
3-Year Price and Rating History for Qingdao Haier Co., Ltd. (600690.SS)
600690.SS Closing Price Target Price
Date (Rmb) (Rmb) Rating
23-Oct-14 7.70 11.00 O
24-Oct-14 7.76 *
31-Oct-14 8.26 11.55 O
12-Jan-15 10.20 13.50
31-Mar-15 12.92 13.50 N
31-Aug-15 10.04 11.00
27-Oct-15 9.92 10.00
02-Nov-15 9.92 9.80
30-Aug-16 10.31 NC
* Asterisk signifies initiation or assumption of coverage.
Effective July 3, 2016, NC denotes termination of coverage.
O U T PERFO RM
N EU T RA L
N O T CO V ERED
The analyst(s) responsible for preparing this research report received Compensation that is based upon various factors including Credit Suisse's total revenues, a portion of which are generated by Credit Suisse's investment banking activities
As of December 10, 2012 Analysts’ stock rating are defined as follows: Outperform (O) : The stock’s total return is expected to outperform the relevant benchmark* over the next 12 months. Neutral (N) : The stock’s total return is expected to be in line with the relevant benchmark* over the next 12 months. Underperform (U) : The stock’s total return is expected to underperform the relevant benchmark* over the next 12 months. *Relevant benchmark by region: As of 10th December 2012, Japanese ratings are based on a stock’s total return relative to the analyst's coverage universe which consists of all companies covered by the analyst within the relevant sector, with Outperforms representing the most attractive, Neutrals the less attractive, and Underperforms the least attractive investment opportunities. As of 2nd October 2012, U.S. and Canadian as well as European ratings are based on a stock’s total return relative to the analyst's coverage universe which consists of all companies covered by the analyst within the relevant sector, with Outperforms representing the most attractive, Neutrals the less attractive, and Underperforms the least attractive investment opportunities. For Latin Ame rican and non-Japan Asia stocks, ratings are based on a stock’s total return relative to the average total return of the relevant country or regional benchmark; prior to 2nd October 2012 U.S. and Canadian ratings were based on (1) a stock’s absolute total return potential to its current share price and (2) the relative attractiv eness of a stock’s total return potential with in an analyst’s coverage universe. For Australian and New Zealand stocks, the expected total return (ETR) calculation includes 1 2-month rolling dividend yield. An Outperform rating is assigned where an ETR is greater than or equal to 7.5%; Underperform whe re an ETR less than or equal to 5%. A Neutral may be assigned where the ETR is between -5% and 15%. The overlapping rating range allows analysts to assign a rating that puts ETR in the context of associated risks. Prior to 18 May 2015, ETR ranges for Outperform and Underperform ratings did not overlap with Neutral thresholds between 15% and 7.5%, which was in operation from 7 Ju ly 2011. Restricted (R) : In certain circumstances, Credit Suisse policy and/or applicable law and regulations preclude certain types of communications, including an investment recommendation, during the course of Credit Suisse's engagement in an investment banking transaction and in certain other circumstances. Not Rated (NR) : Credit Suisse Equity Research does not have an investment rating or view on the stock or any other securities related to the company at this time. Not Covered (NC) : Credit Suisse Equity Research does not provide ongoing coverage of the company or offer an investment rating or investment view on the equity security of the company or related products.
Volatility Indicator [V] : A stock is defined as volatile if the stock price has moved up or down by 20% or more in a month in at least 8 of the past 24 months or the analyst expects significant volatility going forward.
Analysts’ sector weightings are distinct from analysts’ stock ratings and are based on the analyst’s expectations for the fundamentals and/or valuation of the sector* relative to the group’s historic fundamentals and/or valuation: Overweight : The analyst’s expectation for the sector’s fundamentals and/or valuation is favorable over the next 12 months. Market Weight : The analyst’s expectation for the sector’s fundamentals and/or valuation is neutral over the next 12 months.

26 October 2016
China Home Appliance Sector 109
Underweight : The analyst’s expectation for the sector’s fundamentals and/or valuation is cautious over the next 12 months. *An analyst’s coverage sector consists of all companies covered by the analyst within the relevant sector. An analyst may cover multiple sectors.
Credit Suisse's distribution of stock ratings (and banking clients) is:
Global Ratings Distribution
Rating Versus universe (%) Of which banking clients (%) Outperform/Buy* 55% (54% banking clients) Neutral/Hold* 30% (24% banking clients) Underperform/Sell* 15% (40% banking clients) Restricted 0% *For purposes of the NYSE and NASD ratings distribution disclosure requirements, our stock ratings of Outperform, Neutral, an d Underperform most closely correspond to Buy, Hold, and Sell, respectively; however, the meanings are not the same, as our stock ratings are determined on a relative basis. (Please refer to definitions above.) An investor's decision to buy or sell a security should be based on investment objectives, current holdin gs, and other individual factors.
Credit Suisse’s policy is to update research reports as it deems appropriate, based on developments with the subject company, the sector or the market that may have a material impact on the research views or opinions stated herein. Credit Suisse's policy is only to publish investment research that is impartial, independent, clear, fair and not misleading. For more detail please refer to Credit Suisse's Policies for Managing Conflicts of Interest in connection with Investment Research: http://www.csfb.com/research-and-analytics/disclaimer/managing_conflicts_disclaimer.html Credit Suisse does not provide any tax advice. Any statement herein regarding any US federal tax is not intended or written to be used, and cannot be used, by any taxpayer for the purposes of avoiding any penalties.
Target Price and Rating Valuation Methodology and Risks: (12 months) for Gree Electric Appliances Inc of Zhuhai (000651.SZ)
Method: Our target price of RMB28 is based on a 10.5x 2017E P/E, which is in line with the white goods sector average. We believe Gree's outlook is promising with improved AC inventory and robust export sales. At our target price, Gree would be trading at 1x PEG or only 5x ex-cash 2017E P/E which suggests our valuation is not demanding, and hence we have an Outperform rating.
Risk: Risks to our RMB28.0 target price and Outperform rating for Gree Electric Appliance include 1) slower growth of white appliances in China, 2) over-reliance on a single sector and lack of diversification, 3) product quality and service issues, especially when the company increased its overseas exposure where policies and rules are more stringent, 4) intensified competition and price wars, and 5) the shareholding overhang.
Target Price and Rating Valuation Methodology and Risks: (12 months) for Haier Electronics Group Co., Ltd. (1169.HK)
Method: We give a NEUTRAL rating to Haier Electronics. Our TP of HK$13.40 is based on 11x P/E (price-to-earnings), which is referenced to industry average. Haier Electronics's earnings CAGR is slightly behind industry average, but the similar-to-industry multiple is justified by its unique integrated channel services (40% of the 2017 operating profit) which has a higher long term prospect than the traditional white good sector. We expect this segment to benefit from China's robust e-Commerce growth.
Risk: Upside risks to our HK$13.40 target price and NEUTRAL rating for Haier Electronics Group Co., Ltd. include better than expected washing machine growth. Downside risks include an economic and/or end market demand slowdown, regulatory policy changes, third-party brand sales growth, possible raw material and/or labor cost hikes, the failure of working capital controls, as well as corporate governance risks from connected party transactions.
Target Price and Rating Valuation Methodology and Risks: (12 months) for Hangzhou Robam Appliances Co Ltd (002508.SZ)
Method: We give a OUTPERFORM rating to Robam. Our target price of Rmb50.30 is based on 24x 2017E P/E (price-to-earnings), which is equivalent to one standard deviation above kitchenware sector P/E, which is justified in our view by its best of breed performance. Robam now trades at 19x 2017E P/E, at par to the industry. We see room for multiple re-rating driven by its dominant market shares and best industry operating matrix e.g. (2016E: Robam NPM: 20%, industry: 14%, Robam ROE: 29%, industry:19%) and strongest earnings CAGR in 2016-18 ( Robam : 28%, industry: 23%). Considering its 28% earnings CAGR in 2016-18, Robam is trading only at 0.7 PEG compared to industry at 1 PEG.
Risk: Risks to our Rmb50.30 target price and OUTPERFORM rating for Hangzhou Robam Appliances Co Ltd include 1) raw material hike, 2) sharp decline in matured product sales and 3) intensified competition from big Home appliance players and 4) weaker property cycle.
Target Price and Rating Valuation Methodology and Risks: (12 months) for Joyoung Co Ltd (002242.SZ)
Method: Our target price 21.50 is based on 21.5x 2017E P/E, which is largely in line with industry peers multiple. In our view, the company is in the middle of category transition phase which will likely to cap its earnings growth and reduce visibility in the next two years. We expect 11% earnings growth in 2016-18, slower than industry peers. Valuation is not cheap at 1.8x 2017 PEG, but its 4% dividend yield and one of the best margins and ROEs in the industry should provide good share price supports.

26 October 2016
China Home Appliance Sector 110
Risk: Risks to our TP 21.50 and NEUTRAL rating include: 1) intensifying competition 2) slower economy and 3) raw material price increases.
Target Price and Rating Valuation Methodology and Risks: (12 months) for Midea Group Co Ltd (000333.SZ)
Method: Our target price of RMB34.50 is based on a target 13x 2017E P/E, which is one standard deviation above the white good sector. The valuation premium is warranted by its stronger earnings outlook and above industry ROE and NPM. It also has multiple possible synergies from Toshiba and Kuka and the broadest product category. At our target price, the stock will be also trading at 0.8x PEG, which suggests our valuation is not demanding given the company's earnigns growth potential.
Risk: Risks to our Rmb34.50 target price and Outperform rating for Midea Group include 1) home appliance consumption trends change 2) adverse price competition and 3) volatile raw material price.
Target Price and Rating Valuation Methodology and Risks: (12 months) for Qingdao Haier Co., Ltd. (600690.SS)
Method: Our target price of Rmb12.30 for Qingdao Haier Co., Ltd. is based on a 2017E P/E (price-to-eanings) of 13x, which is one standard deviation above industry average, which we believe is justified by its stronger earnings outlook, margin and ROE. We have an Outperform rating as we see stronger organic sales growth driven by industry-wide AC inventory improvements, strong export sales owing to RMB depreciation, the inclusion of GEA as well as associated synergies as potential share price catalysts.
Risk: Risks to our Outperform rating and Rmb12.30 target price for Qingdao Haier Co., Ltd. include raw material price volatility, worse-than-expected industry growth, and price competition.
Please refer to the firm's disclosure website at https://rave.credit-suisse.com/disclosures for the definitions of abbreviations typically used in the target price method and risk sections.
See the Companies Mentioned section for full company names The subject company (000333.SZ, 600690.SS, 1169.HK, 003550.KS, 6752.T, PHG.AS, SWK.N) currently is, or was during the 12-month period preceding the date of distribution of this report, a client of Credit Suisse. Credit Suisse provided investment banking services to the subject company (003550.KS, SWK.N) within the past 12 months. Credit Suisse has received investment banking related compensation from the subject company (003550.KS, SWK.N) within the past 12 months Credit Suisse expects to receive or intends to seek investment banking related compensation from the subject company (002242.SZ, 000333.SZ, 600690.SS, 1169.HK, 003550.KS, 6752.T, PHG.AS, SWK.N) within the next 3 months. As of the date of this report, Credit Suisse makes a market in the following subject companies (6752.T, SWK.N). Credit Suisse beneficially holds >0.5% long position of the total issued share capital of the subject company (003550.KS).
For other important disclosures concerning companies featured in this report, including price charts, please visit the website at https://rave.credit-suisse.com/disclosures or call +1 (877) 291-2683. For date and time of production, dissemination and history of recommendation for the subject company(ies) featured in this report, disseminated within the past 12 months, please refer to the link: https://rave.credit-suisse.com/disclosures/view/report?i=265886&v=-5351uqjtwmd5nyfqowr8b9ilf .
Important Regional Disclosures Singapore recipients should contact Credit Suisse AG, Singapore Branch for any matters arising from this research report. The analyst(s) involved in the preparation of this report may participate in events hosted by the subject company, including site visits. Credit Suisse does not accept or permit analysts to accept payment or reimbursement for travel expenses associated with these events. Restrictions on certain Canadian securities are indicated by the following abbreviations: NVS--Non-Voting shares; RVS--Restricted Voting Shares; SVS--Subordinate Voting Shares. Individuals receiving this report from a Canadian investment dealer that is not affiliated with Credit Suisse should be advised that this report may not contain regulatory disclosures the non-affiliated Canadian investment dealer would be required to make if this were its own report. For Credit Suisse Securities (Canada), Inc.'s policies and procedures regarding the dissemination of equity research, please visit https://www.credit-suisse.com/sites/disclaimers-ib/en/canada-research-policy.html. The following disclosed European company/ies have estimates that comply with IFRS: (PHG.AS). As of the end of the preceding month, the subject company (SWK.N) beneficially owned 5% or more of the total issued share capital of Credit Suisse Group. Credit Suisse has acted as lead manager or syndicate member in a public offering of securities for the subject company (SWK.N) within the past 3 years. Principal is not guaranteed in the case of equities because equity prices are variable. Commission is the commission rate or the amount agreed with a customer when setting up an account or at any time after that. This research report is authored by: Credit Suisse (Hong Kong) Limited .............................................................................................................................. Raymond Ching ; Carey Shi To the extent this is a report authored in whole or in part by a non-U.S. analyst and is made available in the U.S., the following are important disclosures regarding any non-U.S. analyst contributors: The non-U.S. research analysts listed below (if any) are not registered/qualified as research analysts with FINRA. The non-U.S. research analysts listed below may not be associated persons of CSSU and therefore may not be subject to the NASD Rule 2711 and NYSE Rule 472 restrictions on communications with a subject company, public appearances and trading securities held by a research analyst account. Credit Suisse (Hong Kong) Limited .............................................................................................................................. Raymond Ching ; Carey Shi

26 October 2016
China Home Appliance Sector 111
Important Credit Suisse HOLT Disclosures With respect to the analysis in this report based on the Credit Suisse HOLT methodology, Credit Suisse certifies that (1) the views expressed in this report accurately reflect the Credit Suisse HOLT methodology and (2) no part of the Firm’s compensation was, is, or will be directly related to the specific views disclosed in this report. The Credit Suisse HOLT methodology does not assign ratings to a security. It is an analytical tool that involves use of a set of proprietary quantitative algorithms and warranted value calculations, collectively called the Credit Suisse HOLT valuation model, that are consistently applied to all the companies included in its database. Third-party data (including consensus earnings estimates) are systematically translated into a number of default algorithms available in the Credit Suisse HOLT valuation model. The source financial statement, pricing, and earnings data provided by outside data vendors are subject to quality control and may also be adjusted to more closely measure the underlying economics of firm performance. The adjustments provide consistency when analyzing a single company across time, or analyzing multiple companies across industries or national borders. The default scenario that is produced by the Credit Suisse HOLT valuation model establishes the baseline valuation for a security, and a user then may adjust the default variables to produce alternative scenarios, any of which could occur. Additional information about the Credit Suisse HOLT methodology is available on request. The Credit Suisse HOLT methodology does not assign a price target to a security. The default scenario that is produced by the Credit Suisse HOLT valuation model establishes a warranted price for a security, and as the third-party data are updated, the warranted price may also change. The default variable may also be adjusted to produce alternative warranted prices, any of which could occur. CFROI®, HOLT, HOLTfolio, ValueSearch, AggreGator, Signal Flag and “Powered by HOLT” are trademarks or service marks or registered trademarks or registered service marks of Credit Suisse or its affiliates in the United States and other countries. HOLT is a corporate performance and valuation advisory service of Credit Suisse.
For Credit Suisse disclosure information on other companies mentioned in this report, please visit the website at https://rave.credit-suisse.com/disclosures or call +1 (877) 291-2683.

26 October 2016
China Home Appliance Sector 112
This report is produced by subsidiaries and affiliates of Credit Suisse operating under its Global Markets Division. For more information on our structure, please use the following link: https://www.credit-suisse.com/who-we-are This report may contain material that is not directed to, or intended for distribution to or use by, any person or entity who is a citizen or resident of or located in any locality, state, country or other jurisdiction where such distribution, publication, availability or use would be contrary to law or regulation or which would subject Credit Suisse or its affiliates ("CS") to any registration or licensing requirement within such jurisdiction. All material presented in this report, unless specifically indicated otherwise, is under copyright to CS. None of the material, nor its content, nor any copy of it, may be altered in any way, transmitted to, copied or distributed to any other party, without the prior express written permission of CS. All trademarks, service marks and logos used in this report are trademarks or service marks or registered trademarks or service marks of CS or its affiliates.The information, tools and material presented in this report are provided to you for information purposes only and are not to be used or considered as an offer or the solicitation of an offer to sell or to buy or subscribe for securities or other financial instruments. CS may not have taken any steps to ensure that the securities referred to in this report are suitable for any particular investor. CS will not treat recipients of this report as its customers by virtue of their receiving this report. The investments and services contained or referred to in this report may not be suitable for you and it is recommended that you consult an independent investment advisor if you are in doubt about such investments or investment services. Nothing in this report constitutes investment, legal, accounting or tax advice, or a representation that any investment or strategy is suitable or appropriate to your individual circumstances, or otherwise constitutes a personal recommendation to you. CS does not advise on the tax consequences of investments and you are advised to contact an independent tax adviser. Please note in particular that the bases and levels of taxation may change. Information and opinions presented in this report have been obtained or derived from sources believed by CS to be reliable, but CS makes no representation as to their accuracy or completeness. CS accepts no liability for loss arising from the use of the material presented in this report, except that this exclusion of liability does not apply to the extent that such liability arises under specific statutes or regulations applicable to CS. This report is not to be relied upon in substitution for the exercise of independent judgment. CS may have issued, and may in the future issue, other communications that are inconsistent with, and reach different conclusions from, the information presented in this report. Those communications reflect the different assumptions, views and analytical methods of the analysts who prepared them and CS is under no obligation to ensure that such other communications are brought to the attention of any recipient of this report. Some investments referred to in this report will be offered solely by a single entity and in the case of some investments solely by CS, or an associate of CS or CS may be the only market maker in such investments. Past performance should not be taken as an indication or guarantee of future performance, and no representation or warranty, express or implied, is made regarding future performance. Information, opinions and estimates contained in this report reflect a judgment at its original date of publication by CS and are subject to change without notice. The price, value of and income from any of the securities or financial instruments mentioned in this report can fall as well as rise. The value of securities and financial instruments is subject to exchange rate fluctuation that may have a positive or adverse effect on the price or income of such securities or financial instruments. Investors in securities such as ADR's, the values of which are influenced by currency volatility, effectively assume this risk. Structured securities are complex instruments, typically involve a high degree of risk and are intended for sale only to sophisticated investors who are capable of understanding and assuming the risks involved. The market value of any structured security may be affected by changes in economic, financial and political factors (including, but not limited to, spot and forward interest and exchange rates), time to maturity, market conditions and volatility, and the credit quality of any issuer or reference issuer. Any investor interested in purchasing a structured product should conduct their own investigation and analysis of the product and consult with their own professional advisers as to the risks involved in making such a purchase. Some investments discussed in this report may have a high level of volatility. High volatility investments may experience sudden and large falls in their value causing losses when that investment is realised. Those losses may equal your original investment. Indeed, in the case of some investments the potential losses may exceed the amount of initial investment and, in such circumstances, you may be required to pay more money to support those losses. Income yields from investments may fluctuate and, in consequence, initial capital paid to make the investment may be used as part of that income yield. Some investments may not be readily realisable and it may be difficult to sell or realise those investments, similarly it may prove difficult for you to obtain reliable information about the value, or risks, to which such an investment is exposed. This report may provide the addresses of, or contain hyperlinks to, websites. Except to the extent to which the report refers to website material of CS, CS has not reviewed any such site and takes no responsibility for the content contained therein. Such address or hyperlink (including addresses or hyperlinks to CS's own website material) is provided solely for your convenience and information and the content of any such website does not in any way form part of this document. Accessing such website or following such link through this report or CS's website shall be at your own risk.
This report is issued and distributed in European Union (except Switzerland): by Credit Suisse Securities (Europe) Limited, One Cabot Square, London E14 4QJ, England, which is authorised by the Prudential Regulation Authority and regulated by the Financial Conduct Authority and the Prudential Regulation Authority. Germany: Credit Suisse Securities (Europe) Limited Niederlassung Frankfurt am Main regulated by the Bundesanstalt fuer Finanzdienstleistungsaufsicht ("BaFin"). United States and Canada: Credit Suisse Securities (USA) LLC; Switzerland: Credit Suisse AG; Brazil: Banco de Investimentos Credit Suisse (Brasil) S.A or its affiliates; Mexico: Banco Credit Suisse (México), S.A. (transactions related to the securities mentioned in this report will only be effected in compliance with applicable regulation); Japan: by Credit Suisse Securities (Japan) Limited, Financial Instruments Firm, Director-General of Kanto Local Finance Bureau ( Kinsho) No. 66, a member of Japan Securities Dealers Association, The Financial Futures Association of Japan, Japan Investment Advisers Association, Type II Financial Instruments Firms Association; Hong Kong: Credit Suisse (Hong Kong) Limited; Australia: Credit Suisse Equities (Australia) Limited; Thailand: Credit Suisse Securities (Thailand) Limited, regulated by the Office of the Securities and Exchange Commission, Thailand, having registered address at 990 Abdulrahim Place, 27th Floor, Unit 2701, Rama IV Road, Silom, Bangrak, Bangkok10500, Thailand, Tel. +66 2614 6000; Malaysia: Credit Suisse Securities (Malaysia) Sdn Bhd, Credit Suisse AG, Singapore Branch; India: Credit Suisse Securities (India) Private Limited (CIN no.U67120MH1996PTC104392) regulated by the Securities and Exchange Board of India as Research Analyst (registration no. INH 000001030) and as Stock Broker (registration no. INB230970637; INF230970637; INB010970631; INF010970631), having registered address at 9th Floor, Ceejay House, Dr.A.B. Road, Worli, Mumbai - 18, India, T- +91-22 6777 3777; South Korea: Credit Suisse Securities (Europe) Limited, Seoul Branch; Taiwan: Credit Suisse AG Taipei Securities Branch; Indonesia: PT Credit Suisse Securities Indonesia; Philippines: Credit Suisse Securities (Philippines ) Inc., and elsewhere in the world by the relevant authorised affiliate of the above. Additional Regional Disclaimers Hong Kong: Credit Suisse (Hong Kong) Limited ("CSHK") is licensed and regulated by the Securities and Futures Commission of Hong Kong under the laws of Hong Kong, which differ from Australian laws. CSHKL does not hold an Australian financial services licence (AFSL) and is exempt from the requirement to hold an AFSL under the Corporations Act 2001 (the Act) under Class Order 03/1103 published by the ASIC in respect of financial services provided to Australian wholesale clients (within the meaning of section 761G of the Act). Research on Taiwanese securities produced by Credit Suisse AG, Taipei Securities Branch has been prepared by a registered Senior Business Person. Malaysia: Research provided to residents of Malaysia is authorised by the Head of Research for Credit Suisse Securities (Malaysia) Sdn Bhd, to whom they should direct any queries on +603 2723 2020. Singapore: This report has been prepared and issued for distribution in Singapore to institutional investors, accredited investors and expert investors (each as defined under the Financial Advisers Regulations) only, and is also distributed by Credit Suisse AG, Singapore branch to overseas investors (as defined under the Financial Advisers Regulations). By virtue of your status as an institutional investor, accredited investor, expert investor or overseas investor, Credit Suisse AG, Singapore branch is exempted from complying with certain compliance requirements under the Financial Advisers Act, Chapter 110 of Singapore (the "FAA"), the Financial Advisers Regulations and the relevant Notices and Guidelines issued thereunder, in respect of any financial advisory service which Credit Suisse AG, Singapore branch may provide to you. UAE: This information is being distributed by Credit Suisse AG (DIFC Branch), duly licensed and regulated by the Dubai Financial Services Authority (“DFSA”). Related financial services or products are only made available to Professional Clients or Market Counterparties, as defined by the DFSA, and are not intended for any other persons. Credit Suisse AG (DIFC Branch) is located on Level 9 East, The Gate Building, DIFC, Dubai, United Arab Emirates. EU: This report has been produced by subsidiaries and affiliates of Credit Suisse operating under its Global Markets Division This research may not conform to Canadian disclosure requirements. In jurisdictions where CS is not already registered or licensed to trade in securities, transactions will only be effected in accordance with applicable securities legislation, which will vary from jurisdiction to jurisdiction and may require that the trade be made in accordance with applicable exemptions from registration or licensing requirements. Non-US customers wishing to effect a transaction should contact a CS entity in their local jurisdiction unless governing law permits otherwise. US customers wishing to effect a transaction should do so only by contacting a representative at Credit Suisse Securities (USA) LLC in the US. Please note that this research was originally prepared and issued by CS for distribution to their market professional and institutional investor customers. Recipients who are not market professional or institutional investor customers of CS should seek the advice of their independent financial advisor prior to taking any investment decision based on this report or for any necessary explanation of its contents. This research may relate to investments or services of a person outside of the UK or to other matters which are not authorised by the Prudential Regulation Authority and regulated by the Financial Conduct Authority and the Prudential Regulation Authority or in respect of which the protections of the Prudential Regulation Authority and Financial Conduct Authority for private customers and/or the UK compensation scheme may not be available, and further details as to where this may be the case are available upon request in respect of this report. CS may provide various services to US municipal entities or obligated persons ("municipalities"), including suggesting individual transactions or trades and entering into such transactions. Any services CS provides to municipalities are not viewed as "advice" within the meaning of Section 975 of the Dodd-Frank Wall Street Reform and Consumer Protection Act. CS is providing any such services and related information solely on an arm's length basis and not as an advisor or fiduciary to the municipality. In connection with the provision of the any such services, there is no agreement, direct or indirect, between any municipality (including the officials,management, employees or agents thereof) and CS for CS to provide advice to the municipality. Municipalities should consult with their financial, accounting and legal advisors regarding any such services provided by CS. In addition, CS is not acting for direct or indirect compensation to solicit the municipality on behalf of an unaffiliated broker, dealer, municipal securities dealer, municipal advisor, or investment adviser for the purpose of obtaining or retaining an engagement by the municipality for or in connection with Municipal Financial Products, the issuance of municipal securities, or of an investment adviser to provide investment advisory services to or on behalf of the municipality. If this report is being distributed by a financial institution other than Credit Suisse AG, or its affiliates, that financial institution is solely responsible for distribution. Clients of that institution should contact that institution to effect a transaction in the securities mentioned in this report or require further information. This report does not constitute investment advice by Credit Suisse to the clients of the distributing financial institution, and neither Credit Suisse AG, its affiliates, and their respective officers, directors and employees accept any liability whatsoever for any direct or consequential loss arising from their use of this report or its content. Principal is not guaranteed. Commission is the commission rate or the amount agreed with a customer when setting up an account or at any time after that. Copyright © 2016 CREDIT SUISSE AG and/or its affiliates. All rights reserved.
Investment principal on bonds can be eroded depending on sale price or market price. In addition, there are bonds on which investment principal can be eroded due to changes in redemption amounts. Care is required when investing in such instruments. When you purchase non-listed Japanese fixed income securities (Japanese government bonds, Japanese municipal bonds, Japanese government guaranteed bonds, Japanese corporate bonds) from CS as a seller, you will be requested to pay the purchase price only.