china health and retirement longitudinal study –...
TRANSCRIPT

CHINA HEALTH AND RETIREMENT LONGITUDINAL STUDY
– 2011-2012 NATIONAL BASELINE USERS’ GUIDE
Yaohui Zhao
John Strauss
Gonghuan Yang
John Giles
Peifeng (Perry) Hu
Yisong Hu
Xiaoyan Lei
Man Liu
Albert Park
James P. Smith
Yafeng Wang
Feb 2013
Updated April 2013

Preface
This document describes the overall process, including the design, implementation and data
release, of the China Health and Retirement Longitudinal Study national baseline survey in 2011-2012.
This manual aims to enhance the users’ understanding and application of the survey data.
The China Health and Retirement Longitudinal Study (CHARLS) is a survey of the mid-aged and
elderly in China, based on a sample of households with members aged 45 years or above. It attempts
to set up a high quality public micro-database, which can provide a wide range of information from
socio-economic status to health conditions, to serve the needs of scientific research on the mid-aged
and elderly.
CHARLS is based on the Health and Retirement Study (HRS) and related aging surveys such as
the English Longitudinal Study of Aging (ELSA) and the Survey of Health, Aging and Retirement in
Europe (SHARE). Considering the enormous complexity involved in a national survey, we began with
a pilot survey in just two provinces in 2008: Gansu, a poor inland province, and Zhejiang, a rich coastal
province. The pilot survey collected data from 95 communities/villages in 32 counties/districts,
covering 2,685 individuals living in 1,570 households. The pilot survey produced a set of high quality
survey data, demonstrated that fielding an HRS-type survey in China is feasible. Based on pilot survey
experiences, CHARLS conducted its national baseline survey in 2011-2012. To ensure sample
representativeness, CHARLS survey covered 150 countries/districts, 450 villages/urban communities,
across the country. We successfully interviewed 17,708 individuals in 10,257 households, reflecting
the Chinese mid-aged and elderly population collectively.

Acknowledgements
The China Health and Retirement Longitudinal Study (CHARLS) is an enormous project that
required the efforts of many people. We want to express our gratitude to the CHARLS research team,
the field team, and every respondent. Thank you all for the time, energy, and passion you’ve devoted
to the project, and also for your understanding and support for the CHARLS project.
CHARLS project is a collaborative effort of many scholars at home and abroad. The Principal
Investigator is Professor Zhao Yaohui, National School of Development (China Center for Economic
Research) at Peking University. We have additional Principal Investigators: Professor John Strauss
from the University of Southern California, and Professor Gonghuan Yang from Chinese Center for
Disease Control and Prevention. Dr. John Giles of the World Bank, Dr. Peifeng (Perry) Hu of the
University of California, Los Angeles, Professor Albert Park of the Hong Kong University of Science
and Technology are co-Principal Directors. Professor Eileen Crimmins of the University of Southern
California is a co-Principal Investigator on the supplement grant having to do with analysis of blood
data (which will be covered in a separate User Guide to be released later). Dr. James P. Smith of the
RAND Corporation is Chair of our International Advisory Committee and has played a large role in the
study.
Members of the research team led the development of the different modules of the questionnaire
and contributed substantially to all other parts of the project, including developing training materials,
helping with training, and field work. In addition to the Principal and co-Principal Investigators, they
include Professors Xiaoyan Lei, Yan Shen and Lixing Li from the China Center for Economic Research
at Peking University (CCER); Professor Xinzheng Shi from Tsinghua University, Professor Xiaoyu Wu
from the Central University of Finance and Economics and Dr. Dewen Wang from the Beijing World
Bank office.
The CHARLS fieldwork was administered by a staff lead by Yisong Hu. Yun Wu, trained and
assisted by Albert (Bas) Weerman from RAND Corporation, led the programmers who programmed
the questionnaire into CAPI. Assistant Field Directors, Man Liu and Chang Yuan, and a team of field
supervisors at the Peking University’s Institute of Social Science Surveys led by Hua Ding, recruited,
trained and managed a team of nearly 500 field interviewers who worked hard in the field to achieve

the high quality we see in the data. Yafeng Wang took lead in examining paradata created during the
fieldwork to assist quality control, and led the effort in cleaning the data and creating sampling weights.
More than a dozen students participated in post-survey data checking, cleaning, recalling respondents,
coding open-ended questions, and preparing data for public release. We are deeply appreciative of
their contributions. Haiyu Jin managed the CHARLS accounts, payments to interviewers and
subcontractors.
The China Health and Retirement Longitudinal Study (CHARLS) has received critical support from
both home and abroad. Behavioral and Social Research division of the National Institute on Aging of
the National Institutes of Health in the United States (grant numbers 1-R21-AG031372-01,
1-R21-AG033675-01A1, 1-R01-AG037031-01 and 1-R01-AG037031-03S1), the Management
Science Division of the National Natural Science Foundation of China (grant number 70773002,
70910107022, 71130002), Beijing Representative Office of the World Bank (contract number 7145915)
and Knowledge for Change Program of the World Bank Group (contract number 7159234) all provided
critical financial support for our project. Here, we want to extend our deepest gratitude to all the
sponsors.
CHARLS received valuable support from many individuals and organizations home and abroad.
We thank Dr. Richard Suzman, Dr. John Phillips and the staff at the Division of Behavioral Science of
the NIA, Deputy Directors of management Science Division of the NSFC, Dr. Yijun Li and Dr. Ziyou
Gao, and the Scientific Committee led by Professor Haizhen Li. We thank Peking University vice
president Wei Liu, former Peking University Vice President Jianhua Lin, Director of “985 program”
office and Assistant President of Peking University Xiaoming Li, Director of the Office of Social
Sciences and ISSS Qiang Li, Honorary Dean of the NSD Justin Yifu Lin, former Dean of the NSD
Qiren Zhou, current Dean of the NSD Yang Yao, and officials from the National Bureau of Statistics,
Ministry of Health, Ministry of Labor and Social Security, Ministry of Civil Affairs, Ministry of Education,
and Ministry of Construction.
CHARLS benefitted tremendously from intellectual support from members of our international and
domestic advisory board members led by Dr. James Smith of Rand Corporation, and including James
Banks, Lisa Berkman, David Bloom, Axel Borsch-Supan, Arie Kapteyn, Jinkook Lee, David Weir,
Robert Willis, David Wise, Qiren Zhou, Fang Cai, Scott Rozelle, Cangping Wu, Yang Yao and Xuejin
Zuo.

We thank our colleagues Yan Sun, Yue Zhang and Minyan Chen and staff from the Institute of
Social Science Survey of Peking University, Dr. Linhong Wang, Xiaoming Shi, Xiangjun Yin, and
Zhaoxue Yin from the Chinese Center for Disease Control and Prevention(CDC), 28 Provincial
Centers for Disease Control and Prevention,150 County or District Centers for Disease Control and
Prevention and the health systems of the counties and cities, and all leaders from 450 communities
involved in the survey for their assistance in ensuring the smoothness of the fieldwork. We are greatly
indebted to them.
The survey could not have taken place without the understanding and support of all households
participated in CHARLS project. The data provided not only lays the foundation for academic studies
on the Chinese aging problem, but also throws light on the future development of social welfare
system for our government. We extend our sincerest thanks.

TableofContents
Preface ............................................................................................................................................................................................ 2
Acknowledgements ....................................................................................................................................................................... 3
1. General Introduction to CHARLS ............................................................................................................................................ 8
1.1 Background and Significance ............................................................................................................................................. 8
1.2 Organization of This Document ......................................................................................................................................... 9
2. General Introduction of the Household Survey ................................................................................................................... 10
2.1 Content of the Household Survey ..................................................................................................................................... 10
2.2 Sampling ........................................................................................................................................................................... 15
2.2.1 County-level sampling ....................................................................................................................................... 15
2.2.2 Neighborhood-level sampling........................................................................................................................... 16
2.2.3 Household-level sampling ................................................................................................................................ 17
2.2.4 Respondent-level sampling .............................................................................................................................. 18
2.3 Implementation Status ...................................................................................................................................................... 19
2.3.1 Field Implementation Status ............................................................................................................................. 19
2.3.2 Notes on Response Burden ............................................................................................................................. 20
3. Community Survey .................................................................................................................................................................. 20
3.1 Basic Form of Community Data ....................................................................................................................................... 20
3.2 Community Survey Questionnaire ................................................................................................................................... 21
4. Linking data across individual modules and from communities to households and individuals .................................. 22
5. Occupation and industry codes ............................................................................................................................................. 23
6. Sample weights ....................................................................................................................................................................... 24
Appendix A. Field Procedures ................................................................................................................................................... 27
A.1. Questionnaire Design...................................................................................................................................................... 27
A.2. Construction of the Computer Assisted, Personal Interviewing (CAPI) System ............................................................ 27
A.3. Two Pretests .................................................................................................................................................................... 28
A.4. Personnel Recruitment .................................................................................................................................................... 28
A.5. Training and related material preparation ....................................................................................................................... 29
A.6. Biomarker collection ...................................................................................................................................................... 30
A.7 Field work ........................................................................................................................................................................ 30
A.8 Quality control ................................................................................................................................................................. 33
A.9 Data Cleaning .................................................................................................................................................................. 33
Appendix B. Introduction to the CHARLS-GIS ........................................................................................................................ 35
Appendix C. Proxy Respondents .............................................................................................................................................. 40
Appendix D. Detailed description of biomarkers ..................................................................................................................... 41
Table 1 Summary of data collected in household questionnaire .......................................................................................... 47
Table 2 Summary of biomarkers and equipment used ........................................................................................................... 48
Table 3 Sample Size and Response rate (%) .......................................................................................................................... 49
Table 4 Number and age/sex structure of individuals ............................................................................................................ 50
Table 5 Proxy rate by Age and Gender .................................................................................................................................... 51
Table 6 Biomarker rate by Age and Gender ............................................................................................................................ 52
Table 7 Median of completed time to each module ................................................................................................................ 53

Table 8 Logit Regression for participation in Biomarkers....................................................................................................... 54
Table A.1 Research Team List ................................................................................................................................................... 55
Table A.2 International and Domestic Advisory Board Members .......................................................................................... 56

1. General Introduction to CHARLS
1.1 Background and Significance
China has the largest aging population in the world, and also one of the highest aging rates in the
world today. It is projected that the proportion of those aged 60 or over will increase from 10% of the
population in 2000 to about 30% in 2050 (United Nations, 2002), whereas the elderly support ratio (the
number of prime-age adults aged 25 to 64 divided by the number of adults aged 65 or above) will drop
from about 13:1 in 2000 to 2.1:1 (United Nations, 2002).
With the rapid aging of Chinese population, the problem of providing for the aged population is
becoming increasingly important. One feature of rapid economic growth is that lifetime incomes for
younger people tend to be considerably higher than they were for their elderly parents, making the
elderly one of the largest disadvantaged groups in China. At the same time, China’s birth control
policy means that China’s elderly today have fewer children to support them than in the past. How to
deal with problems of support for the well-being of the elderly is one of the greatest challenges to the
fast booming Chinese society in the decades to come.
In response to this challenge, the Chinese government has taken robust actions to solve the
problem. In recent years, a series of new social safety nets have been put into place, especially in the
field of health services. Such policies includes: Minimum Living Standard Guarantee System, the New
Cooperative Medical Insurance System, the Urban Resident Medical Insurance System, and Medical
Assistance for Low-income Residents, etc. Although these policies are not specifically designed for the
elderly, the aged population is undoubtedly one of the most important beneficiary groups. Similar to
many other policies, they are initiated by the central government, but the local governments maintain
certain autonomy in the process of implementation. The local governments may decide on the
schedule for pilot test and promotion, and they may have different implementation plans. CHARLS is
measuring the existence of these social safety nets at both the household and community levels and
will allow analysis that hopefully will provide a more scientific basis for the government to further revise
and amend the existing policies.
At present, scientific studies of China’s aging problems are still at an early stage, the greatest
obstacle being a lack of sufficient micro, longitudinal data. The existing data tend to be specialized,
not collecting the breadth of data necessary for good social scientific analysis. For instance, there

exist some health data sets that are centered on health measures, with indicators of socio-economic
status largely neglected; on the other hand, data sets collected by social science scholars tend to be
insufficient in health-related measures. Since the welfare of the elderly is closely associated with their
health and socio-economic status, and also because health and socioeconomic levels are themselves
interrelated, micro-data that is of extensive coverage and high accuracy is highly needed for research
on Chinese aging problems. CHARLS is an attempt to fill this gap.
1.2 Organization of This Document
Section 2 of this manual documents the household survey, focusing on the questionnaire content
and sampling procedures. This part also includes a brief description of the field survey completion
results at the household and individual levels. In Section 3 we introduce the methods and contents of
the community survey. Section 4 describes how to link variables across household modules and
between household and community modules. Section 5 discusses occupation and sector coding and
Section 6 describes how sampling weights were constructed.
Appendix A describes the details of the survey process, from questionnaire design, pre-testing,
enumerator training, field procedures and post-field activities to prepare for public data release.
Appendix B provides a detailed discussion of how CHARLS uses GIS to construct the sampling frame
within villages/urban neighborhoods. Appendix C describes how we use proxy respondents, and
Appendix D gives details regarding the non-blood biomarkers and the equipment used for
measurement.
Descriptions about the income, asset, household expenditure and social, economic and policy
environment data at county/district level will be issued later, along with special variables on household
expenditures, income and assets. Also the blood data are still to be analyzed. A separate User
Guide will be issued later to cover these measures.
All data collected in CHARLS are maintained at the China Center for Economic Research (CCER),
part of the National School of Development of Peking University, Beijing, China. All of the data are
accessible to researchers around the world at the CHARLS project website: charls.ccer.edu.cn.
The 2008 pilot survey data have been available since April 2009, and more than 2600 users,
including about one fourth from outside of China, have downloaded data from the pilot survey. If you
want to apply the released data on the website, you can sign an agreement and register by providing

some basic information including your name, address, institution, contact phone number and email
address etc. After 3 days of checking, if approved, you will get an email with the password and can
download CHARLS data. If you are interested in part of the unreleased data, please contact us to
apply.
2. General Introduction of the Household Survey
2.1 Content of the Household Survey
The China Health and Retirement Longitudinal Study (CHARLS) aims to set up a high quality,
nationally representative and publicly available micro-database that provides a wide range of
information about the households of the mid-aged and elderly and also individual information on the
mid-aged and elderly respondents and their spouses. CHARLS provides broad data that allows for
analysis by multiple disciplines. To facilitate inter-country comparisons, CHARLS was designed to be
comparable with the Health and Retirement Study (HRS) and related aging surveys around the world
(e.g., the English Longitudinal Survey of Aging, ELSA, and the Survey of Health, Aging and Retirement
in Europe, SHARE), while being sensitive to the specific conditions of China.
The CHARLS household survey is composed of eight parts: (a) Household Roster, (b)
Demographic Background, (c) Family, (d) Health Status and Functioning, (e) Health Care and
Insurance, (f) Work, Retirement and Pension, (g and h) Income, Expenditure and Assets, (i and j)
House Characteristics and Interviewer Observation (Table 1). The following are the major contents of
this baseline survey:
0. Coverscreen
We start with a coverscreen that is designed to identify households that have an age-eligible
member (age 45 and over). If more than one household lives in the same dwelling we identify all those
with age-eligible members and randomly choose one. We then identify all members of the household
and their ages. If there is only one age-eligible member in the household, he or she is defined as the
main respondent; but if there is more than one age-eligible member, we randomly select one. The
spouse of the main respondent, regardless of age, is automatically included if there exists one living in
the household. There is no restriction on the age and household status of the coverscreen respondent.
The coverscreen section includes the following four tasks:

First, verifying that the household is in the sample list. This is achieved by checking names,
addresses and the household photo from the mapping/listing phase, and inquiring if they have
received the “Letter to the Respondents”.
Second, finding out the number of families living in the same dwelling and the number of other
dwellings in the same district that are owned by the family. This information is used for sampling and to
adjust sampling weights. Because the sample frame used in household sampling is a dwelling sample
frame, there may exist situations when multiple families live in one dwelling unit. In this case we
sample one of the households in the dwelling containing an age-eligible member.
Third, listing all the members in this household randomly selected and choosing the main
respondent. Out of all the members of the selected household, one person aged 45 and over is
selected to be the main respondent, and their spouse is automatically included, if one exists. Basic
information is collected on each of the main respondent and spouse, including their name, gender,
birthdate, and marital status.
Fourth, module respondents are determined. In the household survey, the main respondent and
her/his spouse answer the individual modules separately. Besides the individual modules, the
questionnaire also has family level modules which require family members who are familiar with the
family structure and economic status to answer them respectively. We call the respondents of these
two parts “Family Module Respondent”, and “Financial Module Respondent”. The “Family Module
Respondent,” who needs to answer the household roster and family modules, is usually either the
main respondent or her/his spouse, but in any case is the person who is most familiar with family
organization and transfers. The “Financial Module Respondent,” who needs to answer the family
income, expenditure and asset, is the person who is most knowledgeable about family income and
expenditures, and can be any family member.
Main Modules
The CAPI system of this baseline survey adopts the approach of sequential modules. After the
system identified the respondents for each module based on the coverscreen information, the CAPI
system loads the required module and questions according to the respondents’ status. During the
interview, some modules were started depending on other modules being completed. Certain
information of sections A and C of the Household Roster might be referred to in other sections;
therefore, the Household Roster and Family Module were always finished first. After the completion of

sections A and C, the interview sequence could be freely chosen for convenience.
Please refer to our website for the detailed household questionnaires(charls.ccer.edu.cn).
A. Household Roster
This section, answered by the family respondent, collects personal information of household
members excluding the main respondents and their spouses. The main contents of the questionnaire
includes a household roster containing members’ gender, birth date, marital status, relationship with
the respondent, Hukou status and place of Hukou, education background and some limited migration
history.
B. Demographic Background
This section collects personal information about the main respondents and their spouses,
answered by each of them. The main contents of the questionnaire includes the respondents’ birth
date and place, resident status, some limited migration history, Hukou status, place of Hukou and any
Hukou changes, educational background, and marital status. To those divorced or widowed
respondents, we also ask basic personal information of their ex-spouses, such as birth year,
educational background and year of divorce or death.
C. Family
This section collects personal information of all family (not just household) members (parents,
siblings, and children) except that of the respondents and their spouses, regardless of whether the
parents, siblings or children are living in the respondent’s household or not. Plus detailed information
on time and financial transfers between family members is collected. In regard to parents and children
of the main respondents and their spouses, questions inquire about whether they are living or not,
blood relationships (are they biological parents/children), their birth places, some questions about the
environment when growing up, birth date or zodiac, death date, education background, some limited
labor force information, living place, Hukou status and having a house or not. The questionnaire also
includes basic information about siblings. In-kind and monetary transfers information is collected for
transfers between the respondents’ household and non-co-resident parents (including
parents-in-laws),children, other relatives and non-relatives. Information on grandchild care and
parental care is also collected.
A sub-section also provides basic information on living arrangement preference of the respondent.
They are asked what type of living arrangement they think the best for an elderly person who have

adult children and a spouse and for one who have adult children but do not have a spouse.
Both the main respondent and their spouse are needed to answer the questions in this
sub-section.
D. Health Status and Functioning
D1 Health Status:Self-rated Measures
This section asks a rich set of questions on self-rated health status, including measures of general
health status, whether the respondent has been diagnosed by doctors for having certain chronic
diseases, and whether the respondent has had any accidents or falls. We ask about information on
health behaviors such as smoking, drinking, and physical activities (including both physical exercise
and physical activities in daily life). We also focus on activities of daily living (ADLs), instrumental
activities of daily living (IADLs) and measures of physical functioning. Helper information is also
collected following the ADL/IADL questions. Questions on mental health (depression) and cognitive
capability are asked. To help interpret general health questions, we ask health vignettes on a random
sub-sample. The vignettes are designed to elicit the thresholds that respondents use when evaluating
their health. Finally we ask about subjective expectations of living to certain future ages.
D2 Health Status:Biomarkers
Because self-reported health variables may contain error, we obtain a series of biomarkers for
each respondent. These variables include height, weight, waist circumference, lower leg length and
upper arm length. We also measure their blood pressure and pulse three times, their lung capacity
(measured by a peak flow meter) three times, grip strength (using a dynamometer) two times for each
hand , a timed sit to stand, a timed walk for respondents aged 60 years and over, and balance tests
(see Table 2 and Appendix D for details) . The interviewer records the results and provides them to the
respondents. If some abnormal results are found, the respondent will be advised to see a doctor for
further confirmation.
We also collect whole blood of all respondents who gave informed consent, which are being
stored in a deep freezer at -80C. These are being analyzed for C-reactive protein, Hba1c, glucose,
total-Cholesterol, HDL-C, LDL-C, TG, hemoglobin, cystatin C, BUN, creatinine, and uric acid. These
blood analyses will be completed, publicly released and linked to the CHARLS data later. A separate
User Guide will be issued for these data.
E. Health Care and Insurance

The section collects information about medical treatment and preventative medical services,
including the utilization of preventative medical services during the last year, outpatient treatment
during the last month, inpatient treatment during the last year, and self-treatment during the last month.
Detailed information includes: place of treatment, distance, total cost, out of pocket cost and amounts
to be reimbursed by insurance, cost of medicine, etc. Each respondent is also asked details about
their health insurance, such as insurance coverage, both past and present, and whether coverage has
been lost. From this information researchers will be able to tell the take-up rates of new insurance
programs.
F. Work, Retirement, and Pension
The section records current job status (working, not working now, and never working before) and
collects detailed data including labor supply, wages and fringe benefits; including social insurance
programs received through the employer. If the person has side jobs, some limited information is
collected about those jobs. For people not working, information on their last job is collected. Finally, a
brief history of working experience is obtained. We collect detailed retirement information,
distinguishing between nominal retirement (pensionable) and actual retirement (withdraw from the
labor market), and ask detailed questions about pensions.
G.H. Income, Expenditure, and Assets
GB, HA. Household Income, Expenditure, and Assets
This section asks household level income, expenditure and assets that are hard to split between
household members. In this section, total expenditures of the household including consumption of
self-produced foods are asked. Also information on detailed household-level agricultural revenues and
costs are collected, as well as net income from household-level non-farm businesses. Assets are
categorized into housing, land, household equipment, consumer durable goods, and financial assets.
Asset information in this section is collected only for collectively-owned assets, including information
about the commonly held wealth of household members’ besides the main respondents and their
spouses. The respondent for this section is the financial respondent, who is most familiar with these
issues.
GA, HB. Personal Income and Assets
This section measures the personal income and wealth of the main respondents and their
spouses. Independent ownership of assets and personal income are asked. Current personal liabilities

are also documented. Special attention is paid to whether respondents purchased their house through
their work unit under the special subsidy program that was in place in the 1990s..
I. Housing Characteristics
This section collects house characteristics. We include questions such as what type of building
the house is, how many floors it has, whether it is handicapped accessible and whether it has facilities
like toilet, electricity, running water, telephone, internet, etc. Also tidiness and the temperature inside
the house are included.
J. Interviewer Observation
The section mainly records the interviewer’s personal observation about the interviewing process;
how willing the respondent was in answering and if they seemed to have trouble.
2.2 Sampling
The CHARLS national baseline survey was conducted in 28 provinces, 150 countries/districts, 450
villages/urban communities, across the country. The CHARLS sample is representative of people
aged 45 and over, living in households; institutionalized mid-aged and elderly are not sampled, but
Wave 1 respondents who later enter into an institution will be followed. All samples were drawn in four
stages.
2.2.1 County-level sampling
At the first stage, all county-level units with the exception of Tibet were sorted (stratified) by region,
within region by urban district or rural county, and by GDP per capita. Region was a categorical
variable based on the NBS division of province area. After this sorting (stratification), the population
of each county was listed, along with the cumulative population (populations of each county plus all the
counties higher on the list). If N is the total population of all the county-level units and 150 is the
number of counties to be sampled, then define an interval n=N/150. The first county was selected by
choosing a random number r from 0 to 1, and selecting the first neighborhood with cumulative
population greater than r*n. Then the interval n was added to this starting point, and the second county
was the first county on the list with cumulative population greater than r*n+n. The third county was
chosen by once again adding the interval n, and picking the first county on the list with cumulative
population greater than r*n+n+n. Figure 1 shows the distribution of counties and districts of CHARLS.

Figure 1 The distribution of sampled counties and districts of CHARLS
2.2.2 Neighborhood-level sampling
Our sample used administrative villages (cun) in rural areas and neighborhoods (shequ) in urban
areas, which comprise one or more former resident committees (juweihui), as primary sampling units
(PSUs). We selected 3 PSUs within each county-level unit, using PPS (probabilities proportional to
size) sampling. Note that rural counties contain both rural villages and urban neighborhoods and it is
also possible for urban districts to contain rural administrative villages. For each county-level unit, the
list of all PSUs was randomly sorted. Then, the population of each PSU was listed, along with the
cumulative population (populations of each PSU plus all the PSUs higher on the list). If N is the total
population of the county-level unit and 3 is the number of PSUs to be sampled, then define an interval
n=N/3. The first PSU is selected by choosing a random number r from 0 to 1, and selecting the first
neighborhood with cumulative population greater than r*n. Then the interval n is added to this starting
point, and the second PSU is the first PSU on the list with cumulative population greater than r*n+n.
The third PSU is chosen by once again adding the interval n, and picking the first PSU on the list with
cumulative population greater than r*n+n+n. This procedure was implemented using the Stata

command samplepps.
In neighborhoods with very large populations (over 2000 households), given the high costs of
preparing map-based sampling frames, supervisors were permitted to select a geographic subset of
the neighborhood as the PSU, for example one or more former neighborhood committees (juweihui) in
the community (shequ). Enough sub-neighborhoods were to be sampled to ensure that there were a
sufficient number of eligible sample respondents. Sub-neighborhoods would then be selected based
on the estimated population of each sub-neighborhood. There were 30 communities that had to be
split this way.
Due to mistakes in the original sampling frame, of the 450 communities originally chosen, we had
to replace 6 for the following reasons: two villages disappeared due to resettlement, one urban
community was expanded to becoming a county-level urban district, two communities were nearly
entirely collective dwelling residents, one being university dormitories and the other being prison,
which are not supposed to be part of our samples. The choice of replacement communities followed
the exact procedure outlined above. In 6 counties, the administrative boundaries changed so that the
chosen communities fell within two counties. We did not replace these communities. As a result, the
final number of counties becomes 156.
2.2.3 Household-level sampling
In each PSU, we selected a sample of dwellings from our frame, which was constructed based on
maps prepared by mappers/listers with the support of local informants. In order to get accurate sample
frame of household in each village or community, a mapping/listing software named CHARLS-GIS was
developed. For each PSU, a mapper was first sent to the community with a GPS unit to collect the
boundary, then the CHARLS office used the boundary information to capture Google Earth map
images, which were used as the basis for the mapping and listing. Then, all buildings in each PSU
were enumerated with photos and GPS readings, and dwellings within each building were listed.
Collective living dwellings such as military bases, schools, dormitories or nursing homes, were
excluded.
Then each PSU sampling frame was checked by the CHARLS headquarters to ensure that all
buildings within the community boundary were enumerated. After verification, the supervisors used
CHARLS-GIS software to randomly sample 80 households, which were marked on the map and sent
back to mappers/listers in the field to collect information for these households including age of the

oldest person, name of household head, telephone number, and whether the dwelling unit was empty
or not. The number of households sampled was greater than the targeted sample size of 24
households per PSU in anticipation of sampled households’ not having any members aged 45 or older,
the possibility of an empty house and household non-response. . Based on this information, the
supervisor randomly sampled a specific number of households for each community/village using the
CHARLS-GIS software. The initial sampling was a random sample from the 80 households. From
these households we computed the fraction of households that were age-eligible and the number of
empty dwellings. From this we derived neighborhood/village-specific sampling proportions and then
chose our sample from the entire sampling frame.
After final sampling work in the PSU was completed, the information on the sampled households
was sent back to the mappers/listers, who loaded this information in the CHARLS-GIS software on
their computer. The mappers/listers then sent ‘A letter to the respondent’. Simultaneously, the IT in
CHARLS project office transferred the sampled household lists and addresses for a given PSU to the
interviewer’s CAPI system.
We interviewed all age-eligible sample households in each PSU who were found and willing to
participate in the survey. Some dwellings had multiple households living in them. In these cases we
randomly chose one household that had an age-eligible member. Thus, variation in the share of
sampled households that could be found, had an age-eligible member, or were willing to participate in
the survey led to different numbers of completed household surveys in each PSU. This is corrected for
in the sampling weights.
2.2.4 Respondent-level sampling
In each sampled household, a short screening form was used to identify whether the household
had a member meeting our age eligibility requirements. If a household had persons older than 40 and
meeting our residence criterion, we randomly selected one of them. If the chosen person is 45 or older,
then he/she becomes a main respondent and also interviewed his or her spouse. If the chosen person
is between ages 40 and 44 he/she is reserved as a refresher sample for future rounds of survey. If an
age-eligible person was too frail to answer questions, we identified a proxy respondent to help him/her
to answer questions, usually a spouse or knowledgeable adult child, if there was one in the house.
Households without members 45 years or older were not interviewed.
Questions concerning household roster in section A, household organization and financial

transfers in section C were answered by the “Family Respondent”, who could be either the main
respondent or the spouse of the main respondent; whenever possible the person chosen was the
individual most able to answer the questions in these sections accurately.
Similarly, a “Financial Respondent” was chosen to answer questions on family income,
expenditure, and assets. In this case, any household member aged 18 or above could be selected as
the financial respondent (including the main respondent and spouse), with the main criteria again
being which person is most knowledgeable about these matters.
2.3 Implementation Status
2.3.1 Field Implementation Status
The China Health and Retirement Longitudinal Study (CHARLS) national baseline survey was
conducted from May 2011 to March 2012 in 28 provinces. The survey covered 450 PSUs (villages or
neighborhoods) located in 150 counties/districts. Among the 450 basic sample units, 52.67% were in
rural areas and 47.33% were in urban areas.1
The sample drawn for the baseline survey included 23,422 dwellings (see Table 3). Out of these,
4,341 dwellings were confirmed to be uninhabited. Out of the 19,081 households sampled, 12,740 had
age-eligible members.2 As expected, rural households had a higher age-eligibility rate (73.80%) than
urban households (59.04%).
Out of the total estimated number of age-eligible households, we managed to contact and get
response from 10,257 households, some 80.5% (Table 3). The complement, 19.5%, is comprised
equally of age-eligible households whom we could not contact (8.2%), refusals (8.8%) and other
non-response (2.5%). This response rate compares quite well with the experiences in the first wave of
HRS and is much better than recent first wave cohorts of HRS and SHARE. Response rates were
much larger for rural than urban households, in line with the experiences from other surveys in low
income countries.
Table 4 describes the age/sex composition of the CHARLS sample. We have data on 17,708
individuals, of which 52.1% are female. While most of the sample are the younger old, 40% are aged
60 years and older. Of our sample, 91.3% were directly interviewed and 8.7% interviewed by proxy
1 The urban-rural definition here and thereafter is based on the NBS definition where a PSU is defined as urban if it is located in a city, suburb of a city, a town, suburb of a town, or other special areas where nonfarm employment constitutes at least 70% of the work force, such as a special economic zone, state-owned farm enterprise, etc, 2 We had information on age-eligible members for some of the households whom we were unable to contact, the age-eligible percent calculation uses these and assumes that for households that could not be contacted had the same rates.

respondent (Table 5).
Table 6 describes the completion rate of the biomarkers, for which the completion rate is 78.9%.
Some respondents were too frail to complete the biomarker section, but in addition, individuals,
generally “younger” men, often were not at home, because they were working, traveling, or otherwise
engaged at the time of the interview and so did not get measurements taken. In addition, there were
refusals. The biomarker completion rate does, however, compare reasonably well with HRS. From
Table 6 one can see that older women and younger men were less likely to have their biomarkers
taken.
2.3.2 Notes on Response Burden
The China Health and Retirement Longitudinal Study (CHARLS) national baseline survey is very
complicated, covering almost all aspects of personal life. Information is collected not only about
eligible respondents, but also about their spouses as well as other household-level information. One
issue for surveys that collect so much information is the potential for response burden affecting the
quality of the responses. Table 7 provides data on the median time taken to complete each
questionnaire module. The time data are derived by subtracting the start time from the finish time of
each module, as is recorded automatically by the CAPI system. This time will include breaks and
interruptions. As can be seen in Table 7, the family module (C) and the household income, expenditure,
and assets modules (G2&HA) generally take more time than the individual modules; and module D
Health Status and Functioning takes the longest time of all five individual modules.
3. Community Survey
To properly analyze living standards and behavior, it is useful to have information at the
community level, as well as at the household and individual levels. Useful information can include
prices, availability of local infrastructure and services as well as policy parameters that may vary
across communities. CHARLS has introduced a community survey to serve these purposes. The
following section is devoted to introducing the form and main contents of community survey.
3.1 Basic Form of Community Data
All chosen village committees and neighborhood committees complete a community survey. The
mapper/lister administered the community questionnaire with the person in charge of each

neighborhood committee or village committee. In order to complete the questionnaire, the respondents
were asked to look up certain statistics of the village/community regarding areas such as the natural
environment, employment, and financial status.
3.2 Community Survey Questionnaire
The community questionnaire is a thorough examination of the social, economic and policy
environments of the community to be surveyed. The questionnaire includes the following parts:
A. Basic Information
This part collects information about organizational structure, physical area, geographic features of
the community and for rural villages, ownership of land.
B. Infrastructure and public facilities
This section covers the infrastructure and public facilities within the community, including roads,
schools, post offices, health care facilities, recreation facilities, and public transportation. It also asks
about the conditions of these public facilities. Information about water supply, electricity and fuels is
also covered.
C. Population and labor
In this section detailed information is collected on the structure of population and the local labor
force of the community, including the distribution by education of community members and migration of
labor.
D. Enterprises and wage
This section collects data on the number of enterprises and wage levels in the community, broken
down by gender and occupation.
E. Migration
This section records distribution of the migrant population by region and the average wage of
migrant population by gender.
F. Health and Insurance
This section focuses on health facilities in the community and their availability. This section also
documents registration procedures for health insurance and the coverage of health insurance within
the community.
G. Social policy

Social policies were asked in this section including unemployment subsidies, minimum living
allowance, other subsidies, subsidies for being parents of a single child, farm subsidies, subsidies for
reforestation, pension to persons older than 65, subsidy for persons older than 80, the new rural
pension system and the old rural pension system.
H. Community history
For this section, several older people are gathered to answer questions about the history of
community. This section tries to examine the history of policy changes in the community, measured by
policy reforms. We record the start dates of various policy reforms in the community, such as the
Household Responsibility System and family planning policy. Also information about rusticated youth,
and bare-foot doctors was recorded.
I. Epidemics and natural disaster
We collected information on natural disasters and epidemics that occurred in this
village/community in the last five years and since 1945. Detail information of the year each event
started and the estimated affected population during these big events was recorded.
J. Production, Income and Price
This section collects data on current market prices of foods, energy and housing which are all
closely associated with the lives of local residents.
K. Interviewers’ Observations
This section consists of a subjective evaluation by the mapper/lister. A seven step scale is used to
grade the communities on dimensions such as socio-economic status (poor to rich), the tidiness of the
roads, how crowded is the area, accessibility to handicapped individuals, and the degree of Mandarin
fluency.
4. Linking data across individual modules and from communities to households and
individuals
Data from different individual and household modules can be linked by using the household or
individual identifiers that are in each data file. Data files in the “loop” files are at the household level,
while those in the “main survey” files are at the individual level.
The household identifier is an 9 digit number. These are made-up numbers. The first two digits
represent the province. The next two digits represent the city within the province. The 5th to 6th digits

represent the county within the city. From the first six digits users can distinguish households in
different counties, to use county fixed or random effect models, for example. The seventh digit
represents the village number within the county.
xx xx xx x xx
Province City County Village Household
Household ID
Again, these are made-up numbers, within CHARLS. The first seven digits then identify the village
uniquely and these are used as our community id. The community id should be used to link
household and individual data to our community module, which will be issued later. Finally the 8th and
9th digits are the household id within community.
xx xx xx x xx xx
Province City County Village Household Individual
Individual ID
Individual ids take the household id as the starting point and add two additional digits to indicate the
number of the respondent or spouse within the household.
5. Occupation and industry codes
In the labor module, occupation and industry were described in words by the respondents. This
was done so that the enumerator did not have to instantaneously classify the occupation and industry,
which would be very difficult for them to do well.
Variable selection
Data import
Allocation of samples to 3
coders
Three coders work
independently
Do 2 coding results among three matched? Finish
Yes
Does the information enough?
Yes
No
Allocation to charls00
Discussion
Allocation to charls-1
No
Figure 2. The flow chart of occupation and industry coding

After the survey, we developed a web-based coding system for the coding work. After inputing the
labor module data in the system, the coder then did the coding, supervised by a manager. Usually,
there were three coders working on the same data simultaneously as a group and independently. After
the group finished the work, the manager matched the data in the system. If at least two coding results
among three matched for one record, the coding was accepted. If not the unmatched records were
checked and discussed by three experienced coders to make a final decision. The standard Chinese
GB 6-digit classification coding table was used and we added few categories code for some
occupations which cannot be properly coded. At the same time, industrial sector of the economy was
coded into a 2-digit classification. We used a correspondence between the Chinese occupation
codes and the SITC code. We report both codes in the public use data.
6. Sample weights
We have constructed sample weights for households and individuals. Two sets of household
weights are provided; one with and one without corrections for non-response. Individual weights are
also provided, with and without household and individual non-response corrections. For the
biomarker data additional individual weights are provided that correct for the non-response of
individuals in biomarkers. We construct weights directly from the sampling probabilities.
Since the 150 counties are selected by the standard PPS rule, the probability that a county was
selected is defined as the population in the county unit as a fraction of the population of China, and
multiply that by the number of county units sampled, 150. We then use the same formula to calculate
the conditional probabilities that particular village units were sampled within a selected county unit.
Again, we take the village’s share of the county population multiplied by 3, the number of village units
chosen per county unit. In cases in which a sub-neighborhood was chosen to be a primary sampling
unit, we further adjust by the share of the sub-neighborhood within the village unit. Next we compute
the probability of a household being selected within a particular village. This requires several steps.
First we take the total number of dwellings sampled divided by the number of dwellings in the village.
We multiply that by the fraction of sampled households that have an age-eligible member. Finally we
multiply that by the sampling rate within the dwelling, for those cases in which more than one
household with an age-eligible member resided in the same dwelling. These conditional probabilities
(selection of county, selection of village and selection of household) are then multiplied and the inverse

taken to obtain the (inverted) household sampling weight.
This sampling weight does not account for non-response, but we offer it as one weight, because
some researchers may prefer not to use non-response selection corrections, as they depend on
certain, possibly strong, assumptions (unconfoundedness) to be asymptotically consistent. For the
non-response correction, we use an inverse probability weighting that we multiply with the uncorrected
household weight.3
The inverse probability weighting factor is constructed by first estimating a logit regression of
whether the household participates (using age-eligible households as the observations) as a function
of dummy variables for PSUs.4 We would have additionally used characteristics of the household
and household head, but these were unobservable for households that we could not find or that
refused and so never started the coverscreen. Once the logit regressions are run, we take the
inverse of predicted probability for each household and cap them at the 99th percentile, so that no
observation is unduly weighted. This is our inverse probability weight that we use to multiply by the
(inverted) household weight without participation correction to arrive at our corrected weight. This
can be useful, but does require a selection on observables assumption (that is there is no selection on
unobservables, Wooldridge, 2002), which is strong.
The individual weights use the inverted household weights as their base, but divide them by the
probability of that individual being sampled, conditional on the household being chosen. One can use
either household weight as the base (participation-corrected or not) to get two individual weights.
These conditional probabilities of being chosen vary by persons within the chosen household, by
how many age-eligible persons reside in the household and by whether the person is married or not.
Take as one example a household with only one age-eligible person. The probability of that person
being chosen is one, so the household base weight is divided by one to get the individual weight.
Now suppose that there are two unmarried persons over 45 in the household. Then the probability of
either being chosen is ½, so the household weight is divided by ½ for each person to arrive at the
appropriate weights. Now suppose that we have a 2 person household, both age-eligible, and
married. Each has a probability of ½ of being chosen as the main respondent, but both also have a
probability of ½ of being chosen as the spouse. Hence the total probability of each being chosen is 1,
3 See Jeffrey Wooldridge, 2002, Econometric Analysis for Cross Section and Panel Data, Cambridge: MIT Press, for details. 4 Some village dummies had to be aggregated because all households participated or not. In these cases we aggregated with villages that were nearby or at least in the same county unit.

so we would divide the household weight by 1 for each of these persons. Finally, let’s consider a 3
person household: person A is a 65 year old unmarried women, while B is a 70 year old man and C is a
60 year old woman, married to B. Each of A, B and C have a 1/3 chance of being chosen as the main
respondent, but B and C have another 1/3 chance of being chosen as the spouse. Thus the total
probabilities of being sampled are 1/3 for person A and 2/3 for B and C. These probabilities would be
divided into the base (inverted) household weight to arrive at the individual weight for A, B and C
respectively.
We also offer the non-response corrections in individual level, we use the same method to
construct the inverse probability weighting factor in individual level, which first estimating a logit
regression of whether the individual responses (using all eligible individuals in responded households
as the observations) as a function of a dummy for gender, a dummy for age information, age (if known),
a dummy for marital status, and dummies for villages. Then the individual level inverse probability
weight factor is calculated by the inverse of predicted probability for each individual (cap at the 99th
percentile).
For the analysis of individual biomarkers, a different set of weights are needed because just over
20% did not get biomarkers taken. We do the same type of inverse probability weighting adjustment
as we do for households. In this case the sample in the logit regression is all main respondents and
spouses and the dependent variable equals 1 if they got biomarkers taken. Because we have
information on these individuals, we can use a much richer set of covariates. We still use village-level
dummies, but now also include the respondent’s age dummies, sex and their interactions, and
schooling level dummies. The results are presented in Table 8. Older men and persons with high
school education and above are less likely to get their biomarkers taken. The predicted probabilities
from this regression are inverted and capped at the 99th percentile and divided into the (inverted)
individual weights with household participation corrections.

Appendix A. Field Procedures
This Appendix discusses the field procedures and the steps leading up to the China Health and
Retirement Longitudinal Study (CHARLS) national baseline survey. It took one and half year
preparation before field operation of the survey. The CHARLS research team started revising the
questionnaire at the end of 2009 based on pilot study results in 2008, and during this period, a number
of pilots were organized to test and improve the questionnaire and the survey procedure. In August
and December of 2010, We conducted two formal pretests before finalizing the questionnaire for the
national baseline using CAPI. From the experience of the pre-test, the research team revised the
questionnaires and procedures for the field survey in Apr. 2011. After that, the project team started to
recruit mappers/listers and interviewers and to prepare training materials initially prepared by the
research team. Ten classes of training took place at Peking University from May to July in 2011. In 5
mappers/listers training classes, 3 trainers trained about 30 persons on averge in each class. In
another 5 interviewers training classes,6 trainers trained about 60 persons on averge in each
class.When the selected trainees finished their training, were they sent out to every county to field the
survey. About 90% of field work was completed at the end of September of 2011, but the whole work
took longer than expected and finished at the end of March in 2012.
A.1. Questionnaire Design
The research team has worked hard to produce the final questionnaire. Following the formal pilot
that took place in Gansu and Zhejiang provinces in 2008, the research team analyzed the data and
revised the questionnaire based on the experience of using the data. Further modifications were made
after two formal pretests in Beijing and Langfang in August and December of 2010 respectively, and
even further changes made while writing the CAPI program, and during the training process.
A.2. Construction of the Computer Assisted, Personal Interviewing (CAPI) System
The CAPI system used by CHARLS project was written in MMIC (a LINUX-based sytem) by
Albert (Bas) Weerman, an IT specialist from RAND Corporation, and by Wu Yun, a programmer
trained by Weerman. Our programmers constantly readjusted the program to reflect modifications of
the questionnaire, in response to feedback from the pretests. Following the revision to the
questionnaire after the formal pretest in Langfang, the CAPI program was revised and repeatedly
tested. The CAPI program for the national survey was finalized by June 2011.

A.3. Two Pretests
We conducted two more formal pretests before finalizing the questionnaire for the national
baseline using computers. From August 5-21, 2010, a formal pretest took place in two communities
(one urban, one rural) in Haidian District, Beijing. Key members of the research team including
Zhao, Strauss, Shi and all other key project staff took part in this pretest. We hired 15 students as
interviewers. Training lasted for 12 days and the field work 9 days. We completed 29 household
interviews. Following this pretest, we calculated the time length of the questionnaire and cut
questions based on the pretest time data. From November 5 to mid-December, we conducted
another formal pretest in Langfang city of Hebei Province. This was designed as the rehearsal of
field work. We selected 3 counties and one community in each county as our testing ground. We
recruited interviewers from the China Center for Disease Control (CDC) county staff, one
mappers/listers, two interviewers, one blood sample analyst and one coordinator from each county,
just like what we will do in the actual field work. Unlike the actual field work, we recruited one extra
blood sample collector. Training for mapping/listing preceded the training of interviewers. The
training of interviewers lasted for 9 days and interviews took almost one month. We completed 110
household interviews with a response rate of 86.6%. The sample was used to pretest tracking in for
wave 2. Following the Langfang pretest, the questionnaire was finalized. The revised questionnaire
was approved by the Peking University IRB.
A.4. Personnel Recruitment
After two pretests, we decided to recruit the staff independently. We needed one
mapper/lister and 2 interviewers for each county so our task was to recruit 150 mappers/listers and
300 interviewers. To automate this process, we designed a web-based recruitment system where
job applicants filled in relevant information online and initial screening was conducted. The staff at
the Institute of Social Science Surveys of Peking University helped us to advertise the positions at
help-wanted websites, both at national websites and provincial sites, and at college Bulletin Board
System (BBS). In many cases, we relied on colleagues in local universities to recruit their students
as interviewers. Most of the mappers/listers and interviewers were university students in their
earlier 20s. The criteria used in selecting mappers/listers and interviewers were their stated
willingness to work hard and any previous field experience. Also communication ability was

emphasized, particularly knowledge of local dialects that were likely to encounter in the field.
A.5. Training and related material preparation
Training of mappers/listers and interviewers were each divided into 5 classes and were all
conducted in Beijing. The trainings of mappers/listers were conducted in May, each one ran for 5 days.
Lectures were given in the mornings and mappers/listers were brought to a nearby community for
practice every afternoon. We deliberately choose a community with complicated building structure.
Every morning a test was conducted to test their knowledge learned the previous day. The
mappers/listers immediately went to the field after training.
The trainings of interviewers were conducted in June and July, each one running for 9 days, with
DVDs. The first 7 days were lectures and in-class practices. Every day at the end of the class a live
interview was conducted with a convenience sample. As in the training of mappers/listers, every
morning a test was conducted online on what they learned the previous day. At the 8th day of the
training, interviewers were brought to a nearby community and conducted live interviews the way they
would in the field. On the last day they went back to the classroom for a summary session. They were
first briefed by our quality control team of their performance based on real data that was transmitted
from their PC to our server. Then they exchanged their experience from the previous day. At last, they
were issued training certificates and had a farewell lunch. Additional trainings were conducted when
we needed extra interviewers in cases when interviewers quit or fired.
Because we are conducting multiple trainings before the actual field work, we wanted a set of
standardized training materials to ensure that all interviewers receive the same training no matter
where and when they are trained. The research team and field staff started to produce a set of training
manuals since May 2010. They also wrote scripts for various parts of the training course and went
through several iterations. These training materials were used in the August pretest in Beijing. The
training sessions, conducted by the research team, were recorded and what was spoken was
transcribed and compared with the written scripts for further revisions. After the scripts were edited, a
set of training videos (DVDs) were made with the help of the Peking University TV station. In the
Langfang pretest in November, we relied mainly on the training videos to test the effectiveness of the
DVD-based training. Following this pretest, we adjusted the timing of each DVD, changed the order of
the training sessions, and streamlined the procedure. All the training scripts were revised and DVDs

were then remade at Peking University’s TV station.
A.6. Biomarker collection
In the pilot of 2008 in Gansu and Zhejiang provinces, we collected detailed anthropometric
measurements: height, weight, and waist hip circumferences, lower right leg length and arm length
(from shoulder to wrist), as well as several performance measures indicating strength and movement,
including peak flow, grip strength, 5 timed chair stands, and measured blood pressure. Using other
funding, we also used a portable machine to measure blood cholesterol (total and HDL) and collected
dried blood spots (dbs) to test for C-reactive protein and hemoglobin. For the national baseline, we
added tandem balance tests and a timed walk to the list of performance tests, and collected whole
blood instead of dried blood spots, again using funding from domestic sources. In the Beijing pretest,
we included anthropometric measures, performance tests and blood pressure but excluded the
collection of blood samples. In Langfang pretest of November 2010, we also included the collection,
transportation and analyses of blood samples. We also received a competing revision R01 in March
2011 to support the analysis of blood samples.
The nurses recruited in the national baseline survey were selected from sampled county CDCs
and trained separately by the China CDC, as they had to learn the procedures of taking the blood
sample that we were collecting. Training of nurses took place in 4 different provinces grouped by
proximity from the end of June to the beginning of July 2011. After each county’s interviewing work
was complete, we sent a list of respondents willing to participate in the blood collection to the China
CDC, and the county CDC would begin the blood collection work.
A.7 Field work
1) Obtaining IRB Approval and informed consent
The project team filed an ethical review application to Ethical Review Committee (IRB) at Peking
University in January 2011. After a revision of the Informed Consent section, the survey obtained
approval.
During the field work, every respondent who agreed to participate in the survey had to sign the
informed consent in two copies, the paper material was kept in CHARLS office, which was also
scanned and saved in PDF format for checking later by IRB if necessary. Four separate consents
were obtained: one for the main field work, one for the non-blood biomarkers and one for taking of the

blood samples and another for storage of blood for future analyses.
2) Field work
A mobilization meeting with 28 provincial CDCs took place on March 23rd of 2011, and the work
plan of CHARLS was introduced. With the help of 28 provincial CDCs, the Beijing CHARLS Office
acquired the list and contact information of the informants in the county/district CDCs. These
county/district informants were contacted and trained to know the purpose and work plan of CHARLS.
People in charge of the three selected villages/communities were contacted by the county/district
informants before the arrival of the mapper/lister. The informants would help the mapper/lister
coordinate with grass-root cadres and elicited their cooperation on mapping and listing. If conditions
permitted, the county/district informants assisted in the collection of building distribution information for
the village map construction.
In each county/district, one mapper/lister took about one month to get the mapping/listing
information for the 3 communities or villages. With the help of the grass-root cadres or community
informant, the mapper/lister worked primarily on two tasks: 1) mapping/listing and 2) the community
interview. The original plan was to locate Google Earth base maps based on names of the villages and
load the maps to mapper-PC before sending them to the field. However, because the Google Earth
maps do not contain the boundaries of the villages, it is extremely difficult to know exactly how large an
area to include in the base maps. Thus we decided to send the mapper/lister to the field with a GPS
unit to get the boundary first and then extract the Google Earth map based on this boundary. This
requires sending picture files back and forth many times between the field staff and the headquarters,
with associated quality checks. Considering that some of the villages may not have Google Earth
maps available for mapping, we made separate training materials for these situations. At the end, of
the 450 village-level units, 379 (84.2%) had clear and usable Google Earth maps, 66 (14.7%) of the
villages had maps which were illegible and 5 (1%) had no maps at all. In cases where maps were
illegible or nonexistent, mappers drew maps using CHARLS-GIS software and every mapper/lister
was trained to do this. The mapper also interviewed the chief person in charge of the
village/community to complete the community survey.
Normally, two interviewers were fully responsible for the household survey of 3 communities or
villages in a county. The interviewers carried out the survey using the sample list provided by the
mapper/lister. During the field work, we encountered cooperation difficulties in a few cases. There

were 23 PSUs unwilling to participate our survey and we used personal relationships to coordinate
with the village or community leaders. Ultimately we obtained cooperation in all 150 sampled counties.
When the household refused to interview, more interviewers were sent to try to solve the difficulty.
This occurred in 52 PSUs. For the hardest community, we sent 6 batches of interviewers at most. In
the final stage of the field work, CHARLS office staff went to 11 PSUs to do the interviewing as a
team. As showed in Figure 3, most interviews were completed before August of 2011, but the baseline
field work lasted until March of 2012.
Figure 3 Household progress rate of CHARLS by date
After each county’s interviewing work was done, a list of respondents willing to participate in the
blood collection was sent to the county CDC, which would then begin the blood collection work.
A Computer Assisted Personal Investigation (CAPI) system was adopted in this survey. Each
interviewer had a small laptop that they entered data into while they were interviewing. No paper
questionnaires were used. Use of CAPI greatly enhanced the detection of on-the-spot errors. When
the interviewer entered an answer with a logic error or abnormal value, the system showed a prompt to
caution the interviewer. CAPI also greatly reduced errors due to not correctly following skip patterns in
the questionnaire. Interviewers uploaded the data to the data server in the Beijing office after each
day’s field work.

A.8 Quality control
We made use of the CAPI system to perform quality checks during the field work, using four main
methods: GPS matching, data checking, recording and checking interviews and calling back.
For GPS matching, we compared the GPS information collected during mapping/listing with that
collected at the interviewing stage. We also used photos of the dwelling taken using mapping/listing
and at the interview to ensure we located the sampled households.
During the survey, a programmer in the CHARLS central headquarters would check the data of all
interviewers, looking for excessively missing data and excessively short interviews. In addition the
first two households interviewed by each interviewer were be selected for checking the sound
recording, to ensure that the interview took place and for certain sections, that questions were being
asked correctly and well.. If the sound recording checking did not work because of a technical problem
or for other reasons, these households were to be called back by central office staff. For example, data
might have indicated that a number of respondents had no job during his or her entire life, but it may
have been due to interviewer mistakes. Another example checked was cases in which a respondent
missed an entire section of the interview, such as on wealth.
The households that failed to do the sound recording for technical or other reasons were contacted,
by phone if possible, to see if they in fact had been visited by CHARLS interviewers and the data
properly collected. If any misconduct was found during data checking, sound recording checking or
calling back checking, we expanded the samples to check of that specific interviewer.
A.9 Data Cleaning
In addition to coding the occupation and sectors discussed above, we did some basic cleaning of
the data and performed further data checks after the field work.
We checked skip patterns in the data, some questions should not be asked based on previous
answers. For instance, once a respondent tells us that a doctor had diagnosed his or her hypertension,
the question of whether the respondent knew that he or she had hypertension should be skipped. We
checked all skip patterns in the data and corrected the data which contained incorrect skip patterns (if
this existed, it was generally from CAPI programming errors).
Following this, we checked for data inconsistencies. A good example of this would be a respondent
reporting wage income in the work module, but not reporting income in the individual income module.

We will conduct further checks as we obtain feedback from users.

Appendix B. Introduction to the CHARLS-GIS
During the household sampling stage, there were no pre-existing high quality sampling frames at
the community level in China. We computerized the mapping/listing operation and developed software
we call CHARLS-GIS.
B.1 General Introduction to CHARLS-GIS
By using Google earth map or maps from other resources as base, the CHARLS-GIS software can
be used to complete listing of dwellings within a building, do random sampling, record GPS and photos
of each building and each door of the sample dwelling. A major advantage of the software over
paper/pencil mapping/listing is that it is more accurate, easier to locate sample households, and easier
for quality control. Except for the CHARLS-GIS software, the equipment we used during mapping and
listing procedure included one HP mini 5102 laptop with a touch screen, long battery life and
micro-camera, and one GPS with USB power supply.
B.2 Work flow using CHARLS-GIS
There are four steps to make final sampling for one PSU: including boundary taking, mapping and
listing, primary sampling and final sampling as shown in Figure 4.
Figure 4 The work flow using CHARLS-GIS
For each village or community (PSU), the mapper/lister carrying the EPC and GPS equipment
confirmed the boundary of each PSU by circling the village or community. After quality checking by a
supervisor in the central CHARLS office, the boundary map and GPS information (Figure 5) was sent
to our sub-contractor (the Geography Institute of the Chinese Academy of Sciences) to get a base map

of the PSU (Figure 6).The base map was from Google-map or other resources.
Figure 5 Boundary with GPS information for one PSU
Figure 6 Boundary with the base map

Figure 7. The map after mapping and listing
Then, all buildings in each PSU were marked, and dwellings within each building were listed and
coded using standardized methods. Figure 7 shows a sample map with marked buildings after the
mapping and listing procedure. Different colours indicate different types of building; for example, green
is residential and brown is school. For each building, we collected information on the building type,
name, address, photo and GPS coordinates of the building (Figure8).
Figure 8. Building information collected when drawing the building

Figure 9. Dwellings information in one building collected when listing
After the mapping and listing work in each village or community was complete, all related data was
sent to the central CHARLS office in Beijing. Then the sampling frame for that PSU was checked and
the supervisors used CHARLS-GIS software to randomly sample 80 households. This sample was
then sent back to the mappers/listers in the field for them to collect information on the sampled
households, including age of the oldest person, name of household head, the telephone number,
whether the dwelling was empty or not, and also the GPS and photo of each dwelling (Figure 9).
Figure 10 shows the map of 80 households marked with red flag.
Figure 10. The map of 80 household marked with red flag after primary sampling
The number of households sampled was greater than the targeted sample size of 24 households

per PSU in anticipation of sampled households’ not having any members aged 45 or older, the
possibility of an empty house and household non-response either because the household was not
found or because they refused. Based on the information sent back by the mappers/listers on
age-eligible rates in the community/village and the rate of empty dwellings, the supervisor randomly
sampled a specific number of households for each community/village using the CHARLS-GIS software.
After this final sampling work for the PSU was completed, the specific household information was
returned to the mappers/listers, who sent ‘A letter to the respondent’. Simultaneously, the IT persons in
the central CHARLS office transferred the sampled household lists and addresses for a given PSU to
the interviewer’s CAPI system.

Appendix C. Proxy Respondents
In this national baseline survey, a knowledgeable proxy respondent was allowed under very
special circumstances when the respondent could not complete the survey. When only part of the
required section was answered by others, we recorded the way in which each module was answered,
including information regarding the proxy respondent. When the selected respondent was absent or
was totally unable to answer the questions, the interviewer needed to call a designated central office
staff in the Beijing project office to apply for a proxy code. The office staff checked by asking some
specific reasons for the proxy request. If the request was approved, the interviewer received a proxy
code and proceeded to the “complete substitution” mode. Then the CAPI system automatically
switched to the substitution mode before entering the first module. Compared with the normal mode,
the proxy respondent was asked only a subset of questions. As shown in Table 5, the overall proxy
rate was 8.7%. The rate was higher for men (11%) than women (6%). For men the proxy rate was
highest for the youngest men, under 50 years, probably because they were working and could not be
interviewed. For women, it was the oldest (over 75) who had the highest proxy rates, because they
needed help in answering the questions.

Appendix D. Detailed description of biomarkers
The interviewers who conducted the county-level interviews also carried equipment for and
conducted measurements of biomarkers in respondents’ households. These included the
anthropometric measurements of height, weight, waist circumference, lower right leg length and upper
arm length, lung capacity, grip strength, speed of repeated sit to stand, blood pressure, walking speed,
and balance tests. Table 2 showed the biomarkers and equipment used. Every two interviewers share
one trolley case of equipment to do all the measurements5. The CAPI system randomly chose some
interviews to take a photo of health measurements, for quality control. Most biomarkers were
measured by standard methods. Before each measure, respondents were asked whether they
understood the directions for the measurement and if they felt safe completing it. If the respondent
answered no to either question, the measure was not administered. Likewise, interviewers were
instructed not to administer a measure if they did not feel it was safe to complete it. Respondents were
instructed not to eat, drink, smoke, chew gum or brush their teeth when measurements were being
taken. The measures and protocols used are almost the same as HRS.
D.1 Blood pressure and pulse
Sample: All those meeting criteria described above were included unless the respondent reported
having a rash, a cast, edema or swelling in the arm, open sores or wounds or a significant bruise
where the blood pressure cuff will be in contact.
Measure: Three measurements, 45 seconds apart, were taken on the respondent’s left arm. Data
recorded for each measurement include systolic and diastolic blood pressure, pulse, and the time of
day the reading was taken.
Protocol: Respondents were instructed to sit down with both feet on the floor and their left arm
comfortably supported (on a table for example) with the palm facing up. Respondents were asked to
roll their sleeve up unless they had on a short sleeve shirt or a thin shirt. The cuff was adjusted to the
respondent’s arm ensuring that it made direct contact with the skin, the bottom of the cuff was
approximately half an inch above the elbow and the air tube ran down the middle of the respondent’s
arm. The interviewer pressed the start button. The cuff inflated automatically and then deflated while
displaying the systolic and diastolic blood pressure and pulse. The interviewer recorded the systolic
5 A CES-D depression scale and measures of cognition were included in the household questionnaire and venous blood samples were collected by local CDC staff in field work that followed the main survey.

and diastolic blood pressure and pulse, as well as the time of the reading. The interviewer used a stop
watch and waited 45-60 seconds before beginning the next measurement.
D.2 Lung function
Sample: All respondents meeting criteria described above were included.
Measure: Three measurements, 30 seconds apart, were conducted.
Protocol: The interviewer handed the peak flow meter and a disposable mouthpiece to the
respondent and asked that they place the mouthpiece firmly on the meter. Respondents were
instructed to stand up, take a deep breath, place their lips around the mouthpiece and blow as hard
and as fast as possible. The interviewer recorded the value indicated by the pointer and reset the
meter. The interviewer used a stop watch and waited 30 seconds before beginning the next measure.
D.3 Hand grip strength
Sample: All those meeting criteria described above were included unless the respondent reported
having had surgery in the hands, swelling, inflammation, severe pain or injury in both hands in the past
six months. If any of these symptoms were present in only one hand, the measurement was conducted
with the other hand.
Measure: Two measurements were taken for each hand, alternating hands.
Protocol: The dynamometer was fit to the respondent’s hand and the respondent practiced once
with their dominant hand in a standing position with their arm at their side at a 90 degree angle. The
respondent was instructed to squeeze the meter as hard as they were able for a couple of seconds
and to then let go. After the practice measurement, the respondent was instructed to switch to their
nondominant hand. Two measurements were taken with each hand, alternating hands. After each
measurement, the interviewer recorded the result and handed the dynamometer back to the
respondent.
D.4 Balance test
Sample: All those meeting criteria described above were included unless the respondent was
unable to stand unassisted for at least one minute. All respondents attempted the Semi-Tandem stand.
If they were able to hold this stand for 10 seconds, they were then asked to do the Full Tandem stand.
Respondents aged 70 or older were asked to complete a 30 second balance test while those younger
than 70 were asked to complete a 60 second balance test. If they were unable to hold the
Semi-Tandem for 10 seconds, they were asked to perform the Side-by-Side Tandem stand.

Interviewers were instructed to discuss the respondent’s ability to conduct each individual test of
balance if the respondent reported problems from recent surgery, injury or other conditions that might
prevent them from standing up from a chair and balancing.
Measure: Up to two of the following measures of balance were conducted: Full Tandem,
Semi-Tandem, Side-by-Side.
Protocol for Semi-Tandem: The respondent was asked to stand up with the side of the heel of one
foot touching the big toe of the other foot for about 10 seconds. The respondent could put either foot in
front and use their arms, bend their knees or move their body to maintain balance, but was instructed
to try not to move their feet. If necessary, the interviewer was instructed to gently support the
respondent’s arm to help them get into the semi-tandem position. The interviewer stood to the side of
the respondent to be in position to assist if a respondent lost his/her balance. The respondent was
instructed to try to hold this position until told to stop. The interviewer stopped the stopwatch after 10
seconds or when the respondent stepped out of position or grabbed the interviewer’s arm.
Protocol for Full-Tandem: Same protocol as for semi-tandem, except that the respondent was
asked to stand to stand with the heel of one foot in front of and touching the toes of the other foot for
about [30/60] seconds. The interviewer stopped the stopwatch after [30/60] seconds or when the
respondent stepped out of position or grabbed the interviewer’s arm.
Protocol for side by side: Same protocol as for semi-tandem, except that the respondent was
asked to stand to stand with both feet together, side-by-side, for about 10 seconds. The interviewer
stopped the stopwatch after 10 seconds or when the respondent stepped out of position or grabbed
the interviewer’s arm.
D.5 Timed walk
Sample: All respondents aged 60 years or older meeting the criteria described above and who do
not have any problems from recent surgery, injury, or other health conditions that might prevent them
from walking were eligible for the timed walk test. Additionally, sufficient space was necessary to
conduct the test. A clear, preferably non-carpeted area, approximately 2.5 meters in length was
needed to set up the walking course.
Measure: Respondents were timed as they walked the 2.5 meters course two times (there and
back).
Protocol: The interviewer set up a walking course by placing the tape measure on the floor to

measure the full distance. The interviewer placed a strip of masking tape, approximately 1 meter long,
on the floor to mark the starting and ending points of the course. The interviewer retrieved the tape
measure from the floor and instructed the respondent to place their toes at the start of the course. The
interviewer said, “Ready, begin” to signal to the respondent to begin walking. The interviewer started
the stop watch once the respondent’s foot was across the starting line and fully touching the floor. The
respondent was instructed to walk at their normal pace just past the end of the course. The interviewer
stopped the stop watch as soon as the respondent’s foot was completely past the masking tape
marking the finish line and fully touched the floor. The interviewer reset the stop watch and instructed
the respondent to walk back to the other side. The interviewer timed the second walk as well and
recorded the information.
D.6 Upper arm length
Sample: All respondents who met the criteria described above were eligible for this measure.
Measure: The respondent’s upper arm length was measured by using a Martin caliper.
Protocol: The respondent turn away from interviewer and stand upright with the weight evenly
distributed on both feet, the right arm bent 90º at the elbow. Put the fixed end of Martin caliper at the
olecranon process and slide the slider up to the acromion process of scapula and get the reading.
D.7 Lower leg length
Sample: All respondents who met the criteria described above were able to sit were eligible for
this measure.
Measure: The respondent’s lower leg length was measured by using a Martin caliper.
Protocol: The respondent sit on the chair with the right knee bent at a 90 º angle. The interviewer
need to squat at the right side, put the fixed end of Martin caliper under ankle of the heel and slide the
slider up to the proximal border of patella and get the reading.
D.8 Repeated chair stand
Sample: All respondents who met the criteria described above and were able to stand were
eligible for this measure.
Measure: Five repetitions of sit-to-stand.
Protocol: Keep respondent’s arms folded across the chest. When the interviewer says ‘ready?
Stand! ’ , the respondent stand up straight and then sit down again at their fastest pace five times
without stopping in between and without using the arms to push off. If the respondent complete the test,

the interviewer record the time used, otherwise record the times when failed.
D.9 Height
Sample: All respondents who met the criteria described above and were able to stand were
eligible for this measure.
Measure: The respondent’s height was measured by using a stadiometer.
Protocol: The respondent removes the shoes and stands erect on the floor board of the
stadiometer with the back to the vertical backboard of the stadiometer. The respondent’s weight should
be evenly distributed on both feet. The heels of the feet are placed together with both heels touching
the base of the vertical board. Place the feet pointed slightly outward at a 60 degree angle. The
respondent’s head should be maintained in the Frankfort Horizontal Plane position. The interviewer
slides the head plate to touch the respondent’s head slightly and record the reading.
D.10 Weight
Sample: All respondents who met the criteria described above were eligible for this measure
unless their self-reported current weight (collected earlier in the interview) was 150kg or greater, or
they were unable to stand.
Measure: Respondents were asked to step on a scale to measure their weight.
Protocol: An appropriate spot to place the scale, preferably a non-carpeted area, was identified.
Respondents were instructed to remove their shoes, any bulky clothing and heavy objects from them
pockets. The interviewer tapped the scale and waited until a “0.0” appeared in the display. The
respondent stepped up on the scale and stood on it until the weight was displayed. The interviewer
recorded the respondent’s weight.
D.11 Waist size
Sample: All respondents who met the criteria described above and were able to stand and raise
their arms to place the tape measure around their waist were eligible for this measure.
Measure: The respondent’s waist circumference was measured at the level of their navel.
Protocol: Respondents were asked to stand up and remove any bulky clothing. The respondent
was asked to point to their navel and to place the tape measure around their waist at the level of their
navel. The interviewer checked to be sure that the tape measure was horizontal around the waist and
snug but not tight. The respondent was instructed to inhale and slowly exhale, holding their breath at
the end of the exhale. The tape measure was adjusted if necessary and the waist circumference

measured while holding the exhale.

Table 1 Summary of data collected in household questionnaire
Demographic information (main respondent and spouse)
Birth date and birth place
Residence and migration
Hukou information
Education
Marital status and history
Work, retirement and pension
Current job status
Work history
Detailed information on current main job
Unemployment and job search activities
Most recent job (if currently not working)
Retirement
Pension
Household roster (nonrespondent household members)
Sex, birth date, marital status
Relationship with the main respondent
Hukou informationa
Education
Income, expenditures and assets
Household income and expenditures
Household assets
Individual assets
Family
All parents and children:
demographics
Education
Occupation
For deceased: time of death
Siblings: simple aggregate information
Interactions of each family member:
Time spent caring for parents
Visits from children
Two-way financial exchanges with parents and children
Housing characteristics
Construction materials
Home facilities
Cleanliness and temperature
Health status and functioning
Self-reported general health
Doctor diagnosed chronic and infectious disease
eye, hearing, oral health, pain
accidents, fall, fracture
Lifestyle and life behavior including sleep, physical
activity, social connectedness, diet, smoking and drinking
Functional limitations and helpers
Cognition depression
Health vignettes
Interviewer observation
Interference during interviews;
attitude and comprehensive ability of respondent
Health care and insurance
Current and past medical insurance
Health care utilization: outpatient and inpatient care
Health care costs and payment methods

Table 2 Summary of biomarkers and equipment used
Variables Number of
measurements
Equipment used Manufacturer/source
Blood pressure Three, at 45-second
intervals
OmronTM HEM-7112 Monitor Omron (Dalian) Co., LTD., Dalian,
China
Pulse Three, at 45-second
intervals
OmronTM HEM-7112 Monitor Omron (Dalian) Co., LTD., Dalian,
China
Peak expiratory
flow
Three, at 30-second
intervals
EverpureTM Peak flow meter with a
disposable mouthpiece
Shanghai Everpure Medical Plastic
Co. LTD., Shanghai, China
Hand grip strength Two readings for each
hand
YuejianTM WL-1000 dynamometer Nantong Yuejian Physical
Measurement Instrument Co., LTD.,
Nantong, China
Balance tests One Tandem, semi-tandem, side-by-side
diagram showing foot positions; stop
watch
Timed walk Two repetitions of 2.5
meters, normal speed
Tape measure, masking tape, and stop
watch
Upper arm length One, left arm DongfangTM XTCL-I Martin rule Shijiazhuang Eastern Metal Product
Co., LTD. Shijiazhuang, China
Lower leg length One, left arm DongfangTM XTCL-I Martin rule Shijiazhuang Eastern Metal Product
Co., LTD. Shijiazhuang, China
Repeated chair
stand
Five repetitions of
sitting-to-standing
positions
Chair (height: 47cm); stop watch
Height One SecaTM213 stadiometer Seca Trading (Hangzhou) Co., LTD.,
Hangzhou, China
Weight One OmronTM HN-286 scale Krell Precision (Yangzhou) Co.
LTD., Yangzhou, China
Waist size One Soft measure tape
Venous blood
sample
8ml Standard blood-taking materials
Depression One Ten-item CES-D scale
Cognition One Several measures from Telephone
Interview of Cognition
Status form (self-rated memory,
today’s date, day of the
week, and current season); recall and
delayed recall test
of memory of 10 words; test of serial
subtractions of 7
from 100; ability to reproduce a
picture of two overlapped
pentagons
HRS; see McArdle, J.J., Fisher, G.G.
and Kadlec, K.M. (2007)

Table 3 Sample Size and Response rate (%)
Total Rural Urban Total Sampled Households 23,422 10,597 12,825
Empty household 4,341 1,914 2,401 Target Households 19,081 8,683 10,424 Age-eligible rate 66.77% 73.80% 59.04% Eligible households 12,740 6,408 6,154 Responded households 10,257 6,033 4,224 Response rate 80.51% 94.15% 68.63% *Response rate is based on the age-eligible households.

Table 4 Number and age/sex structure of individuals Age Group Total
Gender Hukou Residence Male Female Urban Rural Urban Rural
-50 25.77 23.42 27.91 23.79 26.56 27.35 24.18 51-55 15.49 16.00 15.02 14.06 16.07 15.11 15.87 56-60 19.00 19.32 18.69 18.68 19.12 18.65 19.34 61-65 13.88 14.78 13.07 14.13 13.78 13.19 14.58 66-70 9.62 10.20 9.08 9.82 9.53 9.02 10.21 71-75 7.17 7.84 6.56 9.51 6.23 7.64 6.70 76-80 4.67 4.73 4.61 5.32 4.40 4.60 4.73 80+ 4.41 3.71 5.05 4.69 4.30 4.44 4.38
OBS 17,587 8,436 9,151 3,872 13,715 7,106 10,481
Individuals without age, gender, or hukou information are excluded from this table.

Table 5 Proxy rate by Age and Gender
Age group Total Interview Proxy
Freq Frac (%) Freq Interview rate(%) Freq proxy rate (%)
Total
Total 17,708 - 16,169 91.31 1539 8.69 Under 50 3,927 22.18 3,541 90.17 386 9.83 50-59 6,098 34.44 5,551 91.03 547 8.97 60-69 4,727 26.69 4,434 93.80 293 6.20 70+ 2,923 16.51 2,621 89.67 302 10.33
Male
Total 8,476 - 7,545 89.02 931 10.98 Under 50 1,647 19.43 1,395 84.70 252 15.30 50-59 2,991 35.29 2,619 87.56 372 12.44 60-69 2,379 28.07 2,213 93.02 166 6.98 70+ 1,448 17.08 1,311 90.54 137 9.46
Female
Total 9,232 - 8,624 93.41 608 6.59 Under 50 2,280 24.7 2,146 94.12 134 5.88 50-59 3,107 33.65 2,932 94.37 175 5.63 60-69 2,348 25.43 2,221 94.59 127 5.41 70+ 1,475 15.98 1,310 88.81 165 11.19

Table 6 Biomarker rate by Age and Gender
Age group
Total Male Female Freq Biomarker rate (%) Freq Biomarker rate (%) Freq Biomarker rate (%)
Total 13974 78.91 6532 77.06 7442 80.61 Under 50 2945 74.99 1144 69.46 1801 78.99 50-59 4765 78.14 2274 76.03 2491 80.17 60-69 3923 82.99 1953 82.09 1970 83.90 70+ 2326 79.58 1158 79.97 1168 79.19

Table 7 Median of completed time to each module
Age group Median Minutes
Male Female Total Coverscreen Total 9.43
Demographics
Under 50 4.43 4.55 4.5 50-59 4.62 4.57 4.6 60-69 4.97 4.83 4.92 70+ 5.63 5.75 5.68 Total 4.82 4.78 4.8
Family
Under 50 23.32 24.8 23.96 50-59 26.47 26.58 26.52 60-69 29.23 29.38 29.33 70+ 32.81 32.46 32.62 Total 27.53 27.68 27.65
Health Care
Under 50 3.47 3.77 3.62 50-59 3.75 4.04 3.88 60-69 4.44 4.33 4.38 70+ 4.75 4.45 4.55 Total 4.03 4.1 4.07
Health Status
Under 50 19.13 20.27 19.82 50-59 21.13 21.48 21.3 60-69 23.41 22.57 22.95 70+ 23.97 23.07 23.65 Total 21.88 21.67 21.75
Household Income and Assets
Under 50 17.13 17 17.02 50-59 16.84 16.66 16.77 60-69 16.94 15.89 16.43 70+ 14.53 12.96 13.82 Total 16.52 16.02 16.25
Inidividual Income and Assets
Under 50 3.95 3.82 3.88 50-59 4.07 3.89 3.98 60-69 4.25 3.83 4.05 70+ 4.25 3.82 4.03 Total 4.12 3.85 3.98
Work and Retirement
Under 50 8.07 6.35 7.15
50-59 7.47 5.83 6.53
60-69 7.13 5.38 6.08
70+ 6.48 5.33 5.83
Total 7.37 5.73 6.4

Table 8 Logit Regression for participation in Biomarkers
Independent Variables Coefficient Std. Female 0.650*** 0.088
Age groups 50- (reference) 50-59 0.331*** 0.08 60-69 0.802*** 0.09 70+ 0.681*** 0.104
Female cross age groups Female & 50-59 -0.319*** 0.113 Female & 60-69 -0.470*** 0.126 Female & 70+ -0.764*** 0.139
Education groups Illiteracy (reference) Literate 0.014 0.075 Primary -0.051 0.073 Junior and Above -0.239*** 0.073
Constant 1.900*** 0.387 Community dummies Yes Observations 17708

Table A.1 Research Team List Position Name Institute
Principal Investigator Zhao Yaohui CCER at Peking University
PI John Strauss University of Southern California
PI Yang Gonghuan Chinese CDC
Co-PI Peifeng Hu University of California, Los Angeles
Co-PI (for blood
analysis competing revision)Eileen Crimmins University of Southern California
Co-PI Albert Park Hong Kong University of Science and
Technology
Co-PI John Giles World Bank
Key Member Wang Dewen The World Bank Beijing Representative
Office
Key Member Zeng Yi CCER at Peking University
Key Member Shen Yan CCER at Peking University
Key Member Lei Xiaoyan CCER at Peking University
Key Member Li Lixing CCER at Peking University
Key Member Shi Xinzheng Tsinghua University
Key Member Wu Xiaoyu Central University of Finance and
Economics
Key Member Yin Xiangjun Chinese Centre for Disease Control and
Prevention
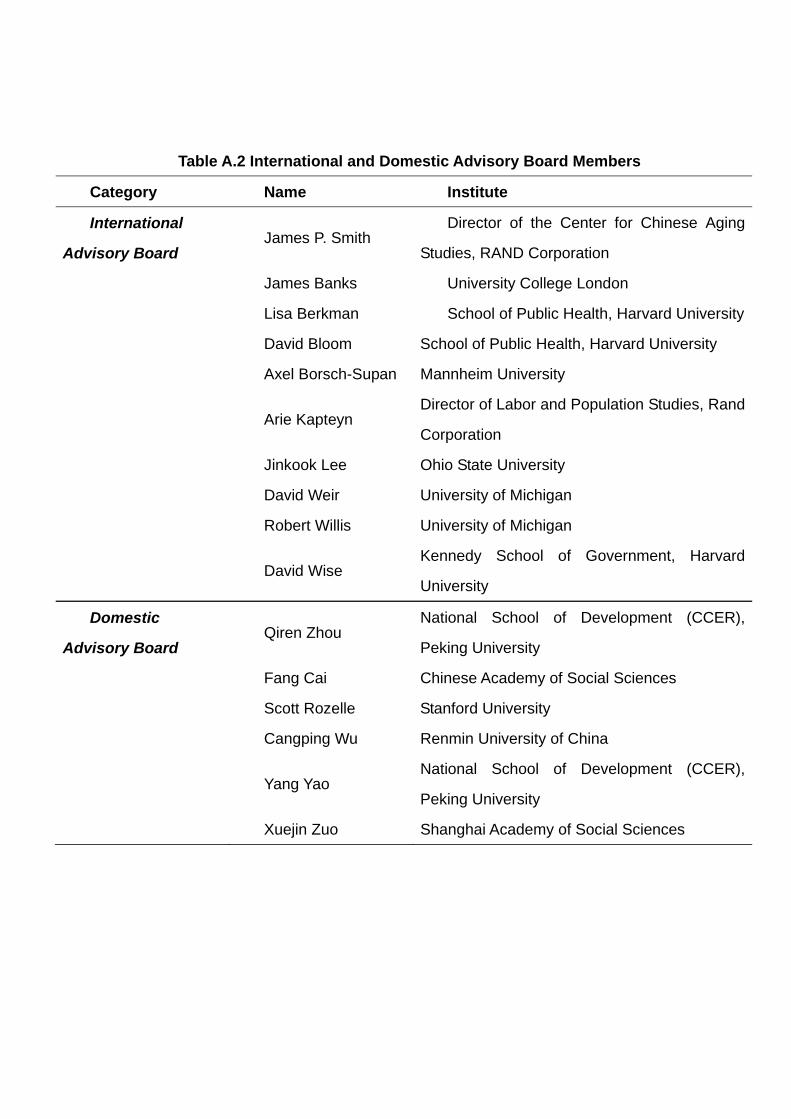
Table A.2 International and Domestic Advisory Board Members
Category Name Institute
International
Advisory Board James P. Smith
Director of the Center for Chinese Aging
Studies, RAND Corporation
James Banks University College London
Lisa Berkman School of Public Health, Harvard University
David Bloom School of Public Health, Harvard University
Axel Borsch-Supan Mannheim University
Arie Kapteyn
Director of Labor and Population Studies, Rand
Corporation
Jinkook Lee Ohio State University
David Weir University of Michigan
Robert Willis University of Michigan
David Wise
Kennedy School of Government, Harvard
University
Domestic
Advisory Board Qiren Zhou
National School of Development (CCER),
Peking University
Fang Cai Chinese Academy of Social Sciences
Scott Rozelle Stanford University
Cangping Wu Renmin University of China
Yang Yao
National School of Development (CCER),
Peking University
Xuejin Zuo Shanghai Academy of Social Sciences