china eastern airlines 2012 interim results announcement · china eastern airlines ... depreciation...
TRANSCRIPT

1
China Eastern Airlines
2012 Interim Results
Announcement
(IFRS)
2012.09.03

2
This presentation contains forward-looking forecast and statements that reflect
the presenting company’s current opinions on future events and its future
financial performance. These opinions were based on certain assumptions,
which were determined by various risk factors and subject to change. This
presentation does not give the assurance that the events predicted will actually
occur, the forecast will materialize, or the assumptions made were correct. The
actual results may deviate materially from the forecast.
This presentation is prepared under IFRS. Except for otherwise stated, 1H2012,
2011 and 2010 financial and operating figures include Shanghai Airlines
Company Limited, while 2009 and prior years do not. 2012 financial figures are
VAT-based, while 2011 and prior years are based on business tax.
Disclaimer

3
1H12 Market Analysis
1H12 Operating Results
2H12 Operating Plan

4
1H2012 Internal / External Environment
Challenges Opportunities
Macro economy
Industry development
Slower global economic recovery,
weakness in mature markets such
as US and EU, and slower GDP
growth in China
Global oil prices remain high
The pace of RMB appreciation
slowed down, with the exchange rate
turning downward in 1H2012
Per capita income of domestic
residents continued to rise, with the
wealth effect further released
Monetary policies further liberalized
with interest cut
The cargo market remains weak. In
1H2012, the airline industry delivered a
total cargo and mail traffic of 2.525
million tons, down 5.0% on a YoY basis
The impact from high-speed rails has
been normalized
In 1H2012, the domestic airlines
industry witnessed a total traffic of
151 million person times, up by 8.7%
on a YoY basis
Outbound tourists totaled 38.5
million, up by 19% on a YoY basis,
and demand on international routes
remains robust
The global economic environment turned out to be more complicated in 2012, bringing
both opportunities and challenges to the industry. The passenger market continues to
grow steadily, yet the cargo market remains relatively weak.

5
1H2012 Market Features
Slower passenger demand growth
Less business travelers, yet more tourists and casual travelers
The demand dynamics are changing rapidly, demonstrating stronger
seasonal characteristics
The yield of domestic routes has been improved
The operating capability of international routes has been enhanced,
with the passenger load factor substantially improved
Regional routes:Hong Kong routes shrank while Taiwan routes
increased
The cargo market remains weak
1
2

6
Optimize the capacity allocation based on
changing market dynamics 1
2 Tap into our business potentials with
innovative product offerings
3 Expand customer resource by strengthening the
construction of transportation hubs
Key Operating Strategies in 1H2012
7
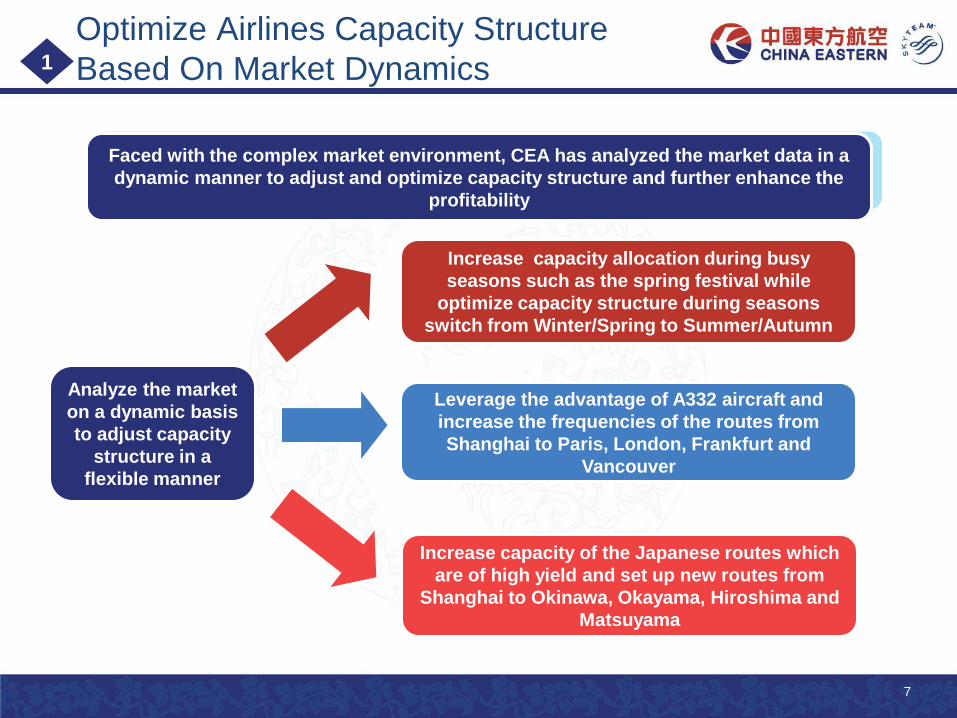
Optimize Airlines Capacity Structure
Based On Market Dynamics
Faced with the complex market environment, CEA has analyzed the market data in a
dynamic manner to adjust and optimize capacity structure and further enhance the
profitability
1
Analyze the market
on a dynamic basis
to adjust capacity
structure in a
flexible manner
Increase capacity allocation during busy
seasons such as the spring festival while
optimize capacity structure during seasons
switch from Winter/Spring to Summer/Autumn
Leverage the advantage of A332 aircraft and
increase the frequencies of the routes from
Shanghai to Paris, London, Frankfurt and
Vancouver
Increase capacity of the Japanese routes which
are of high yield and set up new routes from
Shanghai to Okinawa, Okayama, Hiroshima and
Matsuyama

8
Innovate On Products to Tap
Operation Potential 2
Promote new products
according to the
seasonal and regional
market features Cooperate with
railway bureau to
enhance market
control in the Yangtze
River Delta
Accelerate launches of
core products
1
Innovate on products to
increase profitability
2
3
9
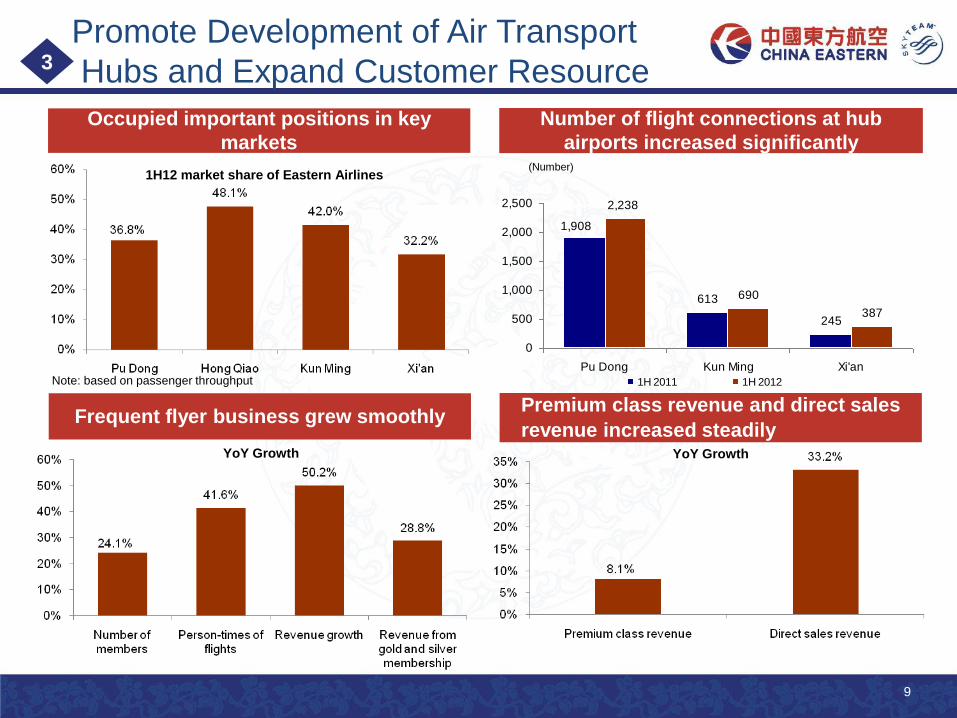
613
245
690
387
1,908
2,238
0
500
1,000
1,500
2,000
2,500
Pu Dong Kun Ming Xi'an
1H 2011 1H 2012
Premium class revenue and direct sales
revenue increased steadily
Promote Development of Air Transport
Hubs and Expand Customer Resource
Occupied important positions in key
markets
Note: based on passenger throughput
1H12 market share of Eastern Airlines
Number of flight connections at hub
airports increased significantly (Number)
Frequent flyer business grew smoothly
YoY Growth
3
YoY Growth
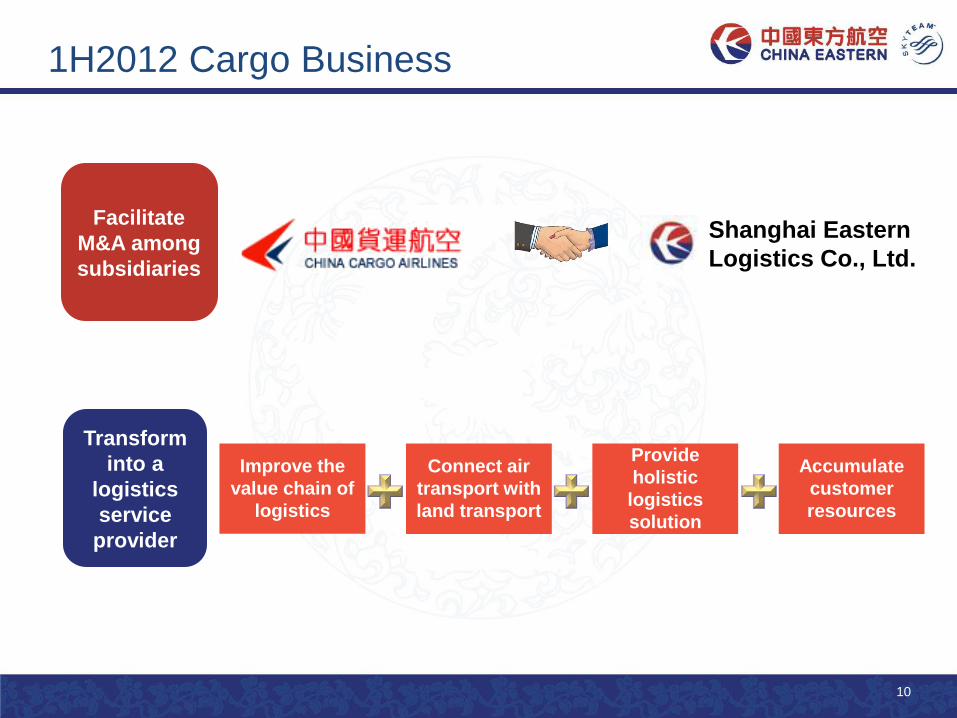
10
1H2012 Cargo Business
Facilitate
M&A among
subsidiaries
Transform
into a
logistics
service
provider
Shanghai Eastern
Logistics Co., Ltd.
Improve the
value chain of
logistics
Connect air
transport with
land transport
Provide
holistic
logistics
solution
Accumulate
customer
resources

11
1H12 Market Analysis
1H12 Operating Results
2H12 Operating Plan

12
1H2011 1H2012 YoY Change
Available tonne-kilometers (ATK) (million)
8,801 9,537 8.36%
Available seat-kilometers (ASK) (million)
62,299 65,191 4.64%
Available freight tonne-kilometers (AFTK) (million) 3,194 3,670 14.89%
Revenue tonne-kilometers (RTK) (million) 6,251 6,861 9.75%
Revenue passenger-kilometers (RPK) (million)
48,564 51,546 6.14%
Revenue freight tonne-kilometers (RFTK) (million)
1,921 2,267 18.00%
Passenger number (1,000) 33,246 34,614 4.12%
Cargo freight volume (million kilogram) 666 682 2.37%
Number of aircrafts 362 395 9.12%
Passenger load factor (%) 77.95 79.07 1.12pts
Freight load factor (%) 60.14 61.77 1.63pts
Daily utilization (hours) 9.8 9.7 -1.02%
Selected Operating Data
13
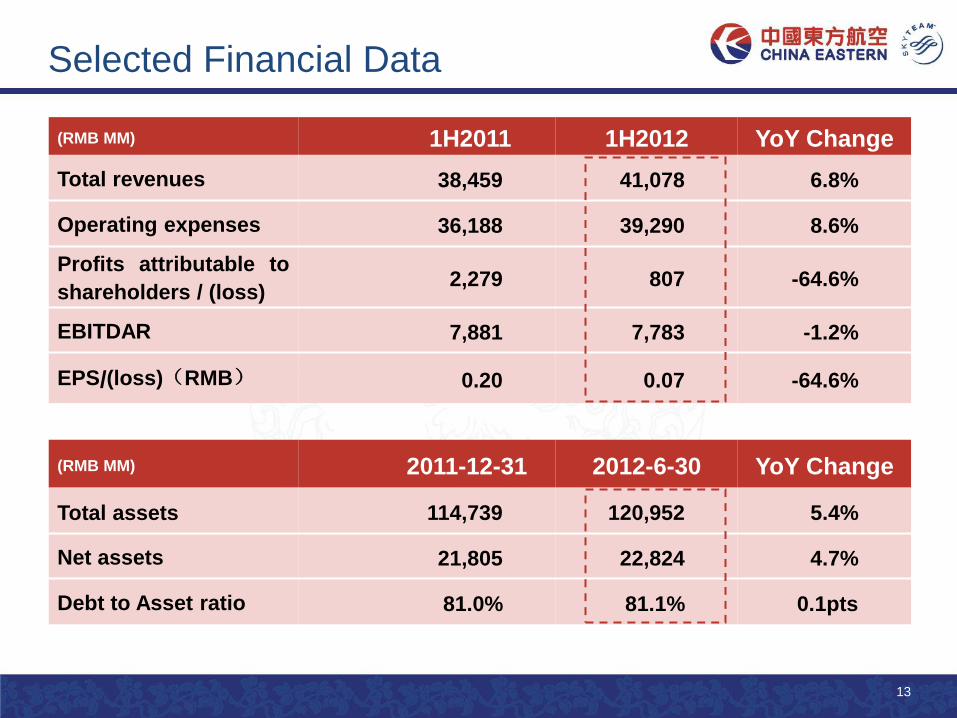
(RMB MM) 1H2011 1H2012 YoY Change
Total revenues 38,459 41,078 6.8%
Operating expenses
36,188 39,290 8.6%
Profits attributable to
shareholders / (loss) 2,279 807 -64.6%
EBITDAR 7,881 7,783 -1.2%
EPS/(loss)(RMB)
0.20 0.07 -64.6%
(RMB MM) 2011-12-31 2012-6-30 YoY Change
Total assets 114,739 120,952 5.4%
Net assets 21,805 22,824 4.7%
Debt to Asset ratio 81.0% 81.1% 0.1pts
Selected Financial Data
14
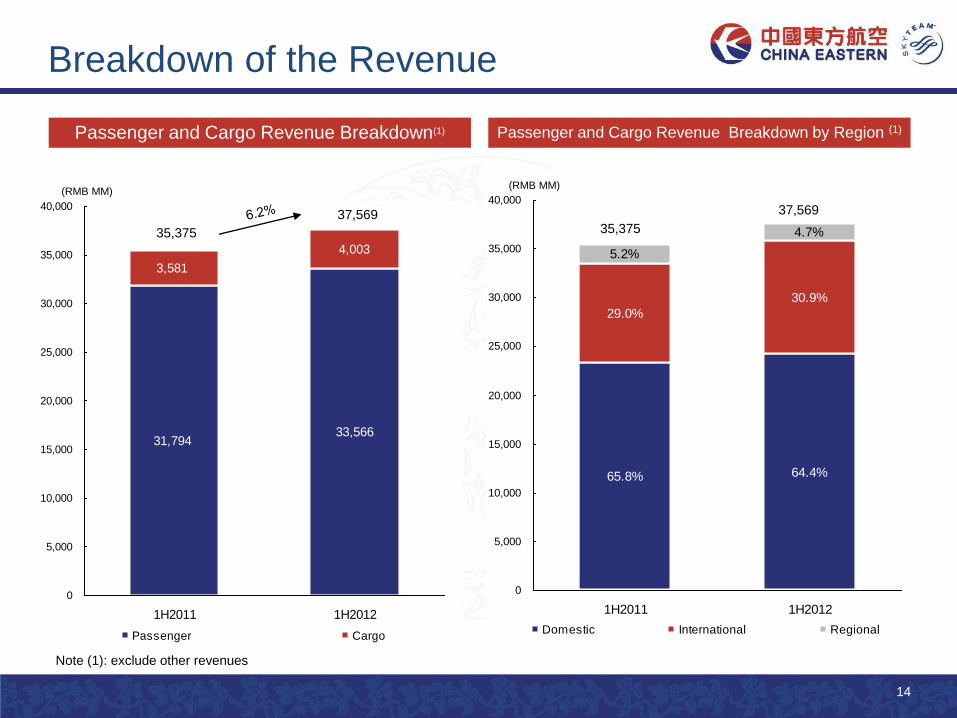
31,79433,566
3,581
4,003
0
5,000
10,000
15,000
20,000
25,000
30,000
35,000
40,000
1H2011 1H2012
Passenger Cargo
Passenger and Cargo Revenue Breakdown(1) Passenger and Cargo Revenue Breakdown by Region (1)
Breakdown of the Revenue
Note (1): exclude other revenues
(RMB MM)
65.8% 64.4%
29.0%
30.9%
5.2%
4.7%
0
5,000
10,000
15,000
20,000
25,000
30,000
35,000
40,000
1H2011 1H2012
Domestic International Regional
(RMB MM)
35,375
37,569 35,375
37,569

15
35.375
37,569
2,009
588
889(1,292)
33,000
34,000
35,000
36,000
37,000
38,000
39,000
40,000
1H2011 passenger and cargo revenue
Capacity Load factor Price VAT impact 1H2012 passenger and cargo revenue
35.375
37,569
2,624
929
(66)
(1,292)
33,000
34,000
35,000
36,000
37,000
38,000
39,000
40,000
1H2011 passenger
and cargo revenue
Domestic factor Int'l factor Regional factor VAT impact 1H2012 passenger
and cargo revenue
Factors Contribution by Region (1)
Driving Factors Contribution (1)
Revenue Change
Note (1): exclude other revenues
(RMB MM)
(RMB MM)
16
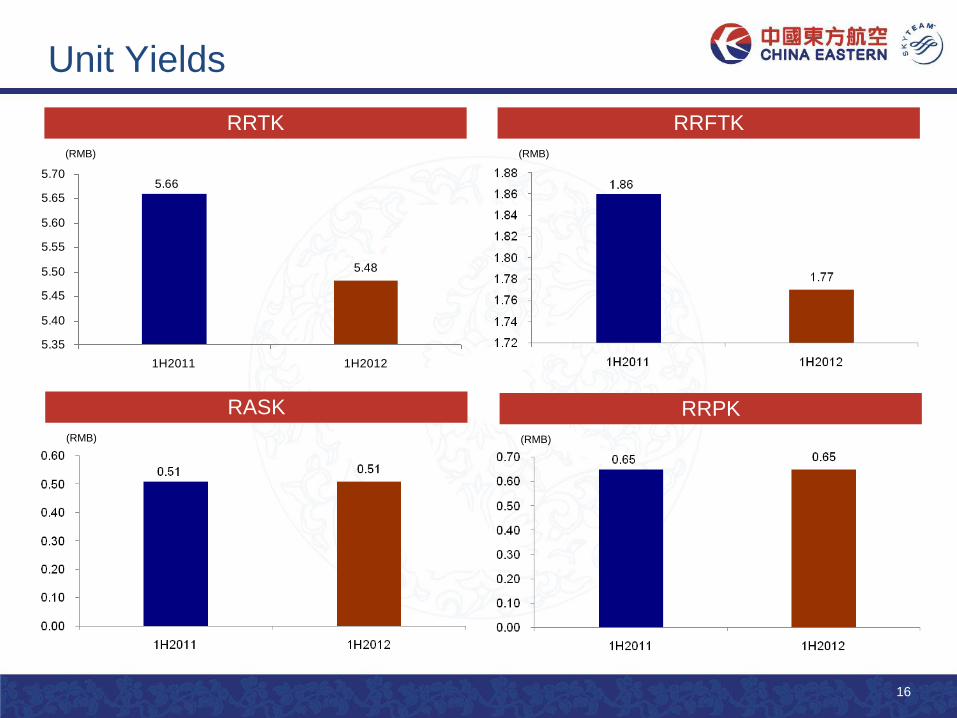
Unit Yields
RRPK
(RMB)
RRFTK
(RMB)
RRTK
(RMB)
5.48
5.66
5.35
5.40
5.45
5.50
5.55
5.60
5.65
5.70
1H2011 1H2012
RASK
(RMB)
17
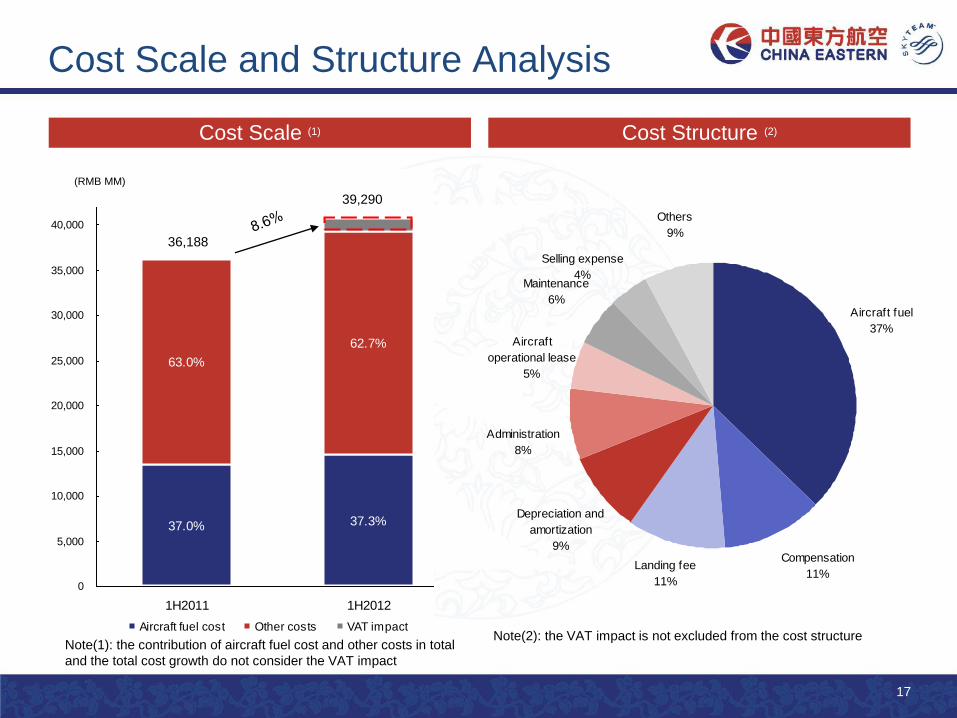
Aircraft fuel
37%
Compensation
11%Landing fee
11%
Depreciation and
amortization
9%
Administration
8%
Aircraft
operational lease
5%
Maintenance
6%
Selling expense
4%
Others
9%
37.3%37.0%
62.7%
63.0%
0
5,000
10,000
15,000
20,000
25,000
30,000
35,000
40,000
1H2011 1H2012
Aircraft fuel cost Other costs VAT impact
Cost Scale (1) Cost Structure (2)
Cost Scale and Structure Analysis
36,188
39,290
(RMB MM)
Note(2): the VAT impact is not excluded from the cost structure Note(1): the contribution of aircraft fuel cost and other costs in total
and the total cost growth do not consider the VAT impact

18
Profit Change Analysis
(RMB MM)
19
1H12 Market Analysis
1H12 Operating Results
2H12 Operating Plan

20
Fleet Plan and Capacity Structure
2H12 Self Owned and
financial lease Operating lease
Aircraft New Delivery 17 8
Aircraft Disposal — 4
Capex (RMB 100 MM) 126 —
2H12 Domestic International Regional
ASK breakdown 72% 25% 3%
Added ASK breakdown 69% 31% —

21
Key Markets in 2H12
Europe
America
Africa
Oceania
Japan
