china and india in international trade: from laggards to ... · india leads globalisation in...
TRANSCRIPT
No 2007 – 19
November
China and India in international trade: from laggards to leaders?
_____________________________
Françoise Lemoine Deniz Ünal-Kesenci
China and India in international trade: from laggards to leaders?
_____________________________
Françoise Lemoine Deniz Ünal-Kesenci
No 2007 – 19 November
CEPII, Working Paper No 2007-19
3
TABLE OF CONTENTS
Summary ............................................................................................................................... 4 Abstract ................................................................................................................................. 5 Résumé long .......................................................................................................................... 6 Résumé court ........................................................................................................................ 7 Introduction .......................................................................................................................... 8 I. Large emerging economies: what is so special about China and India? ................. 9
I.1. The poorest and the fastest growing ones ............................................................... 9 I.2. Other similarities… .............................................................................................. 12 I.3. …and differences ................................................................................................. 13 I.4. Opening up: time lag and structural factors ......................................................... 15
II. Impact on international trade ................................................................................... 17 II.1. Large emerging economies in world trade of goods and services ........................ 17 II.2. Supply and demand shocks .................................................................................. 18 II.3. China triggers a new international division of labour .......................................... 22 II.4. India leads globalisation in services ..................................................................... 23
III. From traditional specialisation to new outward-oriented sectors ......................... 25 III.1. Traditional specialisation ................................................................................. 25 III.2. New specialisation in ITC sectors .................................................................... 27 III.3. Inverse imbalances in services: China's deficit, India's surplus....................... 28
IV. Technological catch-up and quality upgrading ....................................................... 31 IV.1. Technological level: where do they stand presently? ...................................... 32 IV.2. Technological catch-up: closing the gap will take time .................................. 35 IV.3. Price-competitiveness ....................................................................................... 36 IV.4. Beyond price competitiveness: quality upgrading ........................................... 37 IV.5. The limits of price competitiveness: terms of trade ......................................... 39
V. The debate on sustainable growth strategies ........................................................... 40 V.1. Can India skip the industrialisation phase? .......................................................... 40 V.2. Can China succeed to rebalance growth? ............................................................. 43 V.3. Will the giants drive world demand? .................................................................... 44
Conclusion ........................................................................................................................... 46 References ........................................................................................................................... 47 Appendix - The definition of high-tech products ............................................................. 53 List of working papers released by CEPII ....................................................................... 55
China and India in International Trade: From laggards to Leaders
4
CHINA AND INDIA IN INTERNATIONAL TRADE: FROM LAGGARDS TO LEADERS?
SUMMARY
The economic rise of China and India has aroused a wave of economic literature focused on the consequences for the world economy of the emergence of these new economic powers. The present paper addresses this question by investigating the following points: what are the specific features of China and India in comparison with other large emerging economies (Brazil, Mexico, Russia)? What are the similarities and differences between India and China in the way they are integrating with the world economy? How have they, up to now, impacted world trade both as exporters and importers? What are the prospects for their catching-up?
The following conclusions stand out:
Whatever the definition of what is an “emerging economy”, China and India are unmistakably large emerging economies. They are demographic giants which have become big economic powers before getting rich. They have a lower income per capita than Brazil, Mexico or Russia, but have registered higher and steadier growth rates, which put them on a on a clear catch-up trajectory. Beyond these common features, China and India show sharp contrasts in economic structures which cannot be ascribed only to the lower level of development of India, but also to different strategies. India is much less open and less present in international trade but the gap may be, at least partly, a question of time lag.
Their rise in international trade has created two symmetric shocks, on the supply and the demand sides. Over the last decade, the two countries taken together trebled their share in world exports of manufactured products as well as their share in world imports of primary products (from around 3% to about 10%). China’s supply of manufactured goods at low prices combined with China’s and India’s demand of raw material and energy have contributed to a change in relative world prices which has had an adverse effect on both countries.
China and India have kept similar traditional specialisation (textiles) and both have developed new outward-oriented sectors linked to new technology. Foreign firms, through their offshoring and outsourcing strategy, have played a critical part in turning China into a global export platform for electronic products, and India into a global centre for computer and IT services. As low-cost suppliers of manufactured products and services, they now epitomise the threat of globalisation for rich countries. Their growing merchandise trade is associated with widening deficits in related services (i.e. transport, insurance and royalties).
A crucial question for China and India now lies in the pace of their technological catch-up. The paper argues that despite their rapid progress, they still stand far behind developed economies, and that closing the gap will take time. Moreover, beyond the question of technological catch-up, the challenge is now also the quality upgrading of exports, especially for China. China has acquired a comparative advantage in high-tech products but records an increasing disadvantage in high-price/quality products and its terms of trade
CEPII, Working Paper No 2007-19
5
have deteriorated much faster than India’s. India has followed a strategy aimed at supplying higher price/quality goods and “customized” products and services.
China and India have based their high economic growth on very different production structures and export specialisation. According to most long-term scenarios, the two countries are expected to continue to grow at an above-average pace. This leaves open the question of the strategy they should follow to make economic growth sustainable in the long run. In the two countries there is a debate about the necessary changes in their respective growth process. Can India short-circuit the industrialisation phase? Will China be able to rebalance its growth pattern? The crucial questions are how to reduce social inequality and make the most of their huge human resources and large potential domestic markets. Over the last decades, their successful integration in international trade has not solved the problem of their oversupply of labour, but has accentuated the specific shortage of highly-skilled personnel.
ABSTRACT
China and India are demographic giants which have become big economic powers before getting rich. Their rise in international trade has created two symmetric shocks, on the supply of manufactured goods and the demand of primary goods, contributing to a reversal in world relative prices. They have kept traditional specialisation in textiles but have developed new outward-oriented sectors linked to new technology. Foreign firms, through offshoring and outsourcing, have played a critical part in turning China into a global export platform for electronic products, and India into a global centre for ICT services. Beyond the question of their technological catch-up, the challenge is now their quality upgrading, especially for China. In the two countries, there is a debate about the necessary changes to make long term growth sustainable. Their successful integration in world trade has not solved the problem of their overall oversupply of labour, but has accentuated the shortage of highly-skilled personnel.
JEL Classification: F14, F15, 033, 053, 057
Key Words: China, India, Foreign Trade, Technology, Terms of Trade
China and India in International Trade: From laggards to Leaders
6
LA CHINE ET L'INDE DANS LE COMMERCE MONDIAL : NOUVEAUX LEADERS ?
RÉSUMÉ LONG
La montée en puissance économique de la Chine et de l’Inde suscite une vague d’analyses économiques qui tentent d’en évaluer l’impact sur l’économie mondiale. Le présent document aborde cette question en examinant les points suivants : quelles sont les spécificités de la Chine et de l’Inde par rapport aux autres grands émergents (Brésil, Mexique, Russie) ? Quelles sont les similarités et les différences entre la Chine et l’Inde dans la manière dont ils s’intègrent dans l’économie mondiale ? Quel impact a eu jusqu’à présent sur le commerce international la montée de leurs exportations et importations ? Quelles sont leurs perspectives de rattrapage ?
Les conclusions sont les suivantes :
Quelle que soit la définition du terme « grands émergents », la Chine et l’Inde en font incontestablement partie. Ce sont des géants démographiques qui sont devenus des grandes puissances économiques avant d’être riches. Les deux ont un revenu par habitant inférieur à celui du Brésil, du Mexique ou de la Russie mais ont connu une croissance économique plus forte et plus régulière qui les met clairement sur une trajectoire de rattrapage. Par delà ces traits communs, la Chine et l’Inde présentent des structures économiques contrastées, ce qui n’est pas attribuable seulement au plus faible niveau de développement de l’Inde mais aussi à des stratégies différentes. L’Inde est beaucoup moins ouverte et moins présente dans le commerce international mais l’écart peut être au moins en partie une question de décalage temporel.
Leur montée dans le commerce international a produit deux chocs symétriques sur l’offre et la demande. Au cours de la dernière décennie, les deux pays pris ensemble ont triplé leur poids dans les exportations de produits manufacturés ainsi que dans les importations de produits primaires (de 3% à 10% environ). L’offre chinoise de produits manufacturés à bas prix combinée à la demande de produits primaires de la Chine et de l’Inde ont contribué à un changement dans l’évolution des prix relatifs mondiaux qui leur a finalement été défavorable.
La Chine et l’Inde ont conservé des spécialisations traditionnelles (textile) mais ont développé de nouveaux secteurs extravertis liés aux nouvelles technologies. Les entreprises étrangères, par leurs stratégies d’externalisation et de délocalisation, ont contribué de manière décisive à faire de la Chine une plateforme mondiale de production et d’exportation de produits électronique et l’Inde un centre mondial de services informatiques. Ces deux pays, fournisseurs à bas coûts, symbolisent désormais les périls de la mondialisation pour les pays riches. L’essor de leur commerce international de marchandises leur créent des déficits croissants dans les services qui y sont liés (transports, assurances, royalties).
La question cruciale pour la Chine comme pour l’Inde réside désormais dans leur rythme de rattrapage technologique. L’étude soutient que, en dépit de leurs progrès rapides, ils sont encore loin derrière les économies développées et que le rattrapage sera long. En outre, au
CEPII, Working Paper No 2007-19
7
delà du rattrapage technologique, la question est aussi celle de la montée en gamme de leurs exportations en terme de prix/qualité, surtout dans le cas de la Chine. La Chine a acquis un avantage comparatif dans les produits high-tech mais enregistre un déficit croissant dans les produits haut de gamme et ses termes de l’échange se sont détériorés, beaucoup plus que ceux de l’Inde. Celle-ci a suivi une stratégie de « niches », visant à fournir des produits de qualité, des services ciblés.
La Chine et l’Inde ont fondé leur forte croissance économique sur des structures de production et des spécialisations à l’exportation très différentes. Selon la plupart des scénarios à long terme, les deux pays devraient continuer à croître à un rythme supérieur à la moyenne. La question reste ouverte de la stratégie qu’ils devraient suivre pour rendre leur croissance soutenable sur le long terme. Il y a un débat dans les deux pays sur les changements qui sont nécessaires pour rendre la croissance soutenable sur le long terme. L’Inde peut-elle sauter la phase d’industrialisation ? La Chine parviendra-t-elle à rééquilibrer sa croissance ? Pour les deux pays, l’enjeu est de réduire les inégalités sociales et de tirer parti de leurs immenses ressources de main d’œuvre et de leur vaste marché potentiel. Au cours de deux dernières décennies, leur intégration réussie dans le commerce mondial n’a pas suffi à résoudre le problème de leur excédent de main d’œuvre mais elle a accentué la pénurie de personnel qualifié.
RÉSUMÉ COURT
La Chine et l’Inde sont des géants démographiques qui sont devenus des grandes puissance économiques avant d’être riches. Leur montée dans le commerce international a créé deux chocs symétriques, sur l’offre de produits manufacturés et sur la demande de produits primaires, contribuant à un retournement des prix relatifs au niveau mondial. Ils ont gardé leur spécialisation traditionnelle dans le textile mais ont développé de nouveaux secteurs extravertis liés aux nouvelles technologies. Les entreprises étrangères, par leurs stratégies d’externalisation et de délocalisation, ont contribué de manière décisive à faire de la Chine une plate-forme mondiale de production et d’exportation de produits électroniques et l’Inde un centre mondial de services informatiques. Par delà le rattrapage technologique, la question est celle de leur montée en gamme surtout pour la Chine. Il y a un débat dans les deux pays sur les changements nécessaires pour rendre la croissance soutenable à long terme. Leur intégration réussie dans le commerce mondial n’a pas suffi à résoudre le problème de leur excédent de main d’œuvre mais elle a accentué la pénurie de personnel qualifié.
Classification JEL : F14, F15, 033, 053, 057
Mots-clefs : Chine, Inde, commerce extérieur, techonogie, termes de l'échange
China and India in International Trade: From laggards to Leaders
8
CHINA AND INDIA IN INTERNATIONAL TRADE: FROM LAGGARDS TO LEADERS?
Françoise LEMOINE, Deniz ÜNAL-KESENCI1
INTRODUCTION
China and India have become hot topics in recent economic literature. Already in the past, their demographic size combined with their position in world politics had given them a strategic importance and they have attracted an interest which exceeded their sheer economic size. Over the last two decades their rapid growth and their increasing participation in international trade have considerably enhanced their influence in the global economy. A new wave of research papers have highlighted the factors underlying their successes and assessed the consequences for the world economy, for other developing countries and developed economies. In fact economic research has tried to keep pace with the global changes brought about by these “emerging giants”.
The effects of their emergence on the world economy have taken place through various channels, the most direct has been trade (Winters & Yusuf, 2006; Srinivasan, 2006). This has meant new threats or opportunities for other countries depending on their specialisation profiles. China’s opening up has intensified the international segmentation of production processes in Asia and accelerated the transfer of labour intensive stages of production from rich countries to coastal China. This large-scale reorganisation of industrial production at the world level has led to a new geography of international trade (Gill and Kharas, 2006; Gaulier et alii, 2006a). Although the internationalisation of services is more recent, outsourcing to India has already had a significant impact on the pattern of international trade in business services and recent studies have shown that there is a large potential for the sourcing of services from China as well as from India (van Welsum & Reif, 2006).
China’s and India’s emergence has also had an impact on international capital flows. They have received large capital inflows from foreign investors attracted by their low labour costs and rapidly expanding domestic markets. More recently, some large Chinese and Indian firms have developed a strategy of investment abroad, in order to acquire technology, enlarge their markets or secure their supplies (Broadman 2006; Goldstein, 2007; UNCTAD, 2006).
The integration of these two giants into the world economy has also had indirect impact. With their opening up to foreign trade and capital, more than one billion of workers (760 millions in China and 430 millions in India) have been integrated with global labour markets. This has changed the balance between capital and labour in the world and has meant downward pressures on wages in developed economies (Freeman, 2005). In China alone, workers in manufacturing industry outnumber workers in OECD countries.
Finally, their emergence has had an impact on economic thinking and fuelled a theoretical debate about the interpretation of the paradigm of the comparative advantage in the present context of globalisation. The Nobel Prize-winning economist, Samuelson (2004) argued that a developed country (the US) may suffer long-term harm from competition from an
1 CEPII, franç[email protected] and [email protected].
CEPII, Working Paper No 2007-19
9
emerging economy when the latter experiences a rapid technological catch-up. Bhagwati, another leading international economist, admits this is theoretically possible although it does not apply actually in the present context (Bhagwati et alii, 2004).
The present paper analyses how China and India are integrating with the world economy and addresses four points. The first section shows in what they differ from other large emerging economies and puts forwards both the similarities and differences between these two countries. The second section sketches out the major effects of their emergence on international supply and demand and on the international division of labour; the third section considers how they have jumped from their traditional specialisation in textile to outward-oriented sectors related to ICTs, as globalisation has made possible this short-circuit towards modernisation; the fourth section makes use of the detailed CEPII data bases in order to discuss the question of their technological catch-up and quality upgrading; the fifth takes stock of the debate going on in the two countries about the sustainability of their growth strategy.
I. LARGE EMERGING ECONOMIES: WHAT IS SO SPECIAL ABOUT CHINA AND INDIA?
Over recent years, large emerging economies have attracted a lot of interest and have given rise to an abundant economic literature. However, there is no unique definition of this grouping: the criteria of size, development level, growth or trade performance used in studies differ or are left imprecise. The famous BRICs (Wilson & Purushothaman, 2003) encompass Brazil, Russia, India and China; some studies add also South Africa (Bergstein, 2005); according to IMF Regional Economic Outlook (2006) « Emerging Asia » includes low income economies (China, India, Indonesia, Malaysia, the Philippines and Thailand), but also high income economies (Hongkong, Korea, Singapore, Taiwan); Freeman (2005) focuses on three new entrants in the global economy: China, India and the former Soviet-Union; the World Bank (2007) considers that the challenge of the coming years will be to integrate large emerging economies, China, India, and “other manufacturing powerhouses”.
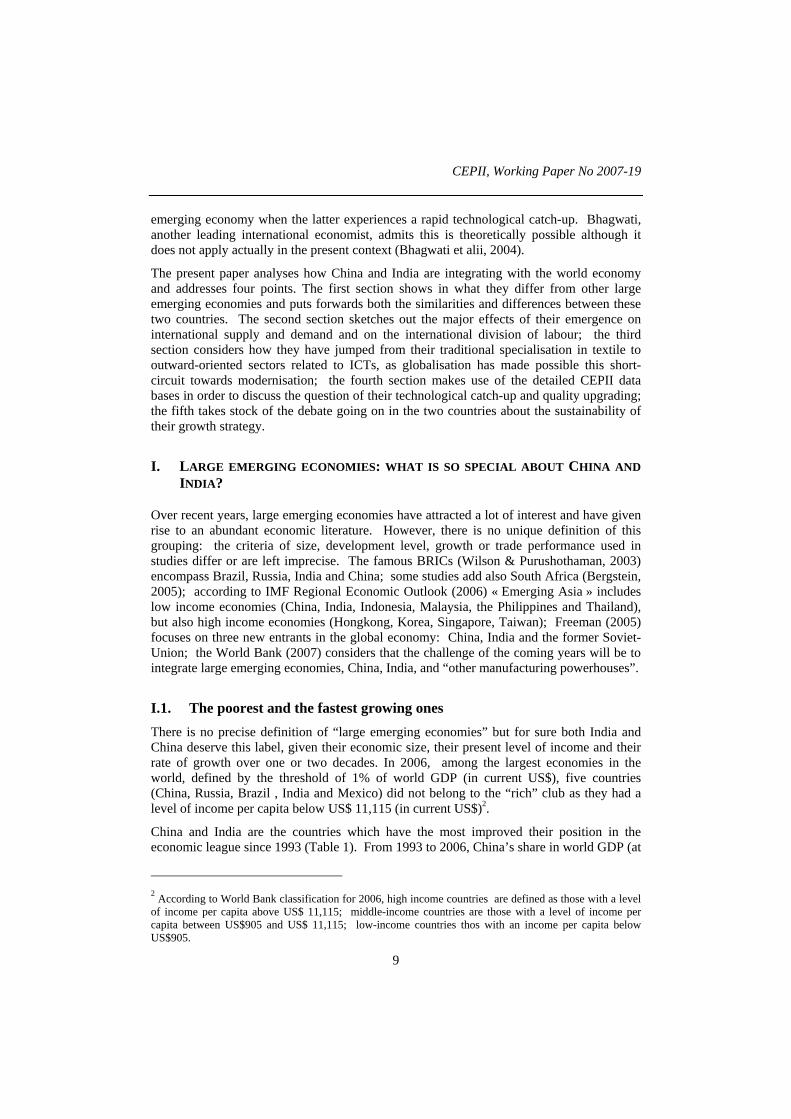
I.1. The poorest and the fastest growing ones There is no precise definition of “large emerging economies” but for sure both India and China deserve this label, given their economic size, their present level of income and their rate of growth over one or two decades. In 2006, among the largest economies in the world, defined by the threshold of 1% of world GDP (in current US$), five countries (China, Russia, Brazil , India and Mexico) did not belong to the “rich” club as they had a level of income per capita below US$ 11,115 (in current US$)2.
China and India are the countries which have the most improved their position in the economic league since 1993 (Table 1). From 1993 to 2006, China’s share in world GDP (at
2 According to World Bank classification for 2006, high income countries are defined as those with a level of income per capita above US$ 11,115; middle-income countries are those with a level of income per capita between US$905 and US$ 11,115; low-income countries thos with an income per capita below US$905.
China and India in International Trade: From laggards to Leaders
10
current US$) more than doubled (from 2.5% to 5.5% and that of India rose from 1.1% to 1.9 %. They have been among the ten top drivers of the global economy.
Table 1 Biggest economies: share in the world GDP
(% world GDP in current US$)
1993 2006United States 26.7 United States 27.5Japan 17.3 Japan 9.0Germany 8.1 Germany 6.0France 5.2 China 5.4Italy 4.1 United Kingdom 4.9United Kingdom 3.9 France 4.7Canada 2.3 Italy 3.8Spain 2.1 Canada 2.6China 1.8 Spain 2.5Brazil 1.8 Russia 2.0Russia 1.8 Brazil 2.0Mexico 1.6 India 1.9South Korea 1.5 South Korea 1.8Netherlands 1.3 Mexico 1.7Australia 1.3 Australia 1.6India 1.1 Netherlands 1.4
Notes: Only the countries with a share greater than 1% of World's GDP (measured by current US$) in 2006 are shown. The five big emerging countries (income per capita below US$11,115 ) are underlined.
Source: CEPII, CHELEM-GDP database, July 2007.
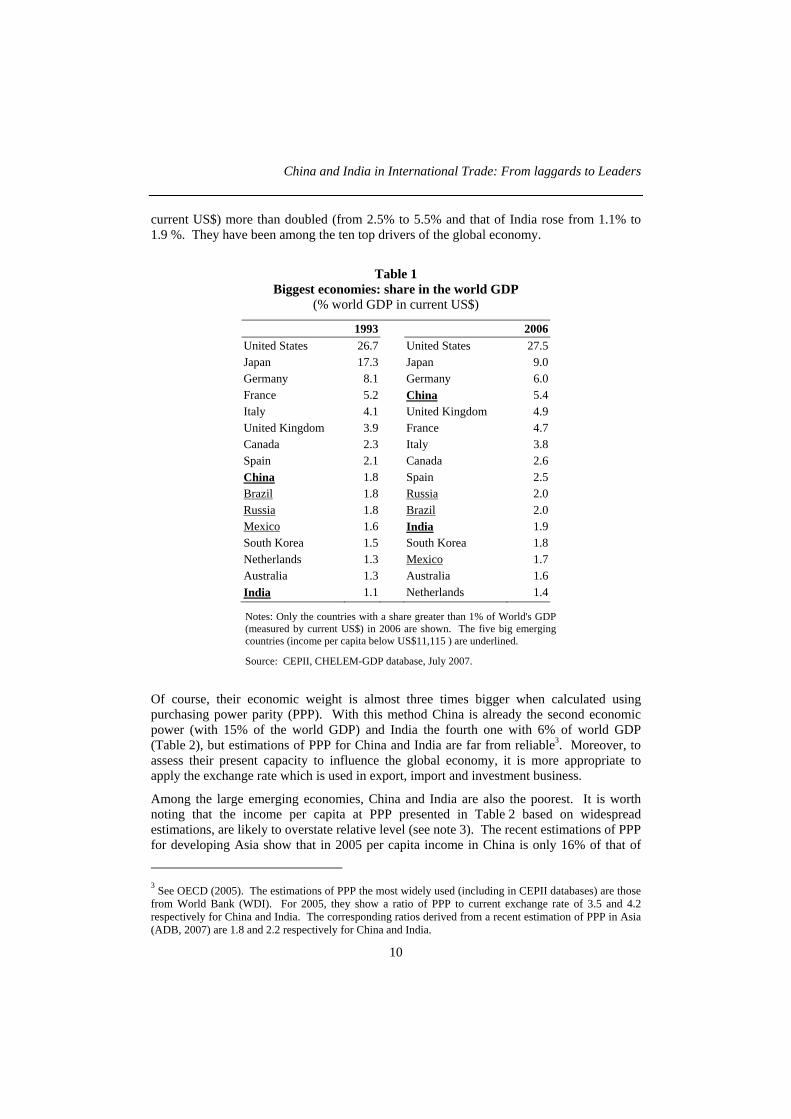
Of course, their economic weight is almost three times bigger when calculated using purchasing power parity (PPP). With this method China is already the second economic power (with 15% of the world GDP) and India the fourth one with 6% of world GDP (Table 2), but estimations of PPP for China and India are far from reliable3. Moreover, to assess their present capacity to influence the global economy, it is more appropriate to apply the exchange rate which is used in export, import and investment business.
Among the large emerging economies, China and India are also the poorest. It is worth noting that the income per capita at PPP presented in Table 2 based on widespread estimations, are likely to overstate relative level (see note 3). The recent estimations of PPP for developing Asia show that in 2005 per capita income in China is only 16% of that of
3 See OECD (2005). The estimations of PPP the most widely used (including in CEPII databases) are those from World Bank (WDI). For 2005, they show a ratio of PPP to current exchange rate of 3.5 and 4.2 respectively for China and India. The corresponding ratios derived from a recent estimation of PPP in Asia (ADB, 2007) are 1.8 and 2.2 respectively for China and India.
CEPII, Working Paper No 2007-19
11
Taiwan (instead of 25%, in Table 2) and that of India 8% (instead of 13%) (ADB, 2007). China and India have become great economic powers long before being rich, and this is quite an unprecedented phenomenon. The New Asian Industrialised Economies which emerged in the seventies and eighties were too small to destabilise the world economy and they were easily absorbed. In the 1960s, when the Japanese economy emerged as a major economic power (with a GDP in current dollars which overtook German GDP in 1969), it was already a high-income country, where the major structural changes associated with take-off, especially in employment, had already taken place. As noted by Eichengreen (2006), closing the gap will take more time in the case of China and India. Their economic rise is now seen as a long term trend that will structure the evolution of the world economy in the coming decades (World Bank, 2006a; Wilson & Purushotman, 2003; O’Neil, 2006; Dimaranan et alii, 2007; Bosworth & Collins, 2007, Poncet 2006). China and India which used to be analysed as the “periphery” of the world economy are now considered as the drivers.
Table 2 Biggest economies: income per capita in 2006
GDP per capita (US$) Share in World GDP(%)
Population (millions)
Current PPP current PPP
United States 43 890 37 798 27.5 19.8 302 Australia 38 569 31 257 1.6 1.1 20 Canada 38 069 30 732 2.6 1.8 33 United Kingdom 39 061 28 756 4.9 3.0 61 Japan 34 205 27 764 9.0 6.1 127 France 35 805 27 734 4.7 3.0 63 Germany 35 145 27 050 6.0 3.9 82 Italy 31 845 26 740 3.8 2.7 58 Taiwan 15 820 26 134 0.8 1.0 23 Spain 30 314 25 591 2.5 1.8 40 South Korea 18 180 20 636 1.8 1.7 49 Russia 6 892 10 364 2.0 2.6 142 Mexico 7 813 9 570 1.7 1.8 107 Turkey 5 730 8 558 0.8 1.0 70 Brazil 5 123 7 664 2.0 2.5 188 China 1 989 6 605 5.4 15.0 1 314 Indonesia 1 571 3 431 0.8 1.4 232 India 824 3 300 1.9 6.4 1 112
World 7 395 8 834 100.0 100.0 6 528
Notes: Countries are sorted by GDP per capita in PPP. Only the countries with a share greater than 1% of World's GDP measured by PPP in 2006 are shown. Nominal GDP are in current US$ and PPP-GDP are in 2000 US$. The five large emerging countries (income per capita below current US$ 11 115) are underlined.
Source: CEPII, CHELEM-GDP database, July 2007.
China and India in International Trade: From laggards to Leaders
12
I.2. Other similarities… China and India share other similar features which make them quite different from the other “large emerging economies”.
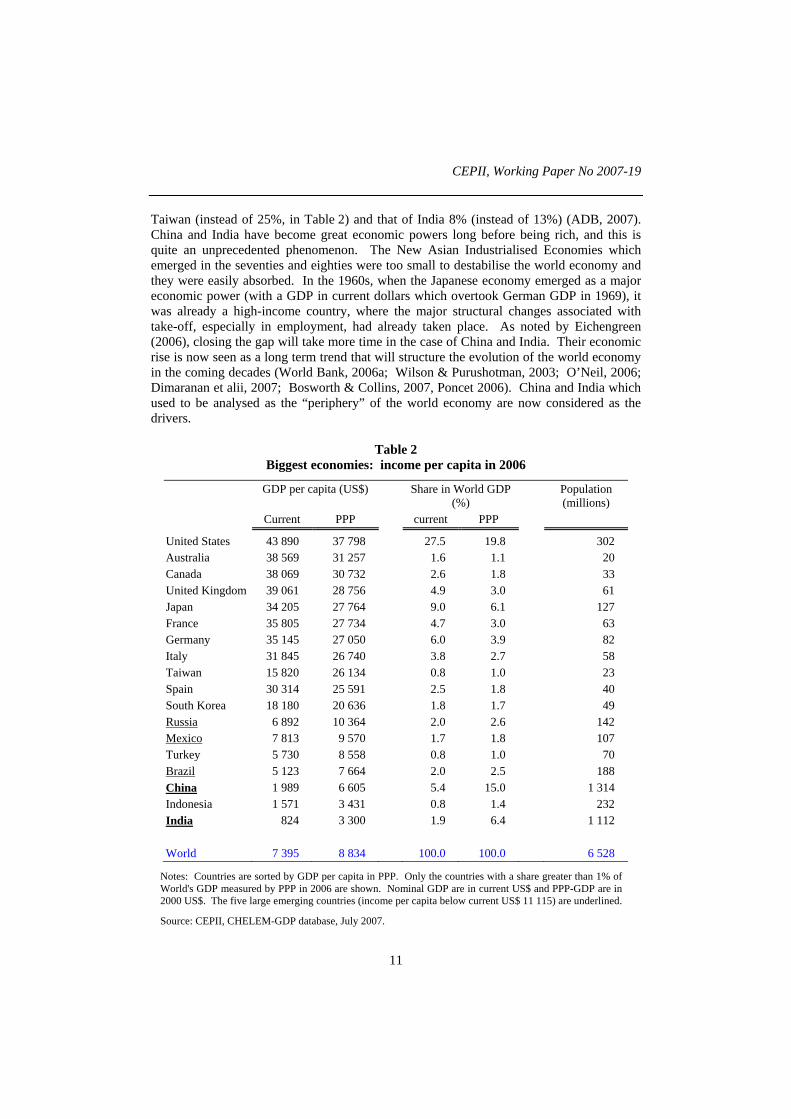
The first is of course the size of their population (1.3 billion for China and 1.1 billion for India) which makes them the two most populous countries with 36% of the world population. With huge labour force and low wages they have a comparative advantage in labour intensive goods or services, together with large potential or actual economies of scale. Their cost advantage in labour intensive sectors is likely to last over the present decade at least in China and much longer in India, due to demographic trends and to the strong pressure for migration out of rural areas into the “modern sector” (Table 3).
Table 3 Labour force in 2004-2005 (millions)
Primary sector Secondary sector Tertiary sector All sectors
China 340 181 238 758
India 228 83 123 434
Russia 8 19 41 68
Brazil 16 14 45 75
Mexico 4 14 24 42
OECD 30 129 359 518
Note: Secondary sector includes industry and construction.
Source: ILO, 2006.
In an historical perspective, they have in common the fact that they both were, up to the middle of the 19th century, major economic powers. According to Maddison (2001), India and China taken together accounted for half of world output, in purchasing power parity, in the 1820s, a share to be compared with 21% presently. As they both have a long tradition and great culture, their present emergence in the world economy can be considered as a “come back”, a return after a long absence (Singh, 2005).
In the last two decades, both countries have followed a gradual approach to economic reform and opening up. Since the early eighties China has adopted a strategy of economic reform and opening up and ten years later, India has also entered a phase of domestic and external economic liberalisation. In both countries, opening up to trade and capital flows has been a gradual process which has followed a specific pace. The sequencing has been determined by domestic priorities and constraints, while external pressures (from international organisations or partners) have proved to be limited. India experienced an international payment crisis in 1990-1991 which led to a package of measures designed by the IMF, but since then, the course of reforms has been led by domestic forces. In China, after 25 years of incremental reforms, the government accepted in 2001 the strong commitments imposed by WTO accession, as a mean to strengthen its strategy of economic modernisation (for a comparison of the reform processes see Aziz et alii, 2006).

CEPII, Working Paper No 2007-19
13
Figure 1 GDP per Capita Relative to High Income Countries (HIC): 1980-2006
(GDP in 2000 international US$, Group of HIC = 100)
ROW
China
India
2.5
7.5
12.5
17.5
22.5
27.5
32.5
37.5
42.5
47.5
80 82 84 86 88 90 92 94 96 98 00 02 04 06
ROW
Brazil
Mexico
Russia
Turkey
2.5
7.5
12.5
17.5
22.5
27.5
32.5
37.5
42.5
47.5
80 82 84 86 88 90 92 94 96 98 00 02 04 06
Indonesia
Notes: The seven emerging economies presented here are those with a real PPP-GDP representing more than 1% of the world GDP in 2006 (see Table 2). The rest of the world (ROW) corresponds to “World minus high income countries minus these 7 emerging countries”. “High income countries” are those where GDP per capita in 2006 is at least 11 115 current US dollars (World Bank classification).
Source: CEPII, CHELEM-GDP database, July 2007.
India and China are the large emerging economies which have registered the fastest and steadiest GDP growth over a quarter of century. They have avoided the most severe kinds of crisis and instability which have characterised all the other large economies: Mexico and Brazil in the 1980s, Russia in the 1990s. Over the long run China and India are on a clear catch-up trajectory which progressively reduces the gap (still huge) between their GDP per capita and that of rich countries, while the catch-up process of other emerging countries appears to be much more erratic (Figure 1).
I.3. …and differences The two countries also display sharp economic differences. India appears institutionally much stronger (Singh, 2005, Aziz et alii, 2006) with a sound banking system, relatively developed capital markets and a strong corporate sector which includes well established private groups with long-established international links (Boillot, 2006; Etienne 2007). This contrasts with China’s inefficient state-owned banks, emerging stock markets and
China and India in International Trade: From laggards to Leaders
14
recently born private firms. The better quality of most Indian political and economic institutions is well documented in Minefi (2006).
India’s GDP is still far smaller than China’s and India is much poorer than China (Table 1 and Table 2). While the two countries had about the same income per capita in 1980, China’s income per capita is now almost twice that of India. China’s income per capita has reached 1/5 of that of rich countries, while India’s capita income still stands at about 10% (in PPP). Although the number of people under the poverty line has considerably diminished in both countries, the incidence of poverty is also much larger in India, where one third of the population lives with less than 1$ per day, against less than 10% in China.
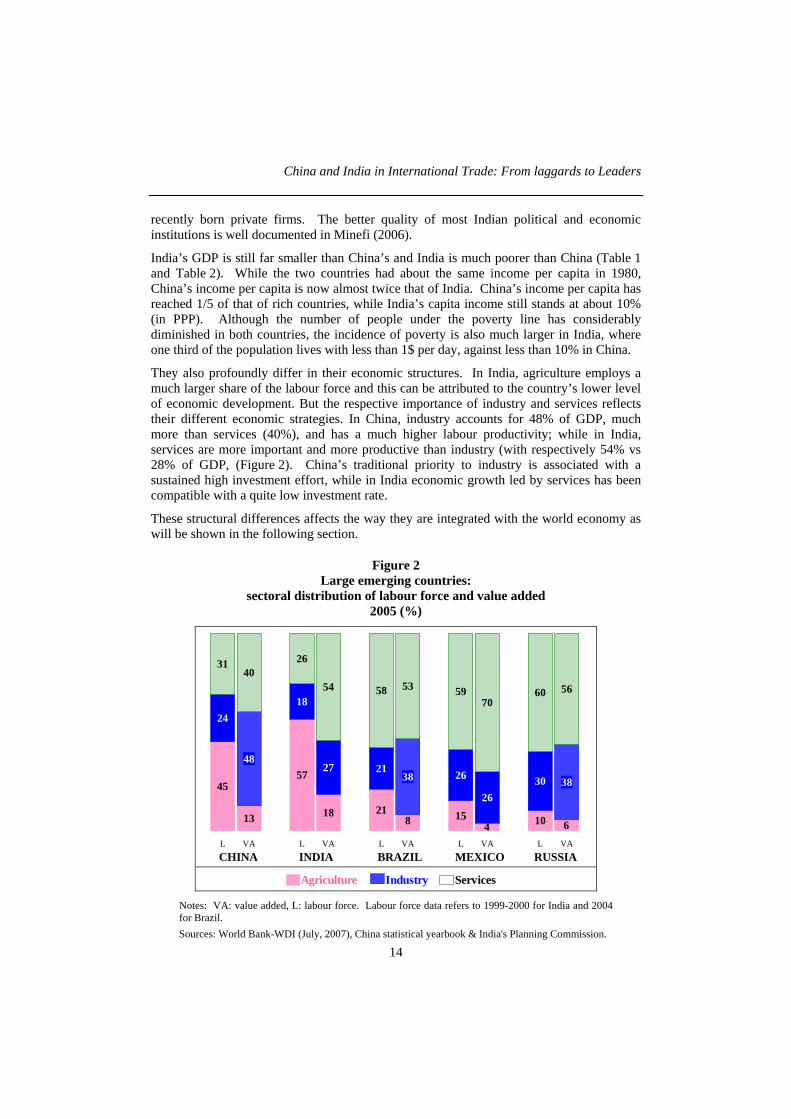
They also profoundly differ in their economic structures. In India, agriculture employs a much larger share of the labour force and this can be attributed to the country’s lower level of economic development. But the respective importance of industry and services reflects their different economic strategies. In China, industry accounts for 48% of GDP, much more than services (40%), and has a much higher labour productivity; while in India, services are more important and more productive than industry (with respectively 54% vs 28% of GDP, (Figure 2). China’s traditional priority to industry is associated with a sustained high investment effort, while in India economic growth led by services has been compatible with a quite low investment rate.
These structural differences affects the way they are integrated with the world economy as will be shown in the following section.
Figure 2 Large emerging countries:
sectoral distribution of labour force and value added 2005 (%)
45
13
57
18 218 15 10
24
48
18
27 2138 26
2630 38
3140
26
54 58 53 5970
60 56
64L VA L VA L VA L VA L VACHINA INDIA BRAZIL MEXICO RUSSIA
Agriculture Industry Services
Notes: VA: value added, L: labour force. Labour force data refers to 1999-2000 for India and 2004 for Brazil. Sources: World Bank-WDI (July, 2007), China statistical yearbook & India's Planning Commission.
CEPII, Working Paper No 2007-19
15
I.4. Opening up: time lag and structural factors The degree of openness is also a major difference between the two countries. India is much less open both to foreign trade and to foreign direct investment. The contrast can be ascribed to several factors.
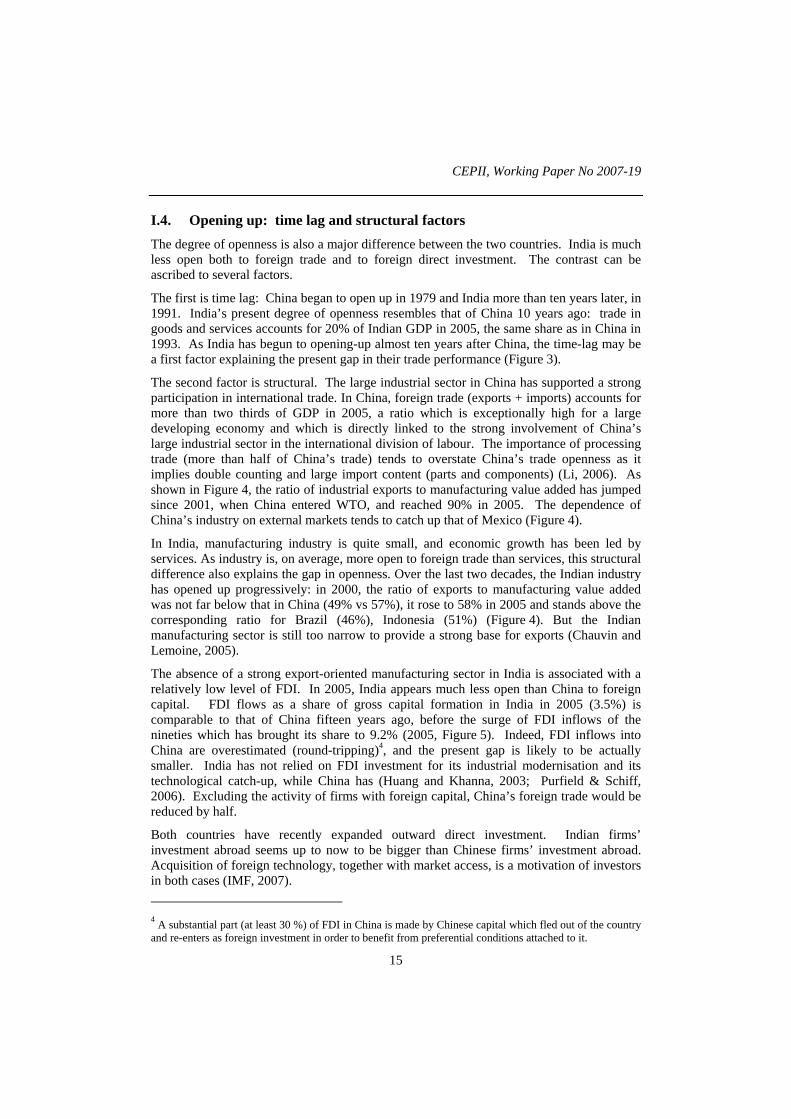
The first is time lag: China began to open up in 1979 and India more than ten years later, in 1991. India’s present degree of openness resembles that of China 10 years ago: trade in goods and services accounts for 20% of Indian GDP in 2005, the same share as in China in 1993. As India has begun to opening-up almost ten years after China, the time-lag may be a first factor explaining the present gap in their trade performance (Figure 3).
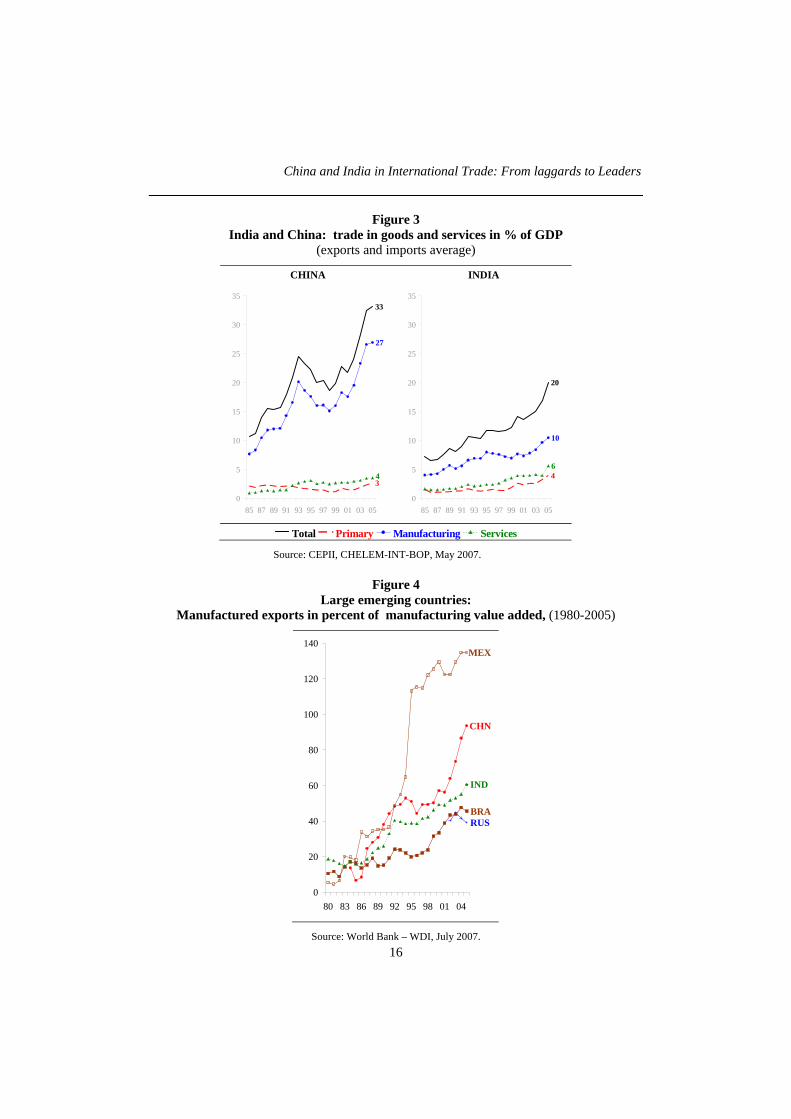
The second factor is structural. The large industrial sector in China has supported a strong participation in international trade. In China, foreign trade (exports + imports) accounts for more than two thirds of GDP in 2005, a ratio which is exceptionally high for a large developing economy and which is directly linked to the strong involvement of China’s large industrial sector in the international division of labour. The importance of processing trade (more than half of China’s trade) tends to overstate China’s trade openness as it implies double counting and large import content (parts and components) (Li, 2006). As shown in Figure 4, the ratio of industrial exports to manufacturing value added has jumped since 2001, when China entered WTO, and reached 90% in 2005. The dependence of China’s industry on external markets tends to catch up that of Mexico (Figure 4).
In India, manufacturing industry is quite small, and economic growth has been led by services. As industry is, on average, more open to foreign trade than services, this structural difference also explains the gap in openness. Over the last two decades, the Indian industry has opened up progressively: in 2000, the ratio of exports to manufacturing value added was not far below that in China (49% vs 57%), it rose to 58% in 2005 and stands above the corresponding ratio for Brazil (46%), Indonesia (51%) (Figure 4). But the Indian manufacturing sector is still too narrow to provide a strong base for exports (Chauvin and Lemoine, 2005).
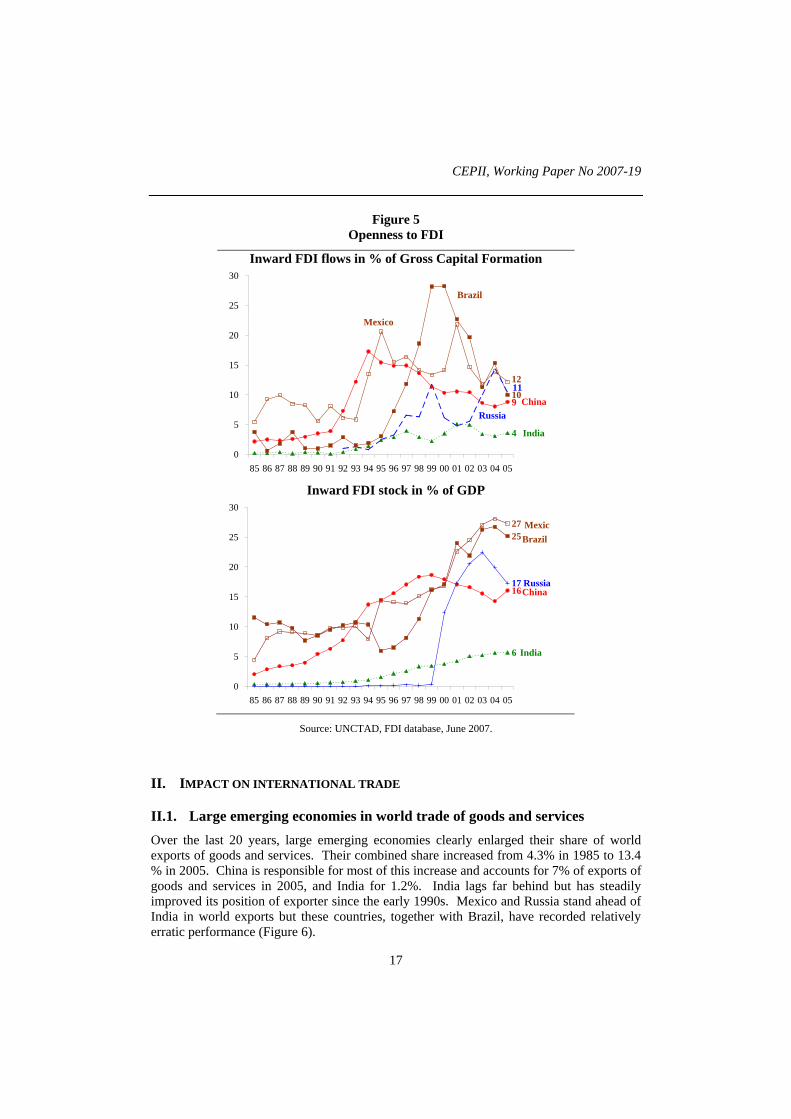
The absence of a strong export-oriented manufacturing sector in India is associated with a relatively low level of FDI. In 2005, India appears much less open than China to foreign capital. FDI flows as a share of gross capital formation in India in 2005 (3.5%) is comparable to that of China fifteen years ago, before the surge of FDI inflows of the nineties which has brought its share to 9.2% (2005, Figure 5). Indeed, FDI inflows into China are overestimated (round-tripping)4, and the present gap is likely to be actually smaller. India has not relied on FDI investment for its industrial modernisation and its technological catch-up, while China has (Huang and Khanna, 2003; Purfield & Schiff, 2006). Excluding the activity of firms with foreign capital, China’s foreign trade would be reduced by half.
Both countries have recently expanded outward direct investment. Indian firms’ investment abroad seems up to now to be bigger than Chinese firms’ investment abroad. Acquisition of foreign technology, together with market access, is a motivation of investors in both cases (IMF, 2007). 4 A substantial part (at least 30 %) of FDI in China is made by Chinese capital which fled out of the country and re-enters as foreign investment in order to benefit from preferential conditions attached to it.
China and India in International Trade: From laggards to Leaders
16
Figure 3 India and China: trade in goods and services in % of GDP
(exports and imports average)
CHINA INDIA
33
3
27
4
0
5
10
15
20
25
30
35
85 87 89 91 93 95 97 99 01 03 05
20
4
10
6
0
5
10
15
20
25
30
35
85 87 89 91 93 95 97 99 01 03 05
Total Primary Manufacturing Services
Source: CEPII, CHELEM-INT-BOP, May 2007.
Figure 4 Large emerging countries:
Manufactured exports in percent of manufacturing value added, (1980-2005)
BRA
CHN
IND
MEX
RUS
0
20
40
60
80
100
120
140
80 83 86 89 92 95 98 01 04
Source: World Bank – WDI, July 2007.
CEPII, Working Paper No 2007-19
17
Figure 5 Openness to FDI
Inward FDI flows in % of Gross Capital Formation
9
4
12
1011
0
5
10
15
20
25
30
85 86 87 88 89 90 91 92 93 94 95 96 97 98 99 00 01 02 03 04 05
Mexico
Brazil
RussiaChina
India
Inward FDI stock in % of GDP
16
6
2725
17
0
5
10
15
20
25
30
85 86 87 88 89 90 91 92 93 94 95 96 97 98 99 00 01 02 03 04 05
MexicBrazil
RussiaChina
India
Source: UNCTAD, FDI database, June 2007.
II. IMPACT ON INTERNATIONAL TRADE
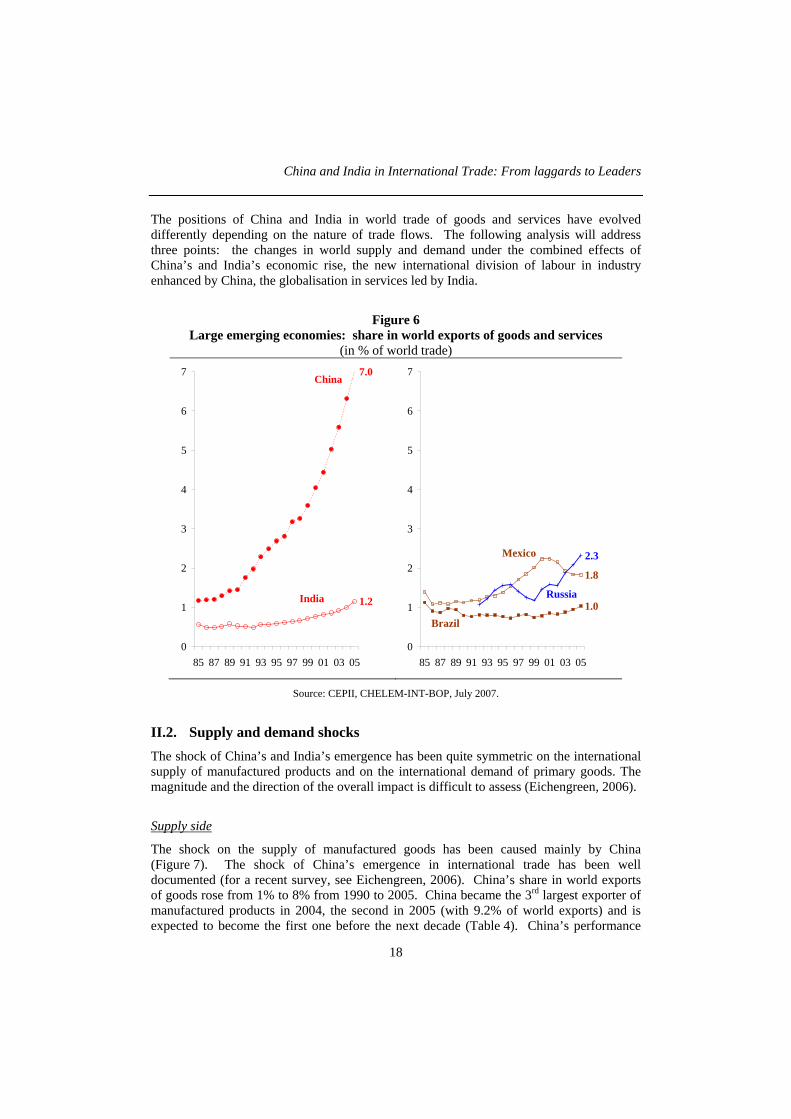
II.1. Large emerging economies in world trade of goods and services Over the last 20 years, large emerging economies clearly enlarged their share of world exports of goods and services. Their combined share increased from 4.3% in 1985 to 13.4 % in 2005. China is responsible for most of this increase and accounts for 7% of exports of goods and services in 2005, and India for 1.2%. India lags far behind but has steadily improved its position of exporter since the early 1990s. Mexico and Russia stand ahead of India in world exports but these countries, together with Brazil, have recorded relatively erratic performance (Figure 6).
China and India in International Trade: From laggards to Leaders
18
The positions of China and India in world trade of goods and services have evolved differently depending on the nature of trade flows. The following analysis will address three points: the changes in world supply and demand under the combined effects of China’s and India’s economic rise, the new international division of labour in industry enhanced by China, the globalisation in services led by India.
Figure 6 Large emerging economies: share in world exports of goods and services
(in % of world trade)
1.2
7.0
0
1
2
3
4
5
6
7
85 87 89 91 93 95 97 99 01 03 05
India
China
1.8
1.0
2.3
0
1
2
3
4
5
6
7
85 87 89 91 93 95 97 99 01 03 05
Brazil
Russia
Mexico
Source: CEPII, CHELEM-INT-BOP, July 2007.
II.2. Supply and demand shocks The shock of China’s and India’s emergence has been quite symmetric on the international supply of manufactured products and on the international demand of primary goods. The magnitude and the direction of the overall impact is difficult to assess (Eichengreen, 2006).
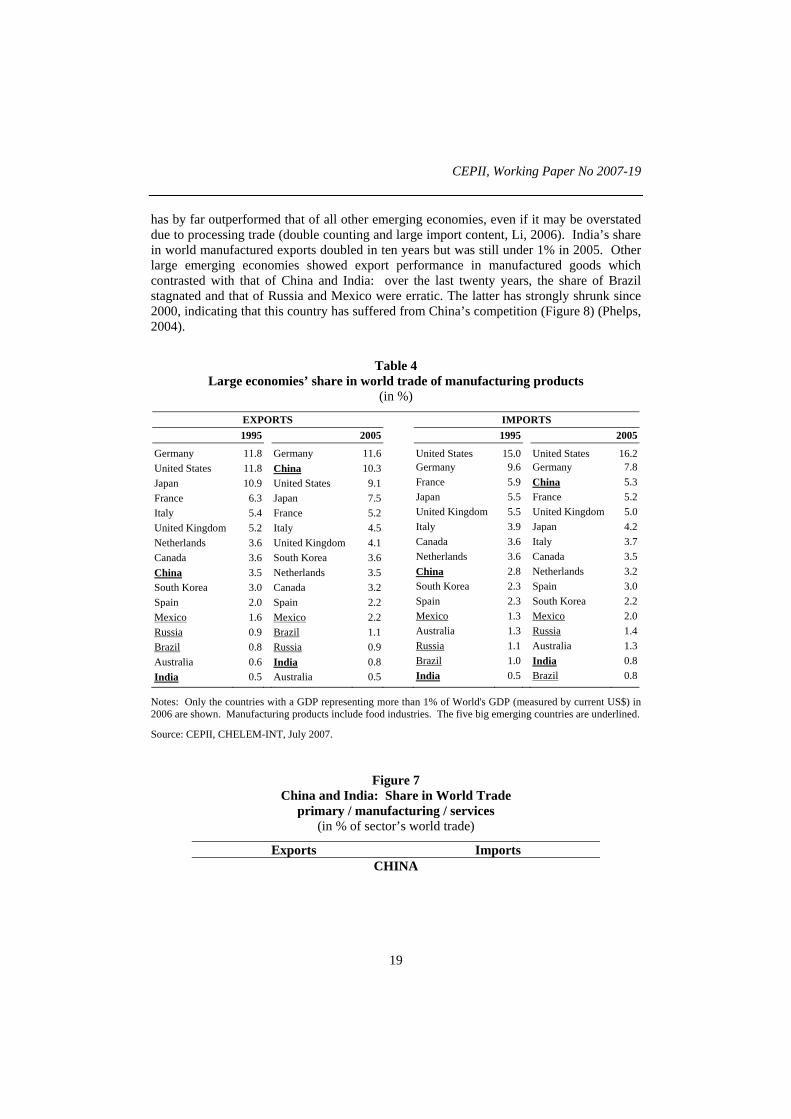
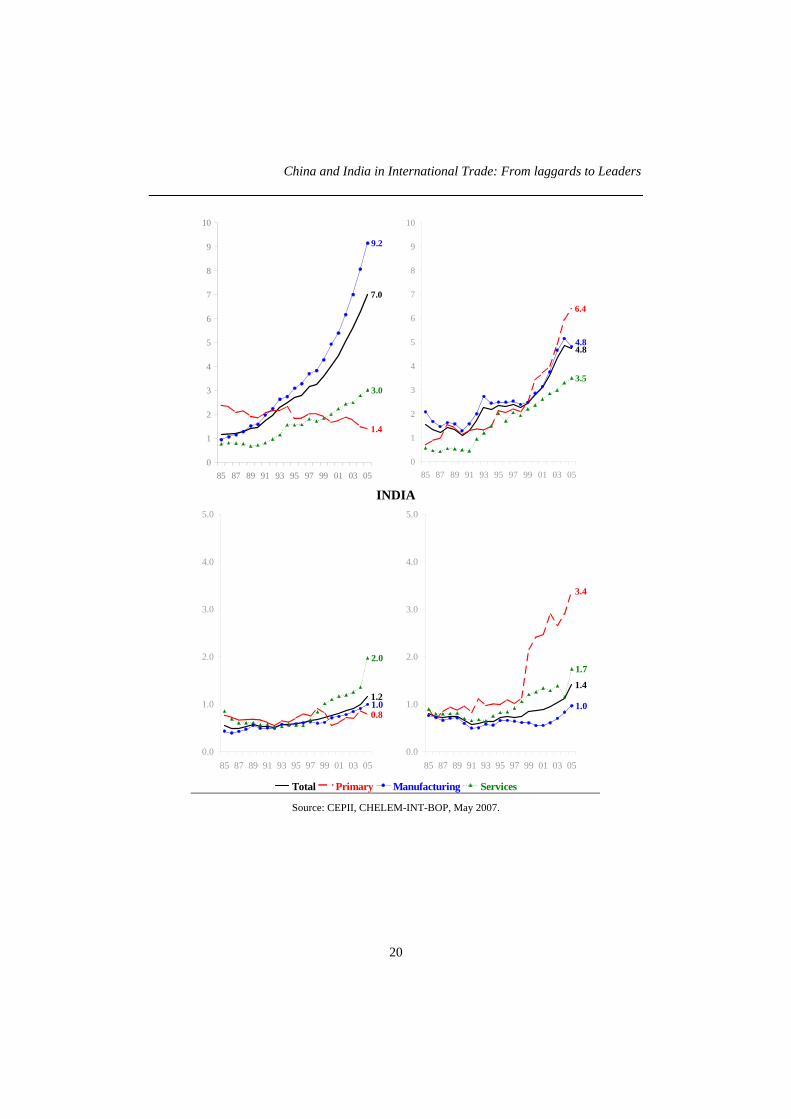
Supply side
The shock on the supply of manufactured goods has been caused mainly by China (Figure 7). The shock of China’s emergence in international trade has been well documented (for a recent survey, see Eichengreen, 2006). China’s share in world exports of goods rose from 1% to 8% from 1990 to 2005. China became the 3rd largest exporter of manufactured products in 2004, the second in 2005 (with 9.2% of world exports) and is expected to become the first one before the next decade (Table 4). China’s performance
CEPII, Working Paper No 2007-19
19
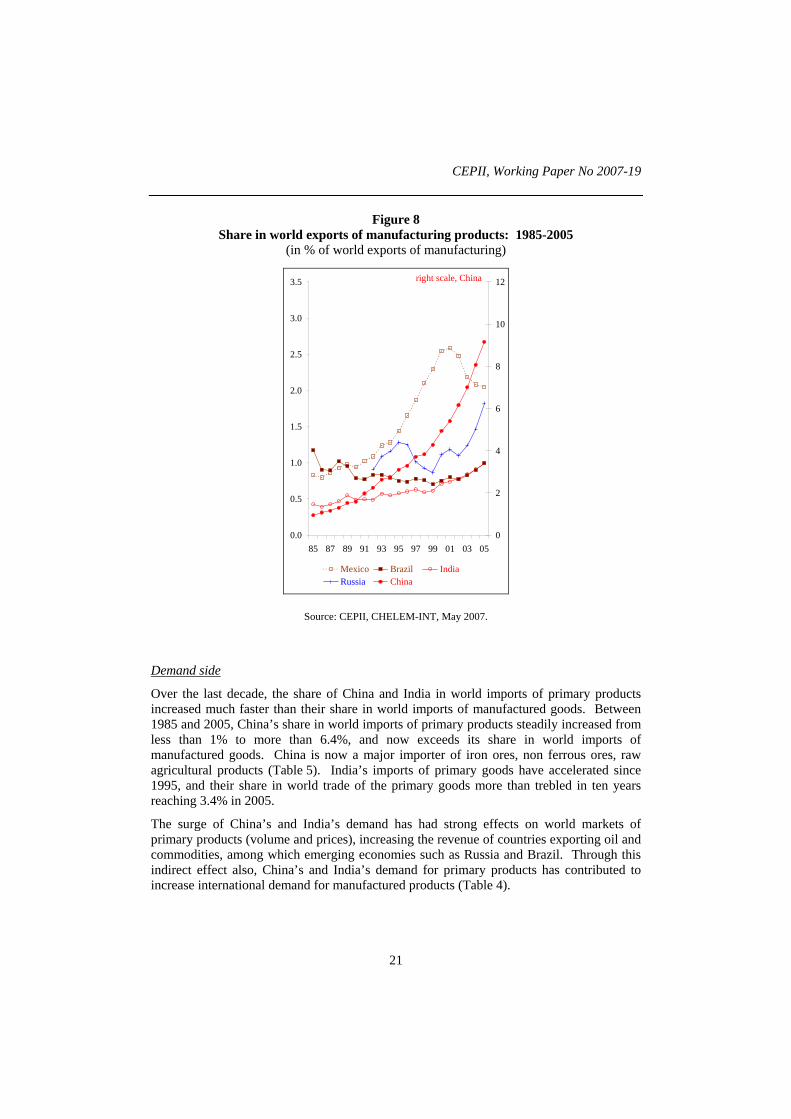
has by far outperformed that of all other emerging economies, even if it may be overstated due to processing trade (double counting and large import content, Li, 2006). India’s share in world manufactured exports doubled in ten years but was still under 1% in 2005. Other large emerging economies showed export performance in manufactured goods which contrasted with that of China and India: over the last twenty years, the share of Brazil stagnated and that of Russia and Mexico were erratic. The latter has strongly shrunk since 2000, indicating that this country has suffered from China’s competition (Figure 8) (Phelps, 2004).
Table 4 Large economies’ share in world trade of manufacturing products
(in %)
EXPORTS IMPORTS 1995 2005 1995 2005
Germany 11.8 Germany 11.6 United States 15.0 United States 16.2 United States 11.8 China 10.3 Germany 9.6 Germany 7.8 Japan 10.9 United States 9.1 France 5.9 China 5.3 France 6.3 Japan 7.5 Japan 5.5 France 5.2 Italy 5.4 France 5.2 United Kingdom 5.5 United Kingdom 5.0 United Kingdom 5.2 Italy 4.5 Italy 3.9 Japan 4.2 Netherlands 3.6 United Kingdom 4.1 Canada 3.6 Italy 3.7 Canada 3.6 South Korea 3.6 Netherlands 3.6 Canada 3.5 China 3.5 Netherlands 3.5 China 2.8 Netherlands 3.2 South Korea 3.0 Canada 3.2 South Korea 2.3 Spain 3.0 Spain 2.0 Spain 2.2 Spain 2.3 South Korea 2.2 Mexico 1.6 Mexico 2.2 Mexico 1.3 Mexico 2.0 Russia 0.9 Brazil 1.1 Australia 1.3 Russia 1.4 Brazil 0.8 Russia 0.9 Russia 1.1 Australia 1.3 Australia 0.6 India 0.8 Brazil 1.0 India 0.8 India 0.5 Australia 0.5 India 0.5 Brazil 0.8
Notes: Only the countries with a GDP representing more than 1% of World's GDP (measured by current US$) in 2006 are shown. Manufacturing products include food industries. The five big emerging countries are underlined.
Source: CEPII, CHELEM-INT, July 2007.
Figure 7 China and India: Share in World Trade
primary / manufacturing / services (in % of sector’s world trade)
Exports Imports CHINA
China and India in International Trade: From laggards to Leaders
20
7.0
1.4
9.2
3.0
0
1
2
3
4
5
6
7
8
9
10
85 87 89 91 93 95 97 99 01 03 05
4.8
6.4
4.8
3.5
0
1
2
3
4
5
6
7
8
9
10
85 87 89 91 93 95 97 99 01 03 05
INDIA
1.2
0.81.0
2.0
0.0
1.0
2.0
3.0
4.0
5.0
85 87 89 91 93 95 97 99 01 03 05
1.4
3.4
1.0
1.7
0.0
1.0
2.0
3.0
4.0
5.0
85 87 89 91 93 95 97 99 01 03 05
Total Primary Manufacturing Services
Source: CEPII, CHELEM-INT-BOP, May 2007.
CEPII, Working Paper No 2007-19
21
Figure 8 Share in world exports of manufacturing products: 1985-2005
(in % of world exports of manufacturing)
0.0
0.5
1.0
1.5
2.0
2.5
3.0
3.5
85 87 89 91 93 95 97 99 01 03 050
2
4
6
8
10
12
Mexico Brazil IndiaRussia China
right scale, China
Source: CEPII, CHELEM-INT, May 2007.
Demand side
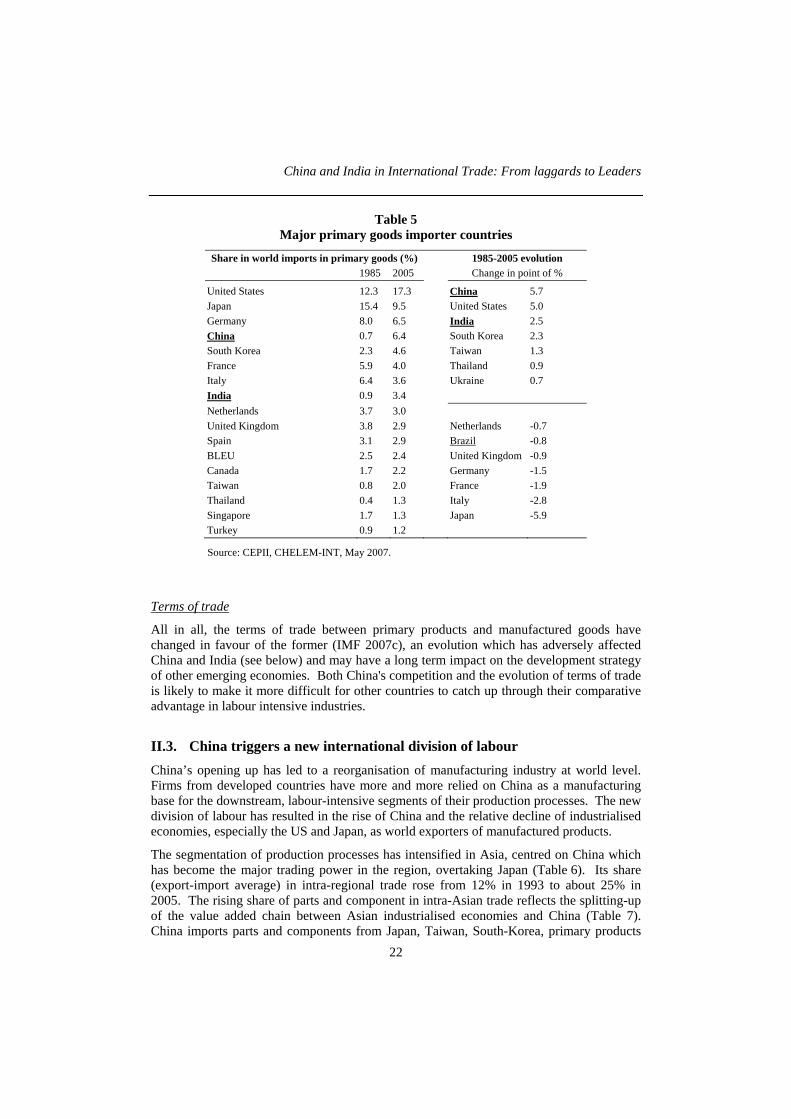
Over the last decade, the share of China and India in world imports of primary products increased much faster than their share in world imports of manufactured goods. Between 1985 and 2005, China’s share in world imports of primary products steadily increased from less than 1% to more than 6.4%, and now exceeds its share in world imports of manufactured goods. China is now a major importer of iron ores, non ferrous ores, raw agricultural products (Table 5). India’s imports of primary goods have accelerated since 1995, and their share in world trade of the primary goods more than trebled in ten years reaching 3.4% in 2005.
The surge of China’s and India’s demand has had strong effects on world markets of primary products (volume and prices), increasing the revenue of countries exporting oil and commodities, among which emerging economies such as Russia and Brazil. Through this indirect effect also, China’s and India’s demand for primary products has contributed to increase international demand for manufactured products (Table 4).
China and India in International Trade: From laggards to Leaders
22
Table 5 Major primary goods importer countries
Share in world imports in primary goods (%) 1985-2005 evolution 1985 2005 Change in point of %
United States 12.3 17.3 China 5.7 Japan 15.4 9.5 United States 5.0 Germany 8.0 6.5 India 2.5 China 0.7 6.4 South Korea 2.3 South Korea 2.3 4.6 Taiwan 1.3 France 5.9 4.0 Thailand 0.9 Italy 6.4 3.6 Ukraine 0.7 India 0.9 3.4 Netherlands 3.7 3.0 United Kingdom 3.8 2.9 Netherlands -0.7 Spain 3.1 2.9 Brazil -0.8 BLEU 2.5 2.4 United Kingdom -0.9 Canada 1.7 2.2 Germany -1.5 Taiwan 0.8 2.0 France -1.9 Thailand 0.4 1.3 Italy -2.8 Singapore 1.7 1.3 Japan -5.9 Turkey 0.9 1.2
Source: CEPII, CHELEM-INT, May 2007.
Terms of trade
All in all, the terms of trade between primary products and manufactured goods have changed in favour of the former (IMF 2007c), an evolution which has adversely affected China and India (see below) and may have a long term impact on the development strategy of other emerging economies. Both China's competition and the evolution of terms of trade is likely to make it more difficult for other countries to catch up through their comparative advantage in labour intensive industries.
II.3. China triggers a new international division of labour China’s opening up has led to a reorganisation of manufacturing industry at world level. Firms from developed countries have more and more relied on China as a manufacturing base for the downstream, labour-intensive segments of their production processes. The new division of labour has resulted in the rise of China and the relative decline of industrialised economies, especially the US and Japan, as world exporters of manufactured products.
The segmentation of production processes has intensified in Asia, centred on China which has become the major trading power in the region, overtaking Japan (Table 6). Its share (export-import average) in intra-regional trade rose from 12% in 1993 to about 25% in 2005. The rising share of parts and component in intra-Asian trade reflects the splitting-up of the value added chain between Asian industrialised economies and China (Table 7). China imports parts and components from Japan, Taiwan, South-Korea, primary products
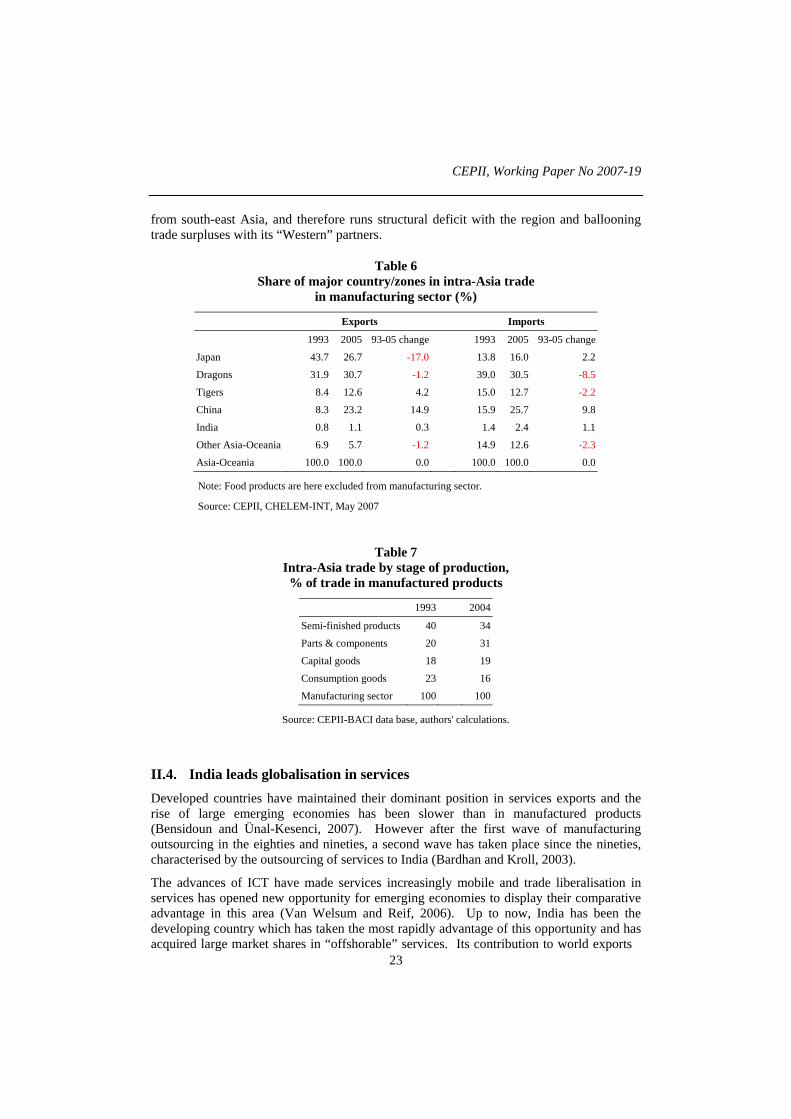
CEPII, Working Paper No 2007-19
23
from south-east Asia, and therefore runs structural deficit with the region and ballooning trade surpluses with its “Western” partners.
Table 6 Share of major country/zones in intra-Asia trade
in manufacturing sector (%)
Exports Imports
1993 2005 93-05 change 1993 2005 93-05 change
Japan 43.7 26.7 -17.0 13.8 16.0 2.2
Dragons 31.9 30.7 -1.2 39.0 30.5 -8.5
Tigers 8.4 12.6 4.2 15.0 12.7 -2.2
China 8.3 23.2 14.9 15.9 25.7 9.8
India 0.8 1.1 0.3 1.4 2.4 1.1
Other Asia-Oceania 6.9 5.7 -1.2 14.9 12.6 -2.3
Asia-Oceania 100.0 100.0 0.0 100.0 100.0 0.0
Note: Food products are here excluded from manufacturing sector.
Source: CEPII, CHELEM-INT, May 2007
Table 7 Intra-Asia trade by stage of production, % of trade in manufactured products
1993 2004
Semi-finished products 40 34
Parts & components 20 31
Capital goods 18 19
Consumption goods 23 16
Manufacturing sector 100 100
Source: CEPII-BACI data base, authors' calculations.
II.4. India leads globalisation in services Developed countries have maintained their dominant position in services exports and the rise of large emerging economies has been slower than in manufactured products (Bensidoun and Ünal-Kesenci, 2007). However after the first wave of manufacturing outsourcing in the eighties and nineties, a second wave has taken place since the nineties, characterised by the outsourcing of services to India (Bardhan and Kroll, 2003).
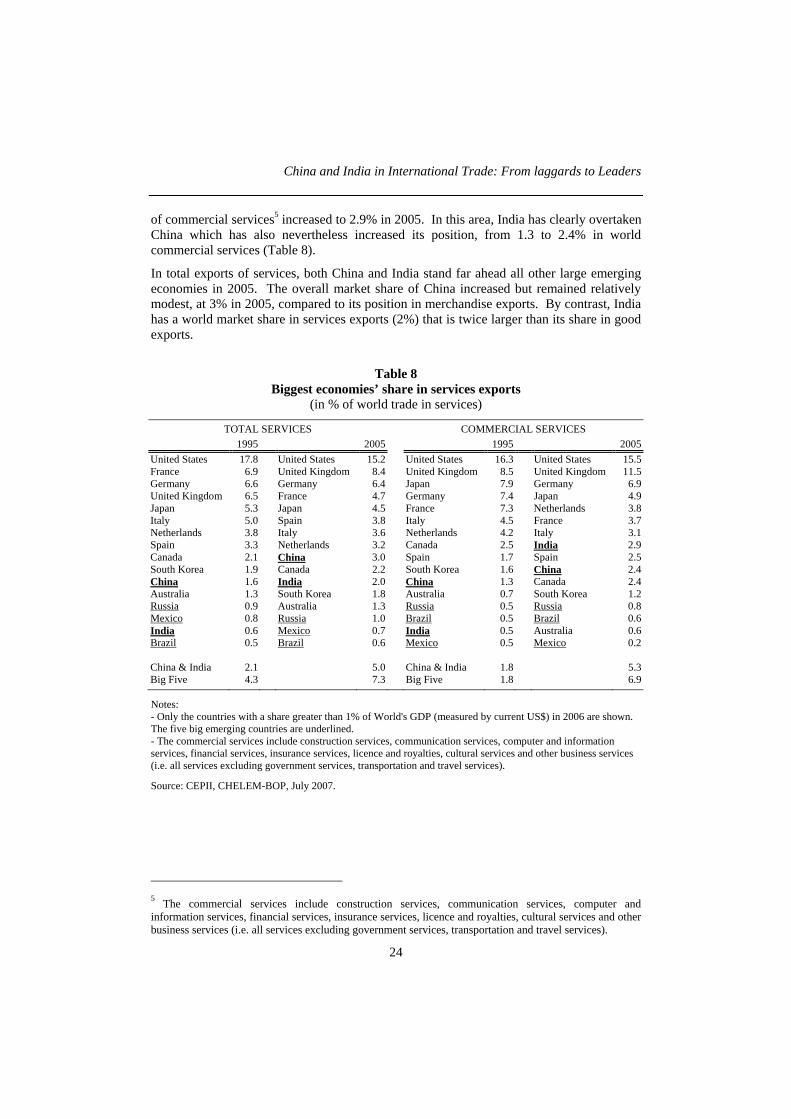
The advances of ICT have made services increasingly mobile and trade liberalisation in services has opened new opportunity for emerging economies to display their comparative advantage in this area (Van Welsum and Reif, 2006). Up to now, India has been the developing country which has taken the most rapidly advantage of this opportunity and has acquired large market shares in “offshorable” services. Its contribution to world exports
China and India in International Trade: From laggards to Leaders
24
of commercial services5 increased to 2.9% in 2005. In this area, India has clearly overtaken China which has also nevertheless increased its position, from 1.3 to 2.4% in world commercial services (Table 8).
In total exports of services, both China and India stand far ahead all other large emerging economies in 2005. The overall market share of China increased but remained relatively modest, at 3% in 2005, compared to its position in merchandise exports. By contrast, India has a world market share in services exports (2%) that is twice larger than its share in good exports.
Table 8 Biggest economies’ share in services exports
(in % of world trade in services)
TOTAL SERVICES COMMERCIAL SERVICES 1995 2005 1995 2005
United States 17.8 United States 15.2 United States 16.3 United States 15.5 France 6.9 United Kingdom 8.4 United Kingdom 8.5 United Kingdom 11.5 Germany 6.6 Germany 6.4 Japan 7.9 Germany 6.9 United Kingdom 6.5 France 4.7 Germany 7.4 Japan 4.9 Japan 5.3 Japan 4.5 France 7.3 Netherlands 3.8 Italy 5.0 Spain 3.8 Italy 4.5 France 3.7 Netherlands 3.8 Italy 3.6 Netherlands 4.2 Italy 3.1 Spain 3.3 Netherlands 3.2 Canada 2.5 India 2.9 Canada 2.1 China 3.0 Spain 1.7 Spain 2.5 South Korea 1.9 Canada 2.2 South Korea 1.6 China 2.4 China 1.6 India 2.0 China 1.3 Canada 2.4 Australia 1.3 South Korea 1.8 Australia 0.7 South Korea 1.2 Russia 0.9 Australia 1.3 Russia 0.5 Russia 0.8 Mexico 0.8 Russia 1.0 Brazil 0.5 Brazil 0.6 India 0.6 Mexico 0.7 India 0.5 Australia 0.6 Brazil 0.5 Brazil 0.6 Mexico 0.5 Mexico 0.2
China & India 2.1 5.0 China & India 1.8 5.3 Big Five 4.3 7.3 Big Five 1.8 6.9
Notes: - Only the countries with a share greater than 1% of World's GDP (measured by current US$) in 2006 are shown. The five big emerging countries are underlined. - The commercial services include construction services, communication services, computer and information services, financial services, insurance services, licence and royalties, cultural services and other business services (i.e. all services excluding government services, transportation and travel services).
Source: CEPII, CHELEM-BOP, July 2007.
5 The commercial services include construction services, communication services, computer and information services, financial services, insurance services, licence and royalties, cultural services and other business services (i.e. all services excluding government services, transportation and travel services).
CEPII, Working Paper No 2007-19
25
III. FROM TRADITIONAL SPECIALISATION TO NEW OUTWARD-ORIENTED SECTORS
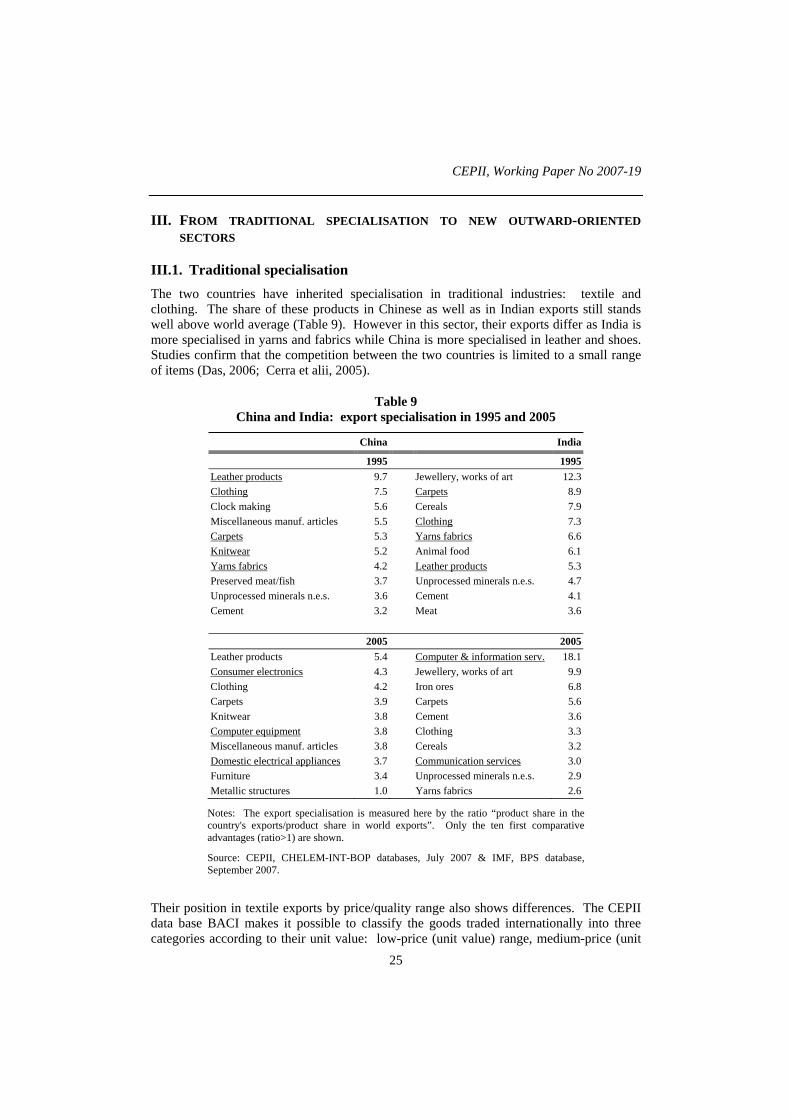
III.1. Traditional specialisation The two countries have inherited specialisation in traditional industries: textile and clothing. The share of these products in Chinese as well as in Indian exports still stands well above world average (Table 9). However in this sector, their exports differ as India is more specialised in yarns and fabrics while China is more specialised in leather and shoes. Studies confirm that the competition between the two countries is limited to a small range of items (Das, 2006; Cerra et alii, 2005).
Table 9 China and India: export specialisation in 1995 and 2005
China India
1995 1995 Leather products 9.7 Jewellery, works of art 12.3 Clothing 7.5 Carpets 8.9 Clock making 5.6 Cereals 7.9 Miscellaneous manuf. articles 5.5 Clothing 7.3 Carpets 5.3 Yarns fabrics 6.6 Knitwear 5.2 Animal food 6.1 Yarns fabrics 4.2 Leather products 5.3 Preserved meat/fish 3.7 Unprocessed minerals n.e.s. 4.7 Unprocessed minerals n.e.s. 3.6 Cement 4.1 Cement 3.2 Meat 3.6 2005 2005 Leather products 5.4 Computer & information serv. 18.1 Consumer electronics 4.3 Jewellery, works of art 9.9 Clothing 4.2 Iron ores 6.8 Carpets 3.9 Carpets 5.6 Knitwear 3.8 Cement 3.6 Computer equipment 3.8 Clothing 3.3 Miscellaneous manuf. articles 3.8 Cereals 3.2 Domestic electrical appliances 3.7 Communication services 3.0 Furniture 3.4 Unprocessed minerals n.e.s. 2.9 Metallic structures 1.0 Yarns fabrics 2.6
Notes: The export specialisation is measured here by the ratio “product share in the country's exports/product share in world exports”. Only the ten first comparative advantages (ratio>1) are shown.
Source: CEPII, CHELEM-INT-BOP databases, July 2007 & IMF, BPS database, September 2007.
Their position in textile exports by price/quality range also shows differences. The CEPII data base BACI makes it possible to classify the goods traded internationally into three categories according to their unit value: low-price (unit value) range, medium-price (unit
China and India in International Trade: From laggards to Leaders
26
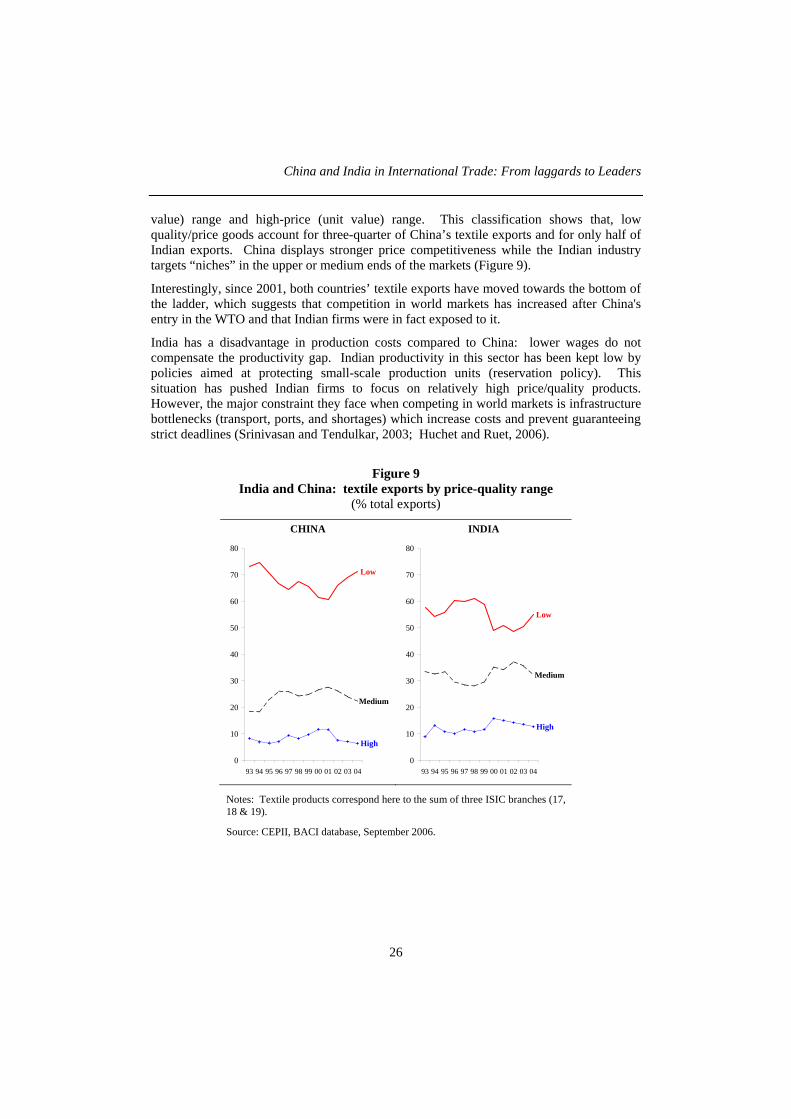
value) range and high-price (unit value) range. This classification shows that, low quality/price goods account for three-quarter of China’s textile exports and for only half of Indian exports. China displays stronger price competitiveness while the Indian industry targets “niches” in the upper or medium ends of the markets (Figure 9).
Interestingly, since 2001, both countries’ textile exports have moved towards the bottom of the ladder, which suggests that competition in world markets has increased after China's entry in the WTO and that Indian firms were in fact exposed to it.
India has a disadvantage in production costs compared to China: lower wages do not compensate the productivity gap. Indian productivity in this sector has been kept low by policies aimed at protecting small-scale production units (reservation policy). This situation has pushed Indian firms to focus on relatively high price/quality products. However, the major constraint they face when competing in world markets is infrastructure bottlenecks (transport, ports, and shortages) which increase costs and prevent guaranteeing strict deadlines (Srinivasan and Tendulkar, 2003; Huchet and Ruet, 2006).
Figure 9 India and China: textile exports by price-quality range
(% total exports)
CHINA INDIA
Low
Medium
High
0
10
20
30
40
50
60
70
80
93 94 95 96 97 98 99 00 01 02 03 04
Low
Medium
High
0
10
20
30
40
50
60
70
80
93 94 95 96 97 98 99 00 01 02 03 04
Notes: Textile products correspond here to the sum of three ISIC branches (17, 18 & 19).
Source: CEPII, BACI database, September 2006.
CEPII, Working Paper No 2007-19
27
III.2. New specialisation in ITC sectors While keeping their traditional specialisation, since the 1990s, India and China have developed specialisation in new sectors. China has diversified its manufactured exports and built-up export capacities in electrical and electronic goods which have become the new engine of its export surge (Table 9, above). India’s manufacturing exports have remained concentrated in textile and clothing but the country has developed strong exports of computer and information services and has become a leading world exporter in this sector, with a degree of specialisation which is exceptionally high (Table 9).
The two areas in which China and India have developed their new specialisation have common features.
First, they correspond to very dynamic segments in international trade (World Bank, 2006b). Between 1995 and 2005, world trade increased at an annual rate of 7.8% in electronic goods and of 23.9% in computer and information services against 7.1% for overall goods and services6. Both India and China have taken advantage of expanding world demand to develop new production capacities and the new sectors have a strong outward orientation.
Second, firms from advanced economies have been actively involved in the expansion of these new sectors in China and India, through outsourcing and offshoring. If one refers to the distinction between outsourcing as “contracting out parts of the production process to foreign suppliers” and offshoring as “moving production abroad by setting foreign subsidiaries” (Denis et alii, 2006), it stands out that offshoring has been at the core of China’s exports of electronic goods; India’s success in service exports has been initially based mainly on outsourcing but is now based on diversified firms’ strategies, from outsourcing to offshoring (OECD, 2006b).
Globalisation has thus provided the two countries with a short-circuit towards economic modernisation. The jump from traditional industries to advanced technology sectors shows that in both countries, it proved less difficult and more rapid to create production capacities in new sectors than to renovate traditional industries burdened with old capital equipment and often located in highly regulated sectors. In China, FDI provided local entrepreneurs with the financing means they needed (Héricourt and Poncet, 2007); in India, local entrepreneurs chose to develop activities in sectors with relatively low financial requirements and which were less constrained than manufacturing by infrastructure bottlenecks, and labour laws (Rakshit, 2007).
China has become a world manufacturing platform of electronic goods and is now a world leading exporter of these products, accounting for around 15-20% of world exports (Winters and Yusuf, 2006). This outstanding performance has been built on large foreign direct investment flows which have created huge assembly lines of electronic products in Chinese coastal provinces. In the early 2000s, firms with foreign capital were responsible for more than half of China’s total exports and for 80% of China’s exports of electronic products (computer and telecommunication equipment), most of which resulted from assembly of imported components from Asia. 6 In current US$, according to CHELEM database (July 2007). Electronic products accounted for 11.8% of world trade in goods and services in 2005 but computer and information services only 0.8%.
China and India in International Trade: From laggards to Leaders
28
India’s new specialisation in services is also based on its emergence as a global centre for outsourcing information technology and other enabling services. This sector derives 80% of its income from exports. In the 1980s, MNCs begun outsourcing computer services from Indian firms, and this movement accelerated in the 1990, favouring the development of large Indian firms (Infosys, Wipro). More and more, MNCs are setting affiliates in India to provide these services (insourcing). FDI has played an increasing part in the development of the most dynamic business services and firms with foreign capital are now responsible for 1/3 of India exports of computer services and for 2/3 of its exports of other IT services (OECD, 2006a; World Bank 2004).
At the core of China’s and India’s successes in these sectors lie the availability of labour force at low wages and the search for high productivity. In China, labour productivity in manufacturing industry has increased at an accelerated pace since the late 1990s and stood in 2004 at one fourth of the US level (against 8% in 1996) (Ren R. & H. Zheng (2006)). These productivity gains were obtained through massive redundancies in the state-owned industry which had been massively overstaffed and through the expansion of private (domestic and foreign ) businesses. In India, the labour productivity in software companies is estimated at 44% of the US levels and, more generally, the fastest growing service sectors have been the least labour intensive ones (Srinivasan, 2006). In the two countries, the economic take off has not been accompanied by large job creations and employment has almost stagnated in the organised sector. However the surge of economic growth since the early 2000s seems to have been more job-intensive in both countries (Rangarajan et alii, 2007; OECD, 2007a; Lemoine, 2006).
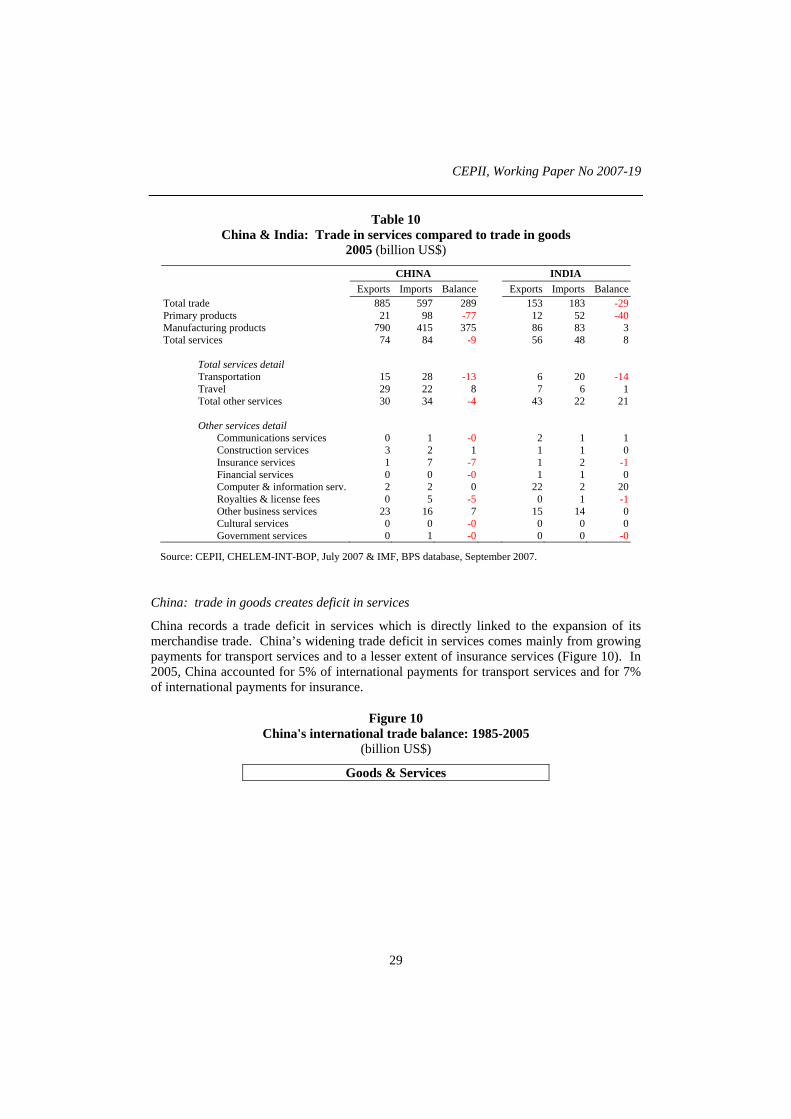
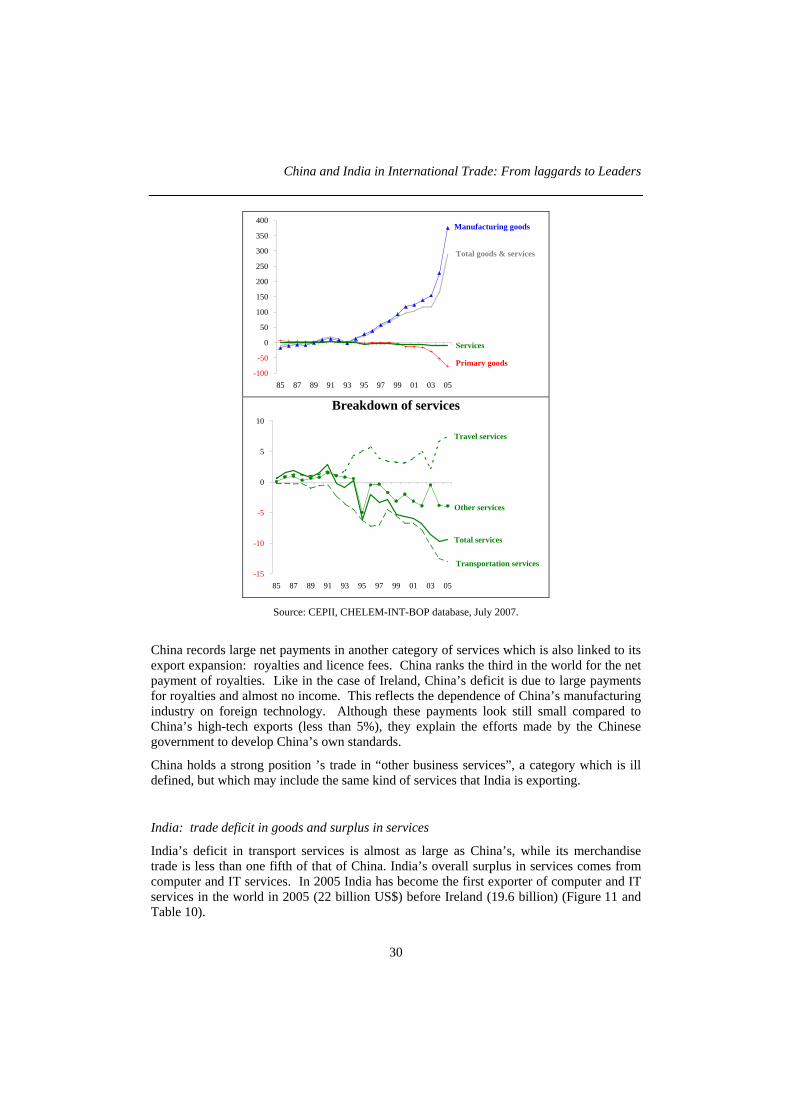
III.3. Inverse imbalances in services: China's deficit, India's surplus Both China and India record a trade deficit in primary goods and a trade surplus in manufactured goods (although of different size), but record opposite trade balances in services, respectively a deficit and a surplus. In China’s case the deficit in services is relatively small and largely covered by the surplus in manufactured goods. In Indian case, the surplus in services is bigger than the surplus in manufactured products and covers one fifth of the deficit in primary products (Table 10). Both countries record a large deficit in transport services, and to a lesser extent in insurance, which are sectors where advanced countries, especially Europe, have kept strong international positions and large competitive firms.
CEPII, Working Paper No 2007-19
29
Table 10 China & India: Trade in services compared to trade in goods
2005 (billion US$)
CHINA INDIA Exports Imports Balance Exports Imports Balance
Total trade 885 597 289 153 183 -29 Primary products 21 98 -77 12 52 -40 Manufacturing products 790 415 375 86 83 3 Total services 74 84 -9 56 48 8
Total services detail Transportation 15 28 -13 6 20 -14 Travel 29 22 8 7 6 1 Total other services 30 34 -4 43 22 21 Other services detail
Communications services 0 1 -0 2 1 1 Construction services 3 2 1 1 1 0 Insurance services 1 7 -7 1 2 -1 Financial services 0 0 -0 1 1 0 Computer & information serv. 2 2 0 22 2 20 Royalties & license fees 0 5 -5 0 1 -1 Other business services 23 16 7 15 14 0 Cultural services 0 0 -0 0 0 0 Government services 0 1 -0 0 0 -0
Source: CEPII, CHELEM-INT-BOP, July 2007 & IMF, BPS database, September 2007.
China: trade in goods creates deficit in services
China records a trade deficit in services which is directly linked to the expansion of its merchandise trade. China’s widening trade deficit in services comes mainly from growing payments for transport services and to a lesser extent of insurance services (Figure 10). In 2005, China accounted for 5% of international payments for transport services and for 7% of international payments for insurance.
Figure 10 China's international trade balance: 1985-2005
(billion US$)
Goods & Services
China and India in International Trade: From laggards to Leaders
30
-100
-50
0
50
100
150
200
250
300
350
400
85 87 89 91 93 95 97 99 01 03 05
Manufacturing goods
Total goods & services
Services
Primary goods
Breakdown of services
-15
-10
-5
0
5
10
85 87 89 91 93 95 97 99 01 03 05
Travel services
Total services
Other services
Transportation services
Source: CEPII, CHELEM-INT-BOP database, July 2007.
China records large net payments in another category of services which is also linked to its export expansion: royalties and licence fees. China ranks the third in the world for the net payment of royalties. Like in the case of Ireland, China’s deficit is due to large payments for royalties and almost no income. This reflects the dependence of China’s manufacturing industry on foreign technology. Although these payments look still small compared to China’s high-tech exports (less than 5%), they explain the efforts made by the Chinese government to develop China’s own standards.
China holds a strong position ’s trade in “other business services”, a category which is ill defined, but which may include the same kind of services that India is exporting.
India: trade deficit in goods and surplus in services
India’s deficit in transport services is almost as large as China’s, while its merchandise trade is less than one fifth of that of China. India’s overall surplus in services comes from computer and IT services. In 2005 India has become the first exporter of computer and IT services in the world in 2005 (22 billion US$) before Ireland (19.6 billion) (Figure 11 and Table 10).

CEPII, Working Paper No 2007-19
31
Figure 11 India's international trade balance: 1985-2005
(billion US$)
Goods & Services
-50
-40
-30
-20
-10
0
10
20
85 87 89 91 93 95 97 99 01 03 05
Manufacturing goods
Total goods & services
Services
Primary goods
Breakdown of services
-20
-15
-10
-5
0
5
10
15
20
25
85 87 89 91 93 95 97 99 01 03 05
Travel services
Total services
Other services
Transportation services
Source: CEPII, CHELEM-INT database, July 2007 & IMF, BPS database, September 2007.
IV. TECHNOLOGICAL CATCH-UP AND QUALITY UPGRADING
The question which is now coming to the front is the capacity of the two countries to climb up the technological ladder and to diversify their exports towards goods incorporating more value-added. Several observations point to the fact that they are on a path of technological catch-up but that, presently, they still stand far behind advanced economies. Their high-tech exports remain dominated by low price/quality products showing that the progress towards technological upgrading is dissociated from the progress in price/quality range.
China and India in International Trade: From laggards to Leaders
32
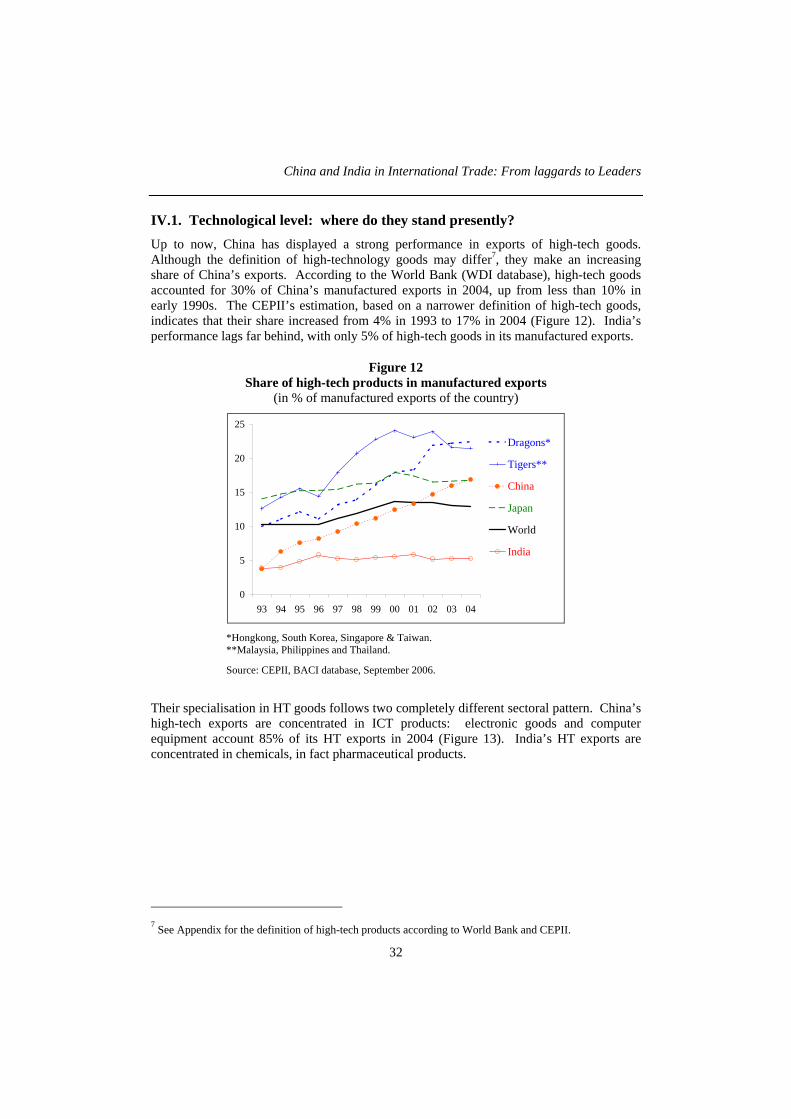
IV.1. Technological level: where do they stand presently? Up to now, China has displayed a strong performance in exports of high-tech goods. Although the definition of high-technology goods may differ7, they make an increasing share of China’s exports. According to the World Bank (WDI database), high-tech goods accounted for 30% of China’s manufactured exports in 2004, up from less than 10% in early 1990s. The CEPII’s estimation, based on a narrower definition of high-tech goods, indicates that their share increased from 4% in 1993 to 17% in 2004 (Figure 12). India’s performance lags far behind, with only 5% of high-tech goods in its manufactured exports.
Figure 12 Share of high-tech products in manufactured exports
(in % of manufactured exports of the country)
0
5
10
15
20
25
93 94 95 96 97 98 99 00 01 02 03 04
Dragons*
Tigers**
China
Japan
World
India
*Hongkong, South Korea, Singapore & Taiwan. **Malaysia, Philippines and Thailand.
Source: CEPII, BACI database, September 2006.
Their specialisation in HT goods follows two completely different sectoral pattern. China’s high-tech exports are concentrated in ICT products: electronic goods and computer equipment account 85% of its HT exports in 2004 (Figure 13). India’s HT exports are concentrated in chemicals, in fact pharmaceutical products.
7 See Appendix for the definition of high-tech products according to World Bank and CEPII.

CEPII, Working Paper No 2007-19
33
Figure 13 China and India: product composition of high-tech exports
(in % of high-tech exports), 2004
67
25
61
10
394
6
86
China India
Radio, TV & telecom.equipmentOffice machinery &computersMedical, precision &optical instrumentsChemicals & chemicalproductsOther high-tech
Source: CEPII, BACI database, September 2006.
China: HT exports dependent on foreign technology
In fact the high-tech content of China’s exports reflects its strong dependence on foreign technology and capital more than its actual innovation capacity (Lemoine & Ünal-Kesenci, 2003; Gaulier et alii, 2005; OECD 2007b). China’s performance is strongly based on its position in the international segmentation of production processes, as the overwhelming part of HT exports comes from assembly of imported high-tech parts and components.
China’s HT trade is heavily dependent on foreign affiliates as shown in Table 11. Foreign affiliates are responsible for an ever-growing share of China’s high-tech trade and play a dominant part both in exports and imports. In 2003, they carried out 80% (and wholly-foreign affiliates for half) of China’s high-tech exports. Excluding exports from foreign affiliates, the high-tech content of China’s exports is similar to that of India’s or other large emerging economies.
Table 11 Breakdown of China's high-tech trade by category of firms (%)
Imports Exports 1997 2003 1997 2003
Chinese firms 42 29 42 21 Joint Venture 33 21 28 27 Fully foreign owned firms 25 50 30 53All firms 100 100 100 100
Source: China's Customs Statistics, authors' calculations.
China and India in International Trade: From laggards to Leaders
34
This raises questions about the diffusion and assimilation of foreign technology by Chinese firms and about China’s indigenous technological capacities. Chinese firms have clearly lost ground in high-tech trade to firms with foreign capital. The gap between the performance of Chinese and foreign affiliates enlarged between 1997 and 2003. Defining the “high-tech intensity” as the share of high-tech products in total exports of each category of firms, it stands out that exports by wholly-foreign affiliates were three times more intensive in high-technology than exports by Chinese firms in 2003 (export intensity of 7% vs 20%) against twice in 1997 (5% and 11% respectively (Gaulier et alii, 2005)).
However, there is increasing evidence that the situation is rapidly changing in the domestic market where Chinese firms are improving their position and enlarging their market for ICT goods. They have a better knowledge of the needs of the domestic demand and they have been able to source their inputs from the global supply chains established by multinational firms in China. Currently there is an intense competition between multinational firms and Chinese firms in the domestic market (Fan, 2006).8
India’s pharmaceutical industry: from imitation to innovation
India’s specialisation in high-tech products has followed a different pattern from China. In the wake of legislation passed in the 1970s, which ended the application of international law on patents, and replaced it by legislation aimed at facilitating the acquisition of foreign technology, India has developed powerful domestic companies in pharmaceutical sector, with a strong presence on both domestic and foreign markets. India has become the world’s top exporter of generic medicines (20% of the global market) and Indian companies have captured the local market in pharmaceutical products (65% in early 2000 compared to 25% in 1971).
The pharmaceutical industry is based on highly-qualified personnel integrated into international networks, high quality public research institutions and benefits from the large domestic market. The local pharmaceutical industry (including both national and foreign companies) meets 80% of the domestic demand for drugs and exports about one third of its production.
In 2005, Indian patent law was revised and put into line to the TRIPs agreement, a change that induces the pharmaceutical firms to move beyond imitation towards innovation. The new legislation should stimulate the development of on R&D and innovation in the pharmaceutical industry, both in Indian companies and in foreign affiliates. Although R&D expenses of Indian pharmaceutical firms are on average still relatively low (less than 2% of their turnover), for a dozen of firms the share is already between 6% and 15%. Biotechnology is generally seen as a test case for Indian ambitions to become a global science leader (Maria et alii, 2003; Bound , 2007).
8 This idea was also developed in an article submitted for publication in World Development by an author still anonymous.
CEPII, Working Paper No 2007-19
35
IV.2. Technological catch-up: closing the gap will take time Presently, the two countries still lag far behind advanced economies as innovation centres but they have huge potential for catch-up (Leadbeater and Wilsdon, 2007).
The present output of research in China and India, measured by international patent applications, is increasing but still limited. In 2003, in the distribution of US patent granted to foreign firms, China ranked 21th with 0.3% of the total and India 19th with 0.4%. Other more synthetic indicators of scientific and technological level confirm that, in early 2000s, there rank is at the bottom of the country list: out of 46 countries, China is 39th on average and India 44th (Sachwald, 2006).
Several factors are often put forwards to support a relatively optimistic view of the pace of catch-up, but they need qualification.
First, the huge pool of talents: in both countries, the number of young graduates is increasing fast as a result of efforts to expand tertiary education. However, only a fraction of them meets international standards and the labour market is characterised by a shortage of highly skilled people. “Shortage amid plenty” and rising wages for this category of people are among the major obstacles to the development of high-value activities (McKinsey, 2005; Kochhar et alii, 2006; Leadbeater and Wilsdon, 2007; Van Welsum and Xu, 2007).
Recent rise in R&D spending in both countries is also a positive trend. China has recently put a priority on domestic R&D and has increased substantially its R&D to 1.2% of GDP in 2004. Using purchasing power parity to measure China’s contribution to world R&D expenses, the OECD came to the conclusion that China ranked fourth in the world, after the US, the EU and Japan. This method however tends to overestimated China’s R&D effort which is still very small compared to that of US at the current exchange rate.9 In India, R&D expenses are also rising but still relatively low (less than 0.8 % of GDP).
Innovation capacity of India and China is also boosted by the internationalisation of research, which has led MNCs to create a growing number of R&D centres in India and China. The two countries have become among the most attractive locations for foreign firms investing in R&D (OECD, 2006b), indicating that they may also develop a comparative advantage in this activity which had been up to recently the prerogative of developed economies. Surveys on international R&D centres in these two countries reveal that most of them are devoted to technological development and adaptation to the local markets, and only a small number of them to innovation and research (Sun et alii, 2006). However, this distinction may be less and less relevant as the boundary between research and development is being blurred in many sectors of new technology (The Economist, 2007).
Finally while in the past, inward foreign investment has been a channel for technological transfer, outward investment is now becoming a way for Chinese and Indian firms to acquire foreign technology. Some of the Chinese firms in ICT begin to emerge as global
9 The PPP used by OECD is four time the current exchange rate and it is controversial. The 2005 International Comparison Program in Asia and Pacific has resulted in new estimations for China’s PPP which put it at around twice the exchange rate (ADB, 2007).

China and India in International Trade: From laggards to Leaders
36
players (TCL, Lenovo), and develop an active strategy of acquisition in order to enlarge their network and improve their technological capacities (IMF 2007b; Sigurdson, 2005; UNCTAD, 2006). Indian firms are taking an active part in the process of vertical integration taking place at the world level in the pharmaceutical industry. They buy firms in Europe and the US in order to control the distribution network of their products and in order to acquire patents. This investment abroad is expanding rapidly and is expected to remain a long-term trend.
IV.3. Price-competitiveness We used the CEPII data base BACI to analyse China’s and India’s trade flows by price-quality range and the evolution of their respective export and import prices over the last decade (the data are based on the unit values of traded goods calculated at the most detailed level of classification10).
The classification of trade flows by price/quality range confirms China’s strong specialisation in low-price/quality goods. In 2004, 70% of China’s exports belonged to the low-price/quality range, 17% to the medium price/quality range and 10% to the high range (Figure 14). This distribution has not changed since the early 1990s. Among other emerging economies, only Mexico has such a strong concentration of exports on low-price/quality range in 2004 (73%), since Mexican exports have rapidly moved away from medium- and high-price/quality range since 1997. The enforcement of NAFTA seems to have led to a sharp decline of Mexico’s relative export prices since the end of the nineties (low price/quality goods accounted for only 50% of the total in 1997 and 68% in 2001).
The low unit values of Chinese and Mexican exports can be explained in several ways. Lower quality is one of the explanations; another reason is lower prices due to low production cost and fierce competition between producing firms. Similarity between China and Mexico may thus come from the importance, in both countries, of outward-oriented industries which put strong downward pressures on prices, as the cost of switching away to another supplier may be relatively low in the case of standardised or modular products (Dimaranan, 2007). China's exports of high-price/quality products are especially small (10%) compared to any other emerging economy.
By contrast, India’s export pattern is more in line with that of emerging economies such as the Tigers (Malaysia, Philippines and Thailand), or Brazil, which have a higher income level. In India's exports, medium and high price/quality products are twice as important as in China’s. Moreover, India has tended to improve its position on price/quality ladder over the last ten years (relative decline of down market products and increase of up market products). In contrast with China, India has followed a strategy aimed at supplying higher quality goods or “customized” products and services.
10 See http://www.cepii.fr/anglaisgraph/bdd/baci.htm .
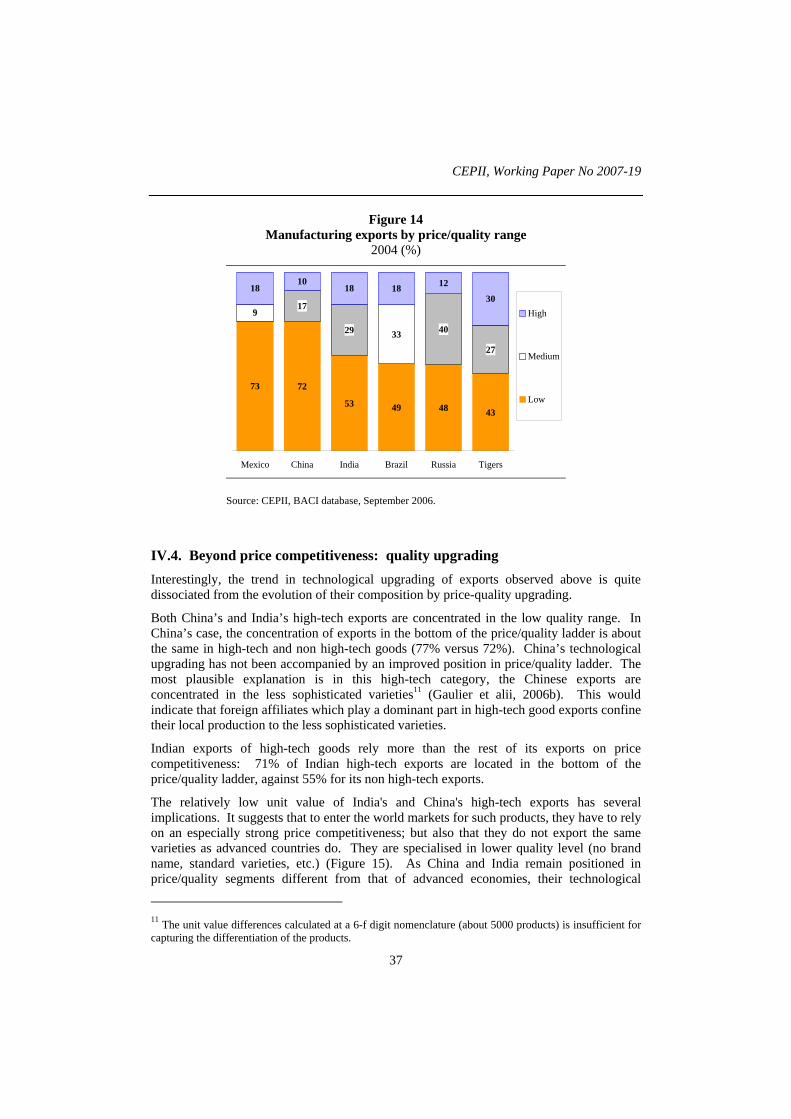
CEPII, Working Paper No 2007-19
37
Figure 14 Manufacturing exports by price/quality range
2004 (%)
73 72
53 49 48 43
917
29 33 40
27
1810
18 18 12
30
Mexico China India Brazil Russia Tigers
High
Medium
Low
Source: CEPII, BACI database, September 2006.
IV.4. Beyond price competitiveness: quality upgrading Interestingly, the trend in technological upgrading of exports observed above is quite dissociated from the evolution of their composition by price-quality upgrading.
Both China’s and India’s high-tech exports are concentrated in the low quality range. In China’s case, the concentration of exports in the bottom of the price/quality ladder is about the same in high-tech and non high-tech goods (77% versus 72%). China’s technological upgrading has not been accompanied by an improved position in price/quality ladder. The most plausible explanation is in this high-tech category, the Chinese exports are concentrated in the less sophisticated varieties11 (Gaulier et alii, 2006b). This would indicate that foreign affiliates which play a dominant part in high-tech good exports confine their local production to the less sophisticated varieties.
Indian exports of high-tech goods rely more than the rest of its exports on price competitiveness: 71% of Indian high-tech exports are located in the bottom of the price/quality ladder, against 55% for its non high-tech exports.
The relatively low unit value of India's and China's high-tech exports has several implications. It suggests that to enter the world markets for such products, they have to rely on an especially strong price competitiveness; but also that they do not export the same varieties as advanced countries do. They are specialised in lower quality level (no brand name, standard varieties, etc.) (Figure 15). As China and India remain positioned in price/quality segments different from that of advanced economies, their technological
11 The unit value differences calculated at a 6-f digit nomenclature (about 5000 products) is insufficient for capturing the differentiation of the products.
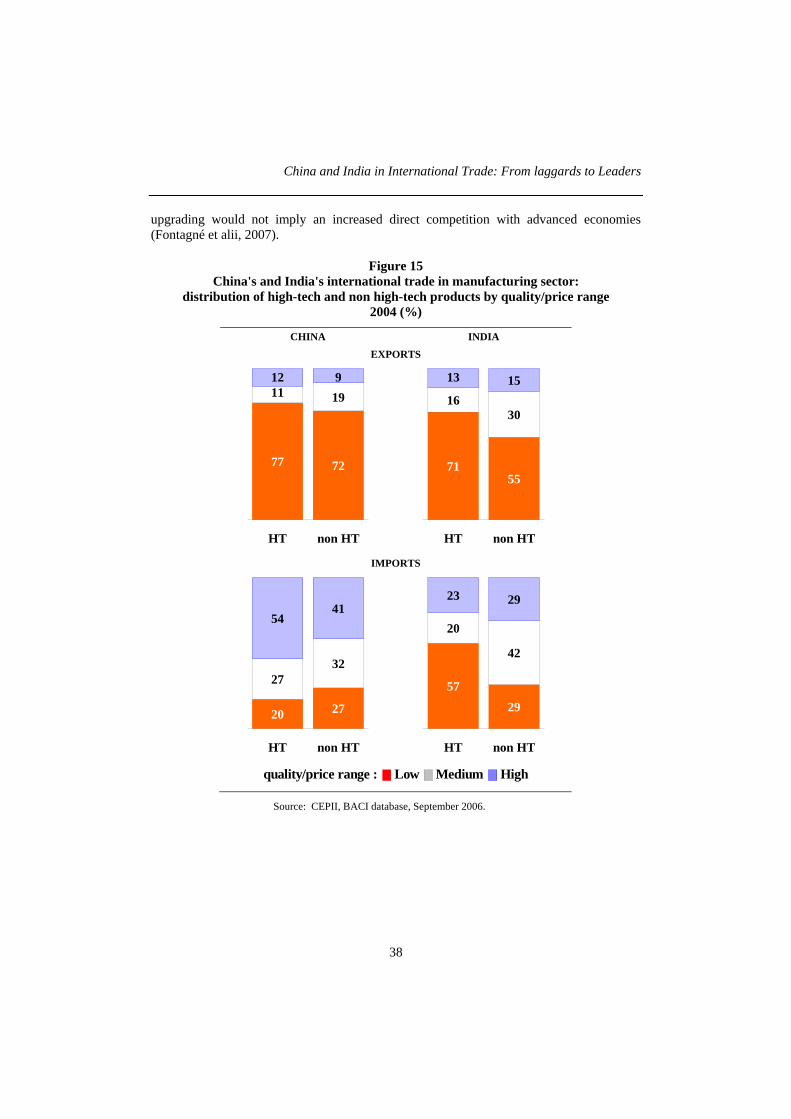
China and India in International Trade: From laggards to Leaders
38
upgrading would not imply an increased direct competition with advanced economies (Fontagné et alii, 2007).
Figure 15 China's and India's international trade in manufacturing sector:
distribution of high-tech and non high-tech products by quality/price range 2004 (%)
CHINA INDIA
EXPORTS
77 72
11 1912 9
HT non HT
7155
1630
13 15
HT non HT
IMPORTS
20 27
2732
5441
HT non HT
5729
20
42
23 29
HT non HT
Low Medium Highquality/price range :
Source: CEPII, BACI database, September 2006.
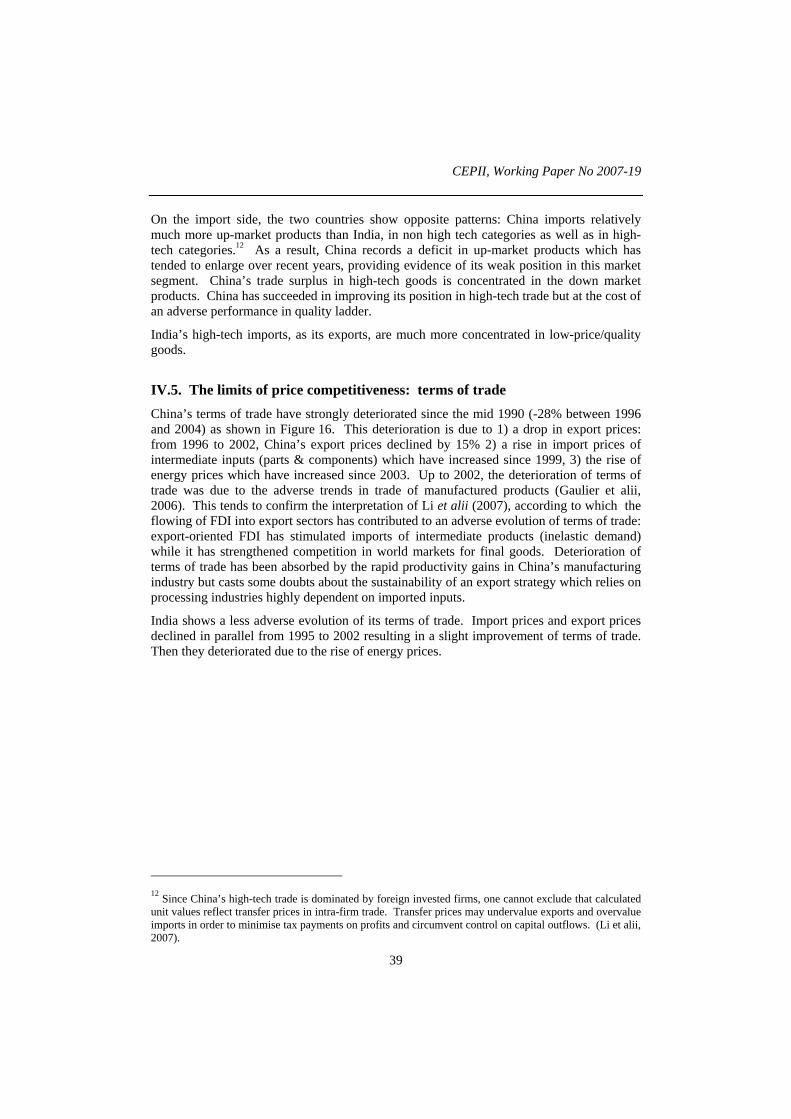
CEPII, Working Paper No 2007-19
39
On the import side, the two countries show opposite patterns: China imports relatively much more up-market products than India, in non high tech categories as well as in high-tech categories.12 As a result, China records a deficit in up-market products which has tended to enlarge over recent years, providing evidence of its weak position in this market segment. China’s trade surplus in high-tech goods is concentrated in the down market products. China has succeeded in improving its position in high-tech trade but at the cost of an adverse performance in quality ladder.
India’s high-tech imports, as its exports, are much more concentrated in low-price/quality goods.
IV.5. The limits of price competitiveness: terms of trade China’s terms of trade have strongly deteriorated since the mid 1990 (-28% between 1996 and 2004) as shown in Figure 16. This deterioration is due to 1) a drop in export prices: from 1996 to 2002, China’s export prices declined by 15% 2) a rise in import prices of intermediate inputs (parts & components) which have increased since 1999, 3) the rise of energy prices which have increased since 2003. Up to 2002, the deterioration of terms of trade was due to the adverse trends in trade of manufactured products (Gaulier et alii, 2006). This tends to confirm the interpretation of Li et alii (2007), according to which the flowing of FDI into export sectors has contributed to an adverse evolution of terms of trade: export-oriented FDI has stimulated imports of intermediate products (inelastic demand) while it has strengthened competition in world markets for final goods. Deterioration of terms of trade has been absorbed by the rapid productivity gains in China’s manufacturing industry but casts some doubts about the sustainability of an export strategy which relies on processing industries highly dependent on imported inputs.
India shows a less adverse evolution of its terms of trade. Import prices and export prices declined in parallel from 1995 to 2002 resulting in a slight improvement of terms of trade. Then they deteriorated due to the rise of energy prices.
12 Since China’s high-tech trade is dominated by foreign invested firms, one cannot exclude that calculated unit values reflect transfer prices in intra-firm trade. Transfer prices may undervalue exports and overvalue imports in order to minimise tax payments on profits and circumvent control on capital outflows. (Li et alii, 2007).
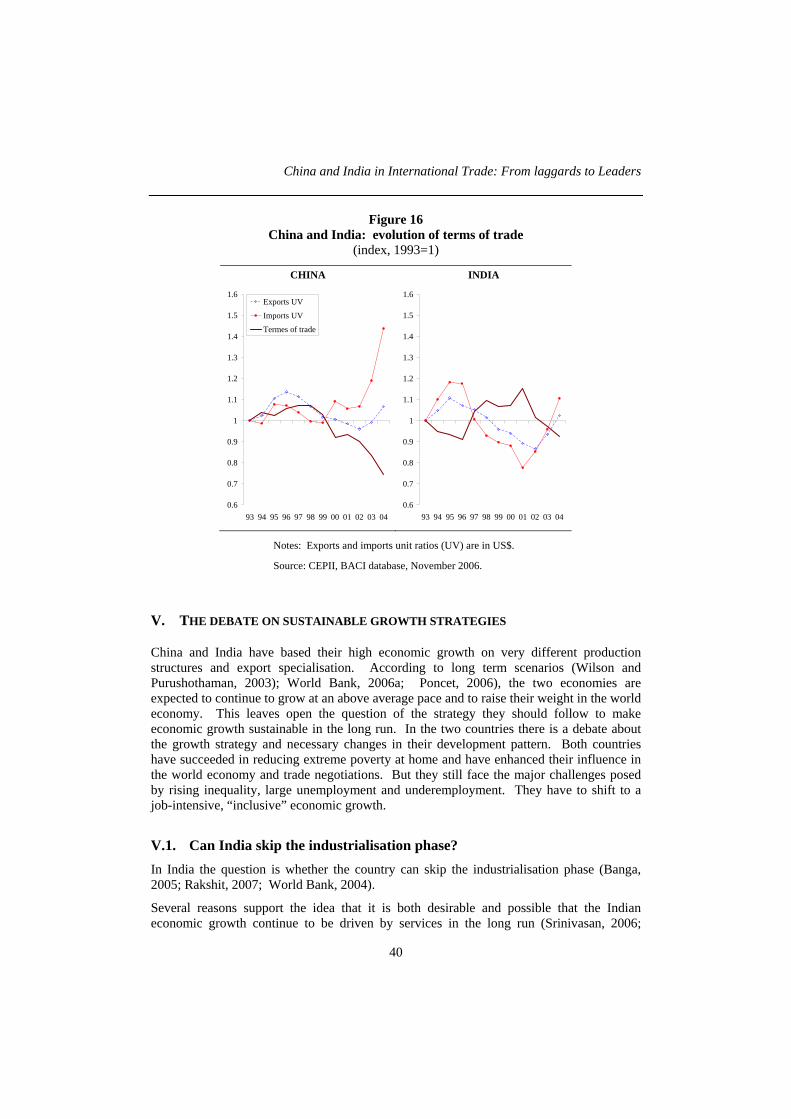
China and India in International Trade: From laggards to Leaders
40
Figure 16 China and India: evolution of terms of trade
(index, 1993=1)
CHINA INDIA
0.6
0.7
0.8
0.9
1
1.1
1.2
1.3
1.4
1.5
1.6
93 94 95 96 97 98 99 00 01 02 03 04
Exports UV
Imports UV
Termes of trade
0.6
0.7
0.8
0.9
1
1.1
1.2
1.3
1.4
1.5
1.6
93 94 95 96 97 98 99 00 01 02 03 04
Notes: Exports and imports unit ratios (UV) are in US$.
Source: CEPII, BACI database, November 2006.
V. THE DEBATE ON SUSTAINABLE GROWTH STRATEGIES
China and India have based their high economic growth on very different production structures and export specialisation. According to long term scenarios (Wilson and Purushothaman, 2003); World Bank, 2006a; Poncet, 2006), the two economies are expected to continue to grow at an above average pace and to raise their weight in the world economy. This leaves open the question of the strategy they should follow to make economic growth sustainable in the long run. In the two countries there is a debate about the growth strategy and necessary changes in their development pattern. Both countries have succeeded in reducing extreme poverty at home and have enhanced their influence in the world economy and trade negotiations. But they still face the major challenges posed by rising inequality, large unemployment and underemployment. They have to shift to a job-intensive, “inclusive” economic growth.
V.1. Can India skip the industrialisation phase? In India the question is whether the country can skip the industrialisation phase (Banga, 2005; Rakshit, 2007; World Bank, 2004).
Several reasons support the idea that it is both desirable and possible that the Indian economic growth continue to be driven by services in the long run (Srinivasan, 2006;
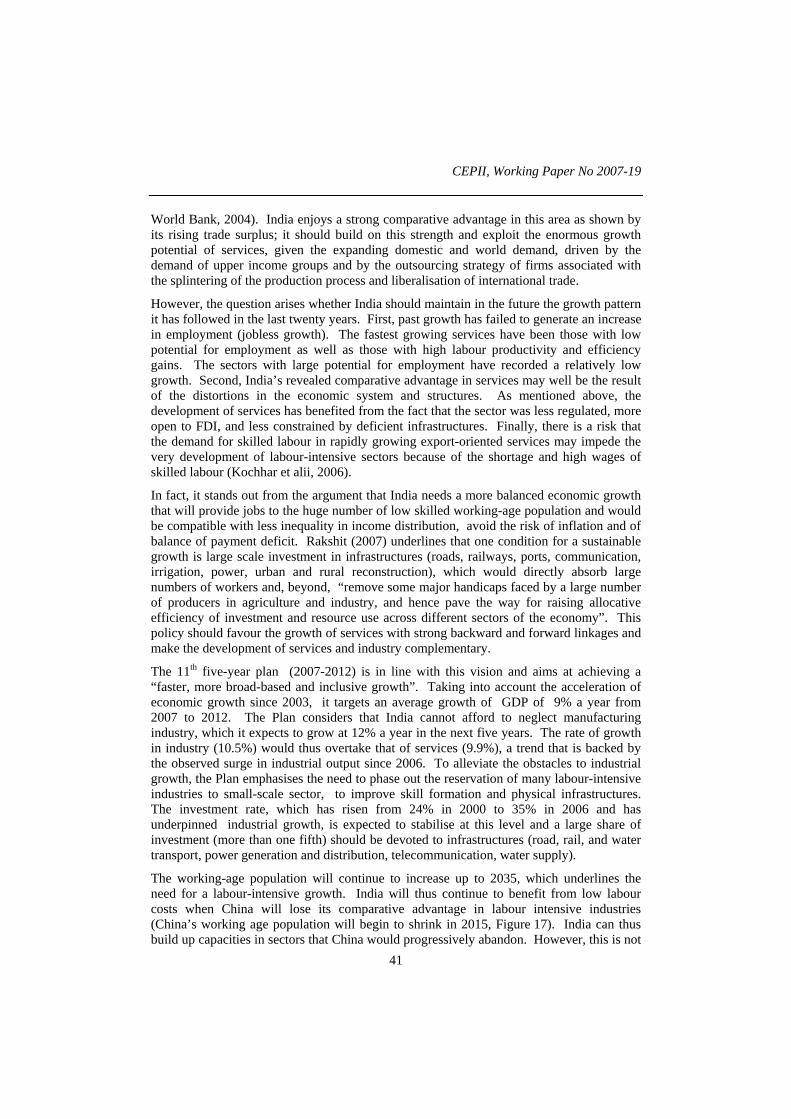
CEPII, Working Paper No 2007-19
41
World Bank, 2004). India enjoys a strong comparative advantage in this area as shown by its rising trade surplus; it should build on this strength and exploit the enormous growth potential of services, given the expanding domestic and world demand, driven by the demand of upper income groups and by the outsourcing strategy of firms associated with the splintering of the production process and liberalisation of international trade.
However, the question arises whether India should maintain in the future the growth pattern it has followed in the last twenty years. First, past growth has failed to generate an increase in employment (jobless growth). The fastest growing services have been those with low potential for employment as well as those with high labour productivity and efficiency gains. The sectors with large potential for employment have recorded a relatively low growth. Second, India’s revealed comparative advantage in services may well be the result of the distortions in the economic system and structures. As mentioned above, the development of services has benefited from the fact that the sector was less regulated, more open to FDI, and less constrained by deficient infrastructures. Finally, there is a risk that the demand for skilled labour in rapidly growing export-oriented services may impede the very development of labour-intensive sectors because of the shortage and high wages of skilled labour (Kochhar et alii, 2006).
In fact, it stands out from the argument that India needs a more balanced economic growth that will provide jobs to the huge number of low skilled working-age population and would be compatible with less inequality in income distribution, avoid the risk of inflation and of balance of payment deficit. Rakshit (2007) underlines that one condition for a sustainable growth is large scale investment in infrastructures (roads, railways, ports, communication, irrigation, power, urban and rural reconstruction), which would directly absorb large numbers of workers and, beyond, “remove some major handicaps faced by a large number of producers in agriculture and industry, and hence pave the way for raising allocative efficiency of investment and resource use across different sectors of the economy”. This policy should favour the growth of services with strong backward and forward linkages and make the development of services and industry complementary.
The 11th five-year plan (2007-2012) is in line with this vision and aims at achieving a “faster, more broad-based and inclusive growth”. Taking into account the acceleration of economic growth since 2003, it targets an average growth of GDP of 9% a year from 2007 to 2012. The Plan considers that India cannot afford to neglect manufacturing industry, which it expects to grow at 12% a year in the next five years. The rate of growth in industry (10.5%) would thus overtake that of services (9.9%), a trend that is backed by the observed surge in industrial output since 2006. To alleviate the obstacles to industrial growth, the Plan emphasises the need to phase out the reservation of many labour-intensive industries to small-scale sector, to improve skill formation and physical infrastructures. The investment rate, which has risen from 24% in 2000 to 35% in 2006 and has underpinned industrial growth, is expected to stabilise at this level and a large share of investment (more than one fifth) should be devoted to infrastructures (road, rail, and water transport, power generation and distribution, telecommunication, water supply).
The working-age population will continue to increase up to 2035, which underlines the need for a labour-intensive growth. India will thus continue to benefit from low labour costs when China will lose its comparative advantage in labour intensive industries (China’s working age population will begin to shrink in 2015, Figure 17). India can thus build up capacities in sectors that China would progressively abandon. However, this is not
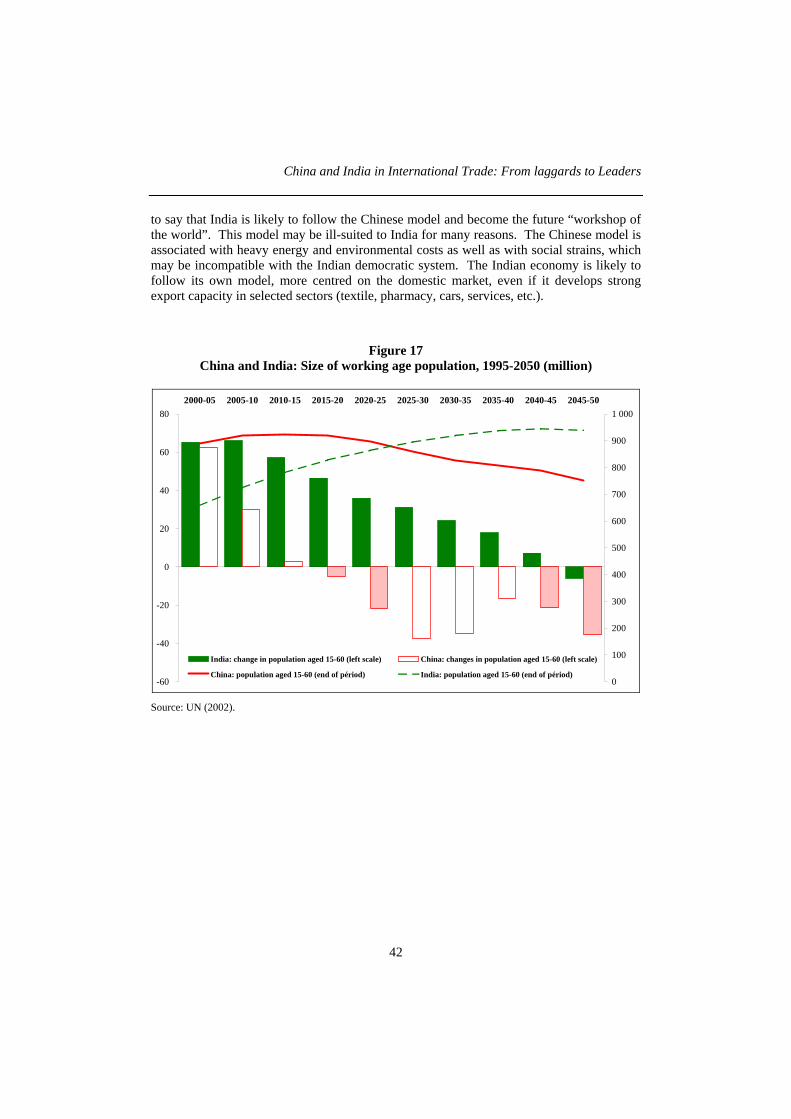
China and India in International Trade: From laggards to Leaders
42
to say that India is likely to follow the Chinese model and become the future “workshop of the world”. This model may be ill-suited to India for many reasons. The Chinese model is associated with heavy energy and environmental costs as well as with social strains, which may be incompatible with the Indian democratic system. The Indian economy is likely to follow its own model, more centred on the domestic market, even if it develops strong export capacity in selected sectors (textile, pharmacy, cars, services, etc.).
Figure 17 China and India: Size of working age population, 1995-2050 (million)
-60
-40
-20
0
20
40
60
802000-05 2005-10 2010-15 2015-20 2020-25 2025-30 2030-35 2035-40 2040-45 2045-50
0
100
200
300
400
500
600
700
800
900
1 000
India: change in population aged 15-60 (left scale) China: changes in population aged 15-60 (left scale)
China: population aged 15-60 (end of périod) India: population aged 15-60 (end of périod)
Source: UN (2002).
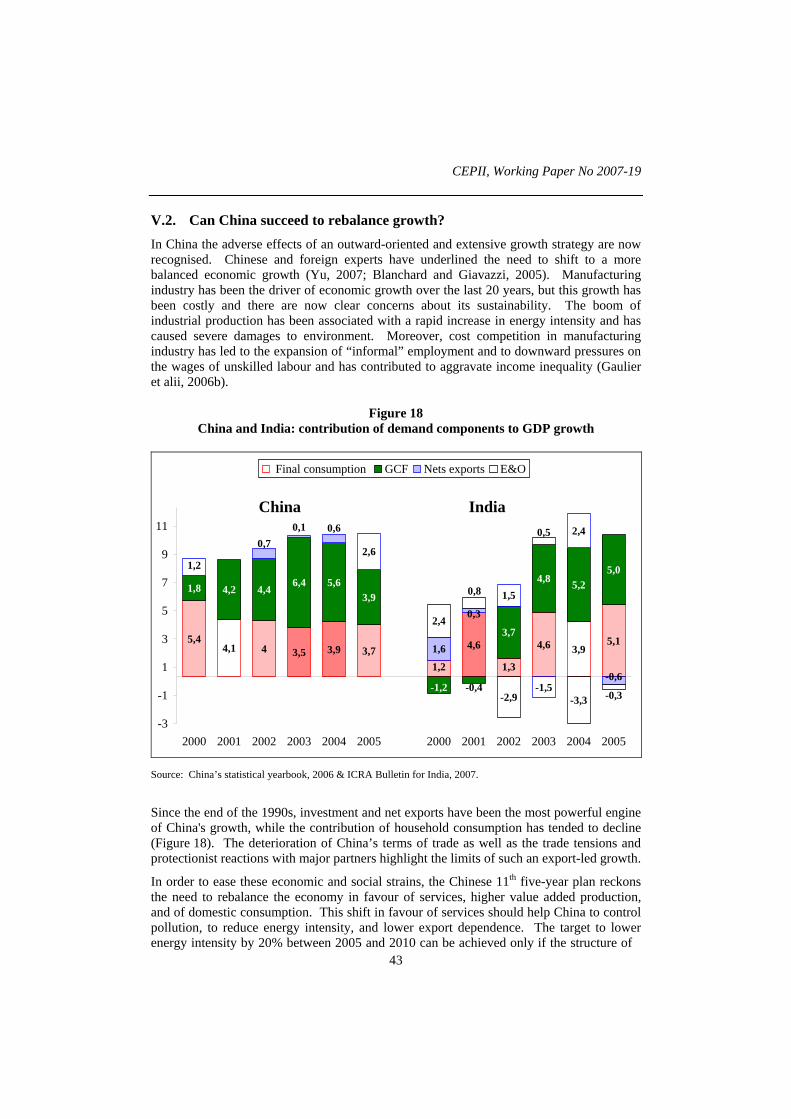
CEPII, Working Paper No 2007-19
43
V.2. Can China succeed to rebalance growth? In China the adverse effects of an outward-oriented and extensive growth strategy are now recognised. Chinese and foreign experts have underlined the need to shift to a more balanced economic growth (Yu, 2007; Blanchard and Giavazzi, 2005). Manufacturing industry has been the driver of economic growth over the last 20 years, but this growth has been costly and there are now clear concerns about its sustainability. The boom of industrial production has been associated with a rapid increase in energy intensity and has caused severe damages to environment. Moreover, cost competition in manufacturing industry has led to the expansion of “informal” employment and to downward pressures on the wages of unskilled labour and has contributed to aggravate income inequality (Gaulier et alii, 2006b).
Figure 18 China and India: contribution of demand components to GDP growth
5,44,1 4 3,5 3,9 3,7
1,2
4,6
1,3
4,6 3,95,1
1,8 4,2 4,46,4 5,6
3,9
-1,2
3,7
4,8 5,25,01,2
0,1
2,6
1,6
1,5
-1,5
2,4
2,4
-2,9 -3,3 -0,3-0,4
-0,6
0,3
0,60,7
0,5
0,8
-3
-1
1
3
5
7
9
11
2000 2001 2002 2003 2004 2005 2000 2001 2002 2003 2004 2005
Final consumption GCF Nets exports E&O
China India
Source: China’s statistical yearbook, 2006 & ICRA Bulletin for India, 2007.
Since the end of the 1990s, investment and net exports have been the most powerful engine of China's growth, while the contribution of household consumption has tended to decline (Figure 18). The deterioration of China’s terms of trade as well as the trade tensions and protectionist reactions with major partners highlight the limits of such an export-led growth.
In order to ease these economic and social strains, the Chinese 11th five-year plan reckons the need to rebalance the economy in favour of services, higher value added production, and of domestic consumption. This shift in favour of services should help China to control pollution, to reduce energy intensity, and lower export dependence. The target to lower energy intensity by 20% between 2005 and 2010 can be achieved only if the structure of
China and India in International Trade: From laggards to Leaders
44
production is shifted in favour of services, as savings from technological changes are rather limited.
Since 2003, the measures taken to raise wages, to reduce the tax burden on peasants, to extend the social security system, are meant to increase consumption and reduce social tensions. The decision taken in 2007 to phase out preferential tax treatment to foreign invested firms also indicates that attracting FDI at any cost is no longer on the agenda. Economic trends in 2006 and early 2007 show that a shift away from labour-intensive industry and a turn to services sector and more value-added sectors is still to come and that the rebalancing will take time and can only be a long-term target. Demographic trend will play in favour of a slower growth and an increase in real wage after 2015.
V.3. Will the giants drive world demand? China and India are leading economic growth, with real GDP expanding at an above average pace. However their share in the world economy (current exchange rates) is still much smaller that their share in world population. Recent analyses tend to show that they have not emerged as an alternative to the US as an engine of economic growth (IMF, 2007a; World Bank, 2006b). Despite China’s rise, a decoupling of Asian economy from the rest of the world is still to come.
China's involvement in the international division of labour in Asia has led to productivity gains which have played a decisive role in the region growth performance since 2000. However China’s domestic demand has not (yet) served as an autonomous engine for regional trade. The final demand which eventually drives intra-Asian trade is still located outside the region as shown by the increasing Asian trade surplus in final goods (Figure 19). Asian industries still depends on final demand in the rest of the world.
Figure 19 Asia’s trade balance by production stage
(billion US$)
Primary
Semi-Finished
P&C
Capital
ConsumptionTotal
-200
-100
0
100
200
300
400
93 94 95 96 97 98 99 00 01 02 03 04
Source: CEPII, BACI database, September 2006.

CEPII, Working Paper No 2007-19
45
The missing link of Asian growth
Following the macro-economic policies instituted during the Asian financial crisis in 1997-1998 to put a brake on domestic demand and re-establish the balance of external payments, most countries in the region have resumed an economic growth driven by exports rather than by domestic consumption (ADB, 2005; IMF, 2006). In this respect, China represents a quite extreme case.
The results of the International Comparison Program in Asia and the Pacific which were recently published confirm these observations (ADB, 2007). They present a measure of real GDP expenditures, based on PPPs, for Asian economies, which show that the share of final consumption of households is relatively low in most East-Asian economies and that in China the bias against household consumption is especially marked. Household consumption represents only 23% of China’s GDP in 2005 and 36% of India’s GDP (Figure 20). The gap between India and China in terms of household consumption is thus much smaller than the gap for GDP per capita: while the per capita income (at PPP) is almost twice higher in China than in India, household consumption per capita is only 23% higher in China.
Figure 20 Final consumption (PPP) of households in Asian economies
2005 (in % of the country GDP)
46 44 43 42 40 39 36 35 35 33 32 29 26 23 2014
Paki
stan
Cam
bodi
a
Ban
glad
esh
Sri L
anka
Phili
ppin
es
Indo
nesi
a
Indi
a
Thai
land
Taiw
an
Vie
t Nam
All
Asi
an c
ount
ries
Hon
g K
ong
Mal
aysi
a
Chi
na
Sing
apor
e
Bru
nei D
arus
sala
m
Source: ADB, 2007.
China and India in International Trade: From laggards to Leaders
46
Prospects
According to long-term scenarios, in China and India the average income per capita will remain far below that of “rich” countries in 2030 and even 2050 (Poncet, 2006). However, the “middle class” which in fact corresponds to high income households is expected to become larger and consumption would thus become an engine of domestic demand. It is worth stressing that the “middle class” in both countries has a level of income which is relatively high in purchasing power parity but still modest at the present exchange rate. Even if their currencies appreciate, the consumer demand will remain dominated by relatively low-price consumer goods, coming from local producers and/or low-cost suppliers. This will enhance trade potential between these demographic giants and attract direct investment by rich country firms in order to serve their rapidly expanding domestic markets.
CONCLUSION
Among large emerging economies, China and India are the largest in terms of population, the poorest and the fastest growing ones. Given these characteristics, their emergence will have an impact on the world economy which will differ and undoubtedly overshadow that of Japan and of the "New industrialised economies" (HongKong, Singapore, Taiwan and South-Korea) in the second half of the last century.
India and China have different economic sizes and levels of income and contrasted international specialisation. During the last two decades, both have successfully integrated the world economy. They have changed the balance of international supply and demand in primary products, manufactured goods and services. Their rise in world trade has been driven by the acceleration of outsourcing and offshoring since the 1990s, and raises similar concerns in industrialised countries which fear loosing their jobs to these low wage competitors. Both countries face increasing trade deficits in thoses services linked to merchandise trade, i.e. transport and insurance, royalties. China has built up a strong position in international trade of high-tech manufactured products, but at the cost of an increasing disadvantage in high-price/quality products and deteriorating terms of trade. By contrast, India has followed a strategy aimed at supplying higher price/quality goods and “customized” products and services.
Over the last decades, the development of their new specialisation has enhanced their positions in international trade negotiations; this has not solved the problem of their overall oversupply of labour but has accentuated the shortage of highly-skilled personnel. They now face the major challenges posed by rising inequality, large unemployment and underemployment. The shift to a job-intensive, “inclusive” economic growth is on the agenda of the two emerging giants.
CEPII, Working Paper No 2007-19
47
REFERENCES
ADB (2007), Purchasing Power Parity: Preliminary Report, 2005 International Comparison Program in Asia and the Pacific, Economics and Research Department, July.
ADB (2005), Asian Development Outlook 2005.
Aykut D. & A. Goldstein (2006), “Developing country Multinationals: South-South Investment Comes of Age”, OECD Development Centre Working Paper, N°257, DEV/DOC(2006)11, December.
Aziz J., S. Dunaway & E. Prasad (Editors) (2006), China and India. Learning From Each Other. Reforms and Policies for Sustained Growth, IMF.
Bhagwati J. A.Panagariya and T.N. Srinivasan (2004), “The Muddles Over Outsourcing”, Journal of Economic Perspectives, November.
Banga R. (2005), “Critical issues in India’s service-led growth”, ICRIER Working Paper, N°171, October.
Bardhan A. D. & C. Kroll (2003), “The New Wave of Outsourcing”, Fisher Center for Real Estate & Urban Economics Paper, N°1103, University of California, Berkeley.
Blanchard O.and F. Giavazzi (2005), “Rebalancing Growth in China: a three-handed approach”, Massachusetts Institute of Technology, Working Paper 05-32, November
Bensidoun I. & Ünal-Kesenci D. (2007), “Mondialisation des services: de la mesure à l’analyse”, Document de Travail du CEPII, N°2007–14, Aout.
Bergstein C. F. (2005), The United States and the World Economy: Foreign Economic Policy for the Next Decade, IIE, Washington DC.
Boillot J. J. (2006), L’économie de l’Inde, Editions La Découverte, Collection Repères-Economie.
Boumellassa H. & D. Ünal-Kesenci (2007), “Base de données CHELEM-BAL du CEPII”, Document de travail du CEPII, N°2006-08, http://www.cepii.fr/francgraph/doctravail/resumes/2006/dt06-08.htm .
Bosworth B. & S. Collins (2007), Accounting for Growth: Comparing China and India, Draft, January 17th.
Bound K. (2007), “India: The uneven innovator”, Demos, (www.demos.co.uk.) .
China and India in International Trade: From laggards to Leaders
48
Broadman H. G. (2006), Africa’s Silk Road. China and India’s New Economic Frontier, The World Bank, Washington DC.
Cerra V., S. A. Riveera & S. C. Saxena (2005), “Crouching Tiger, Hidden Dragon: What are the Consequences of China’s WTO Entry for India’s Trade?”, IMF Working Papers, WP/05/101.
Chanda R. (2002), Globalization of Services: India’s Opportunities and Constraints, Oxford University Press, USA.“
Chauvin S. & F. Lemoine (2005), “L’économie indienne : changements structurels et perspectives à long-terme”, Document de travail du CEPII, n°2005-04, avril.
Das D. K. (2006), “China and India: An Era of Escalating Economic Interaction”, China & World Economy, Vol.14, Issue 4, August.
Denis C., K. Mc Morrow & W. Röger (2006), “Globalisation: Trends, Issues and Macro Implications for the EU”, European Economy, Economic Papers, N°254, July, European Commission, Brussels.
Dimaranan B., E.Ianchovichina & W.Marin (2007), “China, India, and the Future of the World Economy: Fierce Competition or Shared Growth?”, The World Bank Policy Research Paper, N°4304, August.
Economist (The) (2007), “Out of the dusty labs”, March 3th.
Eichengreen B. (2006), “China, Asia, and the World Economy: The Implications of an Emerging Asian Core and Periphery”, China & World Economy, Vol.14, N°3.
Etienne G. (2007), Chine-Inde, la grande compétition, Paris, Dunod.
Freeman R. (2005), “The Doubling of the Global Workforce”, The Globalist, 3th June.
Fan P. (2006), “Promoting Indigenous Capability: The Chinese Government and the Catching-Up of Domestic Telecom-equipment Firms”, The China Review, Vol.6, N°1, Spring.
Fontagné L., G. Gaulier & S. Zignago (2007), “Specialisation across varieties within products and North-South competition”, CEPII Working Paper, n°2007-06, May, http://www.cepii.fr/anglaisgraph/workpap/summaries/2007/wp07-06.htm .
Gaulier G., F. Lemoine & D. Ünal-Kesenci (2005), “China’s Integration in East Asia: Production Sharing, FDI & High-Tech Trade”, CEPII Working Paper, No: 2005-09, June, http://www.cepii.fr/anglaisgraph/workpap/summaries/2005/wp05-09.htm .

CEPII, Working Paper No 2007-19
49
Gaulier G. , F. Lemoine & D. Ünal-Kesenci (2006a), “China’s Emergence and the Reorganisation of Trade Flows in Asia”, CEPII Working Paper, No: 2006-05, March, http://www.cepii.fr/anglaisgraph/workpap/summaries/2006/wp06-05.htm .
Gaulier G., F. Lemoine & D. Ünal-Kesenci (2006b), “The price of competitiveness”, La Lettre du CEPII, N°254, March. www.cepii.fr.
Gill I. & H. Kharas (2006), An East Asian Renaissance: Ideas for Economic Growth, The World Bank, Washington DC.
Goldstein A. (2007), Multinational Companies from Emerging Economies, Palgrave Mac Millan.
Héricourt J. & S. Poncet. (2007), “FDI and Credit Constraints: Firm Level Evidence in China”, CEPII Working Paper, N° 2007-11, May.
Hiratsuka D. (Editor) (2006), East Asia De Facto Economic Integration, IDE-Jetro, Palgrave Macmillan.
Huang Y. & T. Khanna (2003), “Can India Overtake China?”, Foreign Policy, July/August.
Huchet J.F. & J. Ruet (2006), Globalisation and Opening Markets in Developing Countries and Impact on National Firms and Public Governance: the Case of India, Report for EU-India Small Projects Facility Programme, Delhi, July. Mimeo.
ICRA Bulletin (2007), Volume 3, Number 2, September
ILO (2006), Yearbook of Labour Statistics.
IMF (2006), “Asia and Pacific Regional Economic Outlook”, World Economic and Financial Surveys, September.
IMF (2007a), “Asia and Pacific Regional Economic Outlook”, World Economic and Financial Surveys, April.
IMF (2007b), India: Staff report for the 2006, Article IV Consultation, November 29th.
IMF (2007c), World Economic Outlook, October
Kehal H.S. (Editor) (2005), Foreign Investment in rapidly growing Countries. The Chinese and Indian Experiences, Palgrave Macmillan.
Kochhar K. & U. Kumar, R. Rajan, A. Subramanian & I. Tokatlidis (2006), “India’s Pattern of Development: What Happened, What Follows?”, IMF Working Paper, WP/06/22.
China and India in International Trade: From laggards to Leaders
50
Leadbeater C .& J. Wilsdon (2007), “The Atlas of Ideas: how Asian innovation can benefit us all”, Demos, (www.demos.co.uk) .
Lemoine F. (2006), “Labour shortage in China is not imminent”, La Lettre du CEPII, N°259, Septembre.
Lemoine F & D. Ünal-Kesenci (2003), “Trade and Technology Transfers: a Comparative Study of Turkey, India and China”, CEPII Working Paper, No 2003-16. www.cepii.fr.
Lemoine F & D. Ünal-Kesenci (2004), “Assembly Trade and Technology Transfer: the Case of China”, World Development, Vol. 32, No 5.
Li H., P. Huang & J. Li (2007), “China’s FDI Net Inflow and Deterioration of Terms of Trade: Paradox and Explanation”. China & World Economy, Vol.15, N°1.
Li Y. (2006), “Trade Balance: Numbers Can be Deceiving”, China & World Economy, Vol.14, N°3.
Maddison A. (2001), The World Economy. A Millennium Perspective, OECD, Paris.
Maria A., J. Ruet & M.-H. Zérah (2003), Biotechnology in India, Report commissioned by the French Embassy in India, 247p, CERNA-Paris & CSH-New Delhi, June.
McKinsey (2005), Addressing China’s Looming Talent Shortage, October.
Nikomborirak D. (2006), “A Comparative Study of the Role of the Service Sector in the Economic Development of China and India.”, Background paper for Dancing with Giants: China, India, and the Global Economy. Institute for Policy Studies and the World Bank, Washington, DC.
Noble G. W. (2006), “The Emergence of the Chinese and Indian Automobile Industries and Implications for Other Developing Countries.” Background paper for Dancing with Giants: China, India, and the Global Economy. Institute for Policy Studies and the World Bank, Washington, DC.
O’Neill J., S. B. Kim & M. Buchanan (2006), “Globalization and Disinflation: Can Anyone Else Do a China?”, Goldman Sachs Economic Research, Global Economic Paper, n° 147, October.
O’Neil J. (2006), “China vs India?”, Goldman Sachs, Global Economics Weekly, February 1.
OECD (2007a), Economic Review India.
CEPII, Working Paper No 2007-19
51
OECD (2007b), Reviews of Innovation Policy: China. Synthesis Report, August.
OECD (2006a), OECD Information Technology Outlook.
OECD (2006b), Science, Technology and Industry Outlook.
OECD (2005), OECD Economic Surveys. China.
OECD (2004), OECD Information Technology Outlook.
Phelps E. S. (2004), “Effects of China’s recent development in the rest of the world with special attention to Latin America”, Journal of Policy Modelling, Vol.26.
Poncet S. (2006), “The Long Term Growth Prospects of the World Economy: Horizon 2050”, CEPII Working Paper, N° 2006-16, October.
Purfield C. & Schiff J. (2006), India Goes Global. Its Expanding Role in the Global Economy, IMF, Washington DC.
Rangarajan C., P.I. Kaul and Seema (2007),”Revisiting Employment and Growth” in ICRA Bulletin, Money and Finance, Volume 3, number 2, September.
Rakshit M. (2007), “Service-led Growth. The Indian Experience”, Money & Finance, ICRA Bulletin, Vol.3, N°1, February, New Delhi.
Sachwald F. (2006), “China, High or Low Tech Power? The contrasted Picture of China’s Scientific and Technological capabilities”, Paper presented in Tokyo Club Macro Conference, Tokyo, 6-7 December.
Ren R. & H. Zheng (2006), “Chinese Manufacturing Performance from Multilateral Perspective: 1980-2004”, Hitotsubashi University Research Unit for Statistical Analysis in Social Sciences, Discussion Paper Series, N°170, June.
Samuelson P. A. (2004), “Where Ricardo and Mill Rebut and Confirm Argument of Mainstream Economist Supporting Globalization”, Journal of Economic Perspectives, Vol.18, N°3, summer.
Sigurdson J. (2005), Technological Superpower China, Edward Elgar.
Singh A. (2005), “Comparison between China and India”, China and World Economy, Vol.13, N°3, May-June.
Sivasubramanian S. (2004), The Sources of Economic Growth in India, 1950–1 to 1999–2000, New Delhi: Oxford University Press.
China and India in International Trade: From laggards to Leaders
52
Srinivasan T. N. & S. Tendulkar (20003), Reintegrating India with the World Economy, June, Washington: IIE.
Srinivasan T. N. (2006), “China, India and the World Economy”, Standford Center for International Development Working Paper, N°286, July.
Sun Y. & D. Du & L. Huang (2006), “Foreign R&D in Developing Countries: Empirical Evidence from Shanghai, China”, The China Review, Vol.6, N°1, Spring.
UN (2002), World Population Prospects: The 2002 Revision and World Urbanization Prospects, United Nations Population Division.
UNCTAD (2006), World Investment Report 2006. FDI from Developing and Transition Economies: Implications for Development.
Van Welsum D. & X. Reif (2006), “Potential impacts of international sourcing on different occupations”, OECD, Working Party on the Information Economy, DSTI/ICCP/IE/(2006)1/FINAL, Unclassified, October.
Van Welsum D. & T. Xu (2007), “Is China the New Centre for Offshoring of IT and ICT-Enabled Services?, OECD, Working Party of the Trade Committee, DSTI/ICCP/IE(2006)10/FINAL, March.
Wilson D. & R. Purushothaman (2003), “Dreaming with BRICs: The Path to 2050”, Global Economic Paper, Goldman Sachs, n°99, October.
Winters L.A. & S.D. Yusuf (Editors) (2006), Dancing with Giants: China, India and the Global Economy, The World Bank and the Institute of Policy Studies.
World Bank (2004), Sustaining India’s Services Revolution: Access to Foreign Markets, Domestic Reforms and International Negotiations.
World Bank (2007), Global Economic Prospects 2007: Managing the Next Wave of Globalization.
World Bank (2006b), An East Asian Renaissance. Ideas for Economic Growth.
Yu Y. (2007), “Global Imbalances and China”, The Australian Economic Review, vol.40, n° 1, pp 3-23.
MINEFI (2006), Profils Institutionnels-database, http://www.cepii.fr/ProfilsInstitutionnelsDatabase.htm .
CEPII, Working Paper No 2007-19
53
APPENDIX - THE DEFINITION OF HIGH-TECH PRODUCTS
The definition of high-technology products is based on indicators of technological intensity in OECD countries, such as R&D expenditures divided by value added, R&D expenditures divided by production.
On the basis of this definition two types of classification can be made of high-technology products:
− at a broad category level: the indicators of high-tech content are calculated at the branch level and all the products within an high-tech branch are considered as selected “high-tech” products;
− at a detailed product level within a broad category.
The first methodology is the most widely used. For instance, the latest OECD classification based on technology indicators groups manufacturing branches (ISIC rev.3, at 2 or 3 digit level) into 4 technological levels: high-technology, medium-high-technology; medium-low-technology; and low technology. In this classification high-technology industries includes all products belonging to the following branches:
− aircraft and spacecraft (ISIC 353);
− pharmaceuticals (ISIC 2423);
− office, accounting, and computing machinery (ISIC 30);
− radio, TV and communication equipment (ISIC 32);
− medical, precision and optical instrument (ISIC 33).
In the same way, according to World Development Indicators of United Nations (WDI database), high-technology exports include all the exports of the following branches: aerospace, computers, pharmaceuticals, scientific instruments, and electrical machinery.
It has to be noted that this methodology introduces a serious selection bias, since not all product in a “high-technology industry” necessarily have a high technology content. Likewise, some products in industries with low technology intensity may well incorporate a high degree of technological sophistication.
The second methodology first defines large high-tech sectors (as described above) and then selects, within this high-tech branches and a detailed level of the products having a high content in R&D. The definition of high-tech products used in CEPII studies refers to this second way13. The nine high-tech industries that were selected in the first step were the following:
− aerospace;
− computers, office machinery;
13 Voir Lionel Fontagné, Michaël Freudenberg, Deniz Ünal-Kesenci, “Haute technologie et échelles de qualité : de fortes asymétries en Europe” CEPII Working Paper N° 1999-08, juin 1999 Lionel Fontagné Michaël Freudenberg Deniz Ünal-Kesenci.
China and India in International Trade: From laggards to Leaders
54
− electronics-communications;
− pharmaceuticals;
− scientific instruments;
− electrical machinery;
− chemicals;
− other transport equipment;
− non-electrical machinery;
− weapons.
In the second step, within these broad categories, a list of 252 products (at the 6 digits level of the Harmonised System) were identified as high-tech. It has to be noted that this methodology introduces another selection bias, since it examines whether products are of a high-technology nature or not, only in branches that are considered high-technology: the high-technology products belonging to non technological branches are thus implicitly considered as non-technological.

CEPII, Working Paper No 2007-19
55
LIST OF WORKING PAPERS RELEASED BY CEPII14
No Title Authors
2007-18 How Remote is the Offshoring Threat K. Head, T. Mayer & J. Ries
2007-17 Costs and Benefits of Euro Membership: a Counterfactual Analysis
E. Dubois, J. Héricourt
& V. Mignon
2007-16 Location Decisions and Minimum Wages I. Méjean & L. Patureau
2007-15 MIRAGE, Updated Version of the Model for Trade Policy Analysis Focus on Agriculture and Dynamics
Y. Decreux & H. Valin
2007-14 Mondialisation des services de la mesure à l'analyse I. Bendisoun & D. Ünal-Kesenci
2007-13 How are wages set in Beijing? J. De Sousa & S. Poncet
2007-12 IMF Quotas at Year 2030 A. Bénassy-Quéré, S. Béreau,
Y. Decreux, C. Gouel & S. Poncet
2007-11 FDI and Credit Constraints: Firm Level Evidence in China
J. Héricourt & S. Poncet
2007-10 Fiscal Policy in Real Time J. Cimadomo
2007-09 Global Ageing and Macroeconomic Consequences of Demographic Uncertainty in a Multi-regional Model
J. Alho & V. Borgy
2007-08 The Effect of Domestic Regulation on Services Trade Revisited
S. Schwellnus
2007-07 The Location of domestic and foreign production affiliates by French multinational firms
T. Mayer, I. Méjean & B. Nefussi
14 Working papers are circulated free of charge as far as stocks are available; thank you to send your request to CEPII, Sylvie Hurion, 9, rue Georges-Pitard, 75015 Paris, or by fax : (33) 01 53 68 55 04 or by e-mail sylvie.hurion @ cepii.fr .Also available on: \\www.cepii.fr. Working papers with * are out of print. They can nevertheless be consulted and downloaded from this website.
China and India in International Trade: From laggards to Leaders
56
2007-06 Specialisation across Varieties within Products and North-South Competition
L. Fontagné, G. Gaulier
& S. Zignago
2007-05 Trade Costs and the Home Market Effect M. Crozet & F. Trionfetti
2007-04 The Impact of Regulations on Agricultural Trade: Evidence from SPS and TBT Agreements
A.-C. Disdier, L. Fontagné
& M. Mimouni
2007-03 International Comparisons of Living Standards by Equivalent Incomes
M. Fleurbaey & G. Gaulier
2007-02 Does Risk Aversion Drive Financial Crises? Testing the Predictive Power of Empirical Indicators
V. Coudert & M. Gex
2007-01 Asian Catch Up, World Growth and International Capital Flows in the XXIst Century : A Prospective Analysis with the INGENUE 2 Model
M. Aglietta, V. Borgy, J. Château, M. Juillard,
J. Le Cacheux, G. Le Garrec &
V. Touzé
2006-27 Current Account Reversals and Long Term Imbalances: Application to the Central and Eastern European Countries
K. Benhima & O. Havrylchyk
2006-26 On Legal Origins and Brankruptcy Laws: the European Experience (1808-1914)
J. Sgard
2006-25 Taux d'intérêt et marchés boursiers : une analyse empirique de l'intégration financière internationale
V. Borgy & V. Mignon
2006-24 Changing Patterns of Domestic and Cross-Border Fiscal Policy Multipliers in Europe and the US
A. Bénassy-Quéré & J. Cimadomo
2006-23 Market Access Impact on Individual Wage: Evidence from China
L. Hering & S. Poncet
2006-22 FDI in Chinese Cities: Spillovers and Impact on Growth
N. Madariaga & S. Poncet
2006-21 Are Financial Distortions an Impediment to Economic Growth? Evidence from China
A. Guariglia & S. Poncet
2006-20 World Consistent Equilibrium Exchange Rates A. Bénassy-Quéré, A. Lahrèche-Révil
& V. Mignon
2006-19 Institutions and Bilateral Asset Holdings V. Salins & A. Bénassy-Quéré
CEPII, Working Paper No 2007-19
57
2006-18 Vertical Production Networks: Evidence from France M. Fouquin, L. Nayman
& L. Wagner
2006-17 Import Prices, Variety and the Extensive Margin of Trade
G. Gaulier & I. Méjean
2006-16 The Long Term Growth Prospects of the World Economy: Horizon 2050
S. Poncet
2006-15 Economic Integration in Asia: Bilateral Free Trade Agreements Versus Asian Single Market
M. H. Bchir & M. Fouquin
2006-14 Foreign Direct Investment in China: Reward or Remedy?
O. Havrylchyk & S. Poncet
2006-13 Short-Term Fiscal Spillovers in a Monetary Union A. Bénassy-Quéré
2006-12 Can Firms’ Location Decisions Counteract the Balassa-Samuelson Effect?
I. Méjean
2006-11 Who’s Afraid of Tax Competition? Harmless Tax Competition from the New European Member States
A. Lahrèche-Révil
2006-10 A Quantitative Assessment of the Outcome of the Doha Development Agenda
Y. Decreux & L. Fontagné
2006-09 Disparities in Pension Financing in Europe: Economic and Financial Consequences
J. Château & X. Chojnicki
2006-08 Base de données CHELEM-BAL du CEPII H. Boumellassa & D. Ünal-Kesenci
2006-07 Deindustrialisation and the Fear of Relocations in the Industry
H. Boulhol & L. Fontagné
2006-06 A Dynamic Perspective for the Reform of the Stability and Gowth Pact
C. Deubner
2006-05 China’s Emergence and the Reorganisation of Trade Flows in Asia
G. Gaulier, F. Lemoine & D. Ünal-Kesenci
2006-04 Who Pays China's Bank Restructuring Bill? G. Ma
2006-03 Structural Determinants of the Exchange-Rate Pass-Through
G. Gaulier, A. Lahrèche-Révil
& I. Méjean
2006-02 Exchange-Rate Pass-Through at the Product Level G. Gaulier, A. Lahrèche-Révil
& I. Méjean
2006-01 Je t'aime, moi non plus : Bilateral Opinions and International Trade
A.C. Disdier & T. Mayer
China and India in International Trade: From laggards to Leaders
58
2005-23 World Trade Competitiveness: A Disaggregated View by Shift-Share Analysis
A. Cheptea, G. Gaulier & S. Zignago
2005-22 Chômage et réformes du marché du travail au Japon E. Dourille-Feer
2005-21 Profitability of Foreign and Domestic Banks in Central and Eastern Europe: Does the Mode of Entry Matter?
O. Havrylchyk & E. Jurzyk
2005-20 ECB Governance in an Enlarged Eurozone A. Bénassy-Quéré & E. Turkisch
2005-19 What Are EU Trade Preferences Worth for Sub-Saharan Africa and Other Developing Countries?
F. Candau & S. Jean
2005-18 Binding Overhang and Tariff-Cutting Formulas M.H. Bchir, S. Jean D. Laborde
2005-17 International Trade and Income Distribution: Reconsidering the Evidence
I. Bensidoun, S. Jean & A. Sztulman
2005-16 China and the Relationship between the Oil Price and the Dollar
A. Bénassy-Quéré, V. Mignon & A. Penot
2005-15 Consequences of Alternative Formulas for Agricultural Tariff Cuts
S. Jean, D. Laborde & W. Martin
2005-14 Is Erosion of Tariff Preferences a Serious Concern? A. Bouët, L. Fontagné & S. Jean
2005-13 The Consequences of Agricultural Trade Liberalization for Developing Countries: Distinguishing Between Genuine Benefits and False Hopes
J.C. Bureau, S. Jean A. Matthews
2005-12 From Bound Duties to Actual Protection: Industrial Liberalisation in the Doha Round
M.H. Bchir, L. Fontagné & S. Jean
2005-11 Impact de l'ouverture financière sur les inégalités internes dans les pays émergents
A. Bénassy-Quéré & V. Salins
2005-10 Disentangling Horizontal and Vertical Intra-Industry Trade
L. Fontagné, M. Freudenberg &
G. Gaulier
2005-09 China's Integration in East Asia: Production Sharing, FDI & High-Tech Trade
G. Gaulier, F. Lemoine D. Ünal-Kesenci
2005-08 Tax Competition and Public Input A. Bénassy-Quéré, N. Gobalraja &
A. Trannoy
CEPII, Working Paper No 2007-19
59
2005-07 Trade Liberalisation, Growth and Poverty in Senegal: A Dynamic Microsimulation CGE Model Analysis
N. Annabi, F. Cissé, J. Cockburn &
B. Decaluwé
2005-06 Migration, Trade and Wages A. Hijzen & P. Wright
2005-05 Institutional Determinants of Foreign Investment A. Bénassy-Quéré, M. Coupet & T. Mayer
2005-04 L’économie indienne : changements structurels et perspectives à long terme
S. Chauvin & F. Lemoine
2005-03 Programme de travail du CEPII pour 2005
2005-02 Market Access in Global and Regional Trade T. Mayer & S. Zignago
2005-01 Real Equilibrium Exchange Rate in China V. Coudert & C. Couharde
2004-22 A Consistent, ad-valorem Equivalent Measure of Applied Protection Across the World: The MAcMap-HS6 Database
A. Bouët, Y. Decreux, L. Fontagné, S. Jean
& D. Laborde
2004-21 IMF in Theory: Sovereign Debts, Judicialisation and Multilateralism
J. Sgard
2004-20 The Impact of Multilateral Liberalisation on European Regions: a CGE Assessment
S. Jean & D. Laborde
2004-19 La compétitivité de l'agriculture et des industries agroalimentaires dans le Mercosur et l'Union européenne dans une perspective de libéralisation commerciale
N. Mulder, A. Vialou, B. David,
M. Rodriguez & M. Castilho
2004-18 Multilateral Agricultural Trade Liberalization: The Contrasting Fortunes of Developing Countries in the Doha Round
A. Bouët, J.C. Bureau, Y. Decreux & S. Jean
2004-17 UK in or UK out? A Common Cycle Analysis between the UK and the Euro Zone
J. Garnier
2004-16 Regionalism and the Regionalisation of International Trade
G. Gaulier, S. Jean & D. Ünal-Kesenci
2004-15 The Stock-Flow Approach to the Real Exchange Rate of CEE Transition Economies
B. Egert, A. Lahrèche-Révil & K. Lommatzsch
2004-14 Vieillissement démographique, épargne et retraite : une analyse à l’aide d’un modèle d’équilibre général à agents hétérogènes
C. Bac & J. Chateau
China and India in International Trade: From laggards to Leaders
60
2004-13 Burden Sharing and Exchange-Rate Misalignments within the Group of Twenty
A. Bénassy-Quéré, P. Duran-Vigneron, A. Lahrèche-Révil
& V. Mignon
2004-12 Regulation and Wage Premia S. Jean & G. Nicoletti
2004-11 The Efficiency of Fiscal Policies: a Survey of the Literature
S. Capet
2004-10 La réforme du marché du travail en Allemagne : les enseignements d’une maquette
S. Capet
2004-09 Typologie et équivalence des systèmes de retraites P. Villa
2004-08 South – South Trade: Geography Matters S. Coulibaly & L. Fontagné
2004-07 Current Accounts Dynamics in New EU Members: Sustainability and Policy Issues
P. Zanghieri
2004-06 Incertitude radicale et choix du modèle P. Villa
2004-05 Does Exchange Rate Regime Explain Differences in Economic Results for Asian Countries?
V. Coudert & M. Dubert
2004-04 Trade in the Triad: How Easy is the Access to Large Markets?
L. Fontagné, T. Mayer & S. Zignago
2004-03 Programme de travail du CEPII pour 2004
2004-02 Technology Differences, Institutions and Economic Growth: a Conditional Conditional Convergence
H. Boulhol
2004-01 Croissance et régimes d’investissement P. Villa

61
CEPII WORKING PAPERS
Should you wish to receive copies of the CEPII’s Working papers,
just fill the reply card and return it to:
Sylvie HURION – Publications CEPII – 9, rue Georges-Pitard – 75740 Paris – Fax : (33) 1.53.68.55.04
[email protected] Mr./Mrs ................................................................................................................................... Name-First name ...................................................................................................................... Title .......................................................................................................................................... Department ............................................................................................................................... Organisation ............................................................................................................................. Address..................................................................................................................................... City & post code....................................................................................................................... Country......................................................................... Tél. ..................................................... Your e-mail ..............................................................................................................................
Wish to receive the CEPII’s Working Papers No: ..................................................................
..................................................................................................................................................
..................................................................................................................................................
..................................................................................................................................................
..................................................................................................................................................
..................................................................................................................................................
..................................................................................................................................................
..................................................................................................................................................
..................................................................................................................................................
Wish to be placed on the standing mailing list (for Libraries).