china: a long march to imperial renaissance
TRANSCRIPT

China: a Long March to Imperial Renaissance By Thomas Yitien Hu The World Rediscovers China When Marco Polo traveled to Dadu1 in 1271 via the Silk Road as a member of Pope Gregory X’s delegate to Kublai Khan, the first Mongolian Emperor of the Yuan Dynasty (1271-1368), he did not know that he would spend the next seventeen years in an empire that not only ruled China, Mongolia and Persia, but also commanded an economy with the most advanced technology on earth. Polo’s arrival in the city now known as Beijing coincided with the height of a two hundred year economic boom. The revolution in agricultural technology and the ensuing increase in productivity that had commenced in the 11th century had allowed the Chinese economy to accumulate the capital and factor surplus necessary for two centuries of robust industry and commerce. It is estimated that, by the end of the 11th century, per capita Chinese steel production was five times greater than that of Europe: a gap that would take Europe another six centuries to close. During this era, China also claimed the world’s highest growth rates in the production of textiles, salt and other industrial materials. This high agricultural productivity and advanced industry facilitated empire-wide urbanization and commercial development. A national commercial network of canals, roads and bridges – plus the liquidity provided by paper currency – allowed farmers and merchants to communicate and transact with unprecedented speed, providing the infrastructure necessary to ship a huge variety of products for domestic and foreign consumption. The prosperity of major Chinese cities was astounding not only to Marco Polo, but to people all over the world; when his travel journal, Il Millione, was published in 1299, the book was an instant success throughout Europe. Six and a half centuries later, however, the Chinese landscape would look remarkably different. By 1949, four years after Japan’s defeat in World War II and thirty-eight years after the last imperial Chinese dynasty (Qing Dynasty, 1644-1911) had collapsed under the revolution led by the Kuomintang (or Nationalist Party), Marco Polo’s China had become part of a distant and seemingly irretrievable past. Although the Communist Party had won the civil war against the Kuomintang, and the Chinese people had “stood up,” as Mao Zedong so proudly proclaimed in Beijing, the People’s Republic was actually founded on Pyrrhic victory: twenty years of civil and international war and over eighty years of exploitation by Western Imperialists had incapacitated the Chinese economy. In 1949, per capita GDP was merely 66.1 yuan and heavy industry contributed less than 3% to the total economy. International isolation, policy miscalculations and a series of zealous political movements further aggravated China’s problems. In particular, the Cultural Revolution (1966-1976) threw Chinese economy and society into complete anarchy, resulting in serious damages to the country’s socio-economic foundation. By 1978, 250 million2 farmers were still in absolute poverty. Shortly after Mao Zedong’s death in 1976, however, tides began to turn. With Deng Xiaoping’s return from political exile in 1978, China embarked on the implementation of “Socialism with
1 大都 or Great Capital, is the old name of Beijing; also known as Khanbaliq or “Great Residence of the Khan.” 2 All statistics and figures are from the China National Bureau of Statistics and the People’s Bank of China, unless stated otherwise.
1
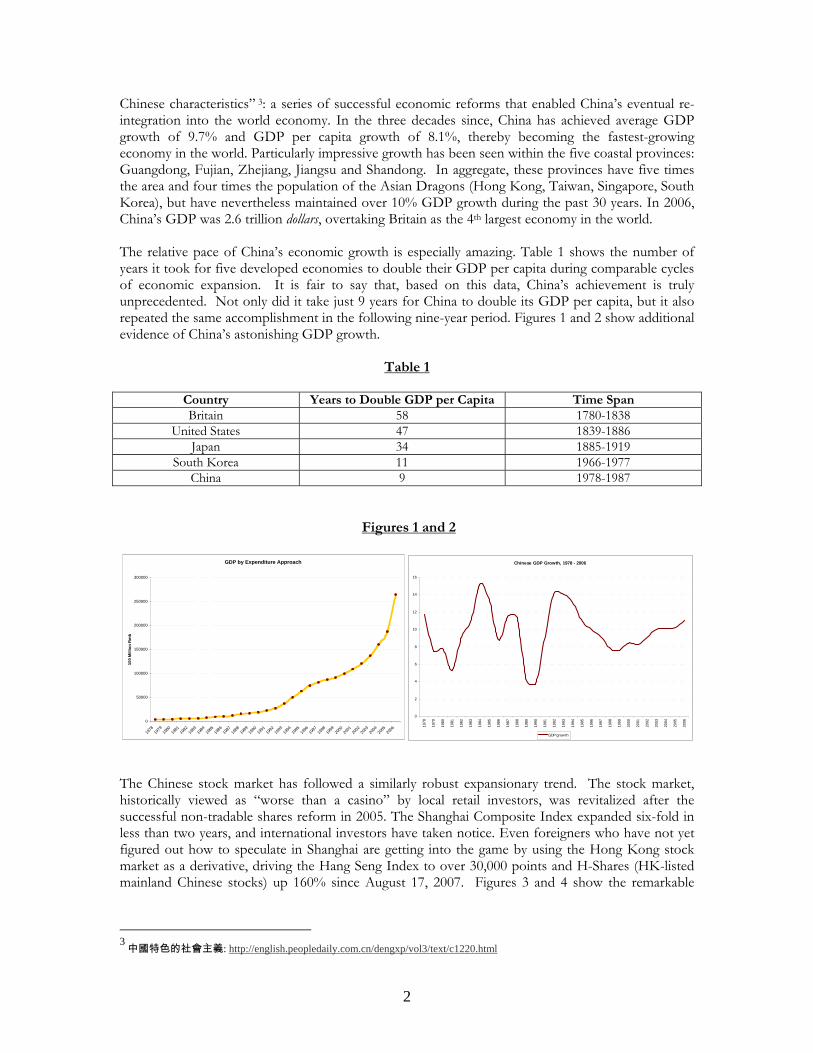
Chinese characteristics” 3: a series of successful economic reforms that enabled China’s eventual re-integration into the world economy. In the three decades since, China has achieved average GDP growth of 9.7% and GDP per capita growth of 8.1%, thereby becoming the fastest-growing economy in the world. Particularly impressive growth has been seen within the five coastal provinces: Guangdong, Fujian, Zhejiang, Jiangsu and Shandong. In aggregate, these provinces have five times the area and four times the population of the Asian Dragons (Hong Kong, Taiwan, Singapore, South Korea), but have nevertheless maintained over 10% GDP growth during the past 30 years. In 2006, China’s GDP was 2.6 trillion dollars, overtaking Britain as the 4th largest economy in the world. The relative pace of China’s economic growth is especially amazing. Table 1 shows the number of years it took for five developed economies to double their GDP per capita during comparable cycles of economic expansion. It is fair to say that, based on this data, China’s achievement is truly unprecedented. Not only did it take just 9 years for China to double its GDP per capita, but it also repeated the same accomplishment in the following nine-year period. Figures 1 and 2 show additional evidence of China’s astonishing GDP growth.
Table 1
Country Years to Double GDP per Capita Time Span Britain 58 1780-1838
United States 47 1839-1886 Japan 34 1885-1919
South Korea 11 1966-1977 China 9 1978-1987
Figures 1 and 2
GDP by Expenditure Approach
0
50000
100000
150000
200000
250000
300000
1978
1979
1980
1981
1982
1983
1984
1985
1986
1987
1988
1989
1990
1991
1992
1993
1994
1995
1996
1997
1998
1999
2000
2001
2002
2003
2004
2005
2006
100
Mill
ion
Rm
b
Chinese GDP Growth, 1978 - 2006
0
2
4
6
8
10
12
14
16
1978
1979
1980
1981
1982
1983
1984
1985
1986
1987
1988
1989
1990
1991
1992
1993
1994
1995
1996
1997
1998
1999
2000
2001
2002
2003
2004
2005
2006
GDP grow th The Chinese stock market has followed a similarly robust expansionary trend. The stock market, historically viewed as “worse than a casino” by local retail investors, was revitalized after the successful non-tradable shares reform in 2005. The Shanghai Composite Index expanded six-fold in less than two years, and international investors have taken notice. Even foreigners who have not yet figured out how to speculate in Shanghai are getting into the game by using the Hong Kong stock market as a derivative, driving the Hang Seng Index to over 30,000 points and H-Shares (HK-listed mainland Chinese stocks) up 160% since August 17, 2007. Figures 3 and 4 show the remarkable
3
中國特色的社會主義: http://english.peopledaily.com.cn/dengxp/vol3/text/c1220.html
2

growth in the Shanghai and Hong Kong exchanges, and Table 2 provides evidence that Chinese companies have firmly entrenched themselves in the mega-market value elite.
Figures 3 and 4
China Shanghai Compo
0
1000
2000
3000
4000
5000
6000
7000
Dec
-04
Jan-
05
Feb-
05
Mar
-05
Apr
-05
May
-05
Jun-
05
Jul-0
5
Aug
-05
Sep
-05
Oct
-05
Nov
-05
Dec
-05
Jan-
06
Feb-
06
Mar
-06
Apr
-06
May
-06
Jun-
06
Jul-0
6
Aug
-06
Sep
-06
Oct
-06
Nov
-06
Dec
-06
Jan-
07
Feb-
07
Mar
-07
Apr
-07
May
-07
Jun-
07
Jul-0
7
Aug
-07
Sep
-07
Inde
x Le
vel
Cumulative Returns: Hang Seng Index vs. Hang Seng China Enterprise Index
0
50
100
150
200
250
300
Jan-
06
Feb-
06
Mar
-06
Apr-
06
May
-06
Jun-
06
Jul-0
6
Aug-
06
Sep-
06
Oct
-06
Nov
-06
Dec
-06
Jan-
07
Feb-
07
Mar
-07
Apr-
07
May
-07
Jun-
07
Jul-0
7
Aug-
07
Sep-
07
Oct
-07
Cum
ulat
ive
Ret
urns
%
Hang Seng Hnag Seng China
Table 2
Top 10 Public Companies by Market Value3 ($ in millions) Company Country Market Value Exxon Mobil United States 511,420 PetroChina (H-Share) China (Hong Kong) 453,173 General Electric United States 410,947 China Mobile China (Hong Kong) 409,370 Industrial & Commercial Bank of China (A-Share) China (Shanghai) 365,099 Microsoft United States 327,705 Industrial & Commercial Bank of China (H-Share) China (Hong Kong) 312,873 China Petroleum & Chemical Corp (Sinopec) China (Shanghai) 288,138 China Life Insurance China (Shanghai) 283,914 AT&T United States 251,745
Source: FactSet With all this talk of economic expansion, predictions of a bubble come as no surprise. Investment gurus of all stripes, however, seem far more concerned with the burst U.S. subprime bubble than the still-growing Chinese economy. As one Chinese official has so eloquently put it: “a market without bubbles is like beer without foam.” In a booming economy, in other words, a few bubbles now and then could be a sign of health. As global value investors, we at Epoch appreciate the awe-inspiring advancement of the Chinese markets; but we don’t necessarily agree with those who dismiss the bubble potential inherent in such rapid growth. The fact remains that Chinese economic expansion, although impressive, has been very volatile since the beginning of the uptrend in 1978. It has gone through four different cycles, with GDP growth ranging between 4% and 14% within this 30-year period. Such volatility tends to inspire uncertainty among international investors, which in turn hurts the sustainability of economic development. It is also important to keep in mind that a booming economy often brings about
3 The difference between the market values of ICBC on the Shanghai and Hong Kong stock exchanges, the so-called “A-H discount,” is another sign of the immaturity of the mainland Chinese capital markets. Historically, major companies (“Blue Chips” and “Red Chips”) floated their shares in Hong Kong for its easy access to international capital. Some companies maintained a dual-listing, or even triple-listing (eg. NYSE), status. After the bull market took off in 2005, many companies saw their A-shares trading at a premium to their H-shares, in some cases by more than 50%. Other than the impact of technical problems related to cross-clearing and custodian bank settlement, it is believed that such “arbitrage” is a result of excess liquidity in China and the lack of full convertibility of the CNY|USD.
3

soaring asset prices. After dropping its historical peg of 8.28 CNY to 1 USD in July 2005, China has seen its currency appreciate 10% against the US dollar. The international finance community, however, continues to believe the CNY is undervalued. While we do not question Beijing’s determination to keep growing the economy and thereby strengthening the current regime’s political legitimacy, we do see worrisome signs that warrant continued caution: income disparity, lack of viable social security, environmental destruction, and excess liquidity in both the real and virtual economy that, if not managed properly, might trigger crises detrimental to social and economic stability. However, it is not for us to prescribe policy measures to help manage a soft landing in China. Rather, our goal in this paper is to propose a framework for identifying actionable themes and investment opportunities in the Greater China region. We refer to this framework as the “Imperial Renaissance”: China’s grand strategy to achieve sustainable growth in the coming decades. Granted, the term “Imperial Renaissance” necessities a measure of additional clarification. It has never been modern China’s official objective to establish an empire per se. But we believe that underlying the country’s superb economic accomplishments is a strong desire to regain (at least nominally) its imperial preeminence in the political, cultural and economic arenas. By flexing its muscles as both a world factory and a world market, mainland China stands a good chance of leveraging its key position in the global value chain to project its soft power around the globe, thereby engineering its peaceful reemergence as one of the world’s superpowers. We believe one of the most important investment themes in the coming decade will be the identification of companies that are positioned to benefit from China’s long march to imperial renaissance. In the remainder of this paper, we will discuss the trends and themes that will guide the pace and direction of China’s continued growth, identify the potential challenges in China’s path, and recommend China-specific investment strategies designed to achieve long-term capital appreciation. Greater China: From World Factory to World Market
Figure 5
Greater China, as highlighted in Figure 5 above, is a collective concept that designates a multi-national territory of increasing economic integration and cultural interaction. This territory generally includes Mainland China, Taiwan, Hong Kong, Macau and occasionally Singapore, Vietnam, Korea and Japan. Historically, economic and cultural connections have incorporated these countries into an “informal empire,” with China exerting the lion’s share of political influence. This informal empire
4
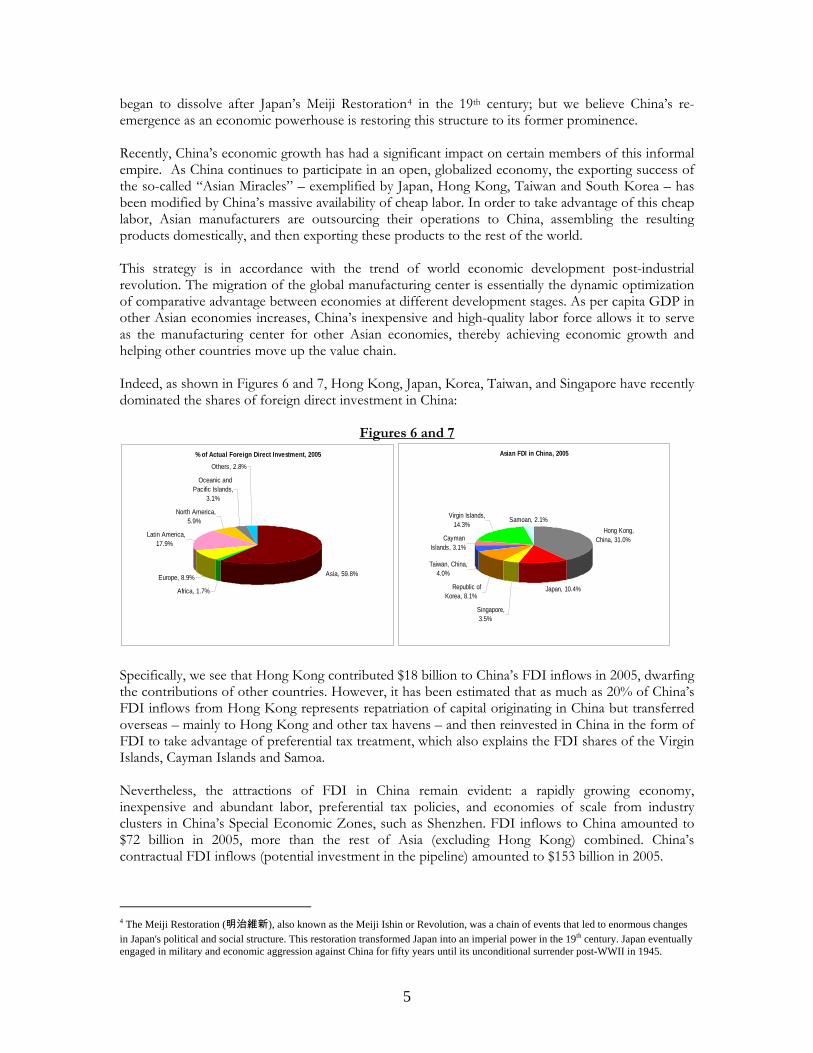
began to dissolve after Japan’s Meiji Restoration4 in the 19th century; but we believe China’s re-emergence as an economic powerhouse is restoring this structure to its former prominence. Recently, China’s economic growth has had a significant impact on certain members of this informal empire. As China continues to participate in an open, globalized economy, the exporting success of the so-called “Asian Miracles” – exemplified by Japan, Hong Kong, Taiwan and South Korea – has been modified by China’s massive availability of cheap labor. In order to take advantage of this cheap labor, Asian manufacturers are outsourcing their operations to China, assembling the resulting products domestically, and then exporting these products to the rest of the world. This strategy is in accordance with the trend of world economic development post-industrial revolution. The migration of the global manufacturing center is essentially the dynamic optimization of comparative advantage between economies at different development stages. As per capita GDP in other Asian economies increases, China’s inexpensive and high-quality labor force allows it to serve as the manufacturing center for other Asian economies, thereby achieving economic growth and helping other countries move up the value chain. Indeed, as shown in Figures 6 and 7, Hong Kong, Japan, Korea, Taiwan, and Singapore have recently dominated the shares of foreign direct investment in China:
Figures 6 and 7 % of Actual Foreign Direct Investment, 2005
Asia, 59.8%
Africa, 1.7%
Europe, 8.9%
Latin America, 17.9%
North America, 5.9%
Oceanic and Pacific Islands,
3.1%
Others, 2.8%
Asian FDI in China, 2005
Hong Kong, China, 31.0%
Japan, 10.4%
Singapore, 3.5%
Republic of Korea, 8.1%
Taiwan, China, 4.0%
Cayman Islands, 3.1%
Virgin Islands, 14.3%
Samoan, 2.1%
Specifically, we see that Hong Kong contributed $18 billion to China’s FDI inflows in 2005, dwarfing the contributions of other countries. However, it has been estimated that as much as 20% of China’s FDI inflows from Hong Kong represents repatriation of capital originating in China but transferred overseas – mainly to Hong Kong and other tax havens – and then reinvested in China in the form of FDI to take advantage of preferential tax treatment, which also explains the FDI shares of the Virgin Islands, Cayman Islands and Samoa. Nevertheless, the attractions of FDI in China remain evident: a rapidly growing economy, inexpensive and abundant labor, preferential tax policies, and economies of scale from industry clusters in China’s Special Economic Zones, such as Shenzhen. FDI inflows to China amounted to $72 billion in 2005, more than the rest of Asia (excluding Hong Kong) combined. China’s contractual FDI inflows (potential investment in the pipeline) amounted to $153 billion in 2005.
4 The Meiji Restoration (明治維新), also known as the Meiji Ishin or Revolution, was a chain of events that led to enormous changes in Japan's political and social structure. This restoration transformed Japan into an imperial power in the 19th century. Japan eventually engaged in military and economic aggression against China for fifty years until its unconditional surrender post-WWII in 1945.
5

The bulk of the FDI has been in China’s coastal provinces near its major ports: Guangdong received $10 billion alone in 2005. Also, of China’s $72 billion-worth of FDI inflows last year, $43 billion was invested in manufacturing, with the electronics and telecommunications industries receiving the majority of this investment. The composition of China’s top ten export categories, as displayed in Figure 8, also shows that most FDI-beneficiaries are staple products of Asian manufacturers.
Figure 8
What is China selling and buying
0% 5% 10% 15% 20% 25% 30% 35% 40% 45%
Chemicals and Related Products
Plastics and Related Products; Rubber and Related Products
Textile M aterials and Products
Knitted or Crocheted Garments & Clo thing Accessories
Garments Not Knitted or Crocheted
Base M etals and Related Products
M achinery; Electric Equipment and Accessories; Recorders; Video Recorder andAccessories
Locomotives; Vehicles; A ircraft; Ship and Related Transportation Equipment
Optical; Photographic; Film; M easuring and Checking and M edical Instruments andEquipment; Precision Instruments and Equipment; Clocks; M usical Instruments;
Related Parts and Accessories
Others
% of Exports % of Imports
As the following breakdown of China’s trade volume (Figure 9) shows, China is running a surplus against North America and Europe; but it is also running a deficit against rest of Asia. This confirms China’s status as a world factory and outsourced manufacturing center for Asia. It also explains, in part, the importance of consumers in the developed economies to China’s continued strength in exports.
6

Figure 9
Composition of Trade Volume
0% 10% 20% 30% 40% 50% 60% 70% 80%
Asia
Africa
Europe
Latin America
North America
Oceanic and Pacif ic Islands
Import
Export
Total
We believe that China can continue to serve as the world factory in the next decade. In addition to low labor costs, an increasingly open economy and business-friendly provincial governments, China is also enjoying a “late-mover” advantage that promises to enhance its manufacturing competitiveness. By adopting the experience of other first-movers such as Japan, Taiwan and Hong Kong, China is able to benefit from the existing knowledge of the leading countries and achieve exponential growth, even while its endogenous innovation capability remains at a nascent stage. Due to its relatively low technological starting point, China should enjoy this late-mover advantage for a sustained period and should accumulate intellectual capital that will help to foster its own research & development platform in the years and decades to come. As China continues to generate wealth in its role as the world factory, the country also faces the prospect of becoming the world market. As evidenced in Figure 10, the discretionary spending of urban households in China has increased significantly over the past one and a half decades.
7
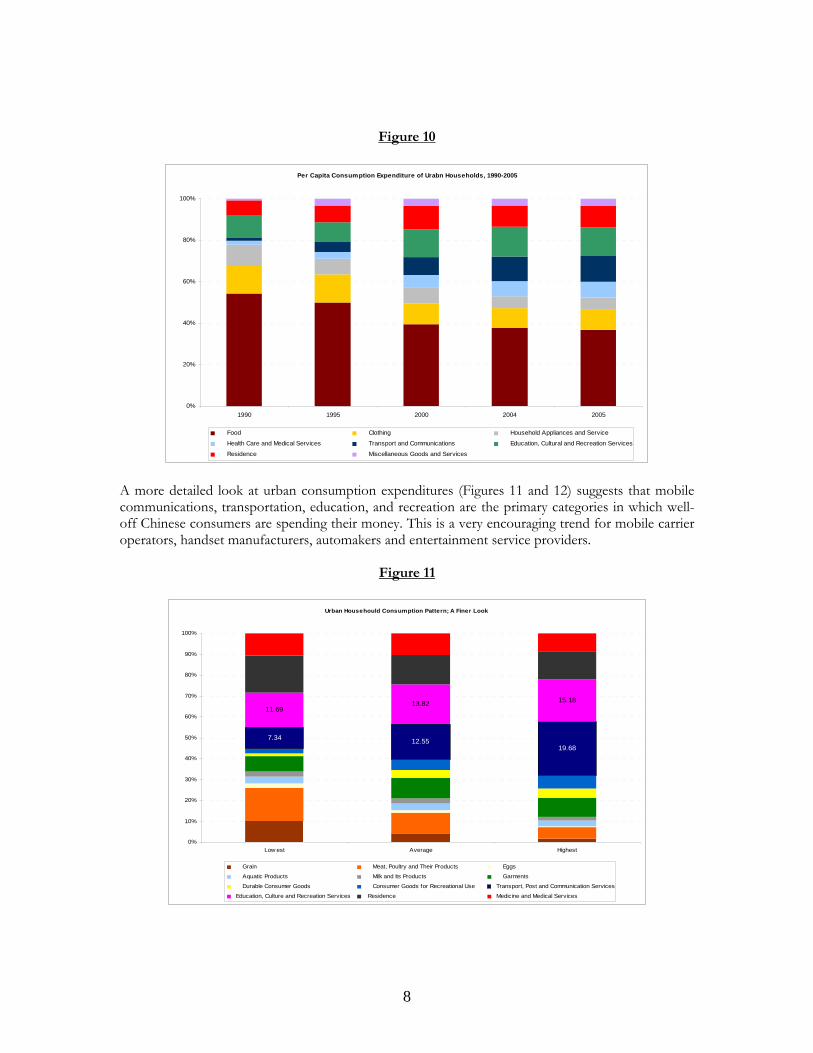
Figure 10
Per Capita Consumption Expenditure of Urabn Households, 1990-2005
0%
20%
40%
60%
80%
100%
1990 1995 2000 2004 2005
Food Clothing Household Appliances and Service
Health Care and Medical Services Transport and Communications Education, Cultural and Recreation Services
Residence Miscellaneous Goods and Services
A more detailed look at urban consumption expenditures (Figures 11 and 12) suggests that mobile communications, transportation, education, and recreation are the primary categories in which well-off Chinese consumers are spending their money. This is a very encouraging trend for mobile carrier operators, handset manufacturers, automakers and entertainment service providers.
Figure 11
Urban Househould Consumption Pattern; A Finer Look
7.34 12.5519.68
11.6913.82 15.18
0%
10%
20%
30%
40%
50%
60%
70%
80%
90%
100%
Low est Average Highest
Grain Meat, Poultry and Their Products Eggs
Aquatic Products Milk and Its Products Garments
Durable Consumer Goods Consumer Goods for Recreational Use Transport, Post and Communication Services
Education, Culture and Recreation Services Residence Medicine and Medical Services
8
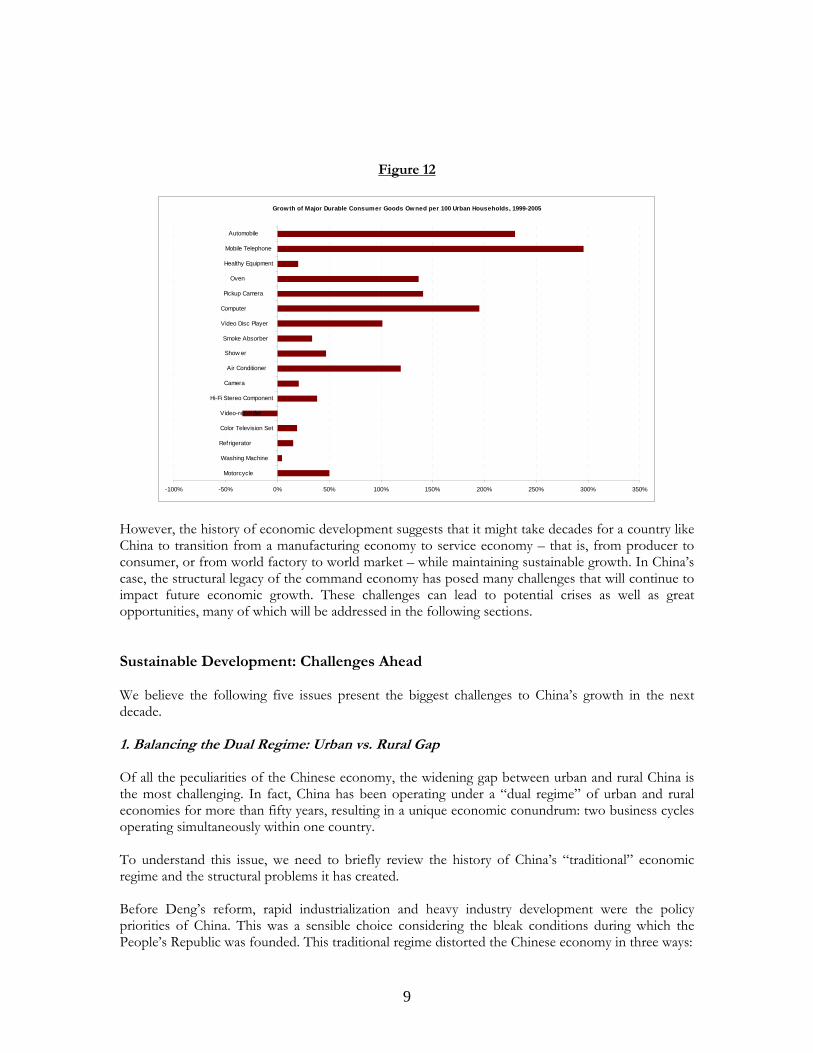
Figure 12
Growth of Major Durable Consumer Goods Owned per 100 Urban Households, 1999-2005
-100% -50% 0% 50% 100% 150% 200% 250% 300% 350%
Motorcycle
Washing Machine
Refrigerator
Color Television Set
Video-recorder
Hi-Fi Stereo Component
Camera
Air Conditioner
Show er
Smoke Absorber
Video Disc Player
Computer
Pickup Camera
Oven
Healthy Equipment
Mobile Telephone
Automobile
However, the history of economic development suggests that it might take decades for a country like China to transition from a manufacturing economy to service economy – that is, from producer to consumer, or from world factory to world market – while maintaining sustainable growth. In China’s case, the structural legacy of the command economy has posed many challenges that will continue to impact future economic growth. These challenges can lead to potential crises as well as great opportunities, many of which will be addressed in the following sections. Sustainable Development: Challenges Ahead We believe the following five issues present the biggest challenges to China’s growth in the next decade. 1. Balancing the Dual Regime: Urban vs. Rural Gap Of all the peculiarities of the Chinese economy, the widening gap between urban and rural China is the most challenging. In fact, China has been operating under a “dual regime” of urban and rural economies for more than fifty years, resulting in a unique economic conundrum: two business cycles operating simultaneously within one country. To understand this issue, we need to briefly review the history of China’s “traditional” economic regime and the structural problems it has created. Before Deng’s reform, rapid industrialization and heavy industry development were the policy priorities of China. This was a sensible choice considering the bleak conditions during which the People’s Republic was founded. This traditional regime distorted the Chinese economy in three ways:
9

• Factor Price Distortion. In any underdeveloped, capital-scarce economy, the cost of capital
can often be high enough to inhibit, if not prohibit, the formation of industrialization. This was the case in China in the 1950s. To successfully execute the country’s strategy of fostering industrialization, therefore, prices of capital, energy, raw materials, labor and consumer staples were artificially suppressed to lower the cost of industrial capital formation.
• Centralized Resource Planning & Allocation. Distorting factor prices for production and consumption creates structural scarcity in an economy. In order to allocate scarce resources to the favored heavy industries, China instituted a highly centralized command structure to which market mechanisms such as banking, foreign exchange, import/export and labor wages had to defer. Governmental control, in other words, took absolute precedence.
• Lack of Private Sector Incentive. When production factors and resources are controlled under a highly centralized command structure, the economic activities of the private sector must also be redirected to serve the same strategic purpose. In this way, Chinese industry became nationalized and agriculture communized, resulting in production disincentives and inefficiencies.
Labor is the most important basic production factor. The size of the Chinese population enables it to enjoy a natural comparative advantage in the labor-intensive industries. However, the traditional Chinese economic regime – as outlined above – favored heavy industry, which was capital intensive with very low employment elasticity: for every unit of incremental capital investment, that is, the relative labor absorption rate in heavy industry is lower than that in the light industry. Therefore China not only needed to promote full urban employment to achieve faster industrialization, but also suppress the urban wage to subsidize capital expenditure. In order to achieve full urban employment at low wages, Chinese leaders attempted to satisfy the following conditions:
• Suppressed food staple prices and a secure supply of low-priced agricultural products via state monopoly of the agricultural sector;
• Government-provided benefits such as pensions, housing subsidies, medical care and education in order to compensate for low wages, which could only be accomplished by limiting the scope of the beneficiaries.
In an attempt to implement the above strategies, the family register system was created in 1958: a policy that aimed to prevent free migration of labor between urban and rural China. Under this law, no mainland Chinese citizen was allowed to move or work freely between urban and rural regions without prior approval from the government. This was the origin of the aforementioned dual regime. Over the years, this system has created not only resource misallocation between urban and rural regions but also employment inequality. It is estimated that, in 1978, the urban economy employed 95 million workers, with available fixed assets of 450 billion, while the rural economy employed 310 million workers, with fixed asset of only 95 billion: a staggering disparity of labor-to-asset ratios. Deng’s economic reforms did much to rectify this inequity. His policies granted freer labor movement between rural and urban communities and gradually introduced market-based resource allocation schemes. Today, there are more opportunities for rural Chinese to attain higher standard of living within the urban marketplace. However, the legacy of China’s command economy still remains. Although the country’s booming private sector has fostered many small and medium
10

enterprises (SME) that compete in labor-intensive industry, the major state-owned enterprises (SOE) continue to monopolize capital-intensive industry, spawning yet another form of dual regime. In addition, implicit discrimination against rural citizens still remains a major social challenge. Figure 13 further explains the dynamics of this rural/urban divide. While the data indicates that the absolute level of wealth in both rural and urban China has grown more than six-fold since 1978, the relative income gap between these two constituencies is still widening.
Figure 13
Per Capital Disposable Income, Urban & Rural, Rmb
0
2000
4000
6000
8000
10000
12000
1978 1980 1985 1989 1990 1991 1992 1993 1994 1995 1996 1997 1998 1999 2000 2001 2002 2003 2004 2005
Urban Rural The gap is widening for many reasons: the slow pace of family register system reform, the limited capacity of existing cities to create new employment opportunities, and the rapid economic development in the coastal cities. Taken together, these trends are very conducive to social instability, especially when one considers that the country’s grass-roots dissenting voices are increasingly unable to have a voice within the Chinese political platform. Furthermore, as shown in Figure 14, the contribution of non-farm industries to GDP has increased, but the percentage of non-farm workers within the total employed labor force hasn’t increased proportionately. Additionally, the urban registration unemployment rate remains at a high level, suggesting more room for future urbanization progress.
11

Figure 14
Why Chinese Urbanization Is a Long March
16.518.8
29.5
39.9
50.153.1
55.2
5.30
3.78
5.77
8.398.29
0
10
20
30
40
50
60
70
80
90
100
1952 1957 1978 1989 1997 2004 20052
3
4
5
6
7
8
9
Urb
an U
nem
ploy
men
t Rat
e %
Non-farm GDP % Non-farm Employment % Urban Registration Unemployment Rate
The widening income gap between urban and rural workers signifies a pressing need for more comprehensive labor market reform. Of even greater necessity is the implementation of a strategy designed to upgrade human capital quality and to promote full urban employment, particularly as competition intensifies post-WTO accession. This will require more investment in education, rural entrepreneurship, and comprehensive reform within the family register system. The management of an orderly urbanization of rural China and the narrowing of the income gap are two of the most urgent problems facing China, both of which must be addressed amid increasing international competition. These are complex issues without short-term fixes; but if China is to realize its full economic potential, appropriate policy solutions must be identified and implemented. 2. Moderating Endogenous Capital and Excess Liquidity via Market Mechanisms It has become a widely shared concern within the investment community that booming asset prices in China are not primarily driven by economic fundamentals but by excess liquidity. In an attempt to clarify these concerns, we will try to estimate how much excess liquidity is circulating within the Chinese market. To do this, we will use the difference between the growth in money supply and GDP growth as our measure for excess liquidity. As shown in Figure 155, recent CPI inflation has remained at seemingly benign levels, but M1 excess liquidity has erupted from 1.6% in 2005 to 10.9% in 2007, with M2 excess liquidity only increasing
5 The huge CPI inflation from 1994 to 1996 was due to the elimination of dual exchange rates and current account convertibility. This high inflation was followed by a set of controversial policy measures by Zhu Rongji to soft-land the economy. Interestingly, this inflation episode did not cost Zhu too much political capital, as compared to Zhao Ziyang’s resignation after the 1988 episode, which indirectly led to the protest on Tiananmen Square in 1989.
12

one percentage point during the same time period, from 7% to 8%. This suggests that China’s domestic population is transferring their cash out of savings accounts and into the risky asset market.
Figure 15
Excess Liquidity (Money Supply Growth - GDP Growth) and CPI Inflation
17 17
23
21
19
15
10
7 7
4
9
8
10
5
7
5
8
15.0
21.7
24.8
13.1
5.8
8.9
12.9
4.1
10.1
7.5
4.4
9.38.7
4.0
1.6
6.8
10.9
-5
0
5
10
15
20
25
30
1991 1992 1993 1994 1995 1996 1997 1998 1999 2000 2001 2002 2003 2004 2005 2006 2007
% C
PI In
flatio
n
M2 Excess Liquidity M1 Excess Liquidity CPI Inflation
M1 Excess LiquidityBlowout Continues;More Inflation &Asset Bubble Risk
However, the CNY|USD exchange has appreciated by only 10% during this same two-year period (Figure 16), amid accelerating foreign reserves accumulations with an average annual growth of 29.8% (Figure 17).
Figures 16 and 17
CNY|USD Exchange Ra
0.120
0.122
0.124
0.126
0.128
0.130
0.132
0.134
Dec
-04
Jan-
05
Feb-
05
Mar
-05
Apr
-05
May
-05
Jun-
05
Jul-0
5
Aug
-05
Sep
-05
Oct
-05
Nov
-05
Dec
-05
Jan-
06
Feb-
06
Mar
-06
Apr
-06
May
-06
Jun-
06
Jul-0
6
Aug
-06
Sep
-06
Oct
-06
Nov
-06
Dec
-06
Jan-
07
Feb-
07
Mar
-07
Apr
-07
May
-07
Jun-
07
Jul-0
7
Aug
-07
Sep
-07
USD
per
RM
B
China's FX Reserves (USD 100 Million)
0
2000
4000
6000
8000
10000
12000
1990 1991 1992 1993 1994 1995 1996 1997 1998 1999 2000 2001 2002 2003 2004 2005 2006 2007
Meanwhile, the trade surplus, which reached nearly $250 billion in 2006, continues to widen (Figures 18 and 19).
13

Figures 18 and 19
Source: CEIC, China Statistics Yearbook, Lehman Brothers Taken together, the above data leads to several conclusions:
• Chinese GDP has grown by about 10% every year since 2004, but CPI inflation has not reached above 5% during the same period. Given soaring M1 levels, one might conclude that GDP or CPI is underestimated. The risk of inflation, therefore, is a lot higher than CPI levels suggest.
• The People’s Bank of China (PBoC) has raised the policy rate five times and the reserve requirement rate eight times since 2006. So far, this has not made a significant dent in excess liquidity.
• In addition, the spread between the 1-year bank lending and deposit rates stands firmly at 3.5%. This high interest income margin will encourage loan growth, and the interest rate differential will further stimulate USD|CNY appreciation.
• Not only is the trade surplus widening, but the spread between ordinary trade and processing trade is growing to an even greater degree. This corroborates the proposition that foreign “hot money” is finding its way into mainland China via disguised foreign trade.
Excess liquidity is a by-product of China’s “double-surplus” economy: a trade surplus that accumulates FX reserves, plus a savings surplus that generates over-investment. This structural imbalance within the Chinese economy has translated into an asset-liability mismatch on the PBoC balance sheet: as FX reserves accumulate, the PBoC can only passively sterilize those reserves by injecting base currency into the system in an attempt to stabilize exchange rates. There is a limit to the PBoC’s tightening efforts on the asset side; the PBoC, in other words, cannot completely shut down the loan facility it extends to other commercial banks. Therefore, the only policy measures left are on the liability side: the reserve requirement rate and open market operations, which are only useful in absorbing marginal excess liquidity since interest rates in China have not yet been entirely determined by the interbank swap market. As a result, the money multiplier effect, as postulated in the monetarist’s textbook, is being neutralized by the goal of exchange rate stability, and monetary policy succumbs to a biased macroeconomic objective: a classic example of the “Impossible Trinity6.”
6 As hypothesized by Robert Mundell and Marcus Fleming in the 1960s, an open economy cannot maintain capital account convertibility, fixed exchange rates and independent monetary policy simultaneously.
14

Based on these observations, we believe the fixed asset investment (FAI) in China will continue to ramp up for a longer period of time in order to transform excess liquidity into capital investment projects – a nod to the conventional wisdom that “China will not allow its economy to implode before the Beijing Olympics in 2008.” A cynical interpretation of this simplistic theory is that the Communist Party, having lost its former ideological and revolutionary influence, can only secure its political legitimacy by ensuring continued economic momentum, even while asset prices skyrocket. While we do not subscribe to this theory in its entirety, we do see signals that China’s liquidity situation could veer out of control if Beijing fails to implement more decisive policy measures. A short-term solution to this problem might be to expand the international investment opportunities available to mainland Chinese citizens, including mutual funds under the QDII program. Another solution could reside in encouraging major state-owned enterprises and sovereign principal investment vehicles to undertake large international acquisitions. China could, in other words, export its asset bubble and market volatility through greater participation in the global capital markets. As China’s market-based mechanism for determining interest rates and exchange rates continues to develop, it is only a matter of time before policy makers eliminate all capital control measures. It is important, however, to keep historical precedent in mind. There is a lesson to be learned from Japan’s post-Plaza Accord bubble-to-deflation roller coaster ride: until China can confidently manage the complex risks of the global capital markets, Beijing will not tolerate a quick appreciation of its currency, and any attempt from the outside world (especially the G7 countries) to force currency appreciation will be met with diplomatic resistance. 3. Securing Strategic Resources: Energy, Metals and Food With a population of 1.3 billion and 960 million km2 in total territory, China is the most populous country in the world and the 3rd largest in terms of total land area. In absolute terms, China is rich in mineral resources (Figure 20). With confirmed reserves of 153 different minerals, China ranks third worldwide in total reserves and first in reserves of coal, iron, copper, aluminum, nickel, molybdenum, manganese, tin, lead, zinc and mercury. China’s 46.35 billion tons of iron ore are mainly distributed in the northeast, north and southwest territories. The national reserves of rare earth metals, very important basic materials for the semiconductor and hi-tech industries, far exceed the combined total for the rest of the world. In addition, China’s coal reserves total 1,007.1 billion tons, most of which is located in the northern provinces such as the Shanxi Province and the Inner Mongolia Autonomous Region. China is also rich in crude petroleum, natural gas, oil shale, phosphorus and sulphur. Petroleum reserves are predominantly located in the northwest, northeast and north, as well as in the eastern continental shelves.
15

Figure 20
In per capita terms, however, China is surprisingly resource-poor. Water resources per capita are only 25% of the world average, arable land only 32%, oil 40%, and coal 47%. Base metals reserves, which include iron ore and copper, are relatively low in quality and high in mining costs. Furthermore, their extraction contains a significant likelihood of serious environmental repercussions. As a result of these supply-side challenges, China has become increasingly dependent on imported minerals to support its accelerating march toward industrialization and urbanization. In particular, iron ore imports from Australia, Brazil and the U.S. have soared since 2000, causing international bulk commodity freight prices to increase as well. Added to this low per capita resource allocation is the reality of rapidly increasing demand. Coal is perhaps the most important national resource: 75% of China’s energy consumption is coal-based, and the country consumes 6391 million bbl/day, second only to the U.S. In addition, China is the 3rd largest oil importing country, after Japan and the United States. Steel, both domestic and imported, is also an increasingly sought-after resource. This unbalanced energy and resource production/consumption structure (Figures 21 and 22) has created several problems for China, one of which is environmental: China has 7 of the 10 most polluted cities in the world, according to a recent report by the World Health Organization. Challenges are equally pressing, however, in the economic arena, where drastic measures are being implemented in order to secure China’s strategic energy and metal resources. This explains why executives of major state-owned companies like PetroChina, CNOOC and China Nonferrous Metals often show up in Africa and Central Asia to befriend resource-rich “rogue nations,” and why natural gas, biofuel, solar panels, windmills and nuclear power plants are considered major areas of domestic growth. With an energy appetite that shows no signs of slowing, China is likely to increase its future reliance on these aforementioned strategies in order to address the country’s economic, strategic and geopolitical concerns. Furthermore, it is our opinion that China must improve its energy efficiency in order to alleviate the substantial burden on the environment that has been created by the country’s unprecedented growth.
16

Figures 21 and 22
Energy Production & Composition
0
20
40
60
80
100
120
1978 1980 1985 1989 1990 1991 1992 1993 1994 1995 1996 1997 1998 1999 2000 2001 2002 2003 2004 2005
Coal Crude Oil Natural Gas Other
Energy Consumption & Composition
0
20
40
60
80
100
120
1978 1980 1985 1989 1990 1991 1992 1993 1994 1995 1996 1997 1998 1999 2000 2001 2002 2003 2004 2005
Coal Crude Oil Natural Gas Other In addition to the challenges related to industrialization and the resource dilemmas evident therein, the Chinese agricultural sector is another cause for concern. Despite the fact that only 12% of the country’s total land is arable (Figure 23), China is among the world’s top-3 agricultural producers of cereals, fruits, wheat, potatoes, millet, barley, pork, peanuts and tea. It is estimated that about 800 million people in China are farmers.
Figure 23
“No food security, no social stability” has been the political precept in China for more than two thousand years. Almost without exception, every major food crisis in Chinese history has been followed by political upheaval and, in the most extreme cases, farmer revolution. The good news is that, on an aggregate level, national famine is no longer an immediate challenge, and China is able to export rice and corn in surplus to the world market. However, due to the overall paucity of arable land and the increasing amount of land that has been claimed by urbanization, it has become necessary for China to diversify its food sources without disrupting domestic production activities. Pork is a particularly important part of the Chinese diet, with per capita consumption averaging 0.2 lb. per day. The worldwide rise in animal feed price, which has resulted from high corn and soybean
17

prices driven by increased production of grain-based ethanol, resulted in a steep spike in pork prices in 2007. The crisis of a PRRS7 pandemic, affecting 25 provinces in August 2007, also drove up prices by as much as 85%, creating one of the most severe food price inflations in decades. Emergency countermeasures, such as price subsidies and the release of strategic pork reserves, were seriously onsidered as stopgap solutions.
ow to better anage this situation, especially as its population acquires a more “Western style” diet.
Figure 24
c With the “no food, no stability” precept always in mind, the Chinese government is more than aware of the economic and social complications represented by this pork episode. And pork is not the only commodity that is subject to sudden price increases (Figure 24): the sheer size of the Chinese supply/demand infrastructure tends to create price volatility throughout the international agricultural commodities market. As China’s growth continues to accelerate, it will need to learn hm
% Change in Per Capital Annual Purchases of Major Commodities of Urban Households, 1990-2005
-150 -100 -50 0 50 100 150
Grain (kg)
Fresh Vegetables (kg)
Edible Vegetable Oil (kg)
Pork (kg)
Beef and Mutton (kg)
Poultry (kg)
Fresh Eggs (kg)
Aquatic Products (kg)
Milk (kg)
Fresh Melons and Fruits (kg)
Nuts and Kernels (kg)
Liquor (kg)
Coal (kg)
7 Porcine Reproductive and Respiratory Syndrome, also known as Blue Ear Pig Disease, causes reproductive failure in breeding stock and respiratory tract illness in young pigs. It was first reported in 1987 in North America and Central Europe. The disease costs the United States swine industry around $600 million annually.
18
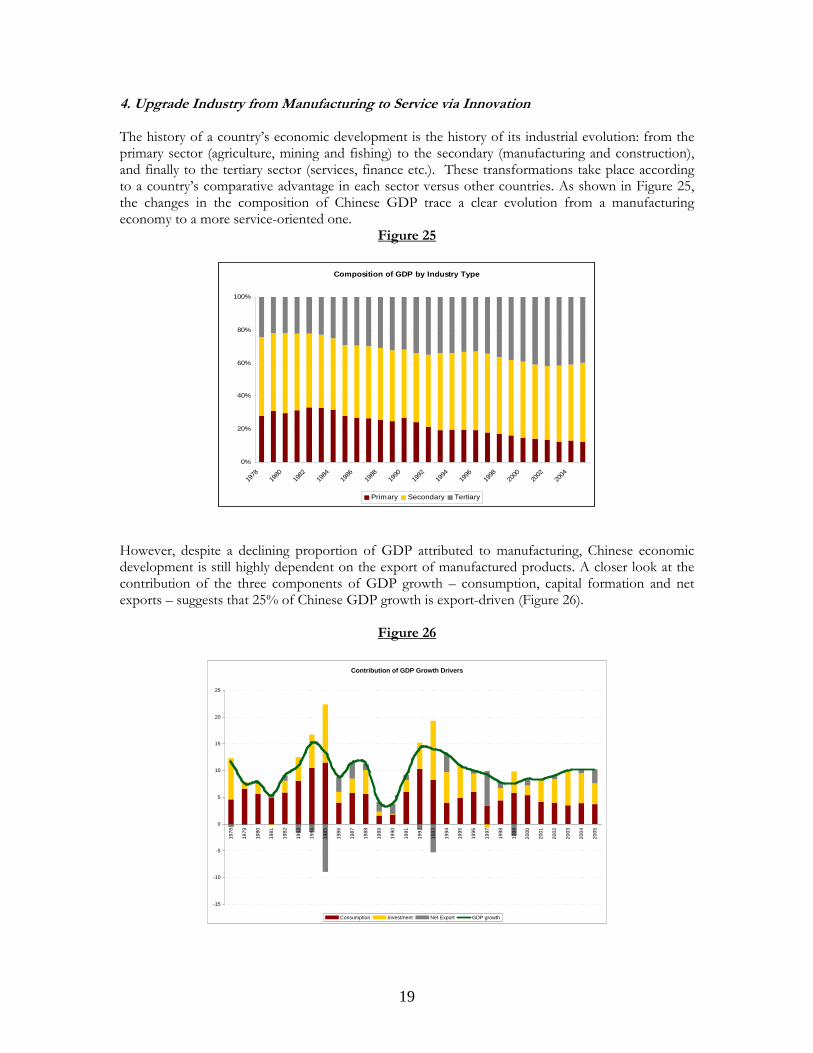
4. Upgrade Industry from Manufacturing to Service via Innovation
ese GDP trace a clear evolution from a manufacturing economy to a more service-oriented one.
Figure 25
The history of a country’s economic development is the history of its industrial evolution: from the primary sector (agriculture, mining and fishing) to the secondary (manufacturing and construction), and finally to the tertiary sector (services, finance etc.). These transformations take place according to a country’s comparative advantage in each sector versus other countries. As shown in Figure 25, the changes in the composition of Chin
Composition of GDP by Industry Type
0%
20%
40%
60%
80%
100%
1978
1980
1982
1984
1986
1988
1990
1992
1994
1996
1998
2000
2002
2004
Primary Secondary Tertiary However, despite a declining proportion of GDP attributed to manufacturing, Chinese economic development is still highly dependent on the export of manufactured products. A closer look at the contribution of the three components of GDP growth – consumption, capital formation and net xports – suggests that 25% of Chinese GDP growth is export-driven (Figure 26).
Figure 26
e
Contribution of GDP Growth Drivers
-15
-10
-5
0
5
10
15
20
25
1978
1979
1980
1981
1982
1983
1984
1985
1986
1987
1988
1989
1990
1991
1992
1993
1994
1995
1996
1997
1998
1999
2000
2001
2002
2003
2004
2005
Consumption Investment Net Export GDP growth
19

This continued reliance on export-oriented GDP growth makes China’s economy particularly vulnerable to both the appetites of international consumers and the protectionism sentiment in the developed world. As Figure 26 indicates, investment has been the primary driver for nearly every period of economic expansion, with exports making a more substantial contribution in 2004 onward. This suggests that over-capacity on the supply side will be a serious problem if the external demand for Chinese exports suddenly cools down. Take the Chinese steel industry for example. In 1999, there were only about 1,000 steel producers in China. By 2005, the number had increased to 6,000. As a result, Chinese steel production capacity increased from 110 million tons per year in 2001 to 260 million tons per year in 2005. By 2006, China was a net steel exporter with a steel trade surplus of $11 billion. However, the domestic price for many steel products continues to drop lower than the international price, suggesting that China has become increasingly dependent on external demand growth to absorb its domestic over-investment. The Chinese trade surplus increased 74% in 2006 and grew another 85% in the first half of 2007. Furthermore, the proportion of exports to total GDP increased to 40% in 2006. This implies that, on an annualized basis, the growth in the trade surplus contributed about 6% to total GDP growth in the first half of 2007. If we assume that trade surplus growth could be cut in half to 40% due to a slowdown in US consumer spending or an overly rapid appreciation in CNY, or both, the previous calculation suggests that Chinese GDP will shrink by least 3%. Under this scenario, domestic Chinese firms will begin slashing prices to achieve import substitution and increase (or maintain) market shares -- not a gentle way to achieve a soft landing and certainly a bad move for corporate profitability. In our view, this is one of the biggest risks to the fashionable “global decoupling” theory. Furthermore, as the low-cost advantage begins to vanish (high food inflation is circumstantial evidence of this eventuality), Chinese leadership must improve labor productivity and motivate a nation-wide upgrade to the higher-margin, knowledge-based service industries. The experiences of Japan, Taiwan and Singapore should provide good examples in this regard. How can China increase long-term profitability without participating in the cost-cutting race to the bottom? The secret is innovation8. China must continue to encourage innovative thinking in its educational system, provide corporate incentives to increase R&D spending, incubate private entrepreneurship by providing seed financing, and level the playing field for fair competition. 5. Fostering Soft Infrastructure for an Open Capitalistic Soc ety i
In our view, “Socialism with Chinese characteristics” is a less-than-straightforward notion. Some might say that, instead of representing a real foundation for effective policy-making, this term is simply a rhetorical method of calming the more reactionary elements within the Communist Party, so as not to let ideological debates interfere with economic development. Despite China’s attempts at clever wordsmithing, however, it is clear to us that the country’s economy is a capitalist one. And, in some instances, this capitalism has had very brutal manifestations. Consider the recent efforts of Chinese police to crack down on slave labor in the small brick kilns and mines in the Shanxi and Henan provinces. In a recent article in China Daily, it was divulged that 168 people were detained for their involvement in the forced enslavement of hundreds of laborers –
8 Historically, the Chinese have been among the most innovative people in the world: papermaking (2nd century BC), gunpowder (7th century), the compass (11th century) and woodblock printing (3rd century) were all invented in China. It was not until the Scientific Revolution in the 17th century that China’s technological productivity began to fall behind that of Europe.
20

many of them unlicensed, mentally handicapped, and underage – within extremely cruel and dangerous working conditions. Such evidence of human rights violations appears in particular contrast to the record-setting productivity of many Chinese firms. Figure 27, for example, shows the incredible post-IPO share price performance of a public coal producer in Hong Kong.
Figure 27
1898.HK
0
5
10
15
20
25
30
35
Dec-06
Jan-0
7
Jan-0
7
Jan-0
7
Feb-07
Feb-07
Mar-07
Mar-07
Apr-07
Apr-07
May-07
May-07
Jun-0
7
Jun-0
7Ju
l-07
Jul-0
7Ju
l-07
Aug-07
Aug-07
Sep-07
Sep-07
Oct-07
Oct-07
Cls
oing
Sto
ck P
rice
This sharp bifurcation between human and corporate well-being not only paints a bleak social picture, but also reveals a moral dilemma facing China today: to what extent should economic motivation take precedence over common decency? How can a society known for thousands of years as the “Kingdom of Etiquette and Justice” tolerate a modern environment in which the rule of law, government accountability, professional ethics and, most sadly, traditional values and communal trust face possible extinction? We believe that, without these crucial building blocks of “soft infrastructure” firmly in place, no sustainable economic development is possible. They are the keys to making a capitalistic society viable. As China becomes more open to the global marketplace, and as the Chinese press faces fewer limitations to free and unencumbered speech, we have no doubt that the Chinese people will find a way to re-institutionalize these values into an evolving society. Guidelines for Global Value Investors As the subprime contagion slowly and painfully erodes the confidence of U.S. consumers, the probability of a major U.S. slowdown, if not recession, has increased significantly. Measures taken by central banks to inject liquidity into distressed credit markets around the world, while effective in bailing out investor sentiment in the short term, might be insufficient to prevent further risk re-pricing in the long term. This widespread attitude of cautious pessimism – as inspired by a weak dollar, widening credit spreads and increasing implied volatility of U.S. assets – suggests a growing desire by investors to get out of the U.S and to diversify globally in order to protect capital. What’s more, the combination of a falling dollar, soaring oil prices and disappointing profit growth sound very much like the distant drumming of stagflation. In the next three to five years, therefore, the most profitable investment strategies will be those focused on hedging U.S. exposure by buying assets that will appreciate in
21

value when dollar is falling and inflation is rising. While the impending weakness in the U.S. economy will certainly have a ripple effect throughout world markets, we believe that Asia, with its healthy balance sheet and strong economic momentum, seems better equipped to weather this financial storm than other developed economies. So what assets should investors buy? We recommend an investment strategy that identifies the following: large companies that generate high proportions of revenues and cash flows outside the U.S.; commodities producers with strong asset bases and reserves with multinational operations; niche players with superb management and intelligent business models that occupy a sweet spot in the global value chain. In general, we recommend companies that can leverage their free cash flow generation capability in their core business and re-invest those cash flows in global markets that offer the most attractive growth opportunities to earn at a rate above their cost of capital. This strategy provides a strong argument for being long Emerging Markets. Among all major emerging markets, we believe Greater China offers the highest potential number of companies that are able to generate high free cash flows and re-invest in high-growth strategies to earn superior returns on capital. We acknowledge that asset valuations in China are currently experiencing an uptrend driven by speculative frenzy, but we believe that, by identifying macro themes and good Chinese companies through deep and focused research, investors will be rewarded in the long run. With the above macro thesis in mind, the following is a list of actionable themes that offer attractive investment opportunities in Greater China: 1. National Champion via Asset Injection According to WIND, a Chinese database, there have been 1,154 mergers & acquisitions, 64 asset strippings, 476 asset swaps, 1,820 asset sales, and 120 secondary offerings in the Chinese A-Share market since 2005, suggesting that corporate restructuring is currently a key value driver in the Chinese corporate landscape. While it can be argued that this level of restructuring activity is not sustainable in the long term, there are many signs that point to a multi-year lifespan for this investment theme.
After the successful tradable/non-tradable share reform that began in 2005, liquidity in the Chinese public equity market has increased dramatically. A growing number of public companies have realized that the stock market can be a very inexpensive source of equity capital. Because of the immaturity of the Chinese capital markets, many large Chinese conglomerates have only listed a portion of their group assets. This is particularly the case in large state-owned enterprises (SOE) such as China National Oil Corp (listed sub: PetroChina), China National Offshore Oil Corp (listed sub: CNOOC, China BlueChemical, China Oilfield Services), China Oil Foods Corp (listed sub: China Agri-Holdings, China Foods), etc. It is natural, therefore, to expect these companies to initiate group restructurings to improve the visibility of their corporate organizations and to enhance investor confidence. Furthermore, it is the intention of Chinese regulatory bodies (SASAC and CSRC) to foster “bigger and stronger” SOEs, or “National Champions”, by encouraging group listings, asset injections, M&A activity, etc. so as to improve the asset quality and profit margins of public companies. The government’s bottom line is that major shareholders, usually state asset owners, must not inject assets into listed subsidiaries at below net asset value. This provides a very attractive asset re-pricing catalyst.
Think of it as a reverse merger: when high quality assets are injected at net asset value instead of market value, this is equivalent to a low ROE, high P/Bx company receiving high ROE, low P/Bx
22

assets from a group parent. Since the average P/Bx in the A-Share category is about 6x, and that of overseas Chinese stocks is about 3x, the arbitrage catalyst is obvious. In addition, many public companies have share-based incentives for senior management, providing additional motivation for engaging in accretive restructuring deals.
We call this the King Lear Strategy: identify which listed subsidiary is likely to be the most beloved child of the parent; determine whether the parent has any unlisted assets to inject; and deduce the discount at which those injected assets will be priced. Potential candidates for asset injections must have certain characteristics favorable to their parents, which may include the following:
• Listed subsidiaries with market-based management incentive schemes • Listed subsidiaries in which the parent holds a big stake • Parents with assets that are in direct competition with the listed subsidiaries • Parents that have sizable related-party transactions with the listed subsidiaries • Conglomerates that aim to streamline their businesses
Regarding the Chinese “National Champion” strategy, it is worthwhile to revisit the topic of food supply. It is not in China’s comparative advantage to engage in the agricultural industry, but China must nevertheless take care of its 800 million farmers. The increasing Chinese demand for wheat, corn, soybeans and other agricultural commodities has created substantial opportunities for companies operating in Brazil and the U.S.: Bunge, ADM and Monsanto, to name a few. However it is unlikely that the Chinese government will allow its food supplies to be controlled by a group of foreign companies. It is not a politically viable choice. Because of this, we believe China will eventually form one or two major food companies via asset injection and state subsidy that can compete against other international players. Needless to say, a company of this type would be very interesting investment target. A similar argument can also be applied to the aero-defense, energy, telecom, financial and power utility sectors. 2. Continuing Expansion of the Real Economy As noted earlier, the urbanization of rural China is a long march, and liquidity-driven fixed asset investment should continue on unabated. Because of this, we foresee the initiation of a growing number of infrastructure projects in the near future. We are particularly interested in three areas: airport infrastructure, railway infrastructure, and financial services infrastructure, all of which are closely linked to the continuing expansion of the real economy. Figure 28 shows that, from 2001 to 2005, the growth of total passenger volume in the Chinese civil aviation industry was much higher than the comparable growth in alternative transport methods. A further breakdown of this data by passenger and freight traffic (Figures 29 and 30) also suggests that most of this growth was driven by domestic economic activities.
23

Figure 28
Growth of Transportation, 2001-2005
0% 10% 20% 30% 40% 50% 60% 70%
Railw ays
Highw ays
Waterw ays
Civil Aviation
Total Passenger Length of Routes
Figures 29 and 30
Passenger Traffic (10000 persons
0
2000
4000
6000
8000
10000
12000
14000
16000
1990 1995 2000 2004 2005
International Routes Domestic Routes Regional Routes
Freight Traffic (ton)
0
500000
1000000
1500000
2000000
2500000
3000000
3500000
1990 1995 2000 2004 2005
International Routes Domestic Routes Regional Routes Based on the history of civil aviation development in Europe and the U.S., it is clear that revenues in this industry can grow at 1.5 to 2 times annual GDP growth during an expansionary cycle. An expansionary cycle of this type can last for decades: Chinese civil aviation entered into one in 1980, and from 1990 to 2005, the industry grew at 16.9% per annum, roughly 1.7 times GDP growth, making it the 2nd largest civil aviation market in the world. According to recent estimates by Boeing, the annual growth of China’s passenger market is between 7% and 10%. As the Chinese economy continues to grow and air travel becomes more affordable, this volume growth should continue to increase, especially in the international routes that allow Chinese tourists to spend their appreciated CNY abroad. As Chinese demand for air travel grows, airports should benefit from increasing passenger volume by supplying ground services, aircraft maintenance and logistics support. Also, many publicly listed airports have unlisted assets outside the core runway business (shopping malls, airport hotels, or unused commercial real estate) that might create an asset injection catalyst. Furthermore, the emergence of regional hubs in Greater China should enable consolidation and increase monopolistic pricing power. Therefore, we believe the best way to invest in the Chinese airline market is to identify the industry’s highest free cash flow generators: 1) airports with profitable runway assets at low utilization rates with little to no capital expenditures, and 2) established aircraft maintenance providers in regional hubs that expect to see significant volume growth. The Chinese railway industry presents another interesting transportation-oriented investment opportunity. For the past two decades, profitability in the Chinese railway has lagged the overall economy due to regulatory constraints on financing. As a result, the industry’s over-utilization of aging assets has rendered increasingly poor service quality, which has de-popularized Chinese rail
24

travel. As shown in Figure 28, railway passenger and freight volumes grew by less than 10% from 2001 to 2005. In our view, the room for growth is obvious. China is a continental economy that requires reliable, efficient trans-continental movement of people and goods. As two-thirds of China’s land area is mountainous, a long-distance transportation highway is not a particularly economical option. An upgraded railway system, therefore, should provide a cheaper alternative to both highway and airway travel, which will drive volume growth and improve both pricing and service quality within the railway industry. The necessary railway upgrades are already underway. According to the eleventh Five Year economy plan (2006 – 2010), China has budgeted $200 billion for the railway industry, three times higher than the funds earmarked during last planning period. In addition, the Ministry of Railway – the sole governing body of the Chinese railway – has also laid out ambitious infrastructure expansion plans that will extend into 2020, with the goal of growing total operational railway track length from 75,000 km to 100,000 km, increasing both the double and electric track ratios to 50% from 33% and 27%, respectively, thus upgrading existing routes to high-speed double-track passenger lines or dedicated freight lines. The plan for middle and western China will be even more ambitious, echoing Beijing’s desire to expand the country’s economic growth into its less-developed provinces. Construction machinery manufacturers, construction contractors, locomotive suppliers, logistical service providers, and railway operators should all benefit from this up-cycle, with favorable financial results realized at different phases of the market expansion. We also think the growing Chinese financial services industry is an attractive place to find value, particularly in infrastructure-related sub-sectors. Table 3 provides an overview of the bankcard and POS markets in China and Brazil:
Table 3
Chinese Bankcard & POS Market Overview Debit Card Issuance 1.1 billion Credit Card Issuance 50 million Annual POS Transaction Volume Growth 97% Annual Transaction Amount per POS $230,000 Brazil China Population 118 million 1,300 million GDP per capita (USD) 4,171 2,050 POS Terminal Installation 7,000,000 810,000
Source: China UnionPay, PBoC, Econstat Figure 31 shows the monthly trading turnover of the Shanghai and Shenzhen stock exchanges.
Figure 31
Stock Trading Turnover (100 million Rmb)
0
10000
20000
30000
40000
50000
60000
70000
Jan-
05
Mar
-05
May
-05
Jul-0
5
Sep-
05
Nov
-05
Jan-
06
Mar
-06
May
-06
Jul-0
6
Sep-
06
Nov
-06
Jan-
07
Mar
-07
May
-07
Jul-0
7
Shanghai Shenzhen Total
It's great being a broker!
25

With China’s top five banks controlling $3 trillion of assets (55% of the country’s total banking assets) and securities houses generating record profits from geyser-like trading fees, the Chinese banking industry and financial services sector are set for another decade of growth. This sustained momentum will be largely driven by product innovation, which will require banks, securities houses and insurance firms to invest in infrastructure related to IT, risk management systems, and customer service interfaces that will cultivate transaction-based business such as credit cards, the acquisition of POS merchants, or more advanced financial derivative products aimed at sophisticated institutional clients. Beijing’s stated goal to achieve compliance with the Basel II Accord by 2012 should provide another tailwind for the Chinese financial services industry. In our view, therefore, the biggest beneficiaries of this trend will be IT service providers that specialize in the financial services industry, and that possess established brand and customer bases. Securities exchanges (cash or derivative instruments or both) and leading broker/dealers should also benefit as trading momentum in China continues to increase. 3. Fron -runn ng the China Sovereign Wealth Fund t i China now holds the world’s largest FX reserves: $1.3 trillion as of July 2007. This is a third more than Japan ($907 billion), the second-place holder, followed by Russia ($407 million), Taiwan ($266 million) and South Korea ($251 million). In total, central banks around the world now hold $5.6 trillion of FX reserves: a number that is currently increasing by about $1 trillion per year. This ongoing global financial imbalance has three important implications. First, with oil prices hovering around historical highs and export-led economies booming, central banks in beneficiary countries like Russia and China have strong interests in recycling Petrodollars and Asiandollars. This is especially the case in countries whose demography requires long-duration domestic and international equity investment so as to catch up with savings and economic growth over time. Second, as central banks in emerging markets gain confidence in their ability to manage currency devaluation risk, the cash cushion should be gradually reduced and redirected for domestic investment or consumption. Third, central banks have a real need to hedge their paper wealth as the depreciating dollar scenario unfolds. Diversification into other appreciating asset classes is a sensible, if not inevitable, move. Within this macroeconomic climate, we believe the asset allocation decisions by sovereign wealth funds (SWF) will be among the most important catalysts for global equity market activity in the next decade. The formation of China’s first SWF, China Investment Corporation (CIC), is one of the many steps that will be taken in order to better manage the country’s FX reserves portfolio and domestic excess liquidity. CIC begins operation with a $200 billion mandate, of which about $70 billion is earmarked for international investment. It is widely expected that CIC’s assets under management will continue to grow in the years to come. CIC has not published its investment policy in detail; but we believe it will strive to achieve the following goals: (1) to increase the returns on FX reserves holdings; (2) to diversify away from USD fixed income assets; (3) to accomplish China’s national strategic objectives of securing supplies of energy and commodities, promoting advanced technology, global brand acquisition, Panda diplomacy, etc. Although CIC’s first $3 billion investment in a 10% stake in Blackstone has not proven
26

particularly rewarding post-IPO, we believe this decision can be viewed as a strategic investment beneficial to both parties in the long run. In predicting CIC’s next move, the memory of the CNOOC-Unocal debacle and its political repercussions can serve as a very good lesson for Chinese SOEs: when acquiring strategic assets, it is not wise to use public vehicles to engage in such politically sensitive transactions. The better solution would be to:
(i) Use unlisted parent company (directly controlled by Beijing) to covertly acquire strategic assets and then inject them into listed subsidiary to monetize value, or
(ii) Hire professional financial advisor bound by confidentiality to do private-equity style acquisition on behalf of its clients, i.e., the “white glove” approach.
We believe CIC, China’s principal investment vehicle, will follow this strategy in private while maintaining a more passive investment style in public. This assertion is supported by the following observations:
• Amid an increasingly protectionist climate, China must be careful to acquire controlling stakes in major foreign companies in a manner that avoids political backlash. Markets with strong economic ties to China that owe no explicit political allegiance to the U.S. should be CIC’s preferred choice. This is good news for Hong Kong and other markets in Asia ex-Japan;
• Due to a lack of Chinese investment professionals with international market experience, a passive, enhanced index strategy might be an appropriate initial approach. A corollary to this assertion is that CIC, like the Norwegian SWF, might need to hire external investment managers to pursue a more active investment strategy;
• Through its ownership stakes in private equity firms like Blackstone, CIC might be able to assume an active shareholder role and help direct capital deployment to areas in mainland China, thereby achieving the objective to promote domestic growth: a profitable quid pro quo;
• CIC will serve as the “white glove” that will help big SOEs to discreetly acquire strategic assets in Africa, Latin America, the Middle East and emerging Europe.
In our view, low interest rates and bond yields resulting from the global savings imbalance have financed the recent private equity boom, which, in essence, is a capital structure arbitrage at the macroeconomic level. The strategic re-alignment of SWF asset allocations should sound a distant alarm to the private equity and other ultra-leveraged asset classes in general (barring Blackstone) as sovereign investors become arbitrageurs themselves. We believe risky assets outside the U.S. should benefit the most from this burgeoning trend. Conclusion: Where Do We Go From Here? The past two years would have been a tremendous opportunity for monetizing superior investment performance had one’s portfolio been overweight in Greater China. Many global investors have already regretted missing this opportunity. As is often the case with trends of considerable strength and power, the opportunities in China seem even more obvious and attractive in retrospect. So where do we go from here? Should we follow in Marco Polo’s footsteps and embark on a new Silk Road paved with investment capital?
27

It is tempting to say yes, for the potential reward is certainly enticing. We must be disciplined, however, in our security analysis. Valuations in this area are already rich. It is our belief that the winning strategy for global value investors is to identify key macro themes and invest in companies that can leverage their free cash flow generation capability in their core business and re-invest those cash flows in global markets that offer the most attractive growth opportunities to earn a return well above their cost of capital. Such companies might be based in the U.S., in Europe, in Japan, or anywhere in the Greater China region. It will take work to find these companies, to understand their businesses and to engage in well-informed and insightful security selection. At Epoch, we do not wear the hat of the short-term momentum follower. Instead, we strive to identify the long-term trajectory of the most attractive investment opportunities. In other words, we forecast and anticipate major trends via deep fundamental research, consider the best way to execute our investment strategy within the context of these trends, and actively manage portfolio risk while patiently waiting for the trends to manifest themselves. The trends inherent in China’s “long march to imperial renaissance” are no exception. To appropriate a famous Buddhist saying, there are many roads that lead to “investment heaven.” Our approach to the Chinese market, and the “investment heaven” contained therein, employs the dual compasses of value investing and insightful research: when used together, these strategies will lead us safely and profitably down the road of long-term success.
28