china 100 2017 - brand financebrandfinance.com/images/upload/brand_finance_china_100_2017... ·...
TRANSCRIPT

China 1002017The annual report on the world’s most valuable Chinese brandsMarch 2017

Brand Finance China 100 March 2017 3.Brand Finance Australia 100 March 2016 2. 3.Brand Finance Global 500 February 2016 2. Brand Finance Airlines 30 30 February 2015 2. Brand Finance China 100 March 2017 2.
Foreword
Foreword 2
Definitions 4
Methodology 6
Analysis - China 100 8
Full Table (USDm) 14
Full Table (CNYm) 16
Understand Your Brand’s Value 18
How We Can Help 20
Contact Details 21
Contents
David Haigh, CEO, Brand Finance
What is the purpose of a strong brand; to attract customers, to build loyalty, to motivate staff? All true, but for a commercial brand at least, the first answer must always be ‘to make money’.
Huge investments are made in the design, launch and ongoing promotion of brands. Given their potential financial value, this makes sense. Unfortunately, most organisations fail to go beyond that, missing huge opportunities to effectively make use of what are often their most important assets. Monitoring of brand performance should be the next step, but is often sporadic. Where it does take place it frequently lacks financial rigour and is heavily reliant on qualitative measures poorly understood by non-marketers.
As a result, marketing teams struggle to communicate the value of their work and boards then underestimate the significance of their brands to the business. Skeptical finance teams, unconvinced by what they perceive as marketing mumbo jumbo may fail to agree necessary investments. What marketing spend there is can end up poorly directed as marketers are left to operate with insufficient financial guidance or accountability. The end result can be a slow but
steady downward spiral of poor communication, wasted resources and a negative impact on the bottom line.
Brand Finance bridges the gap between the marketing and financial worlds. Our teams have experience across a wide range of disciplines from market research and visual identity to tax and accounting. We understand the importance of design, advertising and marketing, but we also believe that the ultimate and overriding purpose of brands is to make money. That is why we connect brands to the bottom line.
By valuing brands, we provide a mutually intelligible language for marketers and finance teams. Marketers then have the ability to communicate the significance of what they do and boards can use the information to chart a course that maximises profits. Without knowing the precise, financial value of an asset, how can you know if you are maximising your returns? If you are intending to license a brand, how can you know you are getting a fair price? If you are intending to sell, how do you know what the right time is? How do you decide which brands to discontinue, whether to rebrand and how to arrange your brand architecture? Brand Finance has conducted thousands of brand and branded business valuations to help answer these questions.
Brand Finance’s recently conducted share price study revealed the compelling link between strong brands and stock market performance. It was found that investing in the most highly branded companies would lead to a return almost double that of the average for the S&P 500 as a whole. Acknowledging and managing a company’s intangible assets taps into the hidden value that lies within it. The following report is a first step to understanding more about brands, how to value them and how to use that information to benefit the business. The team and I look forward to continuing the conversation with you.

Brand Finance China 100 March 2017 5.Brand Finance China 100 March 2017 4.
Definitions
Definitions+ Enterprise Value – the value of the
entire enterprise, made up of multiple branded businesses
+ Branded Business Value – the value of a single branded business operating under the subject brand
+ Brand Contribution– The total economic benefit derived by a business from its brand
+ Brand Value – the value of the trade marks (and relating marketing IP and ‘goodwill’ attached to it) within the branded business
‘Branded Business’
‘Branded Enterprise’
E.g.Tencent
E.g. WeChat
E.g.WeChat
‘Brand Value’
‘Branded Business’
‘Branded Enterprise’
‘Brand’ Contribution’
E.g.WeChat
Branded Business Value
A brand should be viewed in the context of the business in which it operates. For this reason Brand Finance always conducts a Branded Business Valuation as part of any brand valuation. Where a company has a purely mono-branded architecture, the business value is the same as the overall company value or ‘enterprise value’.
In the more usual situation where a company owns multiple brands, business value refers to the value of the assets and revenue stream of the business line attached to that brand specifically. We evaluate the full brand value chain in order to understand the links between marketing investment, brand tracking data, stakeholder behaviour and business value to maximise the returns business owners can obtain from their brands.
Brand Contribution
The brand values contained in our league tables are those of the potentially transferable brand asset only, but for marketers and managers alike, an assessment of overall brand contribution to a business provides powerful insights to help optimise performance.
Brand Contribution represents the overall uplift in shareholder value that the business derives from owning the brand rather than operating a generic brand.
Brands affect a variety of stakeholders, not just customers but also staff, strategic partners, regulators, investors and more, having a significant impact on financial value beyond what can be bought or sold in a transaction.
Brand Value
In the very broadest sense, a brand is the focus for all the expectations and opinions held by customers, staff and other stakeholders about an organisation and its products and services. However, when looking at brands as business assets that can be bought, sold and licensed, a more technical definition is required.
Brand Finance helped to craft the internationally recognised standard on Brand Valuation, ISO 10668. That defines a brand as “a marketing-related intangible asset including, but not limited to, names, terms, signs, symbols, logos and designs, or a combination of these, intended to identify goods, services or entities, or a combination of these, creating distinctive images and associations in the minds of stakeholders, thereby generating economic benefits/value”.
Brand Strength
Brand Strength is the part of our analysis most directly and easily influenced by those responsible for marketing and brand management. In order to determine the strength of a brand we have developed the Brand Strength Index (BSI). We analyse marketing investment, brand equity (the goodwill accumulated with customers, staff and other stakeholders) and finally the impact of those on business performance.
Following this analysis, each brand is assigned a BSI score out of 100, which is fed into the brand value calculation. Based on the score, each brand in the league table is assigned a rating between AAA+ and D in a format similar to a credit rating. AAA+ brands are exceptionally strong and well managed while a failing brand would be assigned a D grade.
Effect of a Brand on Stakeholders
PotentialCustomers
ExistingCustomers
Influencerse.g. Media
TradeChannels
StrategicAllies &
Suppliers Investors
Debt providers
Sales
Production
All OtherEmployees
MiddleManagers
Directors
Brand

Brand Finance China 100 March 2017 7.Brand Finance China 100 March 2017 6.
Methodology
Inputs StakeholderBehaviour PerformanceBrand Equity
Value DriversBrand
Contribution
Audit the impact of brand management and investment on brand equity
Run analytics to understand how perceptions link to behaviour
Link stakeholder behaviour with key financial value drivers
Model the impact of behaviour on core financial performance and isolating the value of the brand contribution
Brand Audit Trial & Preference Acquisition & Retention
Valuation Modelling
1 2 3 4
Brand Finance Typical Project ApproachBrand Finance calculates the values of the brands in its league tables using the ‘Royalty Relief approach’. This approach involves estimating the likely future sales that are attributable to a brand and calculating a royalty rate that would be charged for the use of the brand, i.e. what the owner would have to pay for the use of the brand—assuming it were not already owned.
Brand strength expressed as a BSI score out of 100.
BSI score applied to an appropriate sector royalty rate range.
Royalty rate applied to forecast revenues to derive brand values.
Post-tax brand revenues are discounted to a net present value (NPV) which equals the brand value.
The steps in this process are as follows:
1 Calculate brand strength on a scale of 0 to 100 based on a number of attributes such as emotional connection, financial performance and sustainability, among others. This score is known as the Brand Strength Index, and is calculated using brand data from the BrandAsset® Valuator database, the world’s largest database of brands, which measures brand equity, consideration and emotional imagery attributes to assess brand personality in a category agnostic manner.
Strong brand
Weak brand
Brand strength index(BSI)
Brand‘Royalty rate’
Brand revenues Brand value
Forecast revenues
Brand investment
Brand equity
Brand performance
2 Determine the royalty rate range for the respective brand sectors. This is done by reviewing comparable licensing agreements sourced from Brand Finance’s extensive database of license agreements and other online databases.
3 Calculate royalty rate. The brand strength score is applied to the royalty rate range to arrive at a royalty rate. For example, if the royalty rate range in a brand’s sector is 1-5% and a brand has a brand strength score of 80 out of 100, then an appropriate royalty rate for the use of this brand in the given sector will be 4.2%.
4 Determine brand specific revenues estimating a proportion of parent company revenues attributable to a specific brand.
5 Determine forecast brand specific revenues using a function of historic revenues, equity analyst forecasts and economic growth rates.
6 Apply the royalty rate to the forecast revenues to derive brand revenues.
7 Brand revenues are discounted post tax to a net present value which equals the brand value.
League Table Valuation Methodology
6. Build scale through licensing/franchising/partnerships
5. Build core business through market expansion
4. Build core business through product development
3. Portfolio management/rebranding Group companies
2. Optimise brand positioning and strength
1. Base-case brand and business valuation(using internal data), growth strategyformulation, target-setting, scorecard andtracker set-up
Evaluate ongoing performance
Current brand and business value
Target brand and business value
Max
imis
ing
a st
rong
bra
nd
How We Help to Maximise Value

Brand Finance China 100 March 2017 9.Brand Finance China 100 March 2017 8.
China 100
Analysis – China 100
Rank 2017: 2 2016: 1 BV 2017: $ 46,734m BV 2016: $ 49,810mBrand Rating: AAA
Rank 2017: 5 2016: 5 BV 2017: $ 31,250m BV 2016: $ 27,735mBrand Rating: AAA
1
2
5
+32%
-6%
Rank 2017: 6 2016: 8 BV 2017: $ 29,555m BV 2016: $ 20,144mBrand Rating: AA+
Rank 2017: 7 2016: 6 BV 2017: $ 29,003m BV 2016: $ 20,305mBrand Rating: AA+
Rank 2017: 9 2016: 9 BV 2017: $ 25,230m BV 2016: $ 19,743mBrand Rating: AAA-
6
7
8
9
+47%
+43%
+28%
+13%
Rank 2017: 3 2016: 2 BV 2017: $ 41,377m BV 2016: $ 37,539mBrand Rating: AAA-
3
4 +94%
Rank 2017: 10 2016:18 BV 2017: $ 22,287m BV 2016: $ 9,953mBrand Rating: AAA
10 +124%
+10% -12%
Rank 2017: 1 2016: 3 BV 2017: $ 47,832m BV 2016: $ 36,334mBrand Rating: AAA
Rank 2017: 4 2016: 10 BV 2017: $ 34,859m BV 2016: $ 17,968mBrand Rating: AA+
Rank 2017: 8 2016: 4 BV 2017: $ 28,511m BV 2016: $ 32,261mBrand Rating: AA+
In August 2014, Xi Jinping declared that, “We should have our own flagship products and establish our own world-renowned brands.” President Xi presciently saw that the future of China’s industry had to lie beyond manufacturing and that focus had to move from the promotion of ‘Made in China’ to ‘Branded in China’. His grasp of the importance of brands is paying dividends. The value of China’s 100 most valuable brands has more than trebled in the last five years from US$266 billion in 2012 to US$823 billion today. Chinese brands rank highly in a number industries, topping Brand Finance’s sector league tables for Engineering & Construction (CSCEC), spirits (Moutai) and now banking.
ICBC, China’s most valuable brand, has overtaken Wells Fargo to become the world’s most valuable bank brand. Its brand value has
grown 32% year on year to a total of US$47.8 billion, constituting 20% of its US$239 billion market capitalization (at our valuation date).
ICBC’s success is not an isolated case, with many other Chinese banks performing very strongly against international competition this year. China Construction Bank and Bank of China are also growing strongly (by 17% and 13% respectively) and outpacing western banks. CCB is performing particularly well and only very narrowly failed to overtake Wells Fargo iteself; its brand value of US$41.4 billion is just US$250 million behind that of Wells Fargo.
China’s banks have a number of common attributes that help to explain these impressive results. The first is scale; China’s vast population and the growing prosperity of its citizens create a huge market for its major banks. China’s
economy and businesses across all sectors are growing rapidly, expanding both organically and through a strong demand for foreign acquisitions, creating opportunity for its lenders and financial service providers. M&A activity of Chinese firms abroad has significantly accelerated in the last two years, hitting a record high in 2016 with such notable takeovers as ChemChina’s acquisition of Syngenta or Haier Group’s of GE’s home appliance division.
As Brand Finance’s CEO David Haigh states, “Chinese banks are carried in the slipstream of its industrial giants as they grow and expand into international markets.” The opportunity to facilitate Chinese companies’ international deals boosts revenues, but more importantly, enables the banks to build their reputations as facilitators of deals of international stature.
China’s banks look set for further international expansion that should see a further strengthening of their positions in future editions of the Brand Finance Banking 500. ICBC recently listed a US$400 million bond on Nasdaq Dubai to fund expansion and forge stronger ties in the region. CCB is aiming to expand from 24 to 40 foreign territories by 2020, by which it is aiming for pretax profit contribution of at least 5% from foreign operations. Bank of China is further ahead, with 23% of its pre-tax profit already coming from outside China and its foreign assets growing in size by 50% in the last three years alone.
Cultural factors are just as significant as macroeconomic ones. Chinese consumers have a relationship with their brands (including their bank brands) that Western brands can only dream of. Information from Brand Finance’s Brand Strength Index reveals far higher levels of trust and loyalty

Brand Finance China 100 March 2017 11.Brand Finance China 100 March 2017 10.
Analysis – China 100Brand Value Over Time
0
5
10
15
20
25
30
35
40
45
50
Bank of China
Alibaba
China Construction Bank
China Mobile
ICBC
2017201620152014201320122011
Bra
nd
val
ue
(US
$bn
)
for Chinese bank brands than European or American ones. This is partly the result of the simple fact that Chinese banks are yet to experience the major scandals that have dogged banks in Europe, the US and many other parts of the world.
However, China’s consumers demonstrate this lack of cynicism and affinity for brands in other sectors too, so there are certainly unique factors at play. Patriotism is a further boon. Bureaucracy and other factors can make operating in China challenging for foreign brands, but even taking this into account, Chinese consumers seem particularly apt to choose domestic brands at the expense of foreign ones as the success of Huawei and other domestic smartphone manufacturers (to the detriment of Apple) shows.
The combination of domestic loyalty and rapidly improving international recognition and respect has resulted in formidable brand equity results for China’s banks. Most notably, ICBC does not just top the brand value table, it has also received the highest Brand Strength Index score of any bank brand this year.
Agricultural Bank of China is the only Chinese bank on the list whose brand value has fallen, but serves as a warning that continued success is by no means a certainty. Agricultural Bank’s BSI score fell 10% leading to a rating downgrade from AAA to AA+, while brand value is down 12% to US$28.5 billion. ABC’s New York branch was this year the subject of a high profile sexual harassment claim brought by its Chief Compliance Officer, Natasha Taft. Other Chinese banks must ensure that all staff are up to speed with Western social, legal and business norms to avoid similar incidents
harming their rapidly improving international reputations.
During her time at ABC, Taft discovered that transactions were being obscured in order to circumvent money laundering checks, a revelation that led to a US$215 million fine for the bank. There were no other major fines, however, concerns have been raised about the adequacy of the money laundering checks at other major lenders, presenting a further reputational risk.
In terms of total brand value, technology is the most important sector after banking. Alibaba is China’s most valuable tech brand. Its BSI score is 3.3% up from 2016, and its Brand Value has nearly doubled. Valued at over $34.8 billion, the online marketplace continues to thrive in China and globally. Alibaba has created a fair and open portal for small businesses and enterprises. Its success
stems from the opportunities to both open up and simplify commerce for Chinese communities, particularly rural ones. Its service has clearly underpinned brand value growth at home, but in order to accelerate growth abroad by aiding brand recognition, it is investing in marketing communications including joining McDonald’s, Coca-Cola and Visa as a major sponsor of the Olympics Games.
Tencent’s Brand Value has increased by a whopping 124% since last year. Its BSI this year is 86, making it China’s second most powerful brand across all sectors. The strength and value of the Tencent brand come principally from the PC and mobile games market (including titles such as League of Legends) as well as the power of the brands it owns, such as WeChat.
Proportion of the World’s Total Bank Brand Value by Country20172007 2012
KEY National Total Bank Brand Value ($m) % of total banking brand value
Colour Country 2007 (100 brands) 2012 2017 2007 (100 brands) 2012 2017
China 1,244 79,559 258,480 0.26% 11% 24%
US 185,950 205,964 242,350 39% 28% 23%
UK 76,375 67,972 66,437 16% 9% 6%
Canada 14,262 37,066 53,620 3% 5% 5%
France 25,954 33,771 37,782 5% 5% 4%
Others 171,438 205,262 415,336 36% 27% 39%
Total 475,223 746,752 1,074,005 100% 100% 100%
(Data based on Brand Finance’s Banking 500, Brand Finance’s list of the world’s most valuable banking brands)

Brand Finance China 100 March 2017 13.Brand Finance China 100 March 2017 12.
Analysis – China 100Chinese Brands: Total Brand Value (USDm)
0
100
200
300
400
500
600
700
800
US
$bn
Global 5002008
Global 5002017
WeChat has over 850 million users and despite being largely confined to its domestic market, could soon start to challenge Facebook for user numbers. It offers a more extensive range of services than any comparable brand, from mobile payments to video games and text messaging to video sharing. As a result, it is far more embedded in the life of the average user, even replacing work emails for many Chinese. These additional services are helping to drive WeChat’s brand value skyward. It has seen 103% growth in Brand Value, bringing it to nearly US$13.2 billion.
Tencent’s rival in the gaming space, NetEase, has also seen a good year, with a brand value increase of 105%, in parallel with an enterprise value increase of 122%. Furthermore, its brand strength rating has been upgraded from an AA+ to AAA-. Its new game ‘Overwatch’, launched in May, proved popular, causing its US shares to hit a
record high. Overwatch’s success, the continuing profitability of older games and the development of relationships with the likes of Microsoft and Mojang to offer popular games like ‘Minecraft’ will likely push the brand value higher.
Baidu is a notable exception to the strong growth of Chinese tech brands, having decreased 28% in value to US$11.8 billion. In April, Baidu was accused of failing to protect users from misleading, unproven, medical treatments, leading to the death of a cancer sufferer. The controversy caused regulators to curtail its advertising, inevitably damaging both short term revenues and the ability to control its brand. Reduced confidence is reflected in its brand strength index score which has fallen four points to 77.
Lenovo has also lost brand value, seeing a 15% drop in brand value to US$3.7 billion. With its brand strength score at 69, down from 74 last year, it is struggling to overturn its investments. Despite its success with IBM, it has not been able to replicate the same with Motorola, Lenovo’s overall global sales have been falling, along with the rest of the PC industry.
Despite China being the world’s largest car market, brand values in the auto sector are much smaller that in some other sectors and just five brands make China’s top 100. However the likes of Geely, Haval and Wuling are starting to make their presence felt at the international level. Geely, China’s most valuable auto brand, shipped 766,000 units in 2016, 50% more than 2015 and is targeting a further 34% increase in 2017 to deliver over a million. In order to help deliver this, Geely is targeting a controlling stake in Malaysia’s Proton,
which would create 150,000 units of additional capacity. Profits more than doubled last year, helping to drive brand value growth of 154% to US$3.7 billion.
Haval, valued at US$3 billion after a 40% increase, follows in second. As in many other parts of the world, the Chinese market for SUVs is on an upward trajectory. The segment saw a 36% year-on-year increase and accounted for 40% of total car sales in China. This growth is partly down to the halving of sales tax and its planned reinstatement will undoubtedly reduce growth somewhat. However it is still predicted that the SUV segment will continue to grow market share globally, playing to Haval’s advantage. It has been forecasted that SUV sales will reach 27.6 million units by 2021, a 30% increase from 2016.
(China’s brands are making major in-roads globally. The total value of Chinese brands in Brand Finance’s list of the world’s 500 most valuable brands has increased more than tenfold in the last ten years)
Brand Value Change 2016-2017 (USDm) Brand Value Change 2016-2017 (%)
-5500.000000-2142.8571431214.2857144571.4285717928.57142911285.71428614642.857143
Baidu
Agricultural Bank Of China
China Mobile
Xiaomi
LeEco
Sun Hung Kai Properties
Cathay Life Insurance Co
China Unicom
Lenovo
China Shenhua
Moutai
Country Garden
Huawei
Shanghai Pudong Development Bank
PetroChina
Sinopec
ICBC
Tencent
Alibaba
$-496
$-666
$-1059
$-1103
$-1326
$-1784
$-2089
$-3075
$-3750
$-4605
$16890
$12334
$11498
$9412
$8698
$6693
$5570
$5488
$4850
$4337
-45.0-20.54.0 28.553.077.5102.0126.5151.0175.5200.0
LeEco
Xiaomi
Cathay Life Insurance Co
Sun Hung Kai Properties
Baidu
China Shenhua
Want Want
Lenovo
Changan
TCL
NetEase
Happy Valley
Bank of Beijing
Tencent
China Resources Land
Shimao Property
Geely
Country Garden
Aisino
-13%
-14%
-15%
-18%
-19%
-28%
-31%
-33%
-39%
-39%
170%
157%
154%
139%
132%
124%
113%
108%
105%
103%

Brand Finance China 100 March 2017 15.Brand Finance China 100 March 2017 14.
Brand Finance China 100 (USDm)Top 100 most valuable Chinese brands 1 - 50.
Rank2017
Rank2016
Brand name Sector Brandvalue (USDm)
2017
%change
Brandvalue(USDm)
2016
Brandrating2017
Brandrating2016
1 3 ICBC Banks 47,832 32% 36,334 AAA AA+2 1 China Mobile Telecoms 46,734 -6% 49,810 AAA AAA-3 2 China Construction Bank Banks 41,377 10% 37,539 AAA- AAA4 10 Alibaba Technology 34,859 94% 17,968 AA+ AA+5 5 Bank of China Banks 31,250 13% 27,735 AAA AAA6 8 Sinopec Oil & Gas 29,555 47% 20,144 AA+ AA7 6 PetroChina Oil & Gas 29,003 43% 20,305 AA+ AA8 4 Agricultural Bank Of China Banks 28,511 -12% 32,261 AA+ AAA9 9 Huawei Technology 25,230 28% 19,743 AAA- AA10 18 Tencent Technology 22,287 124% 9,953 AAA AA+11 11 Ping An12 7 CSCEC13 13 China Telecom14 14 China Merchants Bank15 19 JD.com16 28 WeChat17 30 Shanghai Pudong Development 18 12 Baidu19 16 Bank of Communications20 25 Moutai21 20 CRECG22 29 Industrial Bank23 21 CRCC24 15 China Life25 23 AIA26 26 China CITIC Bank27 17 China Unicom28 22 China Minsheng Bank29 34 Dalian Wanda Commercial 30 39 Poly Real Estate31 55 Country Garden32 50 NetEase33 47 Evergrande34 54 China Resources Land35 27 Vanke36 24 CRRC37 New Taiwan Semiconductor38 43 China Everbright Bank39 33 PICC40 48 MCC41 38 CPIC42 40 CNOOC43 49 Chow Tai Fook44 41 China Southern Airlines45 52 Hikvision46 45 Yili47 58 Yanghe48 51 China Eastern49 46 Air China50 53 Suning Appliance
Top 100 most valuable Chinese brands 51 - 100.
Rank2017
Rank2016
Brand name Sector Brandvalue (USDm)
2017
%change
Brandvalue (USDm)
2016
Brandrating2017
Brandrating2016
51 83 Bank of Beijing52 New Bank of Shanghai53 New Geely54 New Chunghwa55 42 Lenovo56 81 China Cinda57 59 Hua Xia Bank58 63 CCCC59 New Shimao Property60 35 Xiaomi61 72 Haier62 98 Happy Valley63 80 CGGC64 New Haval65 New Uni-President66 71 Wheelock67 44 Sun Hung Kai Properties68 56 ZTE69 New LeEco70 57 CNBM71 95 Longfor Properties72 75 New China Life (NCI)73 66 Hang Seng Bank74 New Luzhou Laojiao75 99 New World Development76 New Wuling77 86 China Taiping78 70 Mengniu79 76 MTR80 89 CITIC Securities81 90 Wanda Cinemas82 New Cathay Life Insurance Co83 61 China Shenhua84 96 ctrip.com85 62 Want Want86 65 TCL87 78 Harbin88 67 Changan89 New Anta90 79 Sinopharm91 New Wuliangye92 77 Gree Electric Appliances93 New Snow94 New Aisino95 84 36096 New Pou Chen97 New FPCC98 New Hainan Airlines99 100 BAIC100 New Quanta Computer
Brand Finance China 100 (USDm)

Brand Finance China 100 March 2017 17.Brand Finance China 100 March 2017 16.
Brand Finance China 100 (CNYm)Top 100 most valuable Chinese brands 1 - 50.
Rank2017
Rank2016
Brand name Sector Brandvalue (CNYm)
2017
%change
Brandvalue(CNYm)
2016
Brandrating2017
Brandrating2016
1 3 ICBC Banks 319,109 37% 232,420 AAA AA+2 1 China Mobile Telecoms 311,784 -2% 318,619 AAA AAA-3 2 China Construction Bank Banks 276,045 15% 240,130 AAA- AAA4 10 Alibaba Technology 232,556 102% 114,938 AA+ AA+5 5 Bank of China Banks 208,484 18% 177,413 AAA AAA6 8 Sinopec Oil & Gas 197,176 53% 128,854 AA+ AA7 6 PetroChina Oil & Gas 193,492 49% 129,886 AA+ AA8 4 Agricultural Bank Of China Banks 190,210 -8% 206,367 AA+ AAA9 9 Huawei Technology 168,322 33% 126,288 AAA- AA10 18 Tencent Technology 148,685 134% 63,665 AAA AA+11 11 Ping An12 7 CSCEC13 13 China Telecom14 14 China Merchants Bank15 19 JD.com16 28 WeChat17 30 Shanghai Pudong Development 18 12 Baidu19 16 Bank of Communications20 25 Moutai21 20 CRECG22 29 Industrial Bank23 21 CRCC24 15 China Life25 23 AIA26 26 China CITIC Bank27 17 China Unicom28 22 China Minsheng Bank29 34 Dalian Wanda Commercial 30 39 Poly Real Estate31 55 Country Garden32 50 NetEase33 47 Evergrande34 54 China Resources Land35 27 Vanke36 24 CRRC37 New Taiwan Semiconductor38 43 China Everbright Bank39 33 PICC40 48 MCC41 38 CPIC42 40 CNOOC43 49 Chow Tai Fook44 41 China Southern Airlines45 52 Hikvision46 45 Yili47 58 Yanghe48 51 China Eastern49 46 Air China50 53 Suning Appliance
Top 100 most valuable Chinese brands 51 - 100.
Rank2017
Rank2016
Brand name Sector Brandvalue (CNYm)
2017
%change
Brandvalue (CNYm)
2016
Brandrating2017
Brandrating2016
51 83 Bank of Beijing52 New Bank of Shanghai53 New Geely54 New Chunghwa55 42 Lenovo56 81 China Cinda57 59 Hua Xia Bank58 63 CCCC59 New Shimao Property60 35 Xiaomi61 72 Haier62 98 Happy Valley63 80 CGGC64 New Haval65 New Uni-President66 71 Wheelock67 44 Sun Hung Kai Properties68 56 ZTE69 New LeEco70 57 CNBM71 95 Longfor Properties72 75 New China Life (NCI)73 66 Hang Seng Bank74 New Luzhou Laojiao75 99 New World Development76 New Wuling77 86 China Taiping78 70 Mengniu79 76 MTR80 89 CITIC Securities81 90 Wanda Cinemas82 New Cathay Life Insurance Co83 61 China Shenhua84 96 ctrip.com85 62 Want Want86 65 TCL87 78 Harbin88 67 Changan89 New Anta90 79 Sinopharm91 New Wuliangye92 77 Gree Electric Appliances93 New Snow94 New Aisino95 84 36096 New Pou Chen97 New FPCC98 New Hainan Airlines99 100 BAIC100 New Quanta Computer
Brand Finance China 100 (CNYm)
Brand Finance China 100 March 2017 19.Brand Finance China 100 March 2017 18.
Understand Your Brand’s Value
$707
$6,265
$3,031 $2,328 $1,913
213 275
320
607
729
650
0
100
200
300
400
500
600
700
800
2011 2012 2013 2014 2015 2016
58%
37%
4%
Nutrition
Performance Materials
Other Activities
Brand Value Dashboard
$707m AA+78/100
$10,216m
Peer Group Comparison (USDm)Historic brand value performance
Brand Value by Product Segment
7%
Brand Value
€650mEnterprise Value
€9,399m(EUR) (EUR)
(EURm)
$882mBrand Value
€729m(EUR)[XXX]
[XXX]
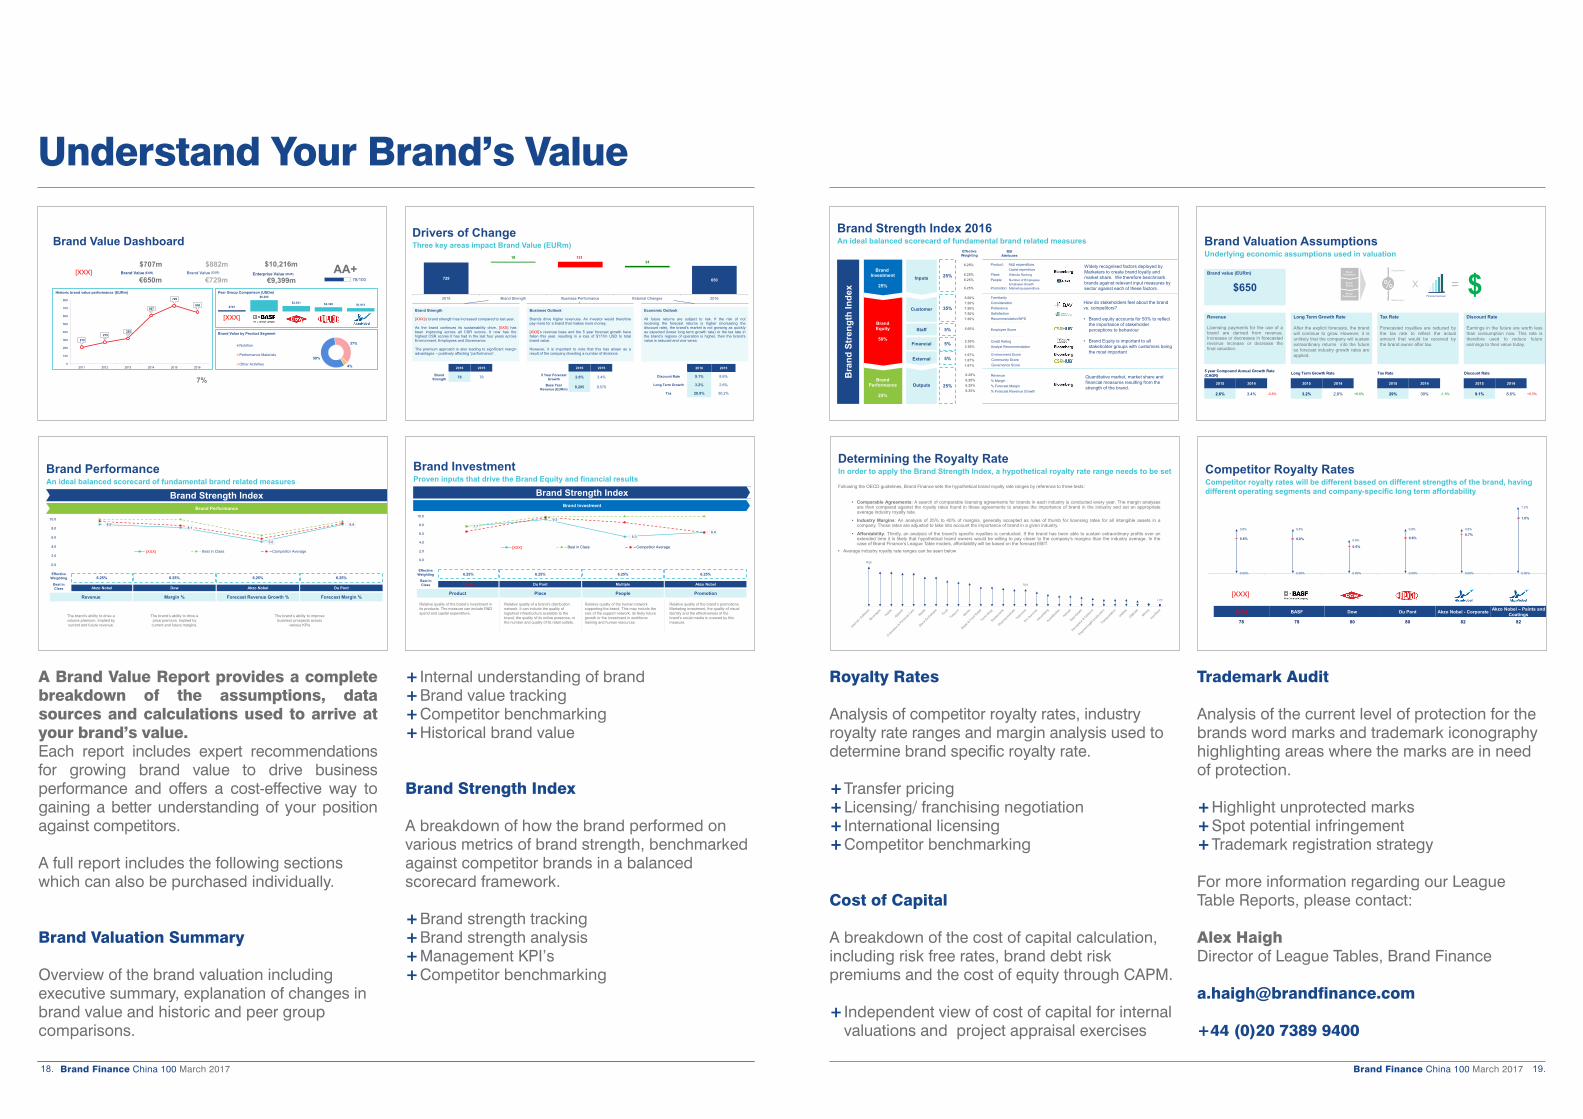
A Brand Value Report provides a complete breakdown of the assumptions, data sources and calculations used to arrive at your brand’s value. Each report includes expert recommendations for growing brand value to drive business performance and offers a cost-effective way to gaining a better understanding of your position against competitors.
A full report includes the following sections which can also be purchased individually.
Brand Valuation Summary Overview of the brand valuation including executive summary, explanation of changes in brand value and historic and peer group comparisons.
+ Internal understanding of brand+ Brand value tracking+ Competitor benchmarking+ Historical brand value
Brand Strength Index
A breakdown of how the brand performed on various metrics of brand strength, benchmarked against competitor brands in a balanced scorecard framework.
+ Brand strength tracking+ Brand strength analysis+ Management KPI’s+ Competitor benchmarking
Brand PerformanceAn ideal balanced scorecard of fundamental brand related measures
Brand Performance
Brand Strength Index
The brand’s ability to drive a volume premium. Implied by current and future revenue.
The brand’s ability to drive a price premium. Implied by current and future margins.
The brand’s ability to improve business prospects across
various KPIs
Revenue Margin % Forecast Revenue Growth % Forecast Margin %
6.25% 6.25% 6.25%
Dow Akzo Nobel Du Pont
Effective Weighting
Best in Class
6.25%
Akzo Nobel
8.98.1
5.0
8.9
0.0
2.0
4.0
6.0
8.0
10.0
DSM Best in Class Competitor Average[XXX]
Drivers of ChangeThree key areas impact Brand Value (EURm)
Brand Strength
[XXX]’s brand strength has increased compared to last year.
As the brand continues its sustainability drive, [XXX] hasbeen improving across all CSR scores. It now has thehighest CSR scores it has had in the last four years acrossEnvironment, Employees and Governance.
The premium approach is also leading to significant marginadvantages – positively affecting “performance”.
Business Outlook
Brands drive higher revenues. An investor would thereforepay more for a brand that makes more money.
[XXX]’s revenue base and the 5 year forecast growth havefallen this year, resulting in a loss of $177m USD to totalbrand value.
However, it is important to note that this has arisen as aresult of the company divesting a number of divisions.
Economic Outlook
All future returns are subject to risk. If the risk of notreceiving the forecast returns is higher (increasing thediscount rate), the brand’s market is not growing as quicklyas expected (lower long term growth rate) or the tax rate inthe brand’s regions of operation is higher, then the brand’svalue is reduced and vice versa.
2016 2015
Discount Rate 9.1% 8.6%
Long Term Growth 3.2% 2.6%
Tax 28.9% 30.2%
2016 2015
5 Year Forecast Growth 2.6% 3.4%
Base Year Revenue (EURm) 8,205 9,570
2016 2015
BrandStrength 78 76
729 729 616 616 650
18 13134
2015 Brand Strength Business Performance External Changes 2016
Brand InvestmentProven inputs that drive the Brand Equity and financial results
Relative quality of the brand’s investment in its products. The measure can include R&D spend and capital expenditure.
Relative quality of a brand’s distribution network. It can include the quality of logistical infrastructure available to the brand, the quality of its online presence, or the number and quality of its retail outlets.
Relative quality of the human network supporting the brand. This may include the size of the support network, its likely future growth or the investment in workforce training and human resources.
Relative quality of the brand’s promotions. Marketing investment, the quality of visual identity and the effectiveness of the brand’s social media is covered by this measure.
Product Place People Promotion
Brand Investment
Brand Strength Index
6.25% 6.25% 6.25%
Du Pont Multiple Akzo Nobel
Effective Weighting
Best in Class
6.25%
[XXX]
7.7
9.3
5.36.4
0.0
2.0
4.0
6.0
8.0
10.0
DSM Best in Class Competitor Average[XXX]
Royalty Rates
Analysis of competitor royalty rates, industry royalty rate ranges and margin analysis used to determine brand specific royalty rate.
+ Transfer pricing+ Licensing/ franchising negotiation+ International licensing+ Competitor benchmarking
Cost of Capital
A breakdown of the cost of capital calculation, including risk free rates, brand debt risk premiums and the cost of equity through CAPM. + Independent view of cost of capital for internal
valuations and project appraisal exercises
Trademark Audit
Analysis of the current level of protection for the brands word marks and trademark iconography highlighting areas where the marks are in need of protection.
+ Highlight unprotected marks + Spot potential infringement+ Trademark registration strategy
For more information regarding our League Table Reports, please contact:
Alex HaighDirector of League Tables, Brand Finance
+44 (0)20 7389 9400
Brand Strength Index 2016An ideal balanced scorecard of fundamental brand related measures
Widely recognised factors deployed by Marketers to create brand loyalty and market share. We therefore benchmark brands against relevant input measures by sector against each of these factors.
How do stakeholders feel about the brand vs. competitors?
• Brand equity accounts for 50% to reflect the importance of stakeholder perceptions to behaviour
• Brand Equity is important to all stakeholder groups with customers being the most important
Quantitative market, market share and financial measures resulting from the strength of the brand.
BSI Attributes
Product: R&D expenditure,Capital expenditure
Place: Website Ranking
People: Number of Employees,Employee Growth
Promotion: Marketing expenditure
FamiliarityConsiderationPreferenceSatisfactionRecommendation/NPS
Employee Score
Credit RatingAnalyst Recommendation
Environment ScoreCommunity ScoreGovernance Score
Revenue% Margin% Forecast Margin% Forecast Revenue Growth
Bra
nd S
tren
gth
Inde
x
35%
25%
5%
5%
5%
Effective Weighting
25%Brand
Investment
25%
BrandEquity
50%
BrandPerformance
25%
Customer
Outputs
Inputs
Staff
Financial
External
6.25%
6.25%6.25%
6.25%
5.00%7.50%7.50%7.50%7.50%
5.00%
2.50%2.50%
1.67%1.67%1.67%
6.25% 6.25% 6.25% 6.25%
Determining the Royalty RateIn order to apply the Brand Strength Index, a hypothetical royalty rate range needs to be set
Following the OECD guidelines, Brand Finance sets the hypothetical brand royalty rate ranges by reference to three tests:
• Comparable Agreements: A search of comparable licensing agreements for brands in each industry is conducted every year. The margin analysesare then compared against the royalty rates found in these agreements to analyse the importance of brand in the industry and set an appropriateaverage industry royalty rate.
• Industry Margins: An analysis of 25% to 40% of margins, generally accepted as rules of thumb for licensing rates for all intangible assets in acompany. These rates are adjusted to take into account the importance of brand in a given industry.
• Affordability: Thirdly, an analysis of the brand’s specific royalties is conducted. If the brand has been able to sustain extraordinary profits over anextended time it is likely that hypothetical brand owners would be willing to pay closer to the company’s margins than the industry average. In thecase of Brand Finance’s League Table models, affordability will be based on the forecast EBIT.
• Average industry royalty rate ranges can be seen below
High
Mid
Low
Brand Valuation AssumptionsUnderlying economic assumptions used in valuation
Brand value (EURm)
$650
Discount Rate
Earnings in the future are worth lessthan consumption now. This rate istherefore used to reduce futureearnings to their value today.
Long Term Growth Rate
After the explicit forecasts, the brandwill continue to grow. However, it isunlikely that the company will sustainextraordinary returns into the futureso forecast industry growth rates areapplied.
Revenue
Licensing payments for the use of abrand are derived from revenue.Increases or decreases in forecastedrevenue increase or decrease thefinal valuation.
Tax Rate
Forecasted royalties are reduced bythe tax rate to reflect the actualamount that would be received bythe brand owner after tax.
5 year Compound Annual Growth Rate (CAGR)
2015 2014
2.6% 3.4% -0.8%
Discount Rate
2015 2014
9.1% 8.6% +0.5%
Long Term Growth Rate
2015 2014
3.2% 2.6% +0.6%
Tax Rate
2015 2014
29% 30% -1.3%
Brand Investment
Brand Equity
Brand Performance
X = $Forecast revenues
%Strong brand
Weak brand
0.00% 0.00% 0.00% 0.00% 0.00% 0.00%
0.8% 0.8%
0.6%
0.8% 0.8%
1.2%
0.6% 0.6%
0.5%
0.6%0.7%
1.0%
DSM BASF Dow Du Pont Akzo Nobel Akzo Nobel
Competitor Royalty RatesCompetitor royalty rates will be different based on different strengths of the brand, having different operating segments and company-specific long term affordability
[XXX] BASF Dow Du Pont Akzo Nobel - Corporate Akzo Nobel – Paints and Coatings
78 78 80 80 82 82
[XXX]

Brand Finance China 100 March 2017 21.Brand Finance China 100 March 2017 20.
How we can help
MARKETING FINANCE TAX LEGAL
Contact usFor brand value report enquiries, please contact:Alex HaighDirector of League Tables Brand Finance [email protected]
For media enquiries, please contact:Robert HaighMarketing & Communications Director Brand Finance [email protected]
For all other enquiries, please contact:[email protected]+44 (0)207 389 9400
linkedin.com/company/brand-finance
facebook.com/brandfinance
twitter.com/brandfinance
For further information on Brand Finance®’s services and valuation experience, please contact your local representative:
Country Contact Email addressAustralia Mark Crowe [email protected] Pedro Tavares [email protected] Bill Ratcliffe [email protected] Minnie Fu [email protected] Nigel Cooper [email protected] Africa Jawad Jaffer [email protected] Victoire Ruault [email protected] Dr. Holger Mühlbauer h.mü[email protected] Ioannis Lionis [email protected] Marc Cloosterman [email protected] Ajimon Francis [email protected] Jimmy Halim [email protected] Massimo Pizzo [email protected] Samir Dixit [email protected] Laurence Newell [email protected] (exc. Brazil) Laurence Newell [email protected] East Andrew Campbell [email protected] Babatunde Odumeru [email protected] Pedro Tavares [email protected] Alexander Eremenko [email protected] Alexander Todoran [email protected] Samir Dixit [email protected] Africa Jeremy Sampson [email protected] Lorena Jorge Ramirez [email protected] Lanka Ruchi Gunewardene [email protected] Victoire Ruault [email protected] Muhterem Ilgüner [email protected] Alex Haigh [email protected] Ken Runkel [email protected] Lai Tien Manh [email protected]
Contact detailsOur offices
Disclaimer
Brand Finance has produced this study with an independent and unbiased analysis. The values derived and opinions produced in this study are based only on publicly available information and certain assumptions that Brand Finance used where such data was deficient or unclear . Brand Finance accepts no responsibility and will not be liable in the event that the publicly available information relied upon is subsequently found to be inaccurate.
The opinions and financial analysis expressed in the report are not to be construed as providing investment or business advice. Brand Finance does not intend the report to be relied upon for any reason and excludes all liability to any body, government or organisation.
We help marketers to connect their brands to business performance by evaluating the return on investment (ROI) of brand based decisions and strategies.
+ Branded Business Valuation+ Brand Contribution+ Trademark Valuation+ Intangible Asset Valuation+ Brand Audit+ Market Research Analytics+ Brand Scorecard Tracking+ Return on Marketing Investment+ Brand Transition+ Brand Governance+ Brand Architecture & Portfolio Management+ Brand Positioning & Extension+ Franchising & Licensing
We provide financiers and auditors with an independent assessment on all forms of brand and intangible asset valuations.
+ Branded Business Valuation+ Brand Contribution+ Trademark Valuation+ Intangible Asset Valuation+ Brand Audit+ Market Research Analytics+ Brand Scorecard Tracking+ Return on Marketing Investment+ Brand Transition+ Brand Governance+ Brand Architecture & Portfolio Management+ Brand Positioning & Extension+ Mergers, Acquisitions and Finance Raising Due Diligence+ Franchising & Licensing+ Tax & Transfer Pricing+ Expert Witness
We help brand owners and fiscal authorities to understand the implications of different tax, transfer pricing and brand ownership arrangements.
+ Branded Business Valuation+ Brand Contribution+ Trademark Valuation+ Intangible Asset Valuation+ Brand Audit+ Market Research Analytics+ Franchising & Licensing+ Tax & Transfer Pricing+ Expert Witness
We help clients to enforce and exploit their intellectual property rights by providing independent expert advice in- and outside of the courtroom.
+ Branded Business Valuation+ Brand Contribution+ Trademark Valuation+ Intangible Asset Valuation+ Brand Audit+ Tax & Transfer Pricing+ Expert Witness
2. Analytics: How can I improve marketing effectiveness?
Analytical services help to uncover drivers of demand and insights. Identifying the factors which drive
consumer behaviour allow an understanding of how brands create bottom-line impact.
• Market Research Analytics • Brand Audits
• Brand Scorecard Tracking • Return on Marketing Investment
3. Strategy: How can I increase the value of my branded business?
Strategic marketing services enable brands to be leveraged to grow businesses. Scenario
modelling will identify the best opportunities, ensuring resources are allocated to those activities
which have the most impact on brand and business value.
• Brand Governance • Brand Architecture & Portfolio Management
• Brand Transition • Brand Positioning & Extension
4. Transactions: Is it a good deal? Can I leverage my intangible assets?
Transaction services help buyers, sellers and owners of branded businesses get a better deal by leveraging the value of their intangibles.
• M&A Due Diligence • Franchising & Licensing
• Tax & Transfer Pricing • Expert Witness
1. Valuation: What are my intangible assets worth?
Valuations may be conducted for technical purposes and to set a baseline against which potential strategic brand scenarios can be evaluated.
• Branded Business Valuation • Trademark Valuation
• Intangible Asset Valuation • Brand Contribution
2. ANALYTICS
3. STRATEGY 4.TRANSACTI
ON
1. V
ALUATION
Brand & Business Value
Contact us.
The World’s Leading Independent Branded Business Valuation and Strategy ConsultancyT: +44 (0)20 7389 9400 E: [email protected] www.brandfinance.com
Bridging the gap between marketing and finance