chimie paristech, laboratoire de chimie de la mati arxiv
TRANSCRIPT

Measurement of line widths and permanent electric dipole moment change of the Ce4f-5d transition in Y2SiO5 for a qubit readout scheme in rare-earth ion based
quantum computing
Ying Yan, Jenny Karlsson, Lars Rippe, Andreas Walther, Diana Serrano,
David Lindgren, Mats-erik Pistol, and Stefan KrollDepartment of Physics, Lund University, P.O. Box 118, SE-22100 Lund, Sweden
Philippe GoldnerChimie ParisTech, Laboratoire de Chimie de la Matiere Condensee de Paris,
CNRS-UMR 7574, UPMC Univ Paris 06, 11 rue Pierre et Marie Curie 75005 Paris, France
Lihe Zheng and Jun XuKey Laboratory of Transparent and Opto-Functional Inorganic Materials,
Shanghai Institute of Ceramics, Chinese Academy of Sciences, Shanghai 201800, China(Dated: March 6, 2013)
In this work the inhomogeneous (zero-phonon line) and homogeneous line widths, and one pro-jection of the permanent electric dipole moment change for the Ce 4f-5d transition in Y2SiO5 weremeasured in order to investigate the possibility for using Ce as a sensor to detect the hyperfine stateof a spatially close-lying Pr or Eu ion. The experiments were carried out on Ce doped or Ce-Prco-doped single Y2SiO5 crystals. The homogeneous line width was measured to be about ∼ 3 MHz,which is essentially limited by the excited state lifetime. Based on the line width measurements,the oscillator strength, absorption cross section and saturation intensity were calculated to be about9×10−7, 5×10⁻¹⁹ m2 and 1×10⁷ W/m2, respectively. One projection of the difference in perma-nent dipole moment, 4µCe, between the ground and excited states of the Ce ion was measured as6.3× 10−30 C ·m, which is about 26 times as large as that of Pr ions. The measurements done onCe ions indicate that the Ce ion is a promising candidate to be used as a probe to read out a singlequbit ion state for the quantum computing using rare-earth ions.
PACS numbers: 33.70.Jg, 78.47.jh, 42.50.Md
I. INTRODUCTION
The quantum computing research field has attractedextensive interest for its potential to give a tremendousboost in computational ability for certain types ofproblems. Many physical systems have been investi-gated as test beds for quantum computing [1]: trappedions [2], nuclei in molecules [3], Josephson junctionsin superconductors [4], nitrogen vacancy centers indiamond [5], rare-earth ions in inorganic crystals [6], etc.Regardless of the physical system, one of the necessarycriteria for a quantum computing scheme is that itshould be scalable. In the rare-earth ion based quantumcomputing (REIQC) approach, qubit-qubit interactionand arbitrary qubit rotations characterised by quantumstate tomography have been carried out [7][8]. In theseexperiments each qubit, where the qubit states (|0>and |1> ) are two ground state hyperfine levels of theion, was represented by an ensemble of ions [8]. In therare-earth ion doped crystals the transition lines areinhomogeneously broadened as a result of the randomsubstitution of the rare-earth ions (qubit ions) in thesolid matrix, leading to slight crystal field variationsfor the sites of the individual ions. The ratio betweenthe inhomogeneous and homogeneous broadening inthese systems can be larger than 106. Thus a very
large number of sub-ensembles of ions, where eachsub-ensemble is selectively addressed in frequency space,can be singled out within the inhomogeneous line. Eachsub-ensemble can then act as a selectively addressedqubit. For two ions in different qubits, the permanentelectric dipole-dipole interaction is proportional to 1/r3,where r is the the distance between the two ions. Thisspatially dependent coupling determines the probability,p, of an ion in one qubit being sufficiently close toan ion in another qubit, where it is often p 1 forreasonable dopant concentrations. This means thatthe number of active ions in one ensemble qubit thatinteract strongly with one ion in each of the rest ofthe n − 1 qubits scales as pn−1. In order to improvethis poor scalability, Wesenberg et al. proposed severalschemes [9]. One approach is to discard the ensemblequbits and instead let each qubit be represented bya single ion (single instance quantum computing).With sufficient dopant concentration (about 0.2% forPr:Y2SiO5 ) there will always be sequences of connectedions close enough for carrying out gate operations [9][10].
However in this single instance quantum computingapproach a technique to read out the quantum state ofa single-ion qubit needs to be developed. The straight-forward typical fluorescence measurement for detecting a
arX
iv:1
303.
0877
v1 [
phys
ics.
atom
-ph]
4 M
ar 2
013

2
single molecule does not work because: firstly the tran-sitions of the qubit ion (In reference [8] this has been aPr ion) which can discriminate the qubit states have ex-cited state lifetimes of more than 10 µs, which providestoo low emission rate for a high signal to noise detection;secondly and more importantly, the qubit ion candidateshave more than one ground state hyperfine level to whichthey can decay, thus there is no transition that can becycled until the number of emitted photons is sufficientlylarge to provide state selective information. A single ionreadout idea was proposed in [9] to accomplish single-qubit ion detection: an additional ion (hereafter calledas readout ion) can be co-doped into the crystal, withsuch low concentration that there is only one readout ionfluorescing within the laser focal volume. This ion servesas a sensor for reading out the state of a nearby qubitthrough the interaction between the qubit and readoution, illustrated in Fig. 1. As a result the fluorescencesignal from the single readout ion, either ON or OFF,depends on whether the single qubit ion is in state |1>or in |0> [11], respectively.
|0>
|1>
Qubit ion
Eg. Pr
Readout
ion
|0>
|1>
|e>
Readout
ion
+
|e>
Qubit ion
Eg. Pr
FIG. 1: (color online) Permanent dipole-dipole interactionbetween a qubit ion and a readout ion that sits spatially closeto this qubit ion. Two lasers interact with the ions. Thequbit laser can send out pulses with pulse area of π on the |0〉→ |e〉 transition of the qubit ion (Pr) and the readout lasercontinuously excites the readout ion. If the Pr ion is in the |1〉state (figure on left panel), the qubit laser is not on resonancewith the Pr ion transition and the Pr ion is not transferredto its excited state. The readout laser is then resonant withthe readout ion transition and the readout ion continuouslysends out fluorescence photons. On the other hand, if the Prion is initially in the |0〉 state (figure on right panel), it will beexcited by the qubit laser pulse, since the permanent dipolemoment of Pr ion in state |e〉 is different from that in state |0〉,the change of this local electric field induces a frequency shiftof the nearby readout ion transition line. If the shift is largerthan the homogeneous line width, the readout ion will be outof resonance with the readout laser and the fluorescence isturned off.
The readout scheme above requires that the readoution has the following characteristics. (i) Short excitedstate lifetime compared to the qubit ion lifetime in orderto get a large number of fluorescence photons whilethe qubit is in the excited state. (ii) Narrow homoge-neous absorption line width such that the permanentdipole-dipole interaction with a nearby qubit shifts thereadout ion resonance frequency by several homogeneousline widths. (iii) Large dipole moment change betweenground and excited state (again such that the shift dueto the permanent dipole-dipole interaction is sufficientlylarge). (iv) No fluorescence quenching mechanisms, e.g.a long-lived trapping state or energy transfer from thereadout ion to the qubit ion. In this work the Ce ion(doped in an Y2SiO5 crystal) is considered as a readoution [12]. The Ce ion in Y2SiO5 has a short excitedstate lifetime of abut 50 ns [13][14], to be comparedwith an excited state lifetime of possible qubit ionsas e.g. Pr and Eu which are about 0.2 ms and 2 ms,respectively. The 4f-5d zero-phonon absorption line ofCe3+ doped in Y2SiO5 lies around 370.83 nm, whichis well separated from the qubit transition frequencies(e.g. 606 nm for Pr ions in site 1). However, other thanthe excited state lifetime, the spectroscopic parametersrelevant for the read out scheme are not known. In thisarticle, the second and third spectroscopic requirements,(ii) and (iii) above, for a readout ion were measured forthe Ce ion in an Y2SiO5 crystal. The inhomogeneouszero-phonon line (ZPL) measurement is described inSection II A, the homogeneous line width measurementis discussed in Section II B, and the measurement of theCe ground and excited state permanent dipole momentdifference (based on the Ce-Pr interaction) is describedin Section II C. The work is concluded in Section III.
2F5/2 |±5/2g>
|±1/2g>
|±5/2e>
|±3/2e>
|±1/2e>
|±3/2g> 4f
5/2g
(a) (b)
17.3 MHz
10.2 MHz
4.6 MHz
4.8 MHz
5d
2F7/2
fluorescence
~60 THz
ν0 ~ 475 THz
(606 nm)
~ 809 THz (371 nm)
FIG. 2: (color online)(a) Schematic level structure for the Ceion in an Y2SiO5 crystal. (b) Schematic level structure forthe Pr ion 3H4 → 1D2 transition in an Y2SiO5 crystal.
II. DETERMINATION OF SPECTROSCOPICPARAMETERS OF Ce IONS

3
We focused on the parameters that are of specialinterest to the single ion readout scheme in REIQC.
A. Zero-phonon line (ZPL) of Ce ions in anY2SiO5 crystal
The absorption line of interest is the 4f-5d transitionof Ce ions as illustrated in Fig. 2 (a). Since the 5d levelsare less shielded from the environment than the 4f levels,a 4f-5d transition are often largely broadened by the ex-ternal perturbations, for instance, defects in the crystalor electron-phonon coupling to the crystal lattice. Theexperiments were carried out at 2 K to greatly reduce thephonon broadening influence. In this and the followingexperiments, an external cavity diode laser in a Littrowconfiguration was used as an excitation source.
370.75 370.8 370.85 370.9 370.950
2
4
6
8
10
λ (nm)
α (
cm−
1 )
experimental dataGaussian fitting
FIG. 3: (color online) The inhomogeneous ZPL of Ce3+ (Site1) in an Y2SiO5 crystal. The line width is about 50 GHz. αis the absorption coefficient.
The inhomogeneous ZPL of Ce3+ was measured onan Y2SiO5 crystal with a nominal dopant concentrationof 0.088 at. % relative to the yttrium ions. The resultis shown in Fig. 3. Crosses are the experimental dataand the solid curve is a Gaussian fit. The measuredinhomogeneous line width is about 50 GHz (full widthat half maximum of the absorption coefficient) with theline center at 370.83 nm. No significant polarizationdependence was observed for the absorption. The fre-quency integrated absorption cross section was obtainedfrom Fig. 3 and further the oscillator strength of thetransition was calculated to be ∼ 9×10⁻⁷ by makinguse of the relation between them as shown in article[15]. The ZPL shown in Fig. 3 sits on a backgroundabsorption with α ' 3.6 cm−1, which most likelycomes from the absorption by Ce ions in site 2. Moreinformation about this is provided by a fluorescencespectrum with an online excitation (at 370.83 nm) andan offline exciation (at 371.53 nm), shown as the solid
and dashed curve in Fig. 4. The solid (dashed) curvematches reasonably well with the spectrum from a site 1(site 2) excitation, shown in [16][17]. However the solidcurve contains an extra shoulder sitting around 435 nm,the origin of which is unknown to us. In the rest of thearticle, all calculations refer to the ions in site 1, withthe site 2 contribution being subtracted as a background.
380 400 420 440 460 480 500 520 540 560 5800
1
2
3
4
5x 10
4
λ (nm)
Flu
ores
cen
ce in
ten
sity
(a.
u.)
371.53 nm excitation
370.83 nm excitation
FIG. 4: (color online) Fluorescence spectrum of the Ce3+ (inthe same crystal as used for Fig. 3) from 370.83 nm excitation(online of site 1) (solid line) and 371.53 nm excitation (offlineof site 1) (dashed line).
B. Homogeneous line width of the ZPL
The homogeneous line width was measured by in-tensity modulated saturation spectroscopy, where boththe pump and probe beams were generated from theexternal cavity diode laser by a beam splitter (70:30).Both beams were focused by a 200 mm focal length lens(focal diameter ∼ 85 µm) onto the Ce:Y2SiO5 crystal,which was immersed in liquid helium. The probe beampropagated at an angle of 3 degrees relative to thepump beam in order to separate the two beams for thedetection. Two Acousto Opical Modulators (AOMs)were used in series in the probe beam line to detunethe probe beam frequency within a ±15 MHz rangerelative to the pump beam frequency. The first oneprovided a +280 MHz frequency shift, and the secondone provided a -265 to -295 MHz frequency shift. Theprobe beam position movement caused by the AOMat different detuning frequencies was compensated byslightly adjusting the mirror in front of the cryostat tooverlap the two beams by maximizing the probe beamtransmission. The probe beam was monitored by aphotodiode after the cryostat. However, it is hard todirectly detect an increase of the transmitted powercaused by the saturation of the pump beam, since thetop-hat pump beam intensity is only of the level ofone percent of the estimated saturation intensity. Toimprove the signal to noise ratio, a chopper wheel was
4
used to produce an intensity modulation to both thepump and probe beam with modulation frequencies of302 Hz and 362 Hz, respectively. Due to the nonlinearinteraction, the transmitted probe beam not only hasthe primary frequency modulation but also has anintensity modulation at the sum (664 Hz) and differencefrequency (60 Hz). The signal strength at 664 Hz wasextracted from the Fourier transform of the transmittedpower of the probe beam and recorded as a function ofthe detuning frequencies between the pump and probebeams, 4f.
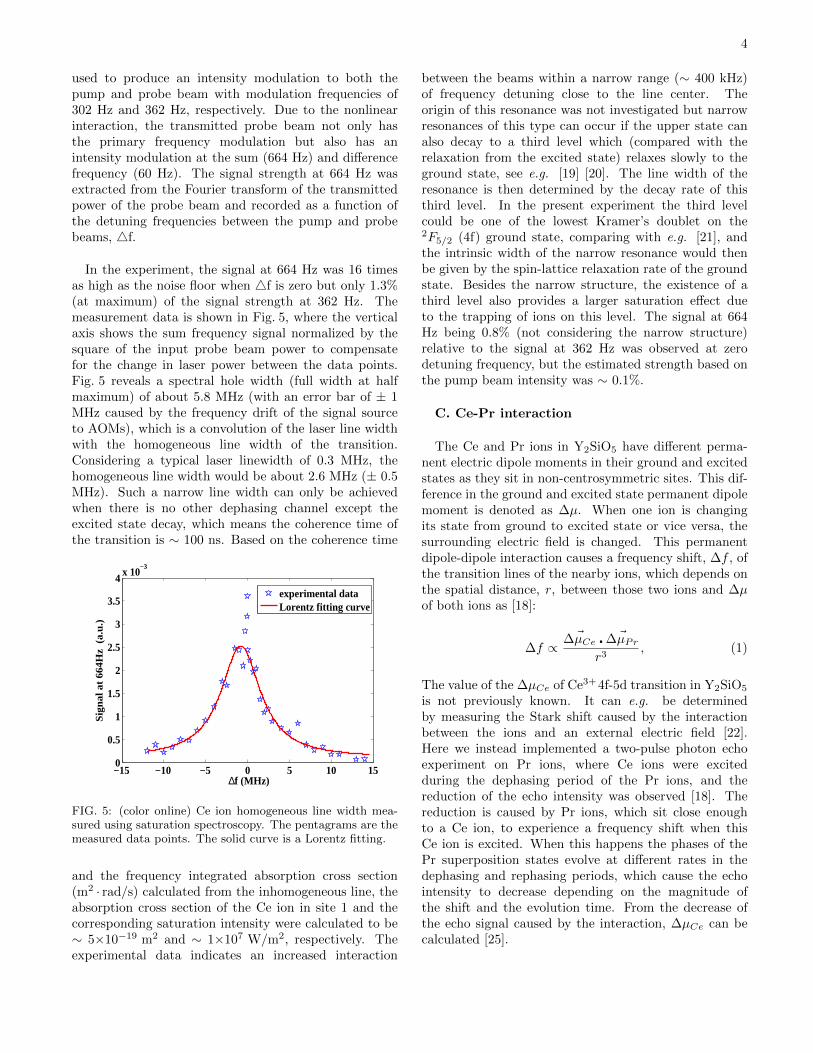
In the experiment, the signal at 664 Hz was 16 timesas high as the noise floor when 4f is zero but only 1.3%(at maximum) of the signal strength at 362 Hz. Themeasurement data is shown in Fig. 5, where the verticalaxis shows the sum frequency signal normalized by thesquare of the input probe beam power to compensatefor the change in laser power between the data points.Fig. 5 reveals a spectral hole width (full width at halfmaximum) of about 5.8 MHz (with an error bar of ± 1MHz caused by the frequency drift of the signal sourceto AOMs), which is a convolution of the laser line widthwith the homogeneous line width of the transition.Considering a typical laser linewidth of 0.3 MHz, thehomogeneous line width would be about 2.6 MHz (± 0.5MHz). Such a narrow line width can only be achievedwhen there is no other dephasing channel except theexcited state decay, which means the coherence time ofthe transition is ∼ 100 ns. Based on the coherence time
−15 −10 −5 0 5 10 150
0.5
1
1.5
2
2.5
3
3.5
4x 10
−3
∆f (MHz)
Sig
na
l at
66
4H
z (
a.u
.)
experimental dataLorentz fitting curve
FIG. 5: (color online) Ce ion homogeneous line width mea-sured using saturation spectroscopy. The pentagrams are themeasured data points. The solid curve is a Lorentz fitting.
and the frequency integrated absorption cross section(m2 · rad/s) calculated from the inhomogeneous line, theabsorption cross section of the Ce ion in site 1 and thecorresponding saturation intensity were calculated to be∼ 5×10⁻¹⁹ m2 and ∼ 1×10⁷ W/m2, respectively. Theexperimental data indicates an increased interaction
between the beams within a narrow range (∼ 400 kHz)of frequency detuning close to the line center. Theorigin of this resonance was not investigated but narrowresonances of this type can occur if the upper state canalso decay to a third level which (compared with therelaxation from the excited state) relaxes slowly to theground state, see e.g. [19] [20]. The line width of theresonance is then determined by the decay rate of thisthird level. In the present experiment the third levelcould be one of the lowest Kramer’s doublet on the2F5/2 (4f) ground state, comparing with e.g. [21], andthe intrinsic width of the narrow resonance would thenbe given by the spin-lattice relaxation rate of the groundstate. Besides the narrow structure, the existence of athird level also provides a larger saturation effect dueto the trapping of ions on this level. The signal at 664Hz being 0.8% (not considering the narrow structure)relative to the signal at 362 Hz was observed at zerodetuning frequency, but the estimated strength based onthe pump beam intensity was ∼ 0.1%.
C. Ce-Pr interaction
The Ce and Pr ions in Y2SiO5 have different perma-nent electric dipole moments in their ground and excitedstates as they sit in non-centrosymmetric sites. This dif-ference in the ground and excited state permanent dipolemoment is denoted as ∆µ. When one ion is changingits state from ground to excited state or vice versa, thesurrounding electric field is changed. This permanentdipole-dipole interaction causes a frequency shift, ∆f , ofthe transition lines of the nearby ions, which depends onthe spatial distance, r, between those two ions and ∆µof both ions as [18]:
∆f ∝~∆µCe ~∆µPr
r3, (1)
The value of the ∆µCe of Ce3+4f-5d transition in Y2SiO5
is not previously known. It can e.g. be determinedby measuring the Stark shift caused by the interactionbetween the ions and an external electric field [22].Here we instead implemented a two-pulse photon echoexperiment on Pr ions, where Ce ions were excitedduring the dephasing period of the Pr ions, and thereduction of the echo intensity was observed [18]. Thereduction is caused by Pr ions, which sit close enoughto a Ce ion, to experience a frequency shift when thisCe ion is excited. When this happens the phases of thePr superposition states evolve at different rates in thedephasing and rephasing periods, which cause the echointensity to decrease depending on the magnitude ofthe shift and the evolution time. From the decrease ofthe echo signal caused by the interaction, ∆µCe can becalculated [25].

5
0
echo Pulse 1
Ce excitation pulse Pulse 2
t12 2t12
FIG. 6: (color online) Pulses sequence for the Ce-Pr interac-tion measurement.
In the experiment, two weak Gaussian pulses, createdby an AOM from a kHz line width 606 nm continuouswave dye laser, with 0.15 µs duration time (∼ 0.5mW power) were used to excite the Pr 3H4 →1 D2
transition. The Ce excitation pulse was created froman external cavity diode laser using another AOM. Thepulse sequence is shown in Fig. 6. Each laser beamwas coupled into a single mode fiber for the spatialmode cleaning, and the collimated output beams fromthe fibers were coupled together by a dichroic mirrorwith 90% transmission (reflection) for 606 nm (371nm). Those two beams were focused onto the crystalwith focal diameters about 130 µm and 170 µm bya low dispersion CaF2 lens, respectively. The spatialmode overlap between the two beams within the crystalwas ascertained by using a beam profiler to ensure thecenter of the two beam profiles overlapped with eachother within 10 µm over the 40 cm distance betweenthe dichroic mirror and the common focusing lens. Theecho intensity was diffracted by a third AOM into aphotomultiplier tube (PMT). Right before the PMTan electronic shutter with 100 µm rise time was usedto prevent the strong frequency scanning pulses whichcame after the echo signal going towards the PMT.The frequency scanning pulses were used to remove thepersistent spectral holes that would otherwise be createdby the two Gaussian pulses over time.
The echo intensity from the Pr ions was recorded asa function of the separation time, t12, between the twoexcitation pulses in two situations: Ce ions being excitedor not excited (Ce laser blocked) in between those twopulses. The excitation of Ce ions was implemented atwavelengths of either 370.83 nm (referred to as Onlineexciation hereafter) or 371.54 nm (referred to as Offlineexcitation). It should be noted that Offline excitation isonly offline for the Ce ions in site 1 as discussed in SectionII A. The experimental data on the Pr:Ce:Y2SiO5 crys-tal (grown by Shanghai Institute of Ceramics in China)with 0.05% of Pr and 0.088% of Ce dopant concentrationrelative to the Y ions, is shown in Fig. 7.
Four series of data were recorded. The circles are the echosignals from the Pr ions when Ce ions was excited On-line (excitation power ∼ 0.5 mW) within time t12. Eachpoint is an average value of ∼ 30 shots, and the error barshows the standard deviation. To verify the experimen-
0 10 20 30 40 50−9
−8.5
−8
−7.5
t12
(µs)
log 1
0(Ech
o A
rea
) (
a.u
.)
OnlineOfflineblocked (Online)blocked (Offline)Online, fitOffline, fitblocked (Online), fitblocked (Offline), fit
FIG. 7: (color online) Decay curve of the echo from the Prions on the Pr:Ce:Y2SiO5 crystal. The circles (diamonds) arethe experimental echo signal when the Ce ions were excitedat an online (offline) wavelength. Error bar shows the stan-dard deviation. The solid, dashed lines are logarithmic fitscorresponding to those two cases. The stars (crosses) are theexperimental data when the Ce excitation laser was blocked.The difference between them is explained in the text.
tal data, a complimentary data point corresponding toeach circle, shown as the stars, was recorded as well withthe Ce excitation laser being blocked. At each t12, allshots of the circle point were recorded first then followedby the shots of the star point. After recording all datapoints at various t12, the Ce laser was tuned to the Offlineposition. The corresponding set of data was recorded,shown by the diamonds (Ce laser Offline) and crosses(Ce laser blocked). The solid, dotted, dashed and dash-dotted lines are the logarithmic fit of the experimentaldata for the cases when the Ce laser is Online, blocked,Offline and blocked, respectively. The two blocked casesare equivalent, but recorded with an offset on the echosignal possibly caused by the laser power variation. How-ever, the slopes are the same within the margin of error,as expected. The echo intensity as a function of the pulseseparation time is
Iecho = I0 e−4t12/T2 , (2)
where I0 is the maximum echo intensity when extrapo-lating the separation time to zero. From the data thePr coherence times of 74 µs (±5 µs with 70% confidenceinterval, the same for the rest) and 107 µs for the Ce ionsbeing excited Online and not excited, respectively; 83 µsand 104 µs for the Ce ions being excited Offline and notexcited. The homogeneous line width broadening causedby the Ce Online (Offline) excitation, Γbr, is 1.2 kHz(0.7 kHz) with ±0.14 kHz for a 70% confidence interval,which means that the broadening contributing from theions in site 1 is 0.5 kHz. This value will be used forcalculating ∆µCe.

6
However the reduction in echo intensity could con-ceivably be caused by other reasons than a frequencyshift resulting from the permanent dipole-dipole inter-action. For instance, 1) the Pr ions directly absorb theultraviolet (UV) photons leading to processes shorteningthe coherence time, which causes the echo intensityto decrease, although this is unlikely to happen, seenfrom the literature [23]. 2) the energy is transferredfrom Ce ions to Pr ions so that Pr ions are excited toa higher level, which also can cause an echo reduction.To clarify the influence of suggestion 1) above we didexactly the same measurement as before but on anY2SiO5 crystal with the same Pr dopant concentrationbut no Ce ions. The result is shown in Fig. 8, where
0 5 10 15 20 25 30 35 40−11
−10
−9
−8
−7
−6
−5
t12
(µs)
log 10
(Ech
o A
rea)
(a.
u.)
Online
Offline
blocked (Online)
blocked (Offline)
Online, fit
Offline, fit
blocked (Online), fit
blocked (Offline), fit
FIG. 8: (color online) Echo decay curve on the pure Pr:YSOcrystal. Notation of the data symbols are the same as in Fig.7.Circles, diamonds, stars and crosses are for the cases whenthe Ce laser is Online, Offline, blocked (Online) and blocked(Offline), respectivley. Deviation of the first data point fromthe fitting line was caused by the saturation of the PMT.
the Pr homogeneous line widths are the same withand without Ce excitation, which means that the linewidth broadening shown in Fig. 7 does not result fromthe direct UV photon absorption by the Pr ions. Forclarifying whether the interaction can be induced byenergy transfer (argument 2) above), we did an excitedstate population decay measurement on Pr ions in thePr:Ce:Y2SiO5 crystal as following: (i) A zero absorptionspectral window centered at frequency, ν0, was createdusing optical pumping [24]. (ii) A subset of Pr ionshaving their transition at frequency ν0 is transferred tothe |±5/2g〉 state (The Pr ion level structure is shownin Fig. 2 (b)). (iii) A pulse with pulse area of π excitesthese ions to their |±5/2e〉 state with an efficiency ofmore than 85%. (iv) A Ce excitation pulse with durationtime, T, was incident on the crystal. If there are Ce-Prenergy transfer or other state changing interactions (notonly frequency shifts due to the permanent dipole-dipoleinteraction) the Pr excited state population shouldchange. (v) After the time, T, the transmission ofa pulse scanned in frequency around frequency ν0
(see Fig. 2 (b)) determines the population differencebetween the |±5/2g〉 and |±5/2e〉 state by measuringthe absorption (this pulse is called the readout pulse inthe following passage). Following the procedure abovethe Pr population difference (normalized to the initialpopulation in |±5/2g〉 state) between the excited andground state, Ne−Ng, was recorded as a function of theseparation time, T, between the π pulse and the readoutpulse for the two cases where Ce ions were excited ornot excited during the time T.
Fig. 9 shows that the population differences of Prions when Ce ions excited (Online) and not excited(blocked) agree with each other within 3%. Similarmeasurements from the Ce Offline excitation and Celaser blocked cases also show the same result. Thusno effect of energy transfer between the Ce and Prions was observed. Based on the test on the pure Prdoped crystal (Fig. 8) and this excited state populationdecay measurement of Pr ion (Fig. 9), to the best ofour knowledge, the homogeneous broadening shown inFig. 7 should be caused by the permanent dipole-dipoleinteraction between the Pr and Ce ions.
0 50 100 150 200 250−0.6
−0.4
−0.2
0
0.2
0.4
0.6
0.8
T (us)
Ne−
Ng
OnlineblockedOnline fitblocked fit
FIG. 9: (color online) Population difference between the ex-cited and ground state on the co-doped crystal with Ce Onlineexcitation (+) and Ce laser blocked (©) as a function of time.The dashed and dot-dashed lines are the respective exponen-tial curve fittings. The standard deviation of the data pointsis v 2%.
The homogeneous line width broadening induced bythe permanent dipole-dipole interaction, Γbr, relates tothe ∆µ of the interacting ions in the following [25]:
Γbr =1
2πCD0〈WCe〉 (3)
where
C =2
3π2p〈|κ|〉Ω (4)

7
p represents the occupation probability of the Ce ionsrelative to the total number of ions in the crystal.〈|κ|〉Ω is of the order of one [18], representing theaveraged value of κ over all angles, Ω, where κ standsfor the dipole orientation dependence of the interactionκ = ( ˆ∆µCe · ˆ∆µPr) − 3(r · ˆ∆µCe)(r · ˆ∆µPr). ∆µ and rare the unit vectors for the permanent dipoles momentchange and the displacement, respectively.
D0 describes the magnitude of the permanent dipole-dipole interaction with a unit distance of r0,
D0 = η (0)~∆µCe · ~∆µPr
4πε0r30
(5)
where ~∆µCe and ~∆µPr is the difference of the permanentdipole moment in the ground and excited state of Ceand Pr ions, respectively. η(0) = 1.28 representing thedielectric correction factor for long range dipole-dipoleinteraction [26]. ε0 is the vacuum permittivity. r0
stands for the length of the cube which one ion occupieson average. 〈WCe〉 represents the average excitationprobability of the Ce ions contributing to the interactionduring the dephasing time.
For the crystal used in this experiment, p ' 1.92×10⁻⁴
considering a 87% occupation on site 1 [27].〈WCe〉 ' 2.8 × 10⁻⁷, which is estimated from thesaturation intensity (shown in section II B) and in-tegrated over the inhomogeneous line as in [25]. Theexcitation intensity used for the estimation is the averagevalue over a volume with the beam radius of ρhwhm, thehalf width at half maximum of the Pr excitation laserintensity, through the crystal thickness of 1 mm. Theprojection of ~∆µCe (site 1) onto ~∆µPr is calculated as6.3 × 10−30 C ·m using Eq. (3), (4) and (5) with r0 =0.237 nm, 〈|κ|〉Ω ' 0.7 and ∆µPr = 2.43 × 10⁻³¹ C ·m[25]. It is about 26 times as large as ∆µPr. We alsocalculated 〈WCe〉 from the ratio of the number ofabsorbed photons (equivalently excited Ce ions) during50 ns over the total number of Ce ions in site 1 for acertain volume (given by the laser beam profile). Thevalue is 2.3× 10⁻⁷, which agrees with the previous valuewithin 20%.
This is an encouraging result indicating that a Prion which sits 10 nm (average ion-ion distance with adopant concentration of 0.05%) away from a Ce ion insite 1 would shift the Ce transition frequency about25 MHz once it is excited. This would clearly shiftthe Ce ion in site 1 out of resonance with the readoutlaser which is initially on resonance. However, thereadout laser is still on resonance with the Ce ions insite 2 within the laser excitation volume since theseions are not excited at their zero-phonon line and the
absorption spectrum is broader than the permanentdiople-dipole interaction induced shift. This will giveus a background fluoresence even when the single Ceion in site 1 is shifted out of resonance, which willdecrease the ON/OFF fluorescence contrast. Howeverbased on our preliminary investigation on the singleCe ion (site 1) detection, the fluorescence emittingfrom the Ce ions in site 1 can still be used as an indi-cator to show which state (|0〉 or |1〉) the Pr ion occupies.
III. CONCLUSION
The spectroscopic properties of Ce3+ doped in anY2SiO5 crystal were characterized for investigatingthe possibility to use it as a probe for detecting whichhyperfine ground state a nearby ion (e.g. Pr) is occu-pying. Particularly (i) the ZPL of the 4f-5d transitionof Ce3+ doped in Y2SiO5 was found around 370.83 nmwith a line width of 50 GHz. (ii) The homogeneous linewidth was measured by intensity modulated saturationspectroscopy to be ∼ 3 MHz. It is essentially limited bythe excited state lifetime for the Ce3+ 4f-5d transition,which is the optimal case for using Ce3+ as a readout ion.In this experiment we also have not observed any signsthat there is a long-lived trapping state for the Ce ion,which means that the fluorescence can be cycled as manytimes as is needed. From the line width measurementsthe oscillator strength, absorption cross section andsaturation intensity were calculated to be v 9×10⁻⁷,v 5×10⁻¹⁹ m2 and v 1×10⁷ W/m2, respectively. (iii)The difference in the permanent dipole moment forthe 4f (2F5/2) and lowest 5d states was measured andthe Ce-Pr interaction was also demonstrated through aphoton echo experiment. The projection of ~∆µCe onto~∆µPr was measured to be v 6.3×10⁻³⁰ C · m which
is about 26 times of ∆µPr for the Pr ion 3H4 →1 D2
transition. The data obtained so far shows that the Ceion is a very promising readout ion candidate and aset-up for single Ce ion detection by observing the 5d-4ffluorescence is currently under construction. Single Ceion detection in a YAG (Y2Al5O12 ) crystal was recentlydemonstrated [28]. The ability of state selective readoutof a single rare-earth ion in inorganic crystals would bea significant step forward for quantum computing inthese materials where high fidelity gate operations onensembles have already been carried out [7][8]. It alsoopens the possibility to use rare-earth ions as extraordi-narily sensitive probes of the local environment in thesetypes of crystals. The ability to carry out (and read out)operations on individual ions would strongly addressthe scalability problem and greatly reduce the qubitoperation time since fewer and simpler pulses can beused when the dephasing caused by the inhomogeneousbroadening is no longer a concern. It is also quiteclear that rare-earth ion doped crystals generally haveexcellent properties for preserving quantum states seen

8
from the impressive quantum memory development thatis taking place in these materials [29][30][31].
Acknowledgement
We thank Prof. Marco Betinelli for the helpful discus-sion. This work was supported by the Swedish ResearchCouncil (VR), the Knut and Alice Wallenberg Founda-tion (KAW), the Maja och Erik Lindqvists forskningss-tiftelse, the Crafoord Foundation and the EC FP7 Con-tract No. 247743 (QuRep), (Marie Curie Action) REAgrant agreement no. 287252 (CIPRIS), Lund Laser Cen-ter (LLC) and the Nanometer Structure Consortium atLund University (nmC@LU).
[1] T. D. Ladd, F. Jelezko, R. Laflamme, Y. Nakamura, C.Monroe, and J. L. OBrien, Nature 464, 08812 (2010).
[2] R. Blatt and D. Wineland, Nature 453, 1008 (2008).[3] J. A. Jones, Prog. NMR Spectrosc. 59, 91 (2011).[4] J. H. Plantenberg, P. C. de Groot, C. J. P. M. Harmans1
and J. E. Mooij, Nature 447, 836 (2007).[5] A. P. Nizovtsev, S. Ya. Kilin, F. Jelezko, T. Gaebal, I.
Popa, A. Gruber, and J. Wrachtrup, Opt. Spectrosc. 99,233 (2005).
[6] N. Ohlsson, R. K. Mohan and S. Kroll, Opt. Commun.201, 71 (2002).
[7] J. J. Longdell and M. J. Sellars, Phys. Rev. A. 69, 032307(2004).
[8] L. Rippe, B. Julsgaard, A. Walther, Y. Ying, and S.Kroll, Phys. Rev. A. 77, 022307 (2008).
[9] J. H. Wesenberg, K. Mølmer, L. Rippe and S. Kroll,Phys. Rev. A 75, 012304 (2007).
[10] S. Bengtsson, Simulation and modeling of Rare earth ionbased quantum gate operations, Master thesis, Lund Uni-versity, Sweden (2012).
[11] A. Walther, B. Julsgaard, L. Rippe, Y. Ying, S. Kroll, RFisher and S Glaser, Phys. Scr. T137, 014009 (2009).
[12] Suggested by Olivier Guillot-Noel in the European Quan-tum Information Processing and Computing workshop,Rome, 2004.
[13] T. Aitasalo, J. Hlsa, M. Lastusaari, J. Legendziewicz, J.Niittykoski, and F. Pell, Opt. Materials 26, 107 (2004).
[14] J. E. Hernandez, Master thesis, Lund University, Sweden(2006).
[15] R. C. Hilborn, Am. J. Phys. 50, 982 (1982).[16] W. Drozdowski, A. J. Wojtowicz, D. Wisniewski, P.
Szupryczynski, S. Janus, J. Lefaucheur and Z. Gou, J.Alloy. Compd. 380, 146 (2004).
[17] H. Suzuki, T. A. Tombrello, C. L. Melcher and J.S.Schweitzer, Nucl. Instr. and Meth. A 320, 263 (1992).
[18] S. B. Altner, G. Zumofen, U. P. Wild and M. Mitsunaga,Phys. Rev. B 54, 17493 (1996).
[19] D. G. Steel and S. C. Rand, Phys. Rev. Lett. 55, 2285(1985).
[20] M. Mitsunaga, N. Uesugi and K. Sugiyama, Opt. Lett.18, 1256 (1993).
[21] R. Kolesov, Phys. Rev. A 76, 043831 (2007).[22] F. R. Graf, A. Renn, and U. P. Wild, Phys. Rev. B 55,
11225 (1997).
[23] N. V. Kuleshov, V. G. Shcherbitsky, A. A. Lagatskya, V.P. Mikhailov, B.I. Minkov, T. Danger, T. Sandrock, andG. Huber, J. of Lumin. 71, 27 (1997).
[24] M. Nilsson, L. Rippe, S. Kroll, R. Klieber and D. Suter,Phys. Rev. B 70, 214116 (2004).
[25] F. R. Graf, A. Renn, G. Zumofen, and U. P. Wild, Phys.Rev. B 58, 5462 (1998).
[26] G. D. Mahan, Phys. Rev. 153, 983 (1967).[27] Y. C. Sun, in Spectroscopic Properties of Rare Earths in
Optical Materials, Chapter 7, edited by G. Liu and B.Jacquier, Springer, Berlin (2005).
[28] R. Kolesov, K. Xia, R. Reuter, R. Stohr, T. Inal, P. Siyu-shev, and J. Wrachtrup, arXiv. org, arXiv: physics /1301.5215 (2013).
[29] M. P. Hedges, J. J. Longdell, Y. M. Li and M. J. Sellars,Nature 465, 1052 (2010).
[30] E. Saglamyurek, N. Sinclair, J. Jin, J. A. Slater, D.Oblak, F. Bussieres, M. George, R. Ricken, W. Sohlerand W. Tittel, Nature 469, 512 (2011).
[31] I. Usmani, Ch. Clasusen, F. Bussieres, N. Sangouard, M.Afzelius and N. Gisin. Nature Photonics 6, 234 (2012).