children's knowledge and understanding of basic number facts
TRANSCRIPT

Edith Cowan University Edith Cowan University
Research Online Research Online
ECU Publications Pre. 2011
1995
Children's knowledge and understanding of basic number facts Children's knowledge and understanding of basic number facts
Jack Bana
Richard Korbosky
Follow this and additional works at: https://ro.ecu.edu.au/ecuworks
Part of the Science and Mathematics Education Commons
Bana, J., & Korbosky, R. (1995). Children's knowledge and understanding of basic number facts. Perth, Australia: Mathematics, Science & Technology Education Centre, Edith Cowan University. This Book is posted at Research Online. https://ro.ecu.edu.au/ecuworks/6744

Edith Cowan University
Copyright Warning
You may print or download ONE copy of this document for the purpose
of your own research or study.
The University does not authorize you to copy, communicate or
otherwise make available electronically to any other person any
copyright material contained on this site.
You are reminded of the following:
Copyright owners are entitled to take legal action against persons
who infringe their copyright.
A reproduction of material that is protected by copyright may be a
copyright infringement.
A court may impose penalties and award damages in relation to
offences and infringements relating to copyright material. Higher
penalties may apply, and higher damages may be awarded, for
offences and infringements involving the conversion of material
into digital or electronic form.

Children•s Knowledge and Understanding of Basic Number Facts
/
Jack Bana
Richard Korbosky
MASTEC Monograph Series No. 2

Published by
MASTEC- Mathematics, Science & Technology Education Centre
Edith Cowan University
Perth, Western Australia
ISBN 0-7298-0212-4
ISSN 1324-3551
Cover Design
Peter Browne
Design and Desktop Publishing
Jan Herrington & Russell Miller
Acknowledgments
We wish to express our thanks to the following:
Edith Cowan University for financial support given through the Faculty of Education
Research and Development Committee.
Pender Pedler for reviewing the manuscript.
Paul Swan for assisting with the data analysis, and
the graduate assistants who supported us in the data-gathering phase.
© Copyright MASTEC, 1995
11

Table of Contents
CHAPTER ONE Background to the Study .................................................................... 1
Context of the Study ................................................................................................... 1
Purpose of the Study .......... , ........................................................................................ 5
CHAPTER TWO Design of the Study ............................................................................ 9
The Sample ............................................................................................................... 9
The Instruments ....................................................................................................... 1 o Data Collection ......................................................................................................... 13
CHAPTER THREE Analysis of Results ........................................................................ 1 5
First Research Question ............................................................................................ 15
Second Research Question ........................................................................................ 20
Third Research Question ............................................................................................ 21
Fourth Research Question .......................................................................................... 22
Fifth Research Question ............................................................................................ 29
Sixth Research Question ........................................................................................... 36
CHAPTER FOUR Conclusions and Recommendations ................................................ 39
Discussion of Results ................................................................................................ 39
Implications for Research ........................................................................................... 41
Recommendations for Teaching ................................................................................... 41
References .................................................................................... : .......................... 43
Appendix 1 Data Collection Protocols and Instruments ............................................... .4 7
Basic Number Facts Project: Protocols for Individual Interviews ........................................ 47
Basic Number Facts Project: Data Collection Sheets ....................................................... 52
Appendix 2 Strategies Used for Division and Subtraction ............................................. 55
Strategies Used for Division ........................................................................................ 55
Strategies Used for Subtraction ................................................................................... 60
Appendix 3 Independent Variables and Automatic Recall. ............................................ 63
Appendix 4 Independent Variables and Application of Automatic Recall. ....................... 67
Appendix 5 Independent Variables and Understanding Basic Facts ............................... 69
Appendix 6 Relationships Between Dependent Variables ........................................... 71
111

CHAPTER ONE
Background to the Study
Automatic recall of all the basic number facts is a major objective in primary school mathematics. This is an objective that is not easily attained. Many students have problems acquiring the skills which lead to correct and immediate responses (automatic recall) for all the basic number facts. Knowledge of the basic number facts is essential for undertaking all computation efficiently. These basic facts are defined as 0 + 0 to 9 + 9 for addition and their subtractive opposites; and 0 x 0 to 9 x 9 for multiplication and their inverses in division. This is a total of 390 facts which must be learned, but the scope of the task can be reduced by an understanding of basic properties such as commutativity, and the properties of zero and one.
Context of the Study
It is often asserted by teachers, parents and the community generally that children "do not know their number combinations well enough". That is, that they do not have sufficient knowledge of, and automatic recall of the basic number facts. However, the evidence is largely anecdotal with little in the way of comprehensive supporting data. It seemed that an extensive study should be undertaken to check this and, at the same time, try to determine some of the factors that affect automatic response, whether children can apply their skill of automatic response to real life situations, and whether or not they understand these basic number facts. This study should provide valuable information for education systems, for both pre- and post-service mathematics education programs, and for teachers implementing mathematics curricula.· It should also establish some useful benchmarks for researchers.
Importance of Basic Number Facts
The importance of a sound knowledge and understanding of basic number facts for all computations is universally recognised. Major mathematics curriculum statements such as the Cockcroft Report (1982), An Agenda for Action (NCTM, 1980), Curriculum and Evaluation Standards for School Mathematics (NCTM, 1989), and A National Statement on Mathematics for Australian Schools (Australian Education Council & Curriculum Corporation, 1991) stress this importance.

21 Basic Number Facts in Years 3-7
Mathematics educators see basic number fact knowledge as being essential for all work involving number. "The foundations of flexible mental calculation are the addition and multiplication bonds, together with a good grasp of place value. Children still need to know the number bonds for addition and multiplication to 9 x 9, so that these can be efficiently used when they are needed in a calculation, without diverting too much attention from the actual problem in hand" (Shuard, 1986, p. 113). Children who do not have automatic recall of basic facts often rely on strategies such as counting on or counting down. These strategies work for them with simpl~ combinations such as 8 + 5 or 13 - 5, but are very inefficient for tasks where the addition and subtraction involves larger numbers beyond the basic facts.
Review of the Research
Mathematics education research in this area has tended to focus on the development of thinking strategies as a vehicle for building up mastery of the basic number facts. Much of this research has concentrated m students of Years (grades) K-3 in an effort to discover the informal childinvented strategies which can be used to give teachers insights into how to best teach the basic number facts. Also, most of these studies investigated addition and subtraction but not multiplication and division. It seems that little attention has been devoted to determining levels of knowledge in Years 3-7 and other variables such as class size, school type, school size, gender, home language and family size which might affect such competency.
In the early part of this century rote learning methods were the norm for dealing with basic number facts. This was influenced chiefly by Thorndike (1921) with his "drill" theory. This approach was refuted by Brownell (1935) with a "meaning" theory. Brownell and Chazal (1935) found that even when drill methods were used exclusively the majority of children in a Year 3 study used their own methods to determine basic number facts. Interest in researching the acquisition of basic number fact knowledge was "rediscovered in the late 1960s and early 1970s when information processing explanations often using reaction time (RT) measures became popular" (Vakali, 1985, p. 106).
One of the basic assumptions underlying much current research is that children actively construct meaning out of knowledge presented or experiences encountered (Bodner, 1986; Confrey, 1986; Pines & West, 1986; Cobb, 1994). Although instruction clearly affects what children learn, it does not determine it entirely because· children interpret knowledge and assimilate it in the light of their own mental framework (Romberg & Carpenter, 1986). There is a growing body of research which indicates that children invent a great deal of their own mathematics. Some interesting examples of children's invented knowledge come from

Background to the Study 13
basic number fact research on children's addition and subtraction strategies (Carpenter & Moser, 1984) and studies of multiplication and division strategies (Mulligan, 1992).
Many researchers (Allardyce & Ginsberg, 1983; Ashcraft, 1985a; Carpenter, 1980; Carpenter & Moser, 1984; Thornton, Toohey & Jones, 1986; Thornton & Smith, 1988) have investigated mental processes in arithmetic, particularly in the area of addition and subtraction for basic number facts. Much of this research (Baroody, 1989; Svenson & Hendenborg, 1980; Svenson & Sjoberg, 1983) has been done with younger children in grades K-3 because "mastery of basic addition and subtraction facts is often not achieved until third grade or even later (age 8+)" (Baroody, 1985, p. 86).· Ashcraft, Hamann and Fierman (1981) studied children in grades 1-5 and found that grade 3 appears to be a transitional stage with respect to addition processing. It appears that grade 3 students are moving toward greater dependence on automatic recall and are thus retrieving information from long term memory rather than reconstructing knowledge from working memory (Ashcraft, 1982). It should be noted that grade 3 in the above USA context is almost equivalent to Year 4 in Western Australian schools.
Svenson and Sjoberg (1983) describe the two recall processes as "reproductive" and "reconstructive". The first type of process labelled "reproductive" refers to situations where the answer is retrieved from long term memory without any substantial reaction time or conscious thought processes. In the second recall process labelled "reconstructive" the answer is reached through a series of mental manipulations in working memory space. Other researchers such as Groen and Parkman (1972), Svenson (1975), Ashcraft and Hamann (1982), Ashcraft (1985a, 1985b) have also employed chronometric analysis to record retrieval times and hypothesise models for addition problems in the form of a + b = ?. "At the earliest stages, children count when they do addition in their heads, and seem to do so by adding on the smaller addend or min to the larger number. They require nearly 3 seconds on average for even the simple facts up through 4 + 5 = 9" (Ashcraft, Hamann & Fierman, 1981, p. 4).
Ashcraft, Hamann and Fierman (1981) report that there is a regular increase in reaction time as the numerical size of a problem increases. Children continue to employ counting-based procedures in addition until the mental process shifts to fact retrieval. By about age 10 and probably earlier, mental addition has not only shifted from a memory-based retrieval process, it has also become a largely automatic process and this shift from counting to memory retrieval is virtually completed in the fourth year of school (Ashcraft & Hamann, 1982). It therefore seems that older children have stored the simple arithmetic facts in memory and that they retrieve them from memory as needed. Ashfield (1989)

41 Basic Number Facts in Years 3-7
after studying individual interviews with 100 school-aged children aged from 7 to 18 suggested that counting strategies in solving simple addition and subtraction persist well beyond the infant stage. Apart from significantly slower response rates found with counting strategies, there is a question of accuracy. Of those answers employing counting strategies, 10 percent of the addition and 12 percent of the subtraction questions were answered incorrectly.
Kouba (1989) studied children's solution strategies for equivalent set multiplication and division word problems in Years 1-3. Previous studies indicated that the difference :iTI multiplication and division of children's method solutions were most easily observed when physical objects were used. The presence of these objects, however, did not preclude the children from using strategies based on recall or other mental processes. "The intuitive model that children appear to have for equivalent set multiplication is linked to the intuitive model for addition because both involve actions of building sets and then putting sets together. Multiplication, however, is much more complex than addition because for problems using whole numbers the children must recognise that one of the numbers given in the problem represents a set of equivalent sets" (Kouba, 1989, p. 156). It would seem logical that children who did not employ automatic recall for multiplication facts would therefore have increased response times because the simpler counting strategies employed in addition and subtraction do not exist for multiplication. Hence reaction times for the more difficult multiplication outside of multiplying by 0, 1 or 2 should be longer as the numbers become greater. This research also suggested that reaction times for division are greater than for addition and subtraction.
The development of thinking strategies is considered to be more effective than drill in facilitating learning, retention and transfer of basic number combinations. The past decade or so has seen an increased emphasis placed on researching children's thinking strategies (Loef, Carey, Carpenter & Fennema, 1988; Rathmell, 1978; Rathmell, 1981). Basic number facts situations and problems were used to investigate aspects of children's thinking, children's strategies, problem solving and algorithmic knowledge. A knowledge of solution strategies can encourage teachers to design instruction and build upon children's rich informal mathematics that they bring to instruction. Allardyce and Ginsburg (1983) found that using a reasoning method when teaching the number facts to lower-achieving students was extremely effective, while others students who attempted to learn number facts by rote and drill were unsuccessful.
Research into basic number facts has indicated that helping children develop thinking strategies is an important step between the

Background to the Study IS
development of concepts with materials and pictures and the mastery of facts with drill and practice (Suydam, 1984). These thinking strategies provide a way of structuring facts to help children relate sets of facts and help them develop more efficient and mature automatic methods (Thornton & Smith, 1988). Rathmell (1981) states that children should develop efficient ways to solve basic fact problems before they are expected to respond automatically. Such efficiency and automatic responses are essential prerequisites for the skills required for mental computation and estimation as promoted by Reys and Reys (1986).
When should students normally be expected to have automatic recall of all basic number facts? According to Baroody (1985), curriculum guides over-estimate how quickly children should learn basic number facts. For example, according to the Western Australian K-7 mathematics curriculum (Ministry of Education, 1989) it is assumed that all children should discover and experience all the basic facts of addition and subtraction in Stage 2 and be able to recall most of these by the end of Stage 3, where stages correspond to school years or grades for most students. They should discover and gain experience with all the basic multiplication and division facts through grouping and sharing (mostly in Stage 3) and be able to recall some simple facts. They should have developed automatic response for all basic number facts by the end of Year 5, according to that curriculum document. Whether a child could have developed such speed and accuracy by the age of 10 or 11 for a 11 basic number facts is questionable. "Such guidelines overlook the psychological evidence that mastery of basic addition and subtraction is not often achieved until third grade or even later" (Baroody 1985, p. 86). One should question these assumptions about the acquisition of automatic response to basic number facts. There seems to be ro comprehensive base-line data in Australia to support or refute the psychological evidence referred to above.
Purpose of the Study
The major purposes of this study were to assess the extent of children's automatic recall of basic number facts in the four operations over Years 3-7; to determine their ability to apply such automatic recall to real-life situations; to find their level of understanding and what strategies they used in subtraction and division facts; to determine any relationships between the above findings; and to investigate how these results are affected by school type, school size, class size, year level, age, gender, home language and family size.
Research Questions
The study attempted to answer the following six major research questions.

61 Basic Number Facts in Years 3-7
1. What is the level of automatic recall of the basic number facts for the four operations of students in Years 3-7?
2. To what extent do students in Years 3-7 apply their competence in automatic recall of basic number facts to real-life situations?
3. How well do students in Years 3-7 understand basic number facts in subtraction and division?
4. What mental and/ or pictori<!-1 strategies do students in Years 3-7 use to solve basic number facts in subtraction and division?
5. What are the effects of school type, school size, class size, year (grade) level, age, gender, family size and home language m automatic recall, understanding and application of basic number facts of Year 3-7 students?
6. What are the relationships between automatic recall, application, and understanding of basic number facts.
Definitions of Terms
The basic number facts were defined as {0 + 0, 0 + 1, 1 + 0, 1 + 1, ... ,1 9 + 9}
for addition and the associated subtraction facts; and {0 x 0, 0 x 1, 1 x 0, 1 x 1, ... , 9 x 9} for multiplication and the associated division facts. The total numbers of basic facts for addition, subtraction, multiplication and division are thus 100, 100, 100, and 90 respectively, not allowing for repetitions through commutativity.
Automatic recall of a basic number fact means the student can retrieve that fact from long term memory without any conscious mental processing. In order to ensure that the recall was automatic a threesecond time limit was imposed to give automatic recall an operational definition for the study. This limit was arrived at from the literature and from the pilot study that was conducted.
Family size was defined as the number of children in the family including half-brothers and half-sisters but not unrelated step brothers or step sisters.
Home language was categorised as being "Only English", "Mostly English" or "Mostly non-English" or "Only non-English" as defined by the student through questioning by the interviewer. ·

Background to the Study 17
Assumptions and Limitations
The ten basic number facts used in the study for each operation were a specially selected sample of the basic number facts rather than a randomly selected one. Therefore, the results were not entirely representative of an individual's performance over all the basic number facts. This was overcome to a certain degree by selecting from all the main types of basic number facts. The study involved a large sample of 390 subjects and, therefore, generalisations about performances on types of items such as facts associated with 0 and 1 could certainly be made. It was also assumed that, to a considerable extent, the results could be generalised across all the basic number facts.
The three-second response time limit that was allowed for children to answer each basic fact did not necessarily prevent a student from using reconstructive processes in addition and subtraction such as counting up or counting down. Whether a student actually used such processes was not documented during the interviews due to time constraints. The reconstructive processes, however, would diminish for larger numbers and for multiplication and division. Hence for some facts the threesecond limit did not necessarily ensure automatic recall, even though the student was able to answer the fact within the three seconds. Also, m
account was taken of students who responded correctly outside the time limit. Such responses were classified as failing to meet the criterion.
The test of ability to apply automatic recall of basic number facts to real life situations consisted of only four items - one for each operation. This small sample of items was overcome to some extent by the large sample of 390 students and by the fact that a variety of basic facts was used in each item.
It was assumed that if a student exhibited one valid strategy to solve or explain 13 - 5 = ? then understanding of this fact was demonstrated. The same principle was applied to the division fact 24 + 6 = ?. One item was chosen for each of the operations of subtraction and division with the notion that students could also use addition and subtraction to explain these facts. Thus, the generalisability of performance on these two items to all basic number facts was obviously rather limited. However, each student was encouraged to give alternative explanations, both written and verbal, to demonstrate understanding.
The use of only one item to check on the strategies used in each of the operations of subtraction and division meant that not all students' strategies would have been identified, since these can be idiosyncratic for particular items (Ashcraft, 1982; Mulligan, 1992). For example, a student could well use the double 6 + 6 = 12 to help solve 13 - 6 = ? but may not use such a strategy to help solve 13 - 5 = ? .

81 Basic Number Facts in Years 3-7
Since the study involved all 33 schools in a geographical and administrative region in the Perth Metropolitan area it was initially assumed results could be generalised across all schools in the Perth Metropolitan area as well as many schools throughout the state of Western Australia. However, it was found that the proportion of nongovernment school pupils in the sample (33 percent) was higher than the norm for Western Australia. Similarly, the percentage of students speaking a language other than English at home (30 percent) was higher than the norm. Thus, the degree of generalisability was subject to these constraints.

CHAPTER TWO
Design of the Study
This chapter describes the sampling procedures, the development and testing of the instruments used, the organisation and techniques of the data collection, and the methods used to code that data.
The Sample
Permission was obtained from the Western Australian state education authority, the Education Department, to undertake the research in a 11 government schools in a selected geographic and administrative region in the Perth Metropolitan area. This region was considered to be reasonably representative of all schools in the Perth Metropolitan area as a whole. A letter was written to the principals of all schools, both government and non-government in the region selected, inviting them to participate in the research project. A follow-up telephone call to each principal was made to explain the project and answer any possible queries. It transpired that all 33 schools in the district agreed to participate.
It was decided not to test students below Year 3 level since there would be limited development of basic number facts, particularly in multiplication and division, at these levels. Schools were asked to supply class lists for all classes containing Year 3-7 students. In singleyear classes from co-educational schools, one male and one female student were randomly selected. In single-gender schools, two students were randomly selected from such classes. From classes with two year levels, one student was randomly selected from each class. In the very few cases where there ·Were three year levels in one class, two students were chosen at random from any of two different classes. In mixed Year 2-3 classes only one student was selected at random from the Year 3 list. These stratified random sampling procedures ensured fair representation from each school, year level, and gender.
The details of selected students by school years and gender are shown in Table 1. The total sample size was 390, including 198 males and 192 females. There were 261 students from government schools and 129 from non-government schools.

10 I Basic Number Facts in Years 3-7
Table 1: Distribution of Subjects by Year (Grade) Level and Gender
Year Males Females Totals
3 36 43 79
4 44 37 81
5 41 37 78
6 36 38 74
7 41 37 78
Totals 198 1 92 390
The Instruments
In order to measure students' levels of automatic response to, or instant recall of the basic number facts in the four operations, the following procedures were carried out to select items for the instrument.
There are 90 different basic facts for division and 100 for each of the other operations if none of the basic properties such as commutativity are taken into account. It was decided to select 10 facts from each of the four operations using three criteria. Firstly, the ten facts were to be representative of the difficulty range for that operation. Secondly, if a number fact was selected for addition its commutative fact was not included. For example 3 + 4 = ? was selected so 4 + 3 = ? was not considered. This restriction was applied to all four operations. In division for example, the selection of 14 + 2 = ? ruled out 14 + 7 = ? . Thirdly, the numbers zero and/or one were used at least once in each of the four operations. For each operation the 10 facts were arranged in order of difficulty, based on the pilot study carried out. The 40 items are listed in Appendix 1.
The scope of the study was such that the number of items to measure application of automatic recall and level of understanding of basic facts were limited. Only one item was included for each operation to check whether or not students could apply automatic recall to a real situation. In order to control for different situations across the four operations, it was decided to use a shopping theme for all four questions - a theme considered to be the most familiar one for students at all Year 3-7 levels.
The use of only one item for each operation would provide little meaningful information if students failed on any item. Thus it was decided to use only basic facts for which students had already shown automatic response in the earlier part of the interview. This meant that the items would check whether or not students could apply basic facts already known. Since the ten basic facts for each operation were given in

Design of the Study 111
order of difficulty beginning with the simplest, based on the pilot study, it was decided that the last item attempted successfully in the automatic response test for each operation was to be used in the applications test. It was reasoned that this approach would ensure that the particular fact used for each operation was known and that it would be one of the most difficult facts attempted successfully on the earlier test component. If no facts were known on the test then the final practice item was to be used. All other words used in the four items remained constant, as shown in Appendix 1.
Due to the interview time constraints, only two items were selected to test students' understanding of basic number facts and determine strategies used to explain them. One item involving 13 - 5 = ? was chosen for subtraction to involve bridging ten. One item involving 24 + 6 = ? was selected for division. A relatively low dividend was chosen to enable younger students to cope with the item. Subtraction and division were chosen in preference to addition and multiplication since it was likely that such a choice would bring out strategies involving all four operations. Also, none of the 40 items used earlier were repeated in this segment. For each of these two items students who responded immediately to the fact were asked to explain it and/ or describe strategies that could be used to explain it. Those who did not respond immediately were asked to describe a strategy for solving it. In all cases the students were asked to give as many different strategies or explanations as they could.
The Pilot Study
A pilot study was conducted to refine the protocols and measuring instrument, to arrive at a definition of automatic response to basic number facts in terms of a time lapse, and to order the ten selected facts for each operation according to the difficulty level.
A sample of 30 children was drawn from Years 3-7 in three schools not used in the main study.. Teachers were asked to select students whom they considered to be average to above average in ability in the number strand of the mathematics program. This was to ensure sufficient data for a workable definition of automatic response. Using draft sets of protocols and a draft measuring instrument the two researchers each interviewed 15 students and recorded the interviews on audiotape. Each basic number fact item was presented both orally and visually at the same time.
Response times for each of the correct responses to the 40 basic number facts were timed from the audiotapes to the nearest hundredth of a second and recorded to the nearest tenth of a second. Any response that took over five seconds was not considered to be an automatic response for

121 Basic Number Facts in Years 3-7
the purposes of the pilot study and was treated as an incorrect response. The mean response times for the 40 items ranged from 1.1 to 2.5 seconds. The mean response time for the 40 items overall was 1.7 seconds with a standard deviation of 0.9 seconds. The results of the four applications items were treated in the same way. Here the mean time was 1.8 seconds with a standard deviation of 0.9 seconds. On the bases of these results and previous research the definition of automatic recall of basic number facts was set at three seconds for the main study.
The results of the pilot study enabled the ten items for each operation to be sequenced in the order of difficulty determined by the sample. This criterion was also used to sequence the four applications items, although no change of order was needed in this case. Further refinements to the interview protocols were also made as a result of the pilot study.
Training of Interviewers
On the basis of the pilot study the researchers interviewed three students using the revised instrument and protocols. One student was from Year 3, one from Year 4 and one from Year 5. All three interviews were videotaped. The two researchers developed a training programme for the research assistants who were to assist with the interviewing. The three-hour programme included viewing videotapes of the three interviews outlined above. The prospective interviewers including the researchers had to decide whether or not each of the 44 items (40 basic facts and 4 applications) satisfied the criterion of automatic response, which was defined as a correct response in three seconds or less. In conjunction with the video viewings a stopwatch was used to time the responses to the nearest hundredth of a second. These times were recorded to the nearest tenth of a second and used to assess the success of the trial.
The first trial's results showed that the percentage of items scored correctly ranged from 82 percent to 95 percent with a mean of 91 percent. The range from viewing the second videotape was 89-100 percent with a mean of 95 percent. The third viewing produced a range of 91-100 percent with a mean of 96 percent. The use of a stopwatch to time responses during an interview was considered to be too distracting. The use of a stopwatch with an audiotape was thought to be desirable but found to be very time consuming. The trials showed such a high percentage of reliability that it was decided that it would be sufficiently reliable for interviewers to make a judgement of three-second r.esponse times on the spot without a stopwatch.
In addition, the videotapes provided the interviewers with exemplars on how to follow the set protocols. The interview techniques were discussed and clarified to ensure a consistent approach. Using a set of

Design of the Study 113
flashcards for the 40 selected basic number facts, each interviewer was requiTed to undertake a trial interview with a peer and also with at least qne Year 3-7 student.
Data Collection
Once schools had agreed to participate in the study the interview schedules were arranged. The school principals were notified of these by letter and asked to make suitable facilities available so that the data collection could take place in a suitable room in the school; thus ensuring minimum disruption.
The Interviews
The first 40 basic number fact items were presented simultaneously on a flashcard and aurally. The next four items involving applications of basic number facts were only administered aurally. For the reasons already discussed above, only the final part of the interview was taperecorded. This was the third segment which investigated understanding of basic number facts. At each interview all information except that rn audiotape was recorded on the data sheet shown in Appendix 1.
As soon as practicable after each set of interviews the information from the audiotapes was transcribed onto the data sheets and integrated with the other non-verbal behaviours noted during the interviews.
Coding and Verifying the Data
The information collected from the schools and the students was a 11 entered onto the data sheets according to the set protocols and format. The first 44 test items were concerned with automatic recall of basic number £acts and each item was coded as either "1", for correct automatic recall, or "0". The high degree of agreement among the interviewers in the trials ensured that there would be sufficient reliability here.
For the section measuring understanding, the interviewers met to discuss the results and categorise what were considered to be valid explanations to demonstrate an understanding of the item 13 - 5 == 8. The set of different strategies used to explain the item are given in the next chapter. Any student who gave one or more of these explanations was coded as understanding the item. If a student pursued one or more of the given explanations but was unable to complete any one of these, then he or she was coded as showing partial understanding of this item. Otherwise the student was coded as having no understanding of this subtraction fact. Similar procedures were followed for the division item 24 + 6 := 4.
141 Basic Number Facts in Years 3-7
Each interviewer independently coded the two items as a result of this meeting and only after all strategies had been identified and categorised. The researchers then checked all 390 data sheets to ensure consistency and made adjustments where necessary. An independent observer then checked both audiotapes and corresponding data sheets for 20 subjects in each of the two items which tested understanding. In terms of the coded level of understanding and the identified strategies there was a 91 percent agreement between the independent observer's findings and the results on the data sheets. The Kuder-Richardson "Formula 20" showed a test reliability of 94 perce:Ht for the 40 basic facts item test and 90 percent for the four-item applications test.
All of the quantitative data was analysed using the statistical analysis software package Statview (1986). The results of both the quantitative and qualitative analyses are reported in the following chapter.

CHAPTER THREE
Analysis of Results
This chapter presents the main results of the study. A selection of the more interesting tables and graphs are included here. Further detailed descriptions, tables and figures are included in Appendices 2-6. Each of the research questions is examined in turn.
First Research Question
The first research question was as follows:
What is the level of automatic recall of the basic number facts for the four operations of students in Years 3-7?
To answer this question ten items were administered for each of the four operations. Each item was given either a score of one for automatic recall or a score of zero for non-recall within three seconds. The KuderRichardson "Formula 20" was used to estimate test reliability for the forty basic number fact items. The reliability coefficient was 0.94. Results will be discussed for each operation in turn, then for all four operations together.
Addition Facts
A graph of the results for the ten basic addition facts are presented in Figure 1. The items in the figure are in the order administered. This also applies to other graphs that follow. Scores ranged from 66 percent correct (automatic recall) for 7 + 6 = ? to 97 percent correct for 6 + 0 = ? with a mean of almost 86 percent. Eight of the items produced automatic recall from more than SO percent of students. Adding zero, one, or two proved to be the easiest items except in the case of 2 + 9 = ? where the reverse order produced a lower score than for 5 + 2 = ? . For the 'doubling' item 7 + 7 = ? the score was 88 percent. It seems that students found items involving doubling relatively easy. Note that the percentage correct for the similar item 7 + 6 = ? was only 66. In fact addition involving addends greater than two, except in the doubling case, proved to be the most difficult.

16 I Basic Number Facts in Years 3-7
(3 ~ .9 ..... 0 () .8 c
.7 0 ·e 0 .6 Q. 0 .....
0... .5 ---(f) .4 Q) ..... 0 (,) .3 (f)
c .2 ro Q)
~ .1
0
5+2 3+4 1+8 6+0 7+7 4+5 8+3 7+6 9+5 2+9
Figure 1: Automatic Recall of Ten Basic Addition Facts (n = 390)
Subtraction Facts
The results for the ten basic subtraction facts are graphed in Figure 2. Scores ranged from 54 percent for 13 - 4 = ? to 89 percent for 8 - 0 = ? with a mean of 70 percent. The two easiest items involved subtraction of zero and two. These results showed a similar trend to that for the addition items. The graph shows distinctly lower scores for all eight other items where numbers greater than two were being subtracted. It seems that not enough connections between addition and subtraction facts were being made by students. For example 96 percent scored 5 + 2 = ? correctly but only 72 percent were successful in the related subtraction fact 7- 5 = ?

t5 ~ .9 ..... 0 (.) .8 c
.7 0 "-E 0 .6 0.. 0 ....
0... .5
(J) .4 Q) ..... 0 (.) .3 (f)
c .2 ro Q)
~ .1
0
Analysis of Results 11 7
6-2 8-3 7-5 10-7 8-0 9-6 12-9 11-6 16-8 13-4
Figure 2: Automatic Recall of Ten Basic Subtraction Facts (n = 390)
The four most difficult items were those with a minuend greater than 10. In the example related to halving, 16 - 8 = ?, two thirds of the students were successful. However, this is much less than the 88 percent correct for the addition item involving doubling - again showing that connections between the two operations were not well established. However, this item related to halving was still much easier than the other three items with minuends greater than 10, where scores ranged from 54 to 57 percent.
Multiplication Facts
The results for the ten basic multiplication facts are graphed in Figure 3. The percentages correct ranged from 42 to 88 with a mean of 66 percent. The two easiest items were the one involving doubling, 2 x 3 = ?, and the one involving squaring, 5 x 5 = ?. However, in the former item other aspects such as small factors and product may well have been significant. Nevertheless the item 8 x 2 = ? also produced one of the higher scores.

181 Basic Number Facts in Years 3-7
5x5 Bx2 4x6 9x0 7x3 9x4 6x7 9X8
Automatic Recall of Ten Basic Multiplication Facts (n = 390)
An error of the type 9 x 0 = 9 is generally considered to be very common. However, 73 percent of students responded correctly in this case. Other than the particular types of items already discussed it seems that there was a close link between the size of the product and item difficulty. For example, scores fell from 75 percent for 3 x 4 = 12 to less than 42 percent for 9 x 8 = 72.
Division Facts
The results for the ten basic division facts are graphed in Figure 4. Performances ranged from 33 to 80 percent with a mean of 63 percent. Students scored quite well in both items where either the divisor or the quotient was one. However, the highest score was for the item 15 + 5 = ? which may be due to the fact that students find counting by tens and by fives relatively easy. As for multiplication facts, except for special cases, there seemed to be a close link between item difficulty and the size of the dividend. Percentage scores dropped from 77 for 9 + 3 = ? down to 33 percent for 48 + 8 = ? . A very notable exception in the list was a score of 67 percent for 36 + 6 = ?. This is possibly easier than other items for the same reason that students found squaring relatively easier in multiplication. In the case of 9 + 3 = ? it was likely that both the small numbers involved and the link to squaring were significant factors in determining the difficulty level. . ·

+-' ()
.9 ClJ t:: 0 0 .8 c .7 0 t 0 .6 0. e a.. .5
(j) .4 ClJ .... 0 () .3 (f)
c .2 ro ClJ
:::2: .1
0
Analysis of Results 119
6+6 9+3 14+2 15+5 20+4 8+1 28+7 36+6 48+8 63+9
Figure 4: Automatic Recall of Ten Basic Division Facts (n = 390)
All Basic Number Facts
The mean percentage scores for the ten basic number facts in each of the operations of addition, subtraction, multiplication and division were 86, 70, 66 and 63 percent respectively. These results confirm the generally accepted order of difficulty of the four operations.
Results for addition are markedly more superior than those for the other three operations. As discussed previously, students have not capitalised on the relationship between addition and subtraction. However,' only three percentage points separate multiplication and division. The language used for both operations provides a natural connection between these two operations, so this factor is likely to be a significant one. For example, the question "How many fives in 30?" would generally be answered as "six", "six fives", "six fives in thirty", or "six fives are thirty". Thus, the language used for multiplication and division facts tends to emphasise the inverse relationship between the two operations. No such obvious connection is to be found in the language used for addition and subtraction.
The effects of the independent variables, particularly year or grade level are also of considerable interest. However, these relationships are explored later in this chapter.

20 I Basic Number Facts in Years 3-7
Second Research Question
1 , t5 Q) .9 ..... 0 0 .8 c 0 .7 t 0 .6 0..
e 0... .5 ~
(/) .4 Q) ..... 0 u .3 (f)
c .2 <1l Q)
:2: .1
0
The second research question was as follows:
To what extent do students in Years 3-7 apply their competence in automatic recall of basic number facts to real-life situations?
The scope of the study necessitated a small sample of "application" items- only one for each of the four operations. However, the large student sample size of 390 helped C<?mpensate for this. Each item used a number fact already answered correctly by the student in the earlier part of the interview. Thus the items were designed to check whether students could apply the automatic responses already demonstrated outof-context mode to the real-life situations presented. Using the KuderRichardson "Formula 20" to estimate test reliability it was found that the reliability coefficient was 0.90.
Figure 5 graphs the proportions of students showing automatic recall for each application. Scores ranged from 72 to 91 percent with a mean of 81 percent. The same time limit of three seconds was in force for these items. Despite the significant amount of extra information to be processed students' scores did not show a marked drop. Mastery tests are normally based on a criterion level of 70-80 percent and the scores here were all above the lower limit, thus indicating an acceptable level of mastery.
Addition Applic. Subtraction Applic. Multiplication Appli Division Applic.
Figure 5: Applications of Automatic Recall (n = 390)

Analysis of Results I 21
The order of difficulty of the applications over the four operations showed similar trends to those for the 40 basic facts except that the differences were not as marked, and multiplication rather than division proved the most difficult. The use of a one-sentence item for division but two-sentence items for the other three operations may have had some effect here. The basic facts were known in all four cases so it was reasonable to expect little difference in performance when applying these facts. Yet a marked difference between addition and subtraction and the other two operations was still evident. It may be that, for example, a situation involving multiplication takes longer to process than one involving subtraction. However, it could also be that response times for basic multiplication · facts are generally slower than for subtraction facts even when both facts are known.
Third Research Question
The third research question was as follows:
How well do students in Years 3-7 understand basic number facts in subtraction and division?
Only two items were included to check for levels of understanding and strategies used, but this small sample was redressed somewhat by the large sample of 390 interviews and by the intense nature of each interview. The use of subtraction and division provided scope for students to use explanatory strategies from all four operations.
"Understanding" was rated on a three-point scale as Y for "understands", P for "partially understands", and N for "does not understand". Students were only rated Y if they used one or more of the explanatory strategies described in the following section of this chapter. The results are shown in Table 2 and Table 3.
Table 2: Levels of Understanding of Division 24 + 6 = 4
Level of Understanding Frequency Percentage
Yes 234 60
Partially 100 26
No 56 1 4
221 Basic Number Facts in Years 3-7
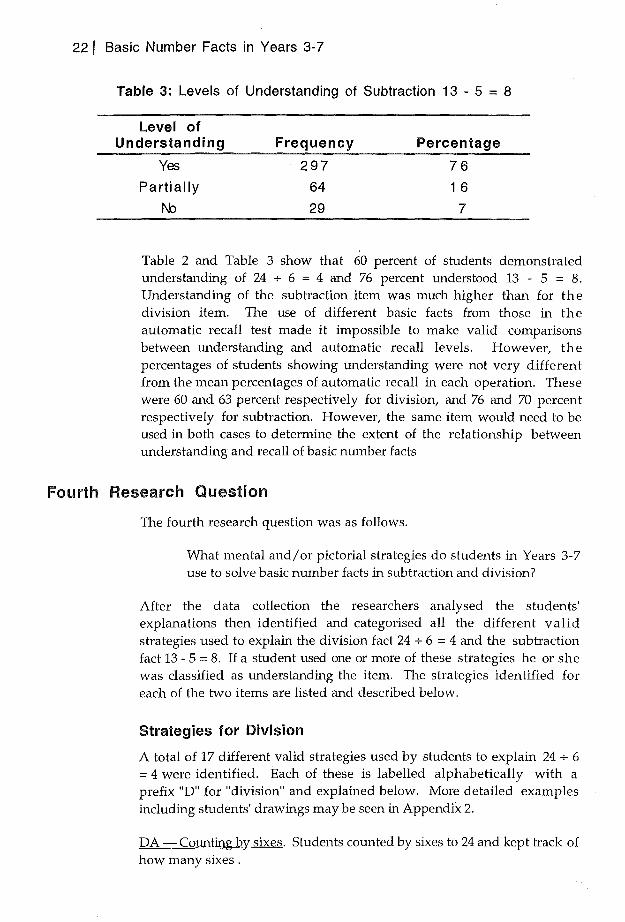
Table 3: Levels of Understanding of Subtraction 13 - 5 = 8
Level of Understanding Frequency Percentage
Yes 297 76
Partially 64 1 6
No 29 7
Table 2 and Table 3 show that 60 percent of students demonstrated understanding of 24 + 6 = 4 and 76 percent understood 13 - 5 = 8. Understanding of the subtraction item was much higher than for the division item. The use of different basic facts from those in the automatic recall test made it impossible to make valid comparisons between understanding and automatic recall levels. However, the percentages of students showing understanding were not very different from the mean percentages of automatic recall in each operation. These were 60 and 63 percent respectively for division, and 76 and 70 percent respectively for subtraction. However, the same item would need to be used in both cases to determine the extent of the relationship between understanding and recall of basic number facts
Fourth Research Question
The fourth research question was as follows.
What mental and/ or pictorial strategies do students in Years 3-7 use to solve basic number facts in subtraction and division?
After the data collection the researchers analysed the students' explanations then identified and categorised all the different valid strategies used to explain the division fact 24 + 6 = 4 and the subtraction fact 13- 5 = 8. If a student used one or more of these strategies he or she was classified as understanding the item. The strategies identified for each of the two items are listed and described below.
Strategies for Division
A total of 17 different valid strategies used by students to explain 24 + 6 = 4 were identified. Each of these is labelled alphabetically with a prefix "D" for "division" and explained below. More detailed examples including students' drawings may be seen in Appendix 2.
DA -Counting by sixes. Students counted by sixes to 24 and kept track of how many sixes .

Analysis of Results I 23
DB - Repeated addition. This was similar to type DA except that at least one of "plus", "add", or "and" was used to signify addition.
DC- Subtracting from a known fact. For example, one student said "five sixes is 30 so four sixes is six less- 24".
DD- Adding to a known fact. This was similar to type DC except that the student would begin with say 3 x 6 = 18 and add on six.
DE - Doubling with six. This strategy involved beginning with six, doubling then re-doubling to show that it took four sixes to get to 24.
DF- Doubling with four. This was similar to the DE type above except that at 16 eight would be added on to reason six fours and from this, four sixes.
DG - Repeated subtraction. Here students began with 24 and repeatedly subtracted six to get back to zero and thus show that there were four sixes.
DH- Finding the missing factor. Multiplication by six was carried out to find what number gave a product of 24.
DI - Finger counting. Counting of groups of six fingers was carried out and the number of groups needed to get to 24 was tallied with other fingers.
DJ -Real-life context. Students here would put the problem in a reallife context such as sharing out 24 chocolate bars among six people, and then proceed to describe the activity and the result.
DK - Drawing and grouping into sixes. Here 24 objects such as sticks would be drawn and then ringed in groups of six.
DL - Drawing four boundaries then six objects in each. The four boundaries were drawr{ then six objects were drawn in the first boundary and so on until four sets of six were shown.
DM - Drawing successive sets of six. This was similar to the DL strategy except that one set of six was drawn before depicting any other sets.
DN- Drawing six boundaries but using four. Six boundaries were drawn initially then six objects were sketched in the first set. This continued until there were four sets of six and two empty sets.

241 Basic Number Facts in Years 3-7
DO - Drawing six sets of four by partitioning. Six boundaries were drawn then one object was drawn in for each set in tum to show six sets of four. The student was able to explain that this was similar to four sixes.
DP - Drawing six successive sets of four. This was similar to the DO type except that each set of four was drawn before starting to illustrate the next set.
DO- Drawing an array in grid form. Here a 6 x 4 array of squares was drawn, as on grid paper, to explain t};le four sixes.
The frequency distribution of the above strategies across gender and year levels is shown in Table 4. The first eight strategies, DA to DH were mental or abstract strategies. The next two strategies, DI and OJ were classed as concrete or real-life strategies, while the final seven strategies, DK to DQ were pictorial or semi-concrete strategies. No materials were provided for the students so this factor ruled out most of the possible concrete strategies.

Analysis of Results I 25
Table 4: Frequency Distribution of Strategies for Division (24
Year Level and Gender
6 = 4) by
Strategy*
[)l\
DB ex;
DD
DE
DF
ffi
DH Dl
DJ
DK
DL
DM DN [l)
DP [Q.
3
2
4
1
1 1
2
9
1
2
4
1
4
2
2
2
1
1 4
3
9
1
6
2
Year (Grade)
5
6
1 5
6
2
1 8
6
1 1
9
6
5
8
2
2
7
1
2
2
1 4
6
20
1 0
3
1
7
4
1 6
3
5
2
2
4
1 9
7
22
6
3
2
3- 7
1 8
47
8
4
20
5
4
9
3
76
24
7 i
2
33
6
5
*Each strategy is described above in the text of this chapter.
Gender
M
1 0
2 1
6
2
1 5
3
3
5
0
2
32
1 7
24
2
1 7
5
3
F
8
26
2
2
5
2
1
4
44
7
47
0
1 6
1
2
The pictorial strategies DK and DM were the most popular - they were used by 76 and 71 students 'respectively. The abstract strategy DB was used 47 times. It is obvious from Table 4 that pictorial strategies were used much more than abstract ones. The most notable difference across year levels was that Ye·ar 3 students used far fewer strategies than other students. Only eight of the 17 strategies were used by Year 3 students who tended to use semi-concrete methods.
Table 4 shows marked gender differences for several of the strategies. The DM strategy was used by 47 females but by only 24 males. For the DL strategy the dominance was reversed since it was used by 17 males but only seven females. A similar difference was evident in strategy DE with 15 males and five females.
Strategy DA was used a total of 18 times. On four occasions it was used as the sole strategy while it was used together with one or more other strategies 14 times. However, most students used only one valid strategy

261 Basic Number Facts in Years 3-7
to explain 24 + 6 = 4. The only strategy grouping used more than six times was the DB-DM pair with a tally of 18. Other tallies above six were for strategies used alone as follows: DK (47), DM (33) and DO (18).
Table 5 below shows the frequencies of strategy groupings by gender. Most of the successful students used only one strategy. Of the 234 students who had valid strategies only ten used more than two different strategies. It may be that one successful explanation was considered to be sufficient by students. However, many students may have been unable to give other explanations.
Table 5: Number of Division Strategies Used Across Gender
Number of Strategies Used Males Females Totals
1 78 65 143
2 35 46 81
3 5 4 9
4 1 0 1
Totals: 11 9 1 1 5 234
Differences across home language categories were checked. The students whose home language was only English used 16 of the 17 strategies. Students in the "Mostly English" category used only nine, while those in the "Mostly Non-English" category used only ten different strategies. It may be that second-language students found it difficult to give several explanations of the division example because of English language difficulties rather than mathematical ones. However, the larger sample of the "Only English" would tend to generate a wider range of strategies.
Strategies for Subtraction
A total of 15 different valid strategies used by students to explain 13 - 5 = 8 were identified. Each of these is labelled alphabetically with a prefix "S" for "subtraction" and explained below. More detailed examples including students' drawings may be seen in Appendix 2.
SA -Subtracting from ten first. Students subtracted five from ten then added three.
SB -Convertingtenintotwofives. This was similar to SA except that ten was initially seen as two fives.

Analysis of Results 127
SC -Adding five and subtracting ten. As stated.
SD - Subtracting three then two. Here students used ten as a step in subtracting.
SE -Adding two before subtracting five then two. As stated.
SF -Counting down by ones from thirteen. This was done without using fingers as aids.
SG - Counting up by ones from eight. This was generally used to demonstrate that there must be eight left.
SH- Counting up by ones from five. This was similar to SG except that counting began with five.
SI- Calculating difference from a known fact. For example, one student said, "five from 14 is nine, so five from 13 is eight".
SI- Using fingers as objects. Here students used fingers and physically counted off.
SK- Counting down by ones with finger tally. This was the same as SF except that fingers were used to match with the count.
SL -Real-life context. Students here would put the problem in a reallife situation such as going to the shop with $13 and spending $8, and then proceed to describe the activity and the result.
SM - Drawing and crossing off objects. Students would draw say 13 sticks and cross off five, then count the remainder.
SN- Counting on by using tally marks. The student drew five tally marks then drew and counted on to 13 to get the result.
SO- Matching sets. ·A set of thirteen and a set of five objects were drawn and the sets matched by drawing lines to show there were eight objects left unmatched.
The frequency distribution of the above 15 strategies across year levels and gender is shown in Table 6. The first nine strategies, SA to SI were generally mental or abstract in nature. However, in strategies SG and SH some children used fingers to tally. Strategies SJ and SK were concrete in form, while the other four strategies could be described as semi-concrete or pictorial. As was the case for the division exercise, no materials were provided here to assist students, so this ruled out most of the possible concrete strategies that students might have used.

281 Basic Number Facts in Years 3-7
Table 6: Frequency Distribution of Strategies for Subtraction (13 - 5 = 8) by
Strategy*
&\
SB
~
SD
s:: SF
ffi
SH
81
SJ
SK
SL
SM
SN 3)
Year Level and Gender
Year (Grade) Gender
3 4 5 6 7 3 - 7 M F
5 6 7 8 5 3 1 1 7 1 4
- - 4 4 5 1 3 4 9
- - - - 1 1 1 0
5 6 7 1 0 9 37 24 1 3
1 2 - - 1 4 4 0
1 9 1 2 1 4 8 1 0 63 33 30
- 3 3 3 4 1 3 3 1 0
2 7 8 8 8 33 1 6 1 7
1 - 1 2 4 8 3 5
4 3 2 2 1 1 2 6 6
1 1 9 1 0 3 4 37 1 3 24
- 1 1 3 5 1 0 4 6
36 39 46 44 56 221 106 11 5
- - 1 - - 1 0 1
- - - - 3 3 1 2
*Each strategy is described above in the text of this chapter.
The most popular strategy by far was SM, used by 221 students. Students were encouraged to use paper and pencil to explain 13 - 5 and most students were able to picture subtraction as taking away by "crossing off" objects. Over one quarter of students used counting down to explain subtraction (SF or SK) but over a third of these still needed their fingers as concrete aids. However, the separation of these two groups was not entirely reliable. For example, if a student said that fingers were used or exhibited this action the strategy was categorised as SK, otherwise it was labelled SF. Nevertheless, it was apparent that some students used their fingers as aids by looking at each one in tum. In the cases of counting up, no distinction was attempted between those who used fingers and those who did not.
Across year levels it was generally the case that the higher the year the greater the variety of strategies used. Nine different strategies were used in Year 3 and fourteen in Year 7. Gender differences are apparent in several strategies. For example, SO was preferred by males but SK and SG were more popular with females.

Analysis of Results 129
Strategy SM was used as the sole strategy m 88 occasions. The only other strategies to be used alone more than six times were SA (10), SD (10) and SF (17). The SK strategy of counting down m the fingers was used by 37 students but, surprisingly it was never the sole strategy employed. The SM strategy was also used with other strategies as follows: SA-SM 14 times, SD-SM 16 times, SF-SM 26 times, and SH-SM 12 times. Table 7 shows the frequency of strategy groupings by gender. Of the 297 students who used valid strategies only 31 used more than two strategies. Almost half the students used only one strategy. No marked gender differences are evident in these results.
Table 7: Number of Subtraction Strategies Used Across Gender
Number of Strategies Used Males Females Totals
1 67 73 140
2 67 59 126
3 10 18 28
4 2 3
Totals: 145 152 297
Differences across home language categories were checked. The students whose home language was only English used 14 of the 15 categories. However, those in the "Mostly English" category used only 11, while those in the "Mostly Non-English" category used only eight different strategies. This is a very similar result to that found for the division fact, 24 + 6 = 4. It seems that the use of a second language in the home may inhibit the number of strategies that students can develop. However, as before, it should be noted that the different sample sizes could have some effect here.
Fifth Research Question
The fifth research question was as follows:
What are the effects of school type, school size, class size, year (grade) level, age, gender, family size and home language m automatic recall, understanding and application of basic number facts of Year 3-7 students?
The data collected for the independent variables is tabulated in Appendix 3. Of the 33 schools used, 23 were government schools and 10 were non-government schools; and some two-thirds of the subjects in the study came from government schools. School sizes ranged from 100 to 480

30 I Basic Number Facts in Years 3-7
students with a mean emohnent of 242. Class sizes ranged from 16 to 39 with a mean of 28 students.
Table 1 shows that the study involved 198 males and 192 females. The distribution of the 390 subjects across Years 3-7 were 79, 81, 78, 74 and 78 respectively. Ages ranged from 92 months to 153 months. Age and year level were highly correlated (r = 0.96). Family size ranged from one to eleven, with a mean number of three children. The home language specification resulted in only six students with the "Only Non-English" classification. Due to the small sample in this category it was deleted and the six subjects added to the "Mostly Non-English" list. Thirty percent of the students were from homes where a second language was spoken.
Effects on Automatic Recall
Analysis of variance procedures were used to examine the effects of the categorical variables school type, year (grade), gender, and home language on automatic recall of the forty specified basic number facts. To test the effects of the continuous variables of school size, class size, and family size on automatic recall, regression analysis procedures were employed. Age was not considered separately here due to its close correlation with school year level. Finally, all independent variables were considered together in a step-wise regression analysis model for their effects on automatic recall of the forty specified basic number facts. Further tabulations of analyses are given in Appendix 3.
As expected, the most significant independent variable was year level, as can be seen in Table 8. Analysis of variance showed a highly significant effect, F(4, 385) = 97, p = 0.0001. Between-group comparisons using the Scheffe F-test showed significant differences between all pairs of year levels except Year 5 and Year 6 at the 99 percent level of confidence. As expected, there is a marked jump in performance from Year 3 with a score of 16.7 to Year 4 with a score of 25.4. The surprise in the results is the lack of growth from Year 5 to Year 6 with a difference of only one point.

Analysis of Results 131
Table 8: Automatic Recall Scores Across Operations and Year Levels
Year
Three
Four
Five
Si.x
Seven
All
Addition Subtraction Multiplication Division 40 Facts
6.7 4.1 2.8 3.1 16.7 8.4 6.3 5.8 4.9 25.4 9.1 7.6 7.6 7.2 31 .4 9.0 8.0 7.7 7.7 32.4 9.7 9.3 9.0 8.8 36.8
8.6 7.0 6.6 6.3 28.4
The more detailed picture for each of the four operations is fairly similar to the overall pattern, except that the change from Year 4 to Year 5 is much greater in multiplication and division than in addition and subtraction. This is probably because these two operations are more difficult and are also developed much later than addition and subtraction in the school program.
Gender had no significant effect on performance with scores being 29 and 28 for males and females respectively. The full results are shown in Appendix 3. Home language was significant. Table 9 shows a progressive decrease in scores as less English is spoken in the home. However, the only significant difference between any pair at the 95 percent level of confidence was indicated by a Scheffe F-test between the "Only English" and the "Mostly Non-English" categories with scores of 29.2 and 24.4 respectively. This association between language and recall of basic number facts is not unexpected.
Table 9: Effect of Home Language on Automatic Recall
Language Spoken Frequency Mean SD
Only English 274 29.2 9.7
Mostly English 80 27.7 9.7
Mostly Non-English 36 24.4 10.9
The analysis of school type and automatic recall is shown in Appendix 3. Non-government school students scored two points higher than government school students but this was not statistically significant at the 0.05 level. There was no significant interaction between school type, year level, gender, and home language (p < 0.05). There was a slight positive correlation (r = 0.37) between school type and class size. Nongovernment schools tended to have larger classes. Also, larger schools tended to have larger classes (r = 0.50).

321 Basic Number Facts in Years 3-7
Regression analysis showed that neither school size nor class size had any significant effect on performance (p < 0.05), but family size did (p =
0.003). Students from larger families did not perform as well as those from smaller families. Step-wise regression showed that year level accounted for 46 percent of the variance while family size accounted for only one percent of the variance in automatic recall. These results are detailed in Appendix 3.
Effects on Automatic Recall Applications
The analysis for this variable was conducted in the same way as for the forty basic number facts. Year level was highly significant as expected, F(4, 385) = 18, p = 0.0001. The scores in Years 3-7 for the four items were 2.6, 3.0, 3.4, 3.3, and 3.8 respectively. Thus the percentages of correct responses were 66, 74, 85, 83 and 96 percent respectively for the five year levels. Again, the scores for Years 5-6 were virtually the same.
The scores for males and females were 3.25 and 3.21 respectively. This was a similar result to the forty basic facts where there was no gender difference. Students in non-government schools seemed to perform slightly better than those in government schools- 3.4 compared with 3.2 - but the difference was not significant. The scores for the home language categories fell slightly from 3.26 for "Only English" through 3.24 to 3.00 for "Mostly Non-English" but the differences were not significant. Home language was a significant variable for the forty basic facts but it was not of any marked consequence here. This was somewhat surprising, since the four application items involved much more language than the previous basic number facts.
The applications of automatic recall were not affected by school size nor class size. However, family size was a significant factor (p = 0.016). This was a similar result to that for the forty basic facts where there was an inverse relationship between score and family size. When a 11 independent variables were combined in a step-wise regression analysis it was found that year level accounted for 14 percent of the variance. Tabulations of these analyses are shown in Appendix 4.
Effects on Understanding 24 + 6
Contingency tables and chi-square tests were used to check the association between the categorical variables of school type, year level, gender, and home language, and level of understanding of 24 + 6 = 4. Analysis of variance techniques were employed to check the associations between the continuous variables of school size, class size and family size and the level of understanding of 24 + 6 = 4. Some of the tabulations are included in Appendix 5.

Analysis of Results j33
The relationship between students' year level and their level of nnderstanding of 24 + 6 == 4 may be interpreted from Table 10 below. As
expected, year level was highly significant (X2 == 59.1, df == 8, p == 0.0001). There was a marked increase in nnderstanding through the year levels, with the exception of Years 5-6 where performances were again almost identical. There was a lack of nnderstanding in Years 3-4 where 32 percent and 25 percent respectively showed no nnderstanding at all. However, the improvement by Year 5 was very prononnced. In the top three year levels a total of only 11 students (3 percent) showed no
· understanding at all.
Table 10: Contingency Table of Year Level and Understanding 24 .;- 6
Year Level
Understanding Three Four Five Six Seven Total
Yes 28 38 54 52 62 234
Partially 26 23 20 1 7 1 4 100
1\b 25 20 4 5 2 56
Total 79 8 1 78 74 78 390
Table 11: Contingency Table of Home Language and Understanding 24 + 6
Only Mostly Mostly Understanding English English Non-English Total
Yes 176 41 1 7 234
Partially 66 27 7 100
1\b 32 1 2 1 2 56
Total 274 80 36 390
Table 11 shows the relationship between home language and level of nnderstanding of 24 + 6 == 4. Home language was significantly related to
level of nnderstanding (X2 == 16.1, df == 4, p == 0.003). One third of the "Mostly Non-English" students showed no nnderstanding of 24 + 6 == 4 while less than one eighth of the "Only English" were in this category. It was noted previously that second-language students tended to use a smaller range of explanatory strategies. As can be seen in Table 12, there were virtually no gender differences in levels of nnderstanding, and this result is consistent with other findings of this study which relate to gender.

341 Basic Number Facts in Years 3-7
Table 12: Contingency Table of Gender and Understanding 24 + 6
Understanding Males Females Total
Yes 11 9 11 5 234 Partially 48 52 100
No 31 25 56
Total 198 192 390
The relationship between school type and the level of understanding of 24 + 6 = 4 as presented in Table 13 was found to be highly significant
(X2= 11.9, df = 2, p = 0.003). Students in non-government schools performed better than those in government schools. For example, 54 percent of students in government schools showed understanding of 24 + 6 = 4 while 72 percent in non-government schools showed understanding. No other significant relationships were found.
Table 13: Contingency Table of School Type and Understanding 24 + 6
Understanding Government Non-Govt Total
Yes 1 41 93 234 Partially 78 22 100
No 42 1 4 56
Total 261 129 390
Effects on Understanding 13 - 5
The same procedures used in the above section were employed to analyse relationships here. Some of the findings are shown in Appendix 3. The relationship between understanding and year level was found to be
highly significant (X2 = 35.6, df = 8, p = 0.0001). Table 14 shows that performance increased with year level except, once again, for Years 5-6 which showed virtually the same degree of understanding. Only five students above Year 4, or about one percent of the sample showed no understanding of 13 - 5 = 8. There was a marked jump in performance from Year 4 to Year 5 - from 54 percent to 64 percent having a full understanding.

Analysis of Results 135
Table 14: Contingency Table of Year Level and Understanding 13 - 5
Year Level
Understanding Three Four Five Six Seven Total
Yes 50 54 64 6 1 68 297
Partially 1 3 1 9 1 1 1 1 1 0 64
No 1 6 8 3 2 0 29
Total 79 8 1 78 74 78 390
Table 15: Contingency Table of Home Language and Understanding 13 - 5
Only Mostly Mostly Understanding English English Non-English Total
Yes 211 60 26 297
Partially 45 16 3 64
No 18 4 7 29
Total 274 80 36 390
Table 15 shows the relationship between home language and
understanding of 13-5 = 8, and this was found to be significant (X2 = 10.1, df = 4, p = 0.039). Students with no understanding ranged from 7 percent for the "Only English" to 19 percent in the "Mostly Non-English" category. However, numbers in some cells are somewhat small.
Table 16 below shows the relationship between gender and understanding of 13 - 5 = 8. Females performed slightly better than males but the difference is not statistically significant (p < 0.05). This is consistent with other findings in this study covering gender.
Table 16: Contingency Table of Gender and Understanding 13 - 5
Understanding Males Females Total
Yes 145 152 297
Partially 34 30 64
No 19 1 0 29
Total 198 192 390

361 Basic Number Facts in Years 3-7
School type was found to be significantly related to level of
understanding of 13- 5 = 8 (X2 = 12.8, df = 2, p = 0.002). The results in Table 17 show that 84 percent of students in non-government schools understood 13 - 5 = 8 while only 72 percent of government school students did so. This is a similar result to that for the division example, 24 + 6 = 4.
Table 17: Contingency Table of School Type and Understanding 13 - 5
Understanding Government Non-Govt Total
Yes 189 108 297
Partially 55 9 64
1\b 17 1 2 29
Total 261 129 390
Neither the size of the school nor students' family sizes showed any significant relationship with the level of understanding of 13 - 5 = 8. However, class size did show up with a significant relationship in the analysis of variance (p = 0.009) with class sizes of 28.3, 26.7, 29.0 for the "Yes", "Partially", and "No" categories respectively. However, the differences show no pattern and are too small to be of any practical importance.
Sixth Research Question
The sixth research question was as follows:
What are the relationships between automatic recall, application, and understanding of basic number facts?
Student performances on automatic recall of the ten basic multiplication and ten basic division facts were highly correlated (r = 0.84). However, the correlation between automatic recall of basic addition and subtraction facts was somewhat lower (r = 0.77). Tabulated data to illustrate relationships between basic facts recall, applications, and understanding may be found in Appendix 6.
Simple regression analysis showed a correlation of 0.61 between automatic recall on the 40 basic number facts and the four applications items. The scores on the 40 basic facts for the "Yes", "Partially", and "No" understanding of 24 + 6 were 32, 26, and 17 respectively (r = 0.55). The corresponding scores for understanding of 13- 5 were 30, 26, and 17 (r = 0.35).

Analysis of Results j37
In the three categories of understanding 24 + 6 the means on the four applications items were 3.5, 3.1, and 2.3 for the "Yes", "Partially" and "No" groups respectively (r = 0.40). For understanding 13 - 5 the corresponding scores on applications were 3.4, 2.8, and 2.4 (r = 0.30).
The means for automatic recall of the ten basic division facts were 7.4, 5.6, and 2.8 for the "Yes", "Partially" and "No" groups respectively regarding understanding 24 + 6 (r = 0.53). However, the relationship between subtraction and understanding 13- 5 was much lower (r = 0.31) with corresponding scores of 7.4, 6.3 and 4.2. As understanding levels fell so did scores in automatic recall, but the fall was more pronounced in division than subtraction. All the relationships described above for the sixth research question and detailed in Appendix 6 were highly significant at the p = 0.0001 level.

CHAPTER FOUR
Conclusions and Recommendations
The purposes of this study were to provide baseline information on Year 3-7 students' levels of automatic recall of basic number facts in the four operations; to determine whether this recall skill is transferred to reallife situations; to measure the level of understanding of basic facts in subtraction and division; to determine thinking strategies in subtraction and division; and to find what effects age, gender, year level, family size, home language, school type, school size, and class size have m these measures.
A stratified random sample of 390 Year 3-7 students was selected from 33 schools in the Perth Metropolitan area. An instrument was developed and each student tested and interviewed individually. A sample of ten basic number facts for each of the four operations was used to measure students' automatic recall based on a three-second time limit. Four items -one for each operation - were used to assess whether or not students could apply automatic recall skills to real-life situations. Two basic facts items, 13- 5 = 8 and 24 + 6 = 4, were used to determine students' levels of understanding and also to identify their explanatory strategies.
Discussion of Results
The scores for the whole sample on automatic recall of basic facts for the operations of addition, subtraction, multiplication, and division were 86, 70, 66, and 63 percent respectively. This order of difficulty was as expected. However, the gap between addition and subtraction was very great. Students are apparently not making the connection between addition and subtraction facts. This is borne out by other studies - for example, Thornton, Toohey and Jones (1986); Mcintosh, Bana and Farrell (1995). The language used for each of these two operations is quite different, and does not help students make the link between addition and subtraction. However, for multiplication and division the link is made much more obvious by the similar language used for each operation.
Over Years 3-7 the most progress is made in the Year 3-5 range. Also, addition and subtraction skills develop sooner than for multiplication and division. The fact that they are dealt with sooner in the curriculum is a relevant factor here. The smaller numbers involved in addition and

40 I Basic Number Facts in Years 3-7
subtraction and the counting up and counting down strategies would tend to make these facts easier to process. However, the differences between the operations decline markedly by Year 7.
Within each operation there were significant differences between items. In general, the difficulty level in all four operations was directly related to the size of the sum, minuend, product, or dividend. The exceptions were special cases such as those involving squaring or doubling, or their inverses, and a few particular items. It was expected that items involving zero would cause problems but this was not the case. For example, 73 percent of students were successful in the item 9 x 0 = ? ;
well above the mean of 66 percent for all ten multiplication facts.
Year level, as expected, was a highly significant factor and accounted for 46 percent of the variance in scores. The surprising result is that there was no increase in performance from Year 5 to Year 6. If this was also the case across Years 6-7 then it could perhaps be put down solely to a lack of coverage of automatic recall in Years 5-7. However, there was a significant rise in scores from Year 6 to Year 7. Thus it may also be the case that performance on basic number facts levels off over Years 5-6 due to a lack of maturation over these age levels. It would be interesting to compare other mathematical concepts, skills and processes for Years 5-6 to see if this is indeed the case.
Students were very successful at applying their knowledge of basic number facts to real-life situations. Thus if a fact was known it could readily be utilised in a familiar situation. However, it is interesting to note that even with known facts the level of application was somewhat lower for multiplication and division than for addition and subtraction.
The extent of understanding of the subtraction and division facts was not very different from performance on automatic response in these operations. However, as different items were used in this case, further study is needed to determine whether or not there is a close relationship between knowledge and understanding of basic number facts. A wide range of strategies were used to explain the division and subtraction facts. However, most students gave only one or two explanations -usually one verbal and one diagrammatic - despite being encouraged to give more. It may be that students are not given enough encouragement to explore number facts in a variety of ways. Although it is well established that such strategies are idiosyncratic to individuals and to individual items, other researchers such as Mcintosh (1990) and Mcintosh, De Nardi and Swan (1994) have systematically categorised mental computation strategies. In this overall study the only notable gender differences were in some of the strategy types used. This aspect should be explored further.

Conclusions and Recommendations 141
Implications for Research
There are a number of issues which have arisen from this study that merit further investigation. One is the lack of development of automatic responses to basic number facts from Year 5 to Year 6. The reason for this is not entirely clear. A second aspect which needs to be researched further is the relationship between knowledge and understanding of basic number facts. This should be dealt with more systematically by U..'>ing the same item for both assessments in each case. One finding showed that the strategies used by girls and boys were somewhat different, and it would be interesting to know the reasons for such differences. This study did not consider the teaching strategies used at all. What effect, for example would the teaching of particular mental strategies have m children's knowledge and understanding of basic number facts?
Recommendations for Teaching
Students showed a wide repertoire of mental and semi-concrete strategies for solving and explaining basic number facts. It is likely that many of these have not been taught but have been developed by the children themselves. It is unlikely that the teaching of specific strategies will be helpful, but teachers should certainly foster the development of children's own strategies. It is also important for teachers to be aware that different number facts will generate different strategies by children.
It is unrealistic to expect complete automatic response to the basic number facts by the end of Year 5, except perhaps for addition. However, all the conceptual development needs to occur before then. It is essential that children develop understanding of the operation and the particular number facts before they practise the corresponding recall skill. This needs to be done through a gradual progression from concrete to diagrammatic to abstract experiences. Except for some special cases, the larger the sum, minuend, product or dividend the more difficult the item. Thus more emphasis needs to be placed m the items involving larger numbers.
The link between addition and subtraction is being missed by many children and needs to be given much more attention in the teaching/learning process. For example, the fact 8 + 6 = 14 should be treated with 6 + 8 = 14, 14- 6 = 8 and 14- 8 = 6 rather than as a separate entity. Thus four facts can be seen as one. Such treatment will help children make these connections, including the commutative relationship, and therefore assist in the development of their understanding.

421 Basic Number Facts in Years 3-7
A considerable effort has been made by mathematics educators to provide direction for teachers in the development of number fact knowledge and with it, number sense - for example, Fuson (1986), Hoffman (1977), Lazerick, (1981); Rathmell (1978, 1981); Sowder and Schappelle (1994); Thornton (1978); Thornton and Smith (1988); and Thornton, Jones and Neal (1995). The following is a suggested teaching/learning sequence for the development of automatic response to the basic number facts.
• Develop understanding of the operation.
This involves a wide variety of experiences, mostly concrete, to understand the operation, e.g. 2 + 2 + 2 = 6; 3 x 2 = 6.
• Develop understanding of the facts.
This involves a range of activities to explore relationships. e.g. 3 X 2 = 6, 2 X 3 :=: 6, 6 + 2 :=: 3, 6 + 3 :=: 2.
• Establish recall of facts from short-term memory.
This can be attained by promoting the development of children's personal thinking strategies for determining solutions to basic fact items. e.g. 3 x 2 = ?, 2 x 2 = 4, 4 + 2 = 6, so 3 x 2 = 6.
• Establish recall of facts from long-term memory (automatic recall).
This is best attained through extensive practice and speed drills to reduce the response time to a minimum. e.g. 3 x 2 = 6 within say three seconds.
The most significance aspect of the above sequence is that understanding must precede practice in recalling each fact. Also, it is important that children be encouraged to explore realtionships and develop their own strategies as part of this development process. Practice drills should only be used as devices to attain automatic response to facts already understood. Such responses are very important for ensuring efficient computation skills.

References
Allardyce, B.S. and Ginsburg, H.P. (1983). Children's psychological difficulties in
mathematics. In H.P. Ginsburg (Ed.), The development of mathematical thinking (pp. 342-343). Orlando, Florida: Academic Press.
Ashcraft, M.H. (1982). The development of mental arithmetic: A chronometric approach. Developmental Review, 2, 213-236.
Ashcraft, M.H. (1985a). Children's mental arithmetic: Towards a model of retrieval and problem solving. Paper presented at Biennial Meeting of the Society for Research in Child Development, Toronto.
Ashcraft, M.H. (1985b). Is it farfetched that some of us remember our arithmetic facts? Journal for Research in Mathematics Education, 16(2), 99-105.
Ashcraft, M.H. and Hamann, M.S. (1982). The evolution of children's mental addition. Paper presented at the Annual Meeting of the American Educational Research Association, New York.
Ashcraft, M.H., Hamann, M.S. and Fierman, B.A. (1981). The development of mental addition. Paper presented at the Meeting of the Society for Research in Child Development, Boston.
Ashfield, D. (1989). Counting in ones. Mathematics in School, 8(1), 25.
Australian Education Council and Curriculum Corporation (1991). A national statement on mathematics for Australian schools. Melbourne: Authors.
Baroody,. A.J. (1985). Mastery of basic number combinations: lnternalisation of relationships or facts. Journal for Research in Mathematics Education, 16(2), 83-98.
Baroody, A.J. (1989). Kindergartners' mental addition with single-digit combinations. Journal for Research in Mathematics Education, 20(2), 159-172.
Bodner, G.M. (1986). Constructivism: A theory of knowledge. Journal of Chemical Education, 63(10), 873-878.
Brownell, W.A. (1935). Psychological considerations in the learning and teaching of arithmetic. In W.D. Reeve (Ed.), The teaching of arithmetic: The tenth yearbook of the National Council of Teachers of Mathematics (pp. 1-31). New York: Teachers' College Press.

441 Basic Number Facts in Years 3-7
Brownell, W.A. and Chazal, C.B. (1935). The effects of premature drill in third grade arithmetic. Journal of Educational Research, 29, 17-28.
Carpenter, T.P. (1980). Heuristic strategies used to solve addition and subtraction problems. Paper presented at the fourth Annual Meeting of the International Group for the Psychology of Mathematics Education, Berkley.
Carpenter, T.P. and Moser, J.M. (1984). The acquisition of addition and subtraction concepts in grades one through three. Journal for Research in Mathematics Education, 15(3), 179-202.
Cobb, P. (1994) Where is the mind? Constructivist and socio-cultural perspectives on mathematical development. Educational Researcher, 23, 13-20.
Cockcroft, W.H. (Chair) (1982). Mathematics counts. Report of the Committee of Inquiry into the Teaching of Mathematics in Schools. London: HMSO.
Confrey, J. (1986). A critique of teacher effectiveness research in mathematics education. Journal for Research in Mathematics Education, 17(5), 347-360.
Fuson, K.C. (1986). Teaching children to subtract by counting up. Journal for Research in Mathematics Education, 17(3), 172-189.
Groen, G.J. and Parkman, J.M. (1972). A chronometric analysis of simple addition. Psychological Review, 79, 329-343.
Hoffman, N. (1977). The teaching and learning of basic number facts. Educational Studies in Mathematics, 8, 391-398.
Kouba, V.L. (1989). Children's solution strategies for equivalent set multiplication and division word problems. Journal for Research in Mathematics Education, 20(2), 147-158.
Lazerick, B.E. (1981). Mastering basic facts of addition: An alternative strategy. Arithmetic Teacher, 28(7), 20-24.
Leo£, M., Carey, D., Carpenter, T. & Fennema, E. (1988). Integrating assessment and instruction. Arithmetic Teacher, 36(3), 53-55.
Mcintosh, A. (1990). "I can think my brain and move my fingers": Analysing and classifying children's mental arithmetic strategies. Paper presented at the Mathematics Education Research Group of Australasia, Hobart.
Mcintosh, A., Bana, J. & Farrell, B. (1995). Mental computation in school mathematics: Preference, attitude and performance of students in Years 3, 5, 7 and 9. MASTEC Monograph Series No. 1. Perth: MASTEC, Edith Cowan University.

References 145
Mcintosh, A., De Nardi, E. & Swan, P. (1994). Think mathematically! How to teach mental maths in the primary classroom. Melbourne: Longman Cheshire.
Ministry of Education (1989). Learning mathematics: Pre-primary to stage seven mathematics syllabus. Handbook. Perth: Ministry of Education, Western Australia.
Mulligan, J.T. (1992). Children's solutions to multiplication and division problems: A longitudinal study. Mathematics Education Research Journal, 4(1), 24-42.
National Council of Teachers of Mathematics (1980). An agenda for action: Recommendations for school mathematics of the 1980's. Reston, VA: NCTM.
National Council of Teachers of Mathematics (1989). Curriculum and evaluation standards for school mathematics. Reston, VA: NCTM.
Pines, A.L. and West, L.H.T. (1986). Conceptual understanding and science learning: An interpretation of research within a source of knowledge framework. Science Education, 70 (5), 583-604.
Rathmell, E.C. (1978). Using thinking strategies to teach the basic facts. In Developing computational skills: 1978 yearbook of NCTM (pp. 13-38). Reston, VA: NCTM.
Rathmell, E.C. (1981). Strategies for improving recall of basic facts. In Rogerson, A. (Ed.), Maths, myths and realities (pp 12-19). Melbourne: Mathematical Association of Victoria.
Reys, B.J. & Reys, R.E. (1986). One point of view: Mental computation and computational estimation - their time has come. Arithmetic Teacher, 33(7), 4-5.
Romberg, T. and Carpenter, T. (1986). Research on teaching and learning mathematics: Two disciplines of scientific inquiry. In M.C. Wittrock (Ed.)., Handbook of research on teaching (3rd edition) (pp. 850-873). New York: MacMillan.
Shuard, H. (1986). Primary mathematics today and tomorrow. London: SCDC Publications.
Sowder, J. & Schappelle, B. (1994). Number-sense making. Arithmetic Teacher, 41(6), 342-345.
Statview: The professional, graphic, statistics utility. (1986). Calabasas, CA: Brainpower. (Computer software).
Suydam, M. (1984). Learning the basic facts. Arithmetic Teacher, 32(1), 15.
Svenson, 0. (1975). Analysis of time required by children for simple additions. Acta-Psyclwlogica 39(4), 289-301.

461 Basic Number Facts in Years 3-7
Svenson, 0. and Hedenborg, M.L. (1980). Strategies for solving simple subtractions as reflected by children's verbal reports. Scandinavian Journal of Educational Research, 24(4), 157-172.
Svenson, 0. and Sjoberg, K. (1983). Evolution of cognitive processes for solving simple additions during the first three school years. Scandinavian Journal of Psychology, 24(2), 1-8.
Thorndike, E.L. (1921). The psychology of drill in arithmetic: The amount of practice. Journal of Educational Psychology, 12, 183-194.
Thornton, C.A. (1978). Emphasising thinking strategies in basic fact instruction. Journal for Research in Mathematics Education, 9(3), 214-232.
Thornton, C.A., Jones, G.A. & Neal, J.L. (1995). The 100s chart: A stepping stone to mental mathematics. Teaching Children Mathematics , 1(8), 480-483.
Thornton, C.A. and Smith, P.J. (1988). Action research strategies for learning subtraction facts. Arithmetic Teacher, 35 (8), 8-12.
Thornton, C.A., Toohey, M.A. and Jones, G.A. (1986). Mastery of subtraction facts: Implications from research in United States and Australia. Research in Mathematics Education in Australia, 10-21.
Vakali, M. (1985). Children's thinking in arithmetic word problems. Journal of Experimental Education, 53(2), 106-113.

Appendix 1 Data Collection Protocols and Instruments
Basic Number Facts Project: Protocols for Individual Interviews
The data for the first eight variables below are to be collected from the school.
School (Name) Enrolment (Nearest ten) Type (Govt/Non-Govt)
Student (Name) Year/Grade (3-7) Class size (Number of students)
Age (months) Gender (M/F)
Family Size (Number of siblings: see below)
Ask the student: How many brothers and sisters do you have? (count the subject, brothers, sisters, half brothers, half sisters, but not step brothers nor step sisters)
Home Language ( OE, ME, MO, 00. See below )
Ask: Is English the only language spoken in your home? If "yes" enter OE.
If "no": Is any English spoken in your home? If "no" enter 00.
If "yes": Is the language spoken in your home mostly English or mostly another language? Enter ME or MO as appropriate.
Follow up questions may be needed to confirm the home language category.

4 81 Basic Number Facts in Years 3-7
Test Section A - Automatic Response
Say: Today I am going to see how good you are at your number facts. I'll be asking you four lots of ten questions to see how fast you can give me the right answer each time. If you can't give the answer at once don't worry because I'll leave it and move m to the next one. The first 10 questions will be addition.
Addition
Say: For each question I'll show you a card like this (show card 2+1) and I'll say 2 add 1.
I could have said, 2 plus 1, or 2 and 1, but I'll say 2 add 1 (showing card with 2 + 1).
Let's have a practice.
Show card for 2 + 2 and say simultaneously, "2 add 2" (show card for 3 seconds).
Now I'll give you the 10 facts using "add" (proceeding as for the previous practice card).
Place each card in one of two piles: one pile for correct response within 3 seconds; the other pile for incorrect or outside 3 seconds. Record 1 (for correct automatic response) or 0 for each item m the Data Collection Sheet after the interview.
G 1. 5 + 2 2. 3 + 4 3. 1 + 8 4. 6 + 0 5. 7 + 7
6. 4+5 7. 8+3 8. 7 + 6 9. 9 + 5 10. 2 + 9
That's good.
Subtraction
Say: The next ten questions will be subtraction.
Let's practise one.
I'll say, 3 take 1 (show card 3 - 1).
I could have said 3 subtract 1, or 3 minus 1, or 3 take 1, but I'll say 3 take
1.
Try another one.

Appendix 1 149
5 take 2 (show card 5-2 for 3 seconds).
Now I'll give you 10 facts using "take" (proceeding as for addition).
D 1. 6-2 2. 8-3 3. 7-5 4. 10-7 5. 8-0
6. 9-6 7. 12 - 9 8. 11 - 6 9. 16 - 8 10. 13- 4
That's good.
Multiplication
Say: The next ten questions will be multiplication.
Let's practise one.
What is four two's (show card 4 x 2)?
I could say, 4 lots of 2, or 4 times 2, or 4 multiplied by 2, but I'll say 4 twos.
Try another one.
Five twos (show card 5 x 2 for 3 seconds).
Now I'll give you the next ten facts (proceeding as before).
0 1. 2x3 2. 3x4 3. 5x5 4. 8x2 5. 4x6
6. 9 X 0 7. 7 X 3 8. 9 X 4 9. 6x7 10. 9x8
That's good.
Division
Say: The next ten questions will be division.
Let's practise one.
How many twos in 4 (show card 4 + 2)?
I could say, What is 4 divided by 2? but I'll say, How many?.
Try another one.
How many twos in 6 (show card 6 + 2 for 3 seconds)?
Now I'll give you the 10 facts using "How many" (proceeding as before).
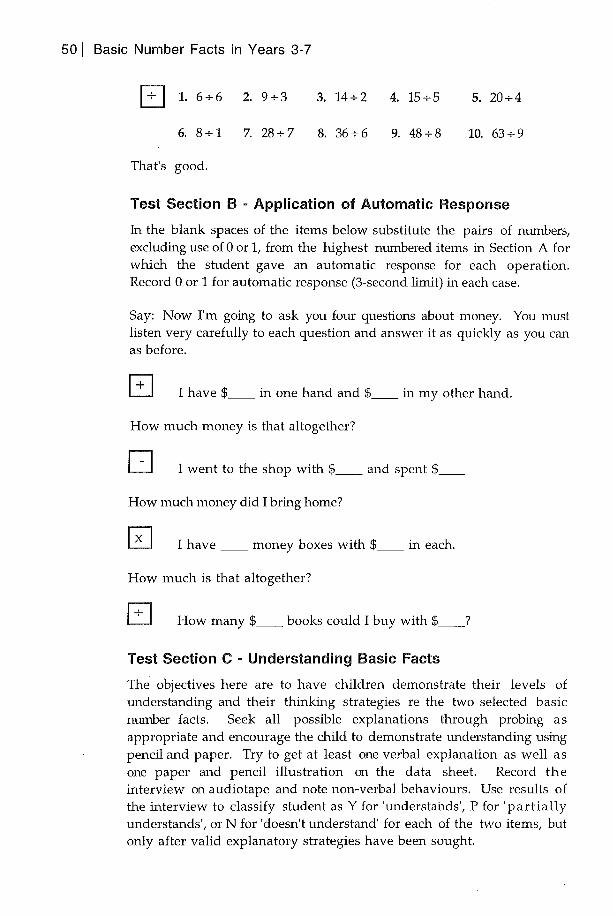
50 I Basic Number Facts in Years 3-7
EJ 1. 6+6 2. 9+3 3. 14+2 4. 15+5 5. 20+4
6. 8+1 7. 28+7 8. 36+6 9. 48+8 10. 63+9
That's good.
Test Section B - Application of Automatic Response
In the blank spaces of the items below substitute the pairs of numbers, excluding use of 0 or 1, from the highest numbered items in Section A for which the student gave an automatic response for each operation. Record 0 or 1 for automatic response (3-second limit) in each case.
Say: Now I'm going to ask you four questions about money. You must listen very carefully to each question and answer it as quickly as you can as before.
0 I have $ __ in one hand and $ __ in my other hand.
How much money is that altogether?
[] I went to the shop with $ __ and spent $ __
How much money did I bring home?
0 I have __ money boxes with $ __ in each.
How much is that altogether?
EJ How many $ __ books could I buy with $ __ ?
Test Section C - Understanding Basic Facts
The objectives here are to have children demonstrate their levels of understanding and their thinking strategies re the two selected basic number facts. Seek all possible explanations through probing as appropriate and encourage the child to demonstrate understanding using pencil and paper. Try to get at least one verbal explanation as well as one paper and pencil illustration on the data sheet. Record the interview on audiotape and note non-verbal behaviours. Use results of the interview to classify student as Y for 'understands', P for 'partially understands', or N for 'doesn't understand' for each of the two items, but only after valid explanatory strategies have been sought.

Appendix 1 !51
Division
Ask: HQw many sixes in 24?
If child knows, ask, How do you know that?
How would you explain it to me if I didn't know how many sixes in 24?
Can you explain it another way?
Another way? (etc)
Can you explain it using pencil and paper?
Another way? (etc)
If child doesn't know, ask, How could you find out how many sixes in 24? (etc)
How could you find out using pencil and paper? (etc)
Subtraction
Ask: What is 13 take 5?
If the child knows, ask, How do you know that?
How would you explain it to me if I didn't know 13 take 5?
Can you explain it another way?
Another way? (etc)
Can you explain it using pencil and paper?
Another way? (etc)
If child doesn't know, ask, How could you find out what 13 take 5 is? (etc)
How could you find out using pencil and paper? (etc)

521 Basic Number Facts in Years 3-7
Basic Number Facts Project: Data Collection Sheets
School Enrolment ____ Type (G/N) __ _
Student ___ . Year (3-7) _ Class size __ _
Age (months) __ _ Gender (M/F) __ Family Size __
Home Language ( OE, ME, MO, 00 ) __ _
Section A - Automatic Response (Y /N = 1/0)
G 1. 5 + 2 2. 3 + 4 3. 1 + 8 4. 6 +0 5. 7 + 7
6. 4 +5 7. 8 + 3_ 8. 7 + 6 9. 9 + 5 10. 2 + 9
[] 1. 6-2 2. 8-3 3. 7-5 4. 10-7 5. 8-0
6. 9-6 7. 12- 9 8. 11-6 9. 16- 8 10. 13-4
0 1. 2x 3 2. 3x4 3. 5x5 4. 8 X 2 5. 4x 6
6. 9 X 0 7. 7x3 8. 9 x4 9. 6x 7 10. 9 X 8
EJ 1. 6 + 6 2. 9 +3 3. 14 + 2 4.15 + 5 5. 20 + 4
6. 8 + 1 7. 28 + 7_ 8. 36 + 6 9. 48 + 8 _10. 63 + 9
Section B- Application of Automatic Response (Y/N = 1/0)
EJ
0
0
EJ
I have $ __ in one hand and $ __ in my other hand.
How much money is that altogether? _
I went to the shop with $ __ and spent $ __
How much money did I bring home?_
I have __ money boxes with $ __ in each.
How much is that altogether? _
How many $ __ books could I buy with $ __ ? _

Appendix 1 I 53
Section C - Understanding Basic Facts (Y/P/N); (Category of strategy)
Division: How many sixes in 24? __ ; __
Subtraction: What is 13 take 5? __ ; __
How many sixes in 24?
(a) Illustrations:
(b) Verbalisations I Other non-verbal behaviours:

541 Basic Number Facts in Years 3-7
What is 13 take 5?
(a) Illustrations:
(b)Verbalisations I Other non-verbal behaviours:

Appendix 2 Strategies Used for Divi.sion and Subtraction
Strategies Used for Division
Extracts from interview discourses, student drawings and interviewer observations are presented below to illustrate the 17 different valid strategies (labelled DA to DQ) used by students to explain or solve the division fact 24 + 6 = 4. The letter "I" represents the interviewer; the interviewer dialogues are shown in normal text; the student dialogues are shown in italics; and other observation notes are presented in parentheses.
DA - Counting by sixes
I:
Claire:
I:
Claire:
I:
Claire:
How many sixes in 24?
Four.
How do you know that?
I just know.
How would you explain it to me if I didn't know how many sixes in 24?
You could goer . .. 6, 12, 18, 24 (tallying with four fingers), so there are four sixes.
DB - Repeated addition
Adrian: You could use your tables.
I: But say I didn't know my tables.
Adrian: If you have um ... one six then you keep putting six. You say, six plus another six, plus another six, plus another six, then you get the answer.
DC - Subtracting from a known fact
Adam: ... you would go six. How many sixes in 24? You would go ... you would go six times six is 36.

561 Basic Number Facts in Years 3-7
I:
Adam:
:Mm
(inaudible) ... which can't be, so you'd go back one which is six fives is 30, so you'd still have to go back one, then six fours is 24. You'd keep going back.
DD - Adding to a known fact
Sue: Well, three sixes are 18, and six more is 24 and that's er ... four sixes.
DE - Doubling with six
Jenny: Six and six is 12
I: Isee.
Jenny: Then double 12 and you have 24.
I: How does that explain it?
Jenny: There were two sixes to get to 12 and then two more sixes to get to 24.
DF - Doubling with four
Wayne: Four and four is eight, and double eight is 16. Then eight more is 24, so that's er ... six fours.
I: I'm not sure how that works.
Wayne: Well, you see, six fours are 24 so it's four sixes.
DG - Repeated subtraction
Lisa: You could go 24- 6 is 18, 18- 6 is 12, 12- 6 is 6, 6- 6 is zero, and that's four times you've taken it away ..
DH- Finding the missing factor
Ross: Well I could try my tables.
I: Okay, how would you do that?
Ross: I'd go one six is six, two sixes are twelve, three sixes are 18, four sixes are 26 . . . oh, 24. So there's four.

Appendix 2j57
Dl - Finger counting
Tanya:.
I:
Tanya:
Six (holding up six fingers and a thumb), and then I count another six.
With your fingers?
Yeah, and I count this one by that (nodding to each hand in tum). One six is easy and I go (holds up forefinger with thumb and counts other six fingers) 6. . . 6, 7, 8, 9, 10, 11, 12 (another finger up and repeats count), 13, 14, 15, 16, 17, 18, 18 (another finger up and repeats count) .. . 19, 20, 21, 22, 23, 24 (and holds up four fingers to represent the four lots of six fingers counted).
DJ - Real-life context
Tammy: Well you have 24 oranges ...
I: Yes.
Tammy: And you put out six. You divide them up into groups of six oranges and then you count how many groups you've got of six.
1: How many groups would we have?
Tammy: Four
DK - Drawing and grouping into sixes
I: How could you explain it using pencil and paper?
Shelley: Well you could draw 24 and then divide it up into sixes (drew 24 marks in groups of six then ringed groups of six as shown below).

5 81 Basic Number Facts in Years 3-7
Dl - Drawing four boundaries then six objects in each
(Julie drew four rings then drew six strokes in each as shown below).
@JJ)@@Ij)(J]ED) 1: Right. Now Julie, explain what you've done there.
Julie: Um ... I've taken six lines and put a circle around them, and I put six lines in each circle and I've put four circles.
DM - Drawing successive sets of six
(Gillie drew one lot of six, with the sixth stroke crossing the others, then continued until there were four sets as shown below).
-H-H-f- tH-1+ +1--f-+-{ 1 I I ll-
Gillie: There's four lots . .. or you could go one, two, three, four, five, six and draw a circle round it (drawing the ringed set, as if to show another way).
DN - Drawing six boundaries but using four
C3
(Tony drew six boundaries and sketched six objects in each boundary in turn as below)
6J ((0:]) c::3 0 c_:)
Tony: I only need four and there's four lots.
I: Is there any other way you could explain why there are four sixes in 24?
Tony: (Pause) No.
DO - Drawing six sets of four by partitioning
Guy: I'd draw six groups and I'd put a stroke in each until I get up to 24.
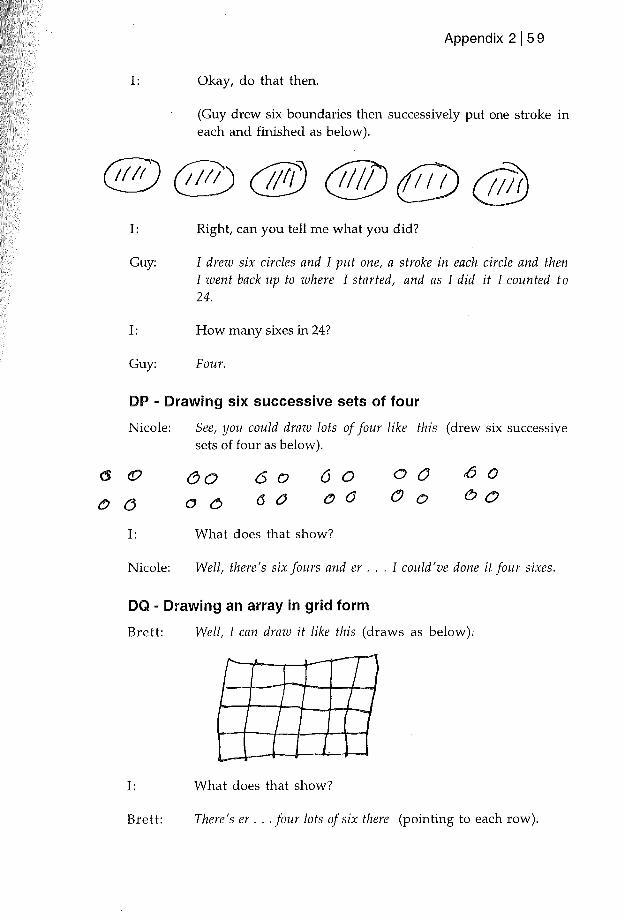
Appendix 215 9
I: Okay, do that then.
(Guy drew six boundaries then successively put one stroke in each and finished as below).
I: Right, can you tell me what you did?
Guy: I drew six circles and I put one, a stroke in each circle and then I went back up to where I started, and as I did it I counted to 24.
I: How many sixes in 24?
Guy: Four.
DP - Drawing six successive sets of four
Nicole:
I:
Nicole:
See, you could draw lots of four like this (drew six successive sets of four as below).
60 0 6
60 d ()
6 0 ~ 0
What does that show?
oo (J 0
0 0
60
Well, there's six fours and er ... I could've done it four sixes.
DQ - Drawing an array in grid form
Brett: Well, I can draw it like this (draws as below).
I: What does that show?
Brett: There's er ... four lots of six there (pointing to each row).

60 I Basic Number Facts in Years 3-7
Strategies Used for Subtraction
Extracts from interview discourses, student drawings and interviewer observations are presented below to illustrate the 15 different valid strategies (labelled from SA to SO) used by students to explain or solve the basic subtraction fact 13 - 5 = 8. The letter "I" represents the interviewer; the interviewer dialogues are shown in normal text; the student dialogues are shown in italics; and other observation notes are presented in parentheses.
SA - Subtracting from ten first
I: Can you explain it to me in another way?
Melanie: You've got 13. That's ten and three, and you take five off ten leaves five, plus the three from 13 leaves eight.
I: Can you tell me another way?
Melanie: (Pause) No, I don't think so.
SB - Converting ten into two fives
I:
Mario:
How did you know that?
Well . .. I said 10 has two fives so I took one five and added three to it and that equals eight.
SC - Adding five and subtracting ten
Shane: You can add five so that's 18, then you take off ten and there's eight left.
SD - Subtracting three then two
Heba: Um ... like um ... like you take ... I just took three and it would be ten. So I just have to take another two and it would be eight.
SE - Adding two before subtracting five then two
I:
Robert:
How did you know?
(Pause) I er . .. put two on 13 and got 15. Take five is 10, then take the two off; that's eight.
SF - Counting down by ones from thirteen
Kerry: I just counted

Appendix 2 161
I: What do you mean?
Kerry: Well, I went 12, 11, 10, 9, 8. So it's 8.
SG - Counting up by ones from eight
Adrian: Well, you could go 8, and then you could go 9, 10, 11, 12, 13.
SH - Counting up by ones from five
I: How would you show someone who didn't know?
Stephen: Um . .. they get the five and pretend they've gone, and then you'd say that you add on from five until you get 13 on your fingers and then . .. so you go 6, 7, 8, 9, 10, 11, 12, 13 (tallying with fingers) and tlten you count how many fingers you've got pushed up and that will be your answer.
Sl - Calculating difference from a known fact
Kristy: Five and seven is twelve so five and eight's gotta be 13.
SJ - Using fingers as objects
I: Show me how you would use your fingers, then.
Maria: (Puts out 10 fingers) Well, we'll pretend there's another three ... one, two, three ... four, five (bending two fingers). So there's five, six, seven, eight left.
SK - Counting down by ones with finger tally
I: How did you know it was eight?
Chris:
I:
Chris:
By using my fingers.
Okay, how did you use your fingers?
By like ... thirteen you can easily say, 12, 11, 10, 9, 8 (tallying on fingers) ... up to five.
SL - Real-life context
Paula: Er ... well if you had $13 and spent $5 at the shop you'd still have $8 left.

621 Basic Number Facts in Years 3-7
SM- Drawing and crossing off objects
Carmel: 1, 2, 3, 4, 5, 6, 7, 8, 9, 10, 11, 12,13 (drawing 13 strokes). I'd just draw 13 and take away five. One, two, three, four, five (as she crosses off five strokes as shown below), and I'd count how many left.
\\\t\tt\'\1.~{\
I: And how many are left?
Carmel: I think eight ... (counts them) yeah, eight.
SN- Counting on by using tally marks
I: Can you explain it with pencil and paper?
Sharon: Yeah, I could draw five things like this (draws the first five objects as below), then see how many more . .. 6, 7, 8, 9, 10, 11, 12, 13 (as eight more objects are drawn).
1/1(/ !!IIIII! I: How does that show it?
Sharon: There's er ... there's eight more there.
SO - Matching sets
David: I could er ... draw thirteen stars and five stars (draws two sets as shown below), then ...
?~Jf-k~/· t+:X-x-k-x-+:+-¥ h- *- k-~Y-*
David:
I: Mtn
Yeah, then take these off (pairing one-to-one). So there's eight left.

Appendix 3 Independent Variables and Automatic Recall
Automatic Recall by Year Level (ANOVA)
Source DF Sum of Squares Mean Square F
Between Groups 4 19 020 4755 97
Within Groups 385 18 882 49 p < 0.00001
Total 389 37 902
Automatic Recall by Gender (ANOVA)
Source DF Sum of Squares Mean Square F
Between Groups 1 1 4 11 4
Within Groups 388 37 789 97 p = 0.280
Total 389 37 902
Gender Frequency Mean Std Dev Std Error
Males 198 29.0 10.0 0.7
Females 1 92 27.9 9.7 0.7
Automatic Recall by Home Language (ANOVA)
Source DF Sum of Squares Mean Square F
Between Groups 2 788 394 4
Within Groups 387 37 114 96 p = 0.017
Total 389 37 902

641 Basic Number Facts in Years 3-7
Automatic Recall by School Type (ANOVA)
Source DF Sum of Squares Mean Square F
Between Groups 1 336 336 3
Within Groups 388 37 566 97 p = 0.063
Total 389 37 902
School Type Frequency Mean Std Dev Std Error
Government 261 27.8 10.0 0.6
Non-Govt 129 29.8 9.5 0.8
Automatic Recall by School Size (Simple Regression)
DF R R2 Adjusted R2 Std Error
389 0.1 9.0E-3 6.4E-3 9.8
ANOVATable
Source DF Sum of Squares Mean Square F
Regression 1 341 341 3.5
Residual 388 37 561 97 p = 0.061
Total 389 37 902
Automatic Recall by Class Size (Simple Regression)
DF R R2 Adjusted R2 Std Error
389 3.8E-2 1.4E-3 1.1E-3 9.9
ANOVATable
Source DF Sum of Squares Mean Square F
Regression 1 55 55 0.6
Residual 388 37 847 98· p = 0.454
Total 389 37 902

Appendix 3 165
Automatic Recall by Family Size (Simple Regression)
OF · R R2 Adjusted R2 Std Error
389 0.1 2.2E-2 1.9E-2 9.8
ANOVATable
Source OF Sum of Squares Mean Square F-test
Regression 1 830 830 8.7
Residual 388 37 072 96 p = 0.003
Total 389 37 902

661 Basic Number Facts in Years 3-7
Effects of all Independent Variables on Automatic Recall
(Step-Wise Regression)
Eight X variables. Y variable is automatic recall of 40 basic number facts.
Step 1: Year Level entered.
DF R R2 Adjusted R2 Std Error
0.68 0.46 0.46 7.2
ANOVATable
Source DF Sum of Squares Mean Square F
Regression 1 17 545 17 545 334
Residual 388 20 357 52 p < 0.00001
Total 389 37 902
Step 2 (last step): Family Size entered.
DF R R2 Adjusted R2 Std Error
0.69 0.47 0.47 7.2
ANOVATable
Source DF Sum of Squares Mean Square F
Regression 2 17 885 8942 173
Residual 387 20 017 53 p < 0.00001
Total 389 37 902

Appendix 4 Independent Variables and Application of Automatic Recall
Applications of Automatic Recall by Year Level (ANOVA)
Source OF Sum of Squares Mean Square F-test
Between Groups 4 68 1 6 1 8
Within Groups 385 351 1 p < 0.00001
Total 389 417
Year Frequency Mean Std Oev Std Error
3 79 2.6 1. 2 0.1
4 8 1 3.0 1 . 1 0.1
5 78 3.4 0.9 0.1
6 74 3.3 1. 0 0.1
7 78 3.8 0.4 4.5E-2
Applications of Automatic Recall by Home Language (ANOVA)
Source OF Sum of Squares Mean Square F-test
Between Groups 2 2.1 1 . 1 1
Within Groups 387 415 1 . 1 p = 0.370
Total 389 417
Home Language Frequency Mean Std Oev Std Error
Only English 274 3.3 1. 0 0.1
Mostly English 80 3.2 1. 0 0.1
Mostly Non-Eng 36 3.0 1 .2 0.2

681 Basic Number Facts in Years 3-7
Applications of Automatic Recall by Family Size
(Simple Regression)
DF
389
Source
Regression
Residual
Total
R
0.1
DF
1
388
389
R2 Adjusted R2
1.5E-2 1.2E-2
ANOVATable
Sum of Squares Mean Square
6.3 6.3
411 1 . 1
417
Std Error
1. 0
F-test
5.9
p = 0.016
Effects of All Independent Variables on Applications of Automatic
Recall (Step-Wise Regression)
Eight X variables.
Y variable is applications of automatic recall of basic number facts
DF
Sum of Squares
61
356
417
Step 1 (last step): Year Level entered.
R R2 Adjusted R2
0.38 0.15 0.14
ANOVATable
Source DF Mean Square
Regression 1 6 1
Residual 388 0.9
Total 389
Std Error
0.96
F-test
67
p < 0.00001

Appendix 5 Independent Variables and Understanding Basic Facts
Understanding 24 + 6 = 4 by School Type, Year level and Home
language (Chi-Square Test)
Statistic School Type Year Level Home Language
DF 2 8 4
Total Chi-Square 11 . 9 59.1 1 6.1
p 0. 0026 0.0001 0.0029
G Statistic 12.2 61 . 1 13.7
Contingency Coefficient 0.2 0.4 0.2
Cramer's V 0.2 0.3 0.1
Understanding 13 - 5 = 8 by School Type, Year level and Home
language (Chi-Square Test)
Statistic School Type Year Level Home Language
DF 2 8 4
Total Chi-Square 12.8 35.6 1 0. 1
p 0. 001 7 0.0001 0.0393
G Statistic 14.4 8.3
Contingency Coefficient 0.2 0.3 0.2
Cramer's V 0.2 0.2 0.1
Understanding 13 - 5 = 8 by Class Size (ANOVA)
Source DF Sum of Squares Mean Square F-test
Between groups 2 157 78.5 4.8
Within Groups 387 6314 16.3 p = 0.0087
Total 389 6471


Appendix 6 Relationships Between Dependent Variables
Forty Basic Number Facts and Four Applications
(Simple Regression)
OF R R2 Adjusted R2
389 0.61 0.37 0.37
ANOVA Table
Source OF Sum of Squares Mean Square
Regression 154 154
Residual 388 263 0.68
Total 389 417
Forty Basic Number Facts and Understanding 24 + 6 = 4
Category of Understanding Frequency Mean Std Oev
Yes 234 32.2 7.7
Partially 100 26.2 9.0
No 56 16.6 9.0
Forty Basic Number Facts and Understanding 13 - 5 = 8
Category of Understanding Frequency Mean Std Oev
Yes 297 30.1 8.9
Partially 64 25.8 10.3
No 29 17.3 10.0
Std Error
0.82
F -test
227
p = 0.0001
(ANOVA)
Std Error
0.5
0.9
1. 2
(ANOVA)
Std Error
0.5
1. 3
1. 8

721 Basic Number Facts in Years 3-7
Four Applications and Understanding 24 + 6 = 4 (ANOVA)
Category of Understanding Frequency Mean Std Dev Std Error
Yes 234 3.5 0.8 0.1
Partially 100 3.1 1. 0 0.1
No 56 2.3 1. 3 0.2
Four Applications and Understanding 13 - 5 = 8 (ANOVA)
Category of Understanding Frequency Mean Std Dev Std Error
Yes 297 3.4 0.9 0.1
Partially 64 2.8 1 . 1 0. 1
No 29 2.4 1.3 0.2
Ten Basic Division Facts and Understanding 24 + 6 = 4 (ANOVA)
Category of Understanding Frequency Mean Std Dev Std Error
Yes 234 7.4 2.5 0.2
Partially 1 00 5.8 2.8 0.3
No 56 2.8 2.6 0.3
Ten Basic Subtraction Facts and Understanding 13 - 5 = 8 (ANOVA)
Category of Understanding
Yes
Partially
No
1\j qr, CJ l L 0
~7
L-
-/ '2
(; (\1'1
Frequency Mean Std Dev Std Error
297 7.4 2.7 0.2
64 6.3 2.9 0.4
29 4.2 2.8 0.5
tElJf\( ~ /l
EDITH COWAN UNIVERSITY
u IIIII I ~1111111 1=11=151813028