children in africa - unicef statistics · pdf file• pneumonia, malaria and diarrhoea...
TRANSCRIPT

© U
NIC
EF/
ETH
A_2
014_
0024
8/O
se
Prepared by: UNICEF Data & AnalyticsDivision of Data, Research and PolicyNovember 2015
Find the latest statistics on children in Africa at the UNICEF Statistics website: data.unicef.org
Number of births, by UNICEF region, 1950-2050
Source: UNICEF analysis based on the United Nations, Department of Economic and Social Affairs, Population Division, World Population Prospects: The 2015 Revision, United Nations, New York, 2015
Notes: (1) Maps in this brochure are stylized and not to scale. They do not reflect a position by UNICEF on the legal status of any country or territory or the deliminatation of any frontiers. The final boundary between the Republic of the Sudan and the Republic of South Sudan has not yet been determined. (2) Regional aggregates are calculated according to the regional classification of the African Union, unless otherwise noted.
• From 2015 onwards, sub-Saharan Africa is the region with the highest number of births, and this trend will persist for the rest of the century.
• By mid-century sub-Saharan Africa will account for 38 per cent of all births.
• Between 2015 and 2030 the number of children under 18 in sub-Saharan Africa will rise from 496 million to 661 million. From 2026 onwards sub-Saharan Africa will be the single region with the greatest number of children under 18.
The child population in Africa is burgeoning; by 2050, more than 1 in 3 children in the world will live in sub-Saharan Africa
KEY STATISTICS• In Africa, mortality rates among children under five
decreased by 54 per cent between 1990 and 2015, but still half of the world's 5.9 million under-five deaths occur in Africa.
• Pneumonia, malaria and diarrhoea account for 36% of all under-five deaths in Africa.
• Africa has the highest rate of stunting among under-fives; it is also the region with slowest progress in reducing stunting since 1990.
• In 2014, there were an estimated 2.3 million children under 15 years living with HIV in Africa.
• Over half of the world’s out-of-school children (33 million) live in Africa.
• The population in Africa with access to an improved drinking source more than doubled from 1990 to 2015.
• There has been major progress in the last decade in the use of insecticide-treated nets among children.
CHILDREN IN AFRICAKey statistics on child survival, protection and development
60
40
20
01950 1970 1990 2010 2030 2050
Births
(milli
ons)
CEE/CISEastern and Southern AfricaMiddle East and North AfricaSub-Saharan Arica
East Asia and PacificLatin America and CaribbeanSouth AsiaOtherWest and Central Africa

KEY FACTIn Africa, mortality rates among children under five (U5MR) have decreased by 54 per cent from 164 deaths per 1,000 live births in 1990 to 76 in 2015, but still half of the world's 5.9 million under-five deaths occur in Africa.
Globally, almost half of all under-five deaths are attributable to malnutrition
All regions in Africa have experienced marked declines in under-five mortality since 1990
Pneumonia, malaria and diarrhoea account for 36% of all under-five deaths in AfricaDistribution of under-five deaths in Africa by cause, 2015
Despite declining rates, neonatal deaths are growing as a share of under-five deaths, amid faster progress in reducing mortality from 1 to 59 monthsAge distribution of under-five deaths, Africa, 1990-2015
CHILD MORTALITY IN AFRICA
Source for all charts: UNICEF analysis based on UN IGME 2015 and WHO and Maternal and Child Epidemiology Estimation Group (MCEE) provisional estimates 2015
Under-five mortality rate by country (deaths per 1,000 live births) and number of under five deaths by sub-region, 2015
Under-five mortality rate, 1990-2015
≥ 25>25–50>50–75>75–100>100Data not available
Northern Africa 125,000
Western Africa 1,285,000
Eastern Africa697,000
Central Africa 529,000
Southern Africa 424,000
Northern Africa
Southern Africa
Eastern Africa
Western Africa
Central Africa
Africa
World
0 50 100 200150 250
1990 1995 2000 2010 20152005
19902015
74
169
153
207
17599
16476
9143
26
60
82
98
Child deaths(ages 1 to 4)
Neonatal deaths(first month)
27%
36%
Post-neonatal under-five deaths
(1-11 months)
Pneumonia (post-neonatal) (14%)Pneumonia (neonatal) (2%)
Other post-neonatal (13%)
Intrapartum-relatedcomplications
(post-neonatal) (1%)Measles (1%)
AIDS (3%)
Congenital abnormalities (post-neonatal) (3%)
Meningitis (2%)
Preterm birth complications
(post-neonatal) (2%)
Injuries (6%)Malaria (10%)
Diarrhoea (post-neonatal) (10%)
Diarrhoea (neonatal) (0%)
Congenital abnormalities (neonatal) (3%)
Other (neonatal) (2%)
Tetanus (1%)
Sepsis (6%)
Intrapartum-related complications (neonatal) (10%)
Preterm birth complications (11%)Pneumonia (17%)
Neonatal (36%)
Malaria (10%)
Diarrhoea (10%)
All other causes of death (31%)
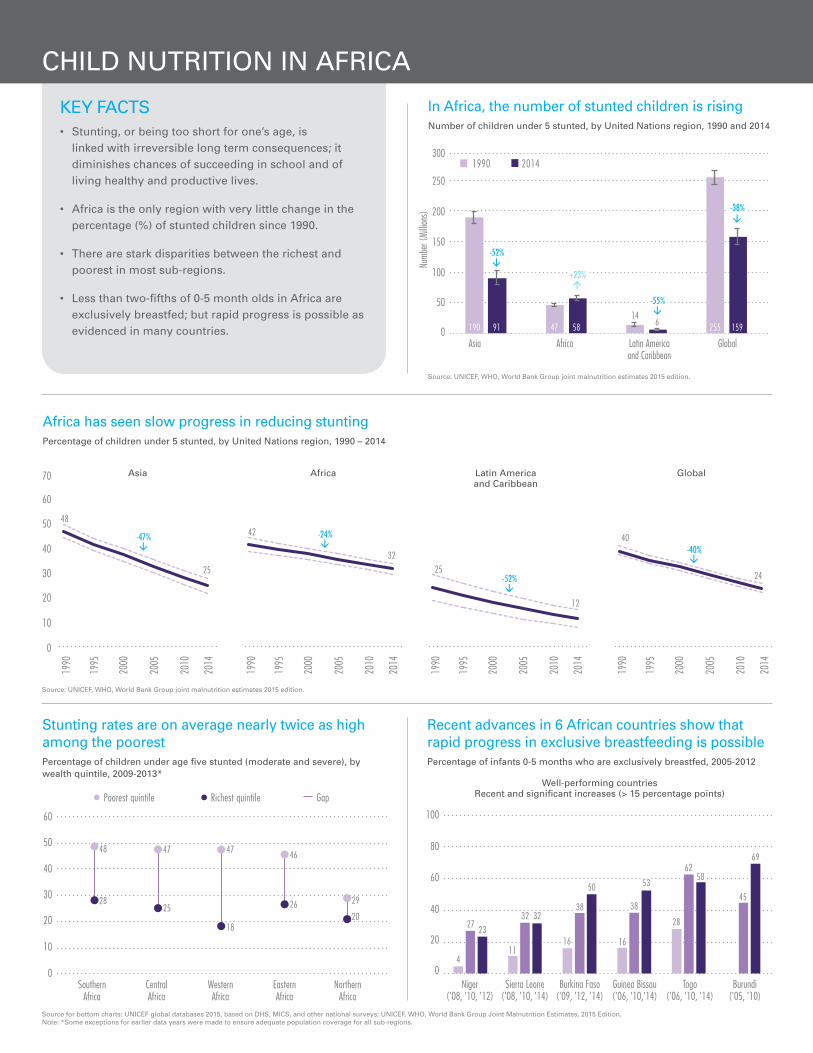
CHILD NUTRITION IN AFRICA
Source for bottom charts: UNICEF global databases 2015, based on DHS, MICS, and other national surveys; UNICEF, WHO, World Bank Group Joint Malnutrition Estimates, 2015 Edition. Note: *Some exceptions for earlier data years were made to ensure adequate population coverage for all sub-regions.
Source: UNICEF, WHO, World Bank Group joint malnutrition estimates 2015 edition.
Source: UNICEF, WHO, World Bank Group joint malnutrition estimates 2015 edition.
KEY FACTS• Stunting, or being too short for one’s age, is
linked with irreversible long term consequences; it diminishes chances of succeeding in school and of living healthy and productive lives.
• Africa is the only region with very little change in the percentage (%) of stunted children since 1990.
• There are stark disparities between the richest and poorest in most sub-regions.
• Less than two-fifths of 0-5 month olds in Africa are exclusively breastfed; but rapid progress is possible as evidenced in many countries.
Africa has seen slow progress in reducing stuntingPercentage of children under 5 stunted, by United Nations region, 1990 – 2014
Recent advances in 6 African countries show that rapid progress in exclusive breastfeeding is possiblePercentage of infants 0-5 months who are exclusively breastfed, 2005-2012
Well-performing countries Recent and significant increases (> 15 percentage points)
Asia Latin Americaand Caribbean
Africa Global
100
80
60
20
40
0Niger
('08, '10, '12)Burkina Faso
('09, '12, '14)Togo
('06, '10, '14)Sierra Leone
('08, '10, '14)Guinea Bissau('06, '10,'14)
Burundi('05, '10)
11
38
58
45
16
38
2732 32
50
6269
53
23
4
16
28
Southern Africa
60
30
40
0
50
10
20
Western Africa
Central Africa
Eastern Africa
Northern Africa
GapRichest quintilePoorest quintile
Stunting rates are on average nearly twice as high among the poorestPercentage of children under age five stunted (moderate and severe), by wealth quintile, 2009-2013*
48
28
47 47 46
29
2026
18
25
In Africa, the number of stunted children is risingNumber of children under 5 stunted, by United Nations region, 1990 and 2014
250
200
150
50
100
0Asia Africa Latin America
and CaribbeanGlobal
300
Numb
er (M
illion
s)
1990 2014
190 91
-52%
-55%
+23%
-38%
47 25514
58 1596
1990
1995
2000
2005
2010
2014
1990
1995
2000
2005
2010
2014
1990
1995
2000
2005
2010
2014
1990
1995
2000
2005
2010
2014
60
30
40
0
50
10
20
70
-47% -24%
-52%
-40%
4842
25
40
25
32
12
24

Western Africa
Eastern Africa
Northern Africa
Southern Africa
Eastern Africa
Western Africa
Central Africa
Central Africa
Africa
Africa
Southern Africa
Northern Africa
World
World
100
80
60
20
40
0
52
91
43
52
75
MATERNAL HEALTH IN AFRICA
IMPROVEMENT IN MATERNAL HEALTH OUTCOMES REQUIRES KEY INTERVENTIONS:• A minimum of four visits for quality antenatal care
in order to ensure the well-being of the mother and the baby
• Quality intra- and post-partum care with skilled health personnel
• Improved access to emergency obstetric care
• Expanded access to information, counseling and supplies for a wide range of contraceptive methods
• Antiretroviral therapy to all pregnant women who need it
• In malaria endemic countries, provision of intermittent preventive treatment of malaria and ITNs to all pregnant women during antenatal visits
Most pregnant women access skilled antenatal care at least once, but only about half receive the recommended minimum of four antenatal care visitsAntenatal care: Percentage of women aged 15-49 years attended at least once during pregnancy by skilled health personnel (doctor, nurse or midwife), and percentage attended by any provider at least four times 2010-2015*
Skilled delivery care coverage is higher in urban than in rural areasSkilled attendance at birth: Percentage of births attended by skilled health personnel by area of residence, 2010-2015*
About half of all births in Africa are assisted by skilled health personnelSkilled attendance at birth: Percentage of births attended by skilled health personnel, 2010-2015
Africa has the highest number of maternal deaths, despite steady declines since 1990• Globally, the maternal mortality ratio (MMR) declined from 385 maternal deaths per 100,000 live births in 1990 to 216 in 2015
• In sub-Saharan Africa the MMR was 546 per 100,000 live births in 2015, a 45% decline from 987 in 1990.
• Sub-Saharan Africa accounted for 201,000 maternal deaths in 2015, 66 per cent of the global total, largely due to limited access to emergency obstetric care and insufficient maternal care during pregnancy and delivery.
Note: The World estimate for ANC 4 excludes China, for which comparable data are not available.
Source for all charts: UNICEF global databases 2015, based on DHS, MICS, and other national surveys.
<30%31 -49%50 -69%70 -89%>90%Data no t ava i l ab l e
% b i r t h s a t t ended by sk i l l ed hea l t h pe r sonne l
100
80
60
20
40
0
UrbanRural
71
3341
80
88
64
59
90
97
8983
47
61
89
73
84
47
94
55
79
61
ANC 1 ANC 4
8578

CHILD MARRIAGE, BIRTH REGISTRATION AND FEMALE GENITAL MUTILATION/CUTTING (FGM/C) IN AFRICA
Source for all charts: UNICEF global databases 2015, based on DHS, MICS, other national surveys, censuses and vital registration systems.
Countries with high levels of child marriage tend to have high levels of early childbearingPercentage of women aged 20-24 years who were first married or in union before age 18, and who gave birth before age 18, African countries, 2005-2013
A third of young women in Africa were married or in union before age 18Percentage of women aged 20-24 years who were first married or in union before age 18, 2003-2014
Above 80%51 – 80%26 – 50%10 – 25%Less than 10%FGM/C is not concentrated in these countries
FGM/C is concentrated in a swath of countries from the Atlantic Coast to the Horn of AfricaPercentage of girls and women aged 15-49 years who have undergone FGM/C, 2004-2014
• In half of the countries, the majority of girls underwent FGM/C before age 5. In the rest of the countries, most cutting occurs between ages 5 and 14.
• In most countries where FGM/C is concentrated, the majority of women and men think it should end.
• In nearly all countries where the practice is concentrated, traditional practitioners perform most of the procedures.
Less than 10%10 – 25%26 – 50%51 – 80%Above 80%FGM/C is not concentrated in these countries
Western Africa
Eastern Africa
Central Africa
Southern Africa
Northern Africa
Africa
World
0 10 20 4030 50
Each dot represents a country60
40
20
200 6040 80
Wom
en w
ho g
ave
birth
by a
ge 1
8
Women first married or in union by age 18
100
80
60
20
40
0Eastern Africa Western AfricaCentral Africa Southern Africa Northern Africa
Levels of birth registration vary widely across the different regions of Africa but also between countries within the same regionPercentage of children under age five whose births are registered, and countries with the highest and lowest levels, 2005-2013
Percentage of children under age five whose births are registered, 2005-2014
Less than 25%25 – 50%51 – 75%76 – 90%Above 90%Data not available
Less than 25%25 – 50%51 – 75%76 – 90%Above 90%Data not available
Regional average Country with the lowest birth registration level
Country with the highest birth registration level

EDUCATION IN AFRICA
Source for all charts: UNICEF global databases 2015, based on DHS, MICS, and other national surveys; UNESCO Institute for Statistics databases 2015; Education for All Global Monitoring Report 2013/14.
KEY FACTS• Over half of the world’s out-of-school children
(33 million) live in Africa.
• Girls are more likely to be out of school than boys.
• The majority of African countries have not achieved universal primary education.
• Progress in reducing the out-of-school children population has slowed down since 2007.
• Many children fail to complete a full primary education and fail to master basic literacy and numeracy skills.
Progress in primary enrolment has stagnated in recent yearsPrimary school adjusted net enrolment rate (%) and out-of-school population of primary school age (millions) in Africa by sex, 2000-2013
In Africa, boys are more likely to be enrolled in primary school than girlsGender parity index of primary enrolment, girls as a percentage of boys, African countries, 2009-2012
Only fifteen African countries are near achieving universal primary educationNet enrolment/attendance rate, 2009-2014
Many African countries face the double challenge of non-completion and low learning performancePercentage of cohort who reached grade 4 and achieved a minimal level of learning in reading, 2004-2012
Less than 85%85 – 94%95% or higherData not available
Each dot represents the GPI of one country
0
0.6
0.7
0.8
0.9
1.0
1.1
1.2
Swaz
iland
U. R
. Tan
zania
Mauri
tius
Seyc
helle
sBo
tswan
aNa
mibia
Keny
aGa
bon
Leso
thoUg
anda
Moza
mbiqu
eCa
meroo
nZa
mbia
Malaw
iLib
eria
Burun
diTo
goSe
nega
lCo
ngo
Burki
na Fa
soCô
te d'
Ivoire Mali
Benin Chad
Mada
gasca
rNi
ger
100
80
60
20
40
Did not reach grade 4 Reached grade 4 but did not learn the basics
Out-of-school boys of primary school age
Out-of-school girls of primary school age
Reached grade 4 and learned the basics
Adjusted primary net enrolment rate for girls
Adjusted primary net enrolment rate for boys
Adjusted primary net enrolment rate total
Girls more likely to be enrolled
Boys more likely to be enrolled
Parity
2000 2005 20112001 2006 20122002 2007 20132003 2008 20142004 20102009 2015
Adjus
ted
net e
nrolm
ent r
ate
(%)
Out-of-school population of primary school age (millions)
80
60
30
70
40
0
50
10
20
100
90
80
60
30
70
40
0
50
10
20
100
90
Progress needed to achieve the MDG target

32
HIV/AIDS AND MALARIA IN AFRICA
Source: UNICEF global databases 2015, based on DHS, MICS, and other national surveys
Major progress during the last decade in the use of Insecticide Treated Nets (ITNs) among childrenPercentage of children under age five sleeping under ITNs in Africa, 1999-2007 and 2010-2015
Malaria case management in endemic countries
• The estimated proportion of children sleeping under ITNs in sub-Saharan Africa increased from less than 2 per cent in 2000 to 68 per cent in 2015.
• Mass campaigns for distribution of ITNs are used to ensure that everyone is reached.
• Use of diagnostic tests to confirm malaria before starting antimalarial treatment is low.
• In most endemic countries, less than 50 per cent of febrile children under-five who receive anti-malarials are treated with artemisinin-based combination therapy (ACT), the recommended first line antimalarial drug.
1999-2007 2010-2015
Less than 10%10 – 19%20 – 29%30 – 49%50 – 79%Not malaria endemicData not available
100
80
60
20
40
0ARVs for PMTCT Paediatric ART
KEY FACTS• Although progress has been made in Africa to increase
the prevention of mother to child transmission (PMTCT) of HIV and increasing pediatric anti-retroviral therapy (ART) coverage, much more progress is needed.
• In 2014, around 190,000 children were newly infected with HIV in Africa.
• Across sub-Saharan Africa, about 3% of all under-five deaths are caused by AIDS, and in some Southern African countries, over 10% of under-five deaths are attributed to AIDS.
• Although some progress has been made across all regions of Africa, coverage of ARVs for PMTCT varied significantly, ranging from 25% [17-40%] in Northern Africa to 92% [82->95%]in Southern Africa
Note: ART coverage is based on the estimated unrounded number of all children living with HIV receiving ART. UNAIDS recommends using the denominator of all children living with HIV and not just those eligible for ART based on 2013 WHO eligibility HIV treatment criteria.Source: UNAIDS, UNICEF, WHO 2015 Global AIDS Response Progress Reporting; UNAIDS 2014 HIV and AIDS estimates, July 2015.
An estimated 2.3 million children under 15 years were living with HIV in Africa as of 2014; nearly 10 per cent of which were newly infected, mainly through mother-to-child transmission of HIVPercentage of pregnant women living with HIV receiving most effective ARVs for PMTCT and percentage of children aged 0-14 years living with HIV receiving ART, 2014
Northern AfricaWestern AfricaCentral AfricaEastern AfricaSouthern AfricaAll Africa
13
41
30
12
25
39
52
8175
92
39

Western Africa
(Cov
erage
%)
Central Africa
Eastern Africa
Southern Africa
AfricaNorthern Africa
100
80
60
20
40
0
KEY FACTS• Drinking water coverage in
Africa increased from 55% in 1990 to 72% in 2015.
• The rate of progress was not sufficient to meet the continent’s MDG drinking water target of 78%.
• Just over a quarter (26%) of the African population enjoys the convenience and associated health benefits of a piped drinking water supply on premises.
• The population without access to an improved drinking water source increased from 283 million in 1990 to 332 million in 2015.
KEY FACTS• Open defecation rates in
Eastern Africa declined most from 45% in 1990 to 20% in 2015.
• Western and Central Africa made the least progress on sanitation.
• In Southern Africa 18% of the population still practices open defecation.
• Angola, Benin, Ethiopia, Guinea, Malawi and Morocco registered declines in open defecation rates of 25 percentage points or more since 1990. Djibouti, Nigeria, Sierra Leone and Tanzania registered an increase in open defecation rates.
DRINKING WATER AND SANITATION IN AFRICA
The population with access to an improved drinking water source in Africa more than doubled, from 347 million in 1990 to 834 million in 2015Improved drinking water coverage, African countries, 2015 (%)
In Africa only 39% of the population uses an improved sanitation facility; the population without access grew by 292 million despite 245 million people gaining access since 1990Sanitation coverage trends in Africa, by sub-region (bars) and by area of residence (area), 1990-2015
Source for all charts: WHO/UNICEF Joint Monitoring Programme for Water Supply and Sanitation (JMP)
ND = No data
1990 2015
Improved facilities Shared facilities Unimproved facilities Open defecation
26 2514
25 2431
37
48
90
3339
70
Cabo Verde
Gambia
Ghana
Burkina Faso
Côte d'Ivoire
Senegal
Guinea-Bissau
Benin
Guinea
Mali
Liberia
Nigeria
Togo
Sierra Leone
Niger
92
90
89
82
82
79
79
78
77
77
76
69
63
63
58
Western Africa
100
96
90
79
76
63
59
57
56
52
ND
ND
ND
ND
Eastern Africa
Mauritius
Seychelles
Djibouti
Uganda
Rwanda
Kenya
South Sudan
Ethiopia
Tanzania
Madagas car
Comoros
Eritrea
Somalia
Sudan
96
93
91
90
82
77
74
65
51
49
Botswana
South Africa
Namibia
Malawi
Lesotho
Zimbabwe
Swaziland
Zambia
Mozambique
Angola
Southern Africa Central Africa
99
98
85
84
58
ND
Egypt
Tunisia
Morocco
Algeria
Mauritania
Libya
Northern Africa
97
93
76
76
76
68
52
51
ND
Sao Tome and Principe
Gabon
Congo
Burundi
Cameroon
Central Afric an Republic
Democratic Republic of the Congo
Chad
Equatorial Guinea
1990 2015
1990 2015
(Milli
ons)
(Milli
ons)
241107
212
203
30
101
186
14Urban
Rural