child welfare key indicators monthly...
TRANSCRIPT
Child Welfare Key Indicators
Monthly Report April 2016
Office of Child Welfare Performance and Quality Management
A Results-Oriented Accountability Report
April 29, 2016
i
Table of Contents
Executive Summary ........................................................................................................................................... 1
Map of DCF Regions, Circuits, Counties, and CBC Lead Agencies ................................................................... 2
Florida Abuse Hotline: Workload Trends ............................................................................................................ 3
Reporting Method Trends............................................................................................................................... 3
Screening Decision Trends – Maltreatment Screening ................................................................................... 3
Screening Decision Trends – Special Conditions Screening .......................................................................... 4
Florida Abuse Hotline: Timeliness Trends .......................................................................................................... 4
Average and Maximum Times to Answer or Abandon .................................................................................... 4
Percent of Calls Abandoned ........................................................................................................................... 5
Average Handling Time by Talk Time and After-Call Work Trends ................................................................. 5
Florida Abuse Hotline: Workforce ...................................................................................................................... 6
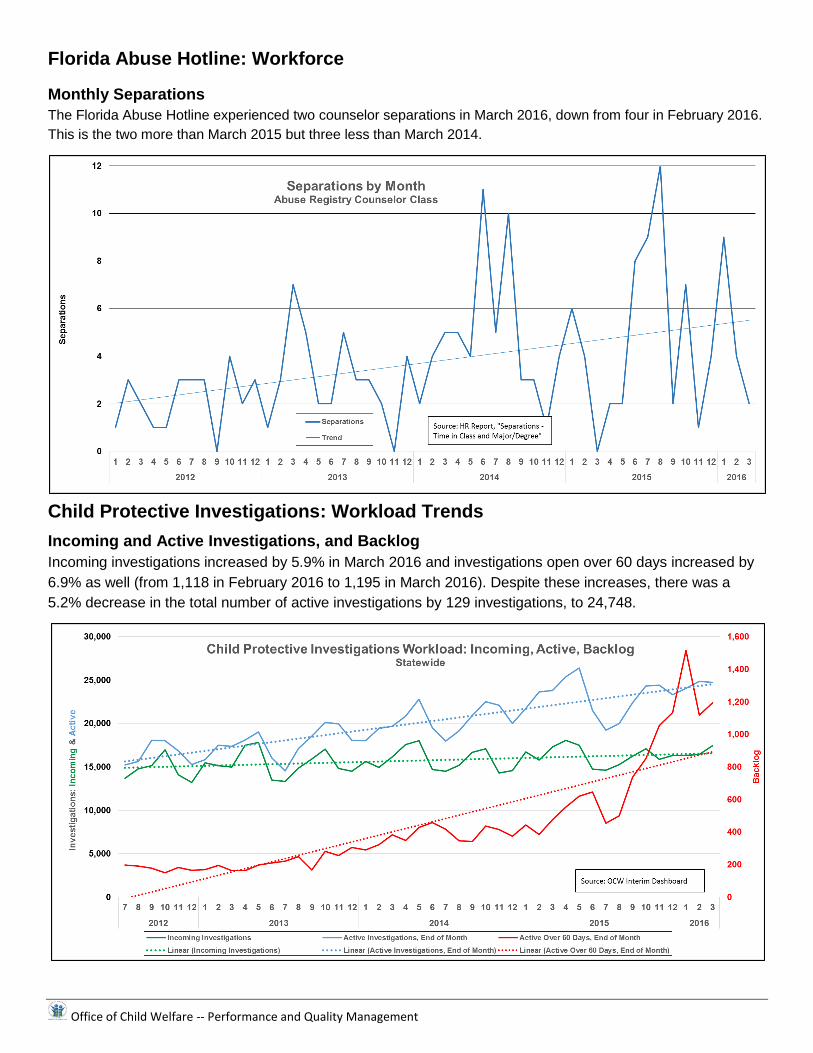
Monthly Separations ...................................................................................................................................... 6
Child Protective Investigations: Workload Trends .............................................................................................. 6
Incoming and Active Investigations, and Backlog ........................................................................................... 6
Child Protective Investigations: Timeliness ........................................................................................................ 7
Percent Child Investigations Completed within 60 Days: Trend ...................................................................... 7
Stratification by Circuit and Sheriff’s Office ..................................................................................................... 7
Alleged Child Victims Seen ............................................................................................................................ 8
Stratification by DCF Circuit and Sheriff’s Office ............................................................................................ 8
Child Protective Investigations: Safety ............................................................................................................... 9
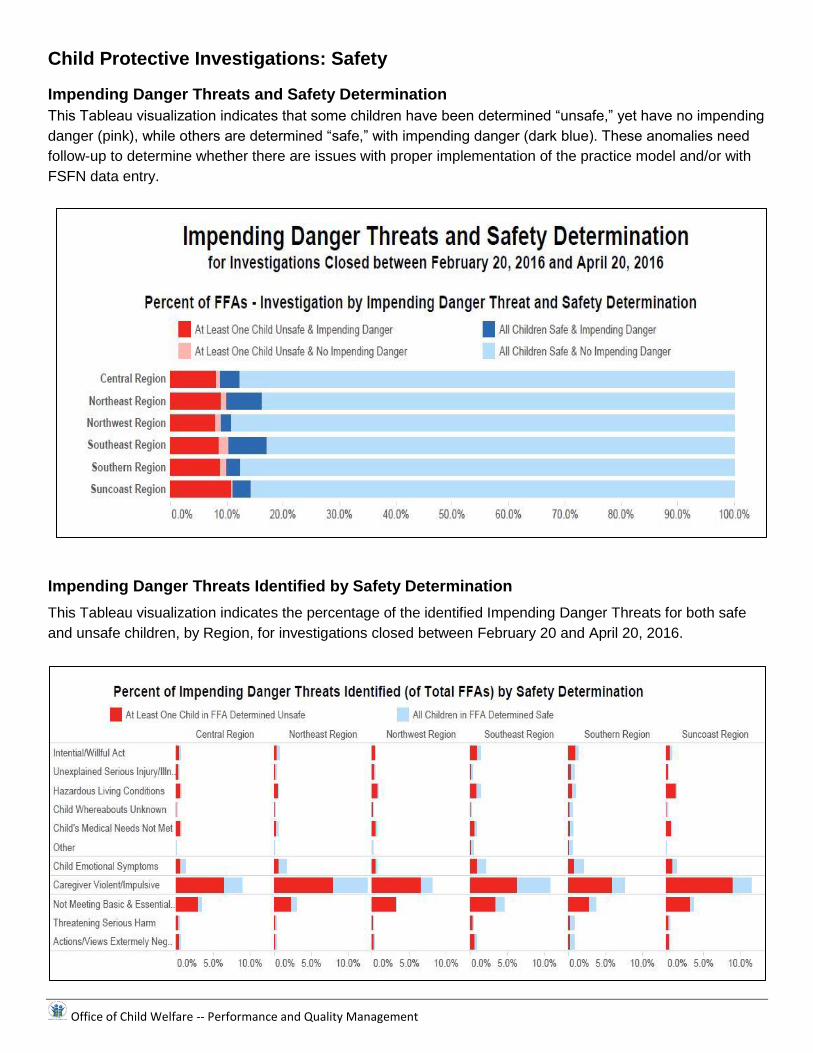
Impending Danger Threats and Safety Determination .................................................................................... 9
Impending Danger Threats Identified by Safety Determination ....................................................................... 9
Safety Determination, Services Provided at Investigative Closure and Unsafe Children by Service Type .... 10
Unsafe Children with No Services or Family Support Services ..................................................................... 10
Recurrence of Maltreatment Trend ............................................................................................................... 11
Stratification by Circuit and Sheriff’s Office ................................................................................................... 11
Child Protective Investigations: Workforce ....................................................................................................... 12
Monthly Separations .................................................................................................................................... 12
Time in Classification ................................................................................................................................... 12
Office of Child Welfare -- Performance and Quality Management ii
Flow from CPI to Community-Based Care Lead Agencies: Removals ............................................................. 13
Removals and Removal Rate Trend ............................................................................................................ 13
Quarterly Stratification by Circuit and Sheriff’s Office ................................................................................... 13
Quarterly Stratification by Circuit/CBC Lead Agency .................................................................................... 14
Community-Based Care Lead Agencies: In-Home and Out-of-Home Services ................................................ 14
Children Receiving Services In-Home and Out-of-Home .............................................................................. 14
Children Receiving Services In-Home and Out-of-Home: Stratification by CBC Lead Agency ...................... 15
Community-Based Care Lead Agencies: Removals, Discharges and Placements ........................................... 15
Removals and Discharges for Children in Out-of-Home Care ...................................................................... 15
...................................................................................... 16 Placement Type for Children in Out-of-Home Care
Community-Based Care Lead Agencies: Ongoing Services Safety Methodology Implementation Map ........... 16
Community-Based Care Lead Agencies: Safety .............................................................................................. 17
Child Safety While Receiving Case-Managed In-Home Services: Stratification by CBC Lead Agency ......... 17
Child Safety While in Out-of-Home Care: Stratification by CBC Lead Agency .............................................. 17
Child Safety after Termination of Services: Stratification by Circuit/CBC Lead Agency ................................ 18
Child Safety after Termination of Family Support Services: Stratification by CBC Lead Agency ................... 18
Child Safety Trends: Comparison of Three Indicators Over Time ................................................................. 19
Community Based Care Lead Agencies: Permanency ..................................................................................... 19
Permanency within 12 Months of Removal: Stratification by CBC Lead Agency .......................................... 19
Permanency within 12 Months for Children in Care 12-23 Months: Stratifications by CBC Lead Agency ..... 20
Permanency within 12 Months for Children in Care 24+ Months: Stratification by CBC Lead Agency .......... 20
Re-Entry of Children into Care within 12 Months: Stratification by CBC Lead Agency .................................. 21
Community-Based Care Lead Agencies: Well-Being ....................................................................................... 21
Placement Stability: Stratification by CBC Lead Agency .............................................................................. 21
Placement of Sibling Groups Together: Stratification by CBC Lead Agency ................................................. 22
Children Placed Outside Removal County: Stratification by CBC Lead Agency ........................................... 22
Children Placed Outside Removal Circuit: Stratification by CBC Lead Agency ............................................. 23
Children 0-5 Placed in Group Care: Stratification by CBC Lead Agency ...................................................... 23
Children 6-12 Placed in Group Care: Stratification by CBC Lead Agency .................................................... 24
Children 13-17 Placed in Group Care: Stratification by CBC Lead Agency .................................................. 24
Children 0-17 Placed in Group Care: Stratification by CBC Lead Agency .................................................... 25
Children Receiving Dental Services in Last Seven Months: Stratification by CBC Lead Agency .................. 25
Young Adults Aging Out Who Are Enrolled in Education Programs: Stratification by CBC Lead Agency ...... 26
Community-Based Care Agencies: Quality ...................................................................................................... 26
Office of Child Welfare -- Performance and Quality Management iii
CBC Rapid Safety Feedback ....................................................................................................................... 26
Human Trafficking ........................................................................................................................................... 27
Human Trafficking Intakes Trend ................................................................................................................. 27
Children with a FSFN Indicator of Being a Human Trafficking Victim: Stratification by CBC Lead Agency ... 27
Child Care Regulations .................................................................................................................................... 28
Child Care Inspections per Month ................................................................................................................ 28
Domestic Violence ........................................................................................................................................... 28
Percent Victims Leaving Shelter with a Family Safety and Security Plan ..................................................... 28
1
Executive Summary
The Child Welfare Key Indicators Monthly Report presents key outcome, process, qualitative, workload, and resource
indicators that are designed to provide a general overview of the current state of Florida's child welfare system.
Florida Abuse Hotline
Although total contacts to the Hotline during March 2016 (45,244) increased by 6.2% compared to February 2016, the
total was 15.4% less than the total for March 2015. The percentage of child maltreatment reports accepted by the Hotline
decreased from 79.5% in February to 79.3% in March 2016, which also represents an extremely small (.4%) decrease
compared to March 2015. The number of abandoned calls during March increased in comparison to February on both the
English-language and Spanish-language phone lines, particularly on the Spanish line (24.9% to 33.4%). The average wait
time before answer decreased by eight seconds (6:37) while average delay before abandonment increased by 11
seconds (4:04). The maximum wait time before answer decreased from 40:41 to 31:00, while maximum delay before
answer increased significantly to just under one hour, at 59:59 (which could represent only one call with such an extreme
delay).
Child Protective Investigations
Workload. Active child investigations on March 31, 2016 were 24,748 as compared to 24,032 on February 29, 2016.
Active investigations over 60 days increased from 1,118 to 1,195 (a 6.9% increase).
Timeliness. The statewide percent of victims seen within 24 hours increased minimally to 92% on March 31, and
investigations completed within 60 days increased from 90% to 92.7%, which is the third consecutive monthly
improvement for timely completions.
Recurrence. Recurrence of maltreatment within 12-months decreased minimally, from 9.8% to 9.3%., which does not
meet the national standard of 9.1% or less.
Removals and Out-of-Home Care Population. 1,243 removals occurred in March 2016, which is a decrease for the
second consecutive month. There were 22,876 children in out-of-home care on March 31, 2016 as compared to 21,129
on March 31, 2015 which is an increase of 8.7%.
Community-Based Care Lead Agencies
Child Safety Trends. Statewide, the overall percentage of children with no verified maltreatment within six months of
termination of family support services decreased slightly to 94.1% for children terminated between April 1 and June, 2015,
as compared to 94.2% for children terminated between January 1 and March 30, 2015.
Permanency. Florida’s current rate of 43% of children achieving permanency within 12 months of removal exceeds the
national standard of 40.5%. Performance remains high for children achieving permanency within 12-23 months and 24+
months, with each exceeding the national standards by 11.5% and 11.2%, respectively.
Placement Stability. Statewide, for children entering care between January 1 and December 31, 2015, Florida exceeds
the national standard of 4.12 or less for child moves per 1,000 days in care, at only 3.8 moves.
Sibling Groups. For children who are part of a sibling group, 63.6% statewide were placed together as of March 31,
2016.
Placement in Removal County and Circuit. Of children in licensed care statewide, 37% were placed outside of their
removal county whereas 20.3% were placed outside their removal circuit, both as of March 31, 2016.
Group Care. There are three circuits which have in excess of 10% of children ages five and under in licensed care who
are placed in group care placements, compared to 3.7% statewide.

Office of Child Welfare -- Performance and Quality Management 2
Map of DCF Regions, Circuits, Counties, and CBC Lead Agencies
Office of Child Welfare -- Performance and Quality Management 3
Florida Abuse Hotline: Workload Trends
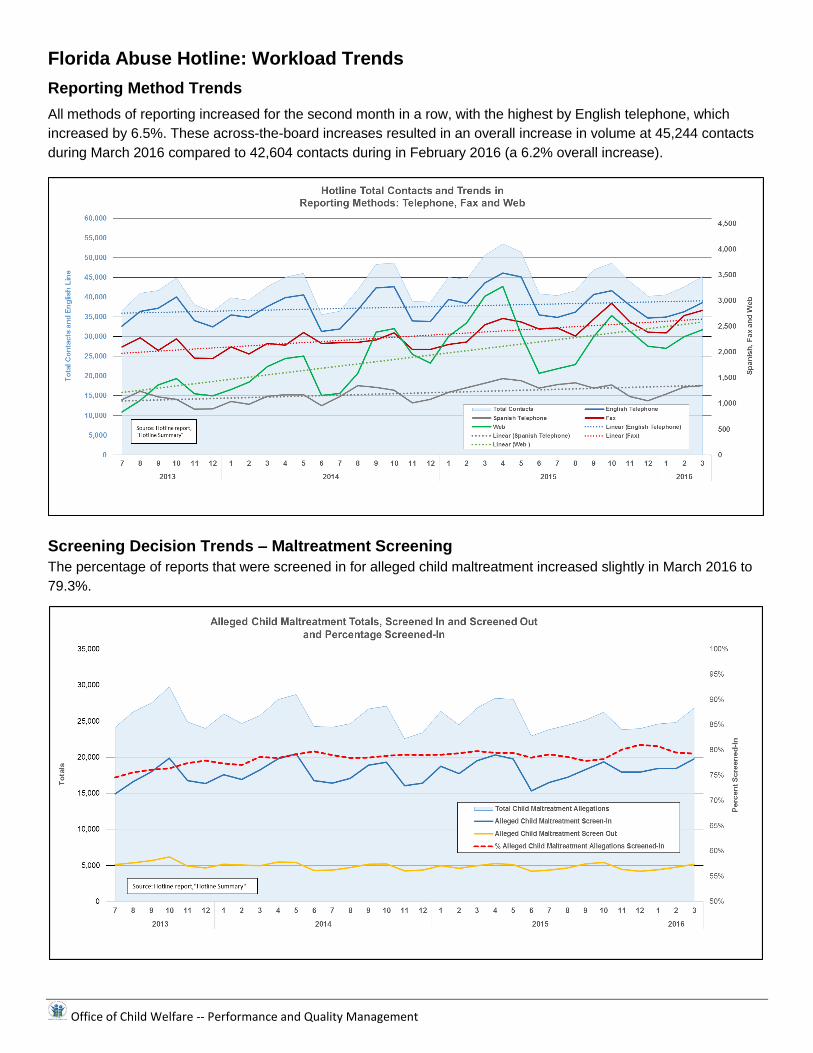
Reporting Method Trends
All methods of reporting increased for the second month in a row, with the highest by English telephone, which
increased by 6.5%. These across-the-board increases resulted in an overall increase in volume at 45,244 contacts
during March 2016 compared to 42,604 contacts during in February 2016 (a 6.2% overall increase).
Screening Decision Trends – Maltreatment Screening
The percentage of reports that were screened in for alleged child maltreatment increased slightly in March 2016 to
79.3%.
Office of Child Welfare -- Performance and Quality Management 4
Florida Abuse Hotline: Workload Trends
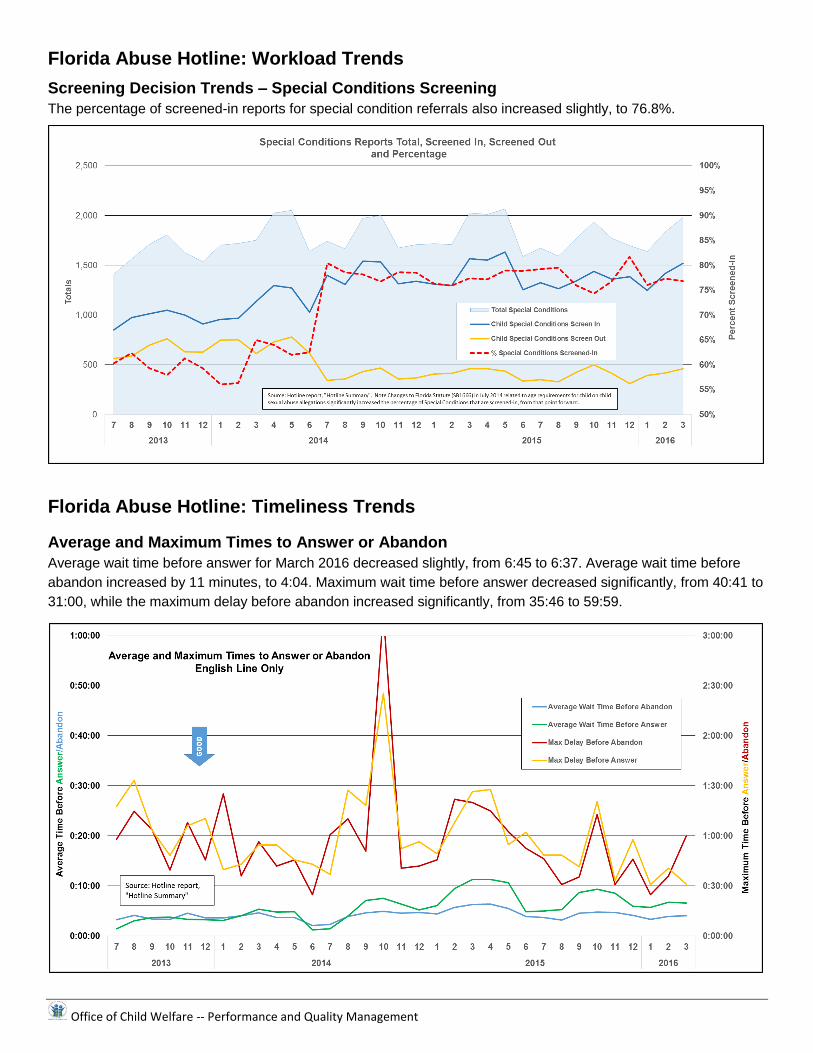
Screening Decision Trends – Special Conditions Screening
The percentage of screened-in reports for special condition referrals also increased slightly, to 76.8%.
Florida Abuse Hotline: Timeliness Trends
Average and Maximum Times to Answer or Abandon
Average wait time before answer for March 2016 decreased slightly, from 6:45 to 6:37. Average wait time before
abandon increased by 11 minutes, to 4:04. Maximum wait time before answer decreased significantly, from 40:41 to
31:00, while the maximum delay before abandon increased significantly, from 35:46 to 59:59.
Office of Child Welfare -- Performance and Quality Management 5
Florida Abuse Hotline: Timeliness Trends
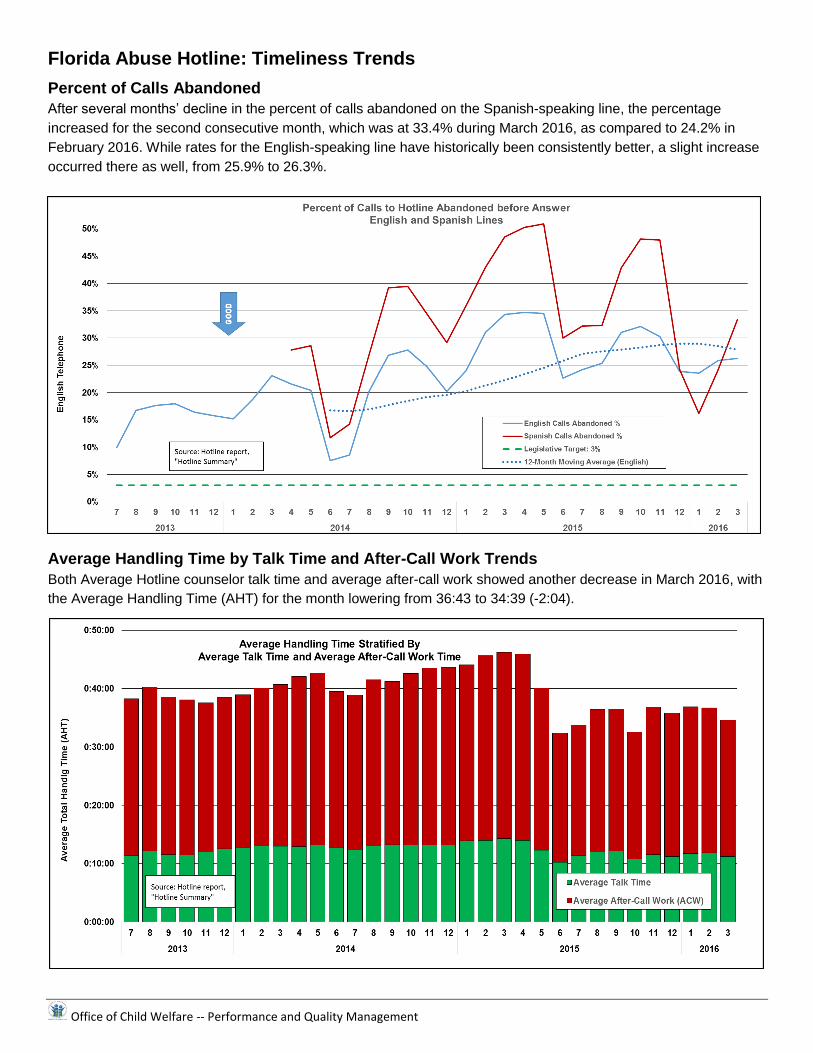
Percent of Calls Abandoned
After several months’ decline in the percent of calls abandoned on the Spanish-speaking line, the percentage
increased for the second consecutive month, which was at 33.4% during March 2016, as compared to 24.2% in
February 2016. While rates for the English-speaking line have historically been consistently better, a slight increase
occurred there as well, from 25.9% to 26.3%.
Average Handling Time by Talk Time and After-Call Work Trends
Both Average Hotline counselor talk time and average after-call work showed another decrease in March 2016, with
the Average Handling Time (AHT) for the month lowering from 36:43 to 34:39 (-2:04).
Office of Child Welfare -- Performance and Quality Management 6
Florida Abuse Hotline: Workforce
Monthly Separations
The Florida Abuse Hotline experienced two counselor separations in March 2016, down from four in February 2016.
This is the two more than March 2015 but three less than March 2014.
Child Protective Investigations: Workload Trends
Incoming and Active Investigations, and Backlog
Incoming investigations increased by 5.9% in March 2016 and investigations open over 60 days increased by
6.9% as well (from 1,118 in February 2016 to 1,195 in March 2016). Despite these increases, there was a
5.2% decrease in the total number of active investigations by 129 investigations, to 24,748.

Office of Child Welfare -- Performance and Quality Management 7
Child Protective Investigations: Timeliness
Percent Child Investigations Completed within 60 Days: Trend
Statewide, 92.7% of child protective investigations initiated in January 2016 were completed within 60 days as
of April 20, 2016. This is a .7% increase in comparison to closures during February 2016 for reports received in
December 2015.
Stratification by Circuit and Sheriff’s Office
The majority of circuits and sheriff’s offices closed more than 95% of investigations received during January
2016 within 60 days, with statewide performance being at 92.7%.

Office of Child Welfare -- Performance and Quality Management 8
Child Protective Investigations: Timeliness
Alleged Child Victims Seen
The percent of victims seen has been on a very gradual upward trend since November 2015, and increased by
another tenth of a percent to 92% in March 2016.
Stratification by DCF Circuit and Sheriff’s Office
Office of Child Welfare -- Performance and Quality Management 9
Child Protective Investigations: Safety
Impending Danger Threats and Safety Determination
This Tableau visualization indicates that some children have been determined “unsafe,” yet have no impending
danger (pink), while others are determined “safe,” with impending danger (dark blue). These anomalies need
follow-up to determine whether there are issues with proper implementation of the practice model and/or with
FSFN data entry.
Impending Danger Threats Identified by Safety Determination
This Tableau visualization indicates the percentage of the identified Impending Danger Threats for both safe
and unsafe children, by Region, for investigations closed between February 20 and April 20, 2016.
Office of Child Welfare -- Performance and Quality Management 10
Child Protective Investigations: Safety
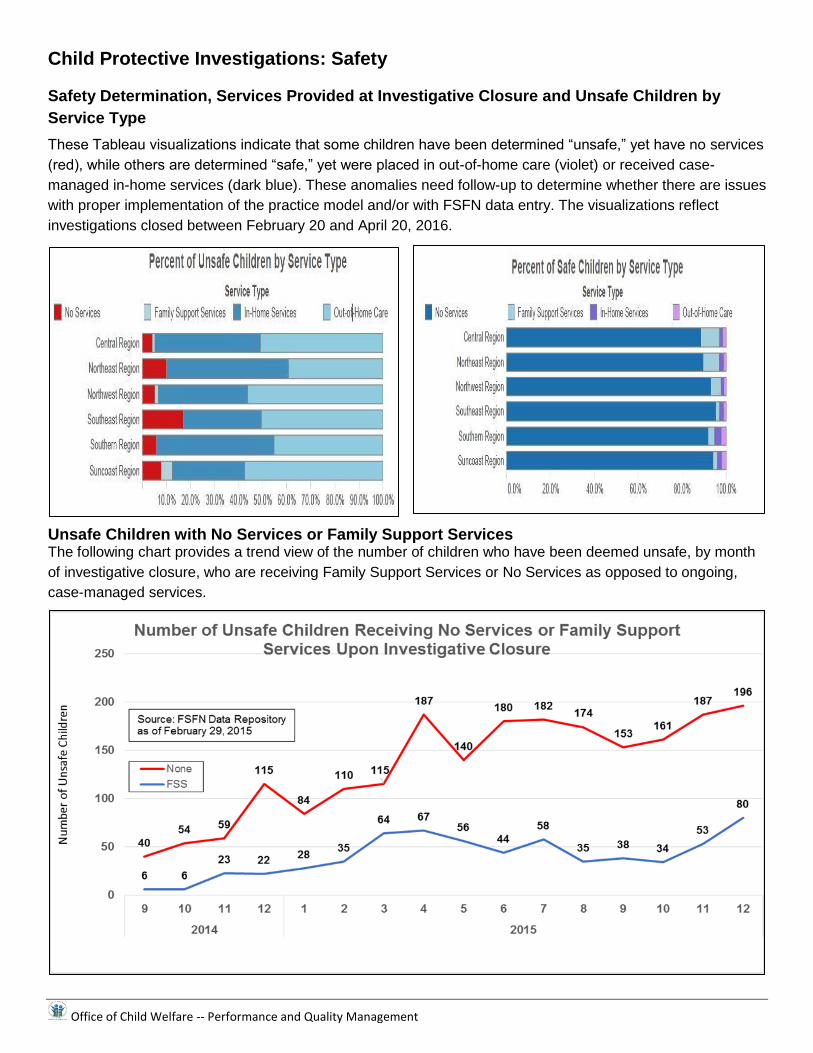
Safety Determination, Services Provided at Investigative Closure and Unsafe Children by
Service Type
These Tableau visualizations indicate that some children have been determined “unsafe,” yet have no services
(red), while others are determined “safe,” yet were placed in out-of-home care (violet) or received case-
managed in-home services (dark blue). These anomalies need follow-up to determine whether there are issues
with proper implementation of the practice model and/or with FSFN data entry. The visualizations reflect
investigations closed between February 20 and April 20, 2016.
Unsafe Children with No Services or Family Support Services The following chart provides a trend view of the number of children who have been deemed unsafe, by month
of investigative closure, who are receiving Family Support Services or No Services as opposed to ongoing,
case-managed services.
Office of Child Welfare -- Performance and Quality Management 11
Child Protective Investigations: Safety
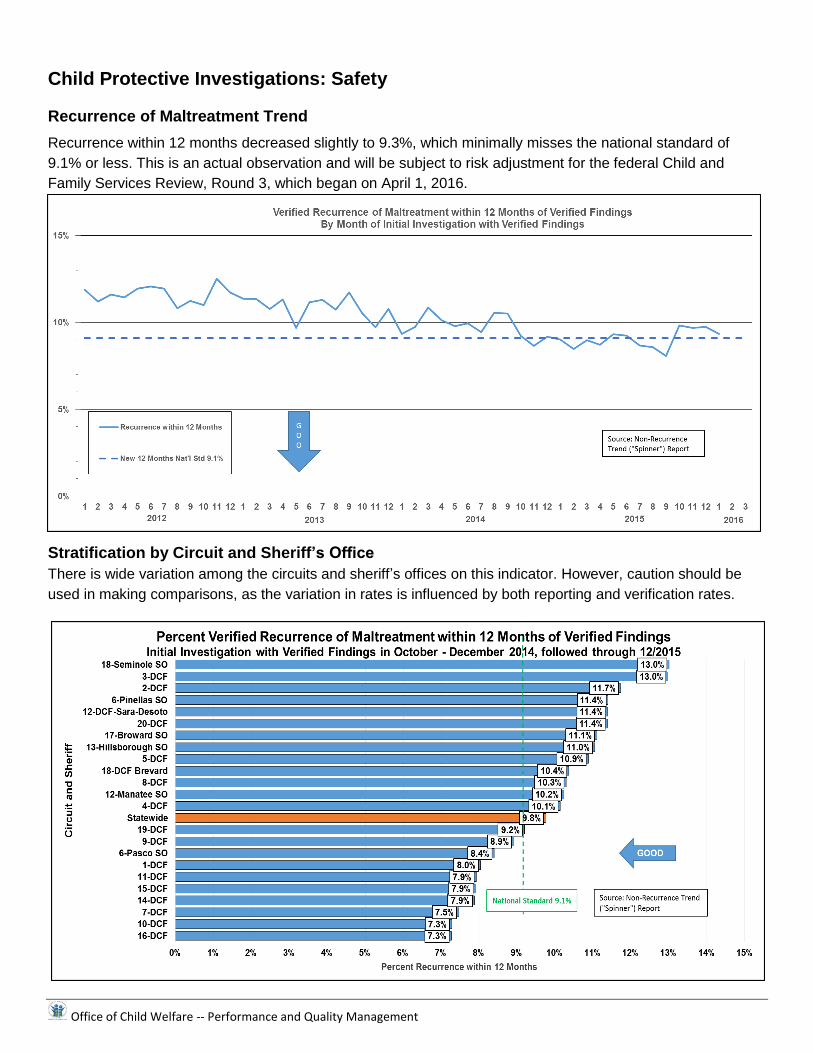
Recurrence of Maltreatment Trend
Recurrence within 12 months decreased slightly to 9.3%, which minimally misses the national standard of
9.1% or less. This is an actual observation and will be subject to risk adjustment for the federal Child and
Family Services Review, Round 3, which began on April 1, 2016.
Stratification by Circuit and Sheriff’s Office
There is wide variation among the circuits and sheriff’s offices on this indicator. However, caution should be
used in making comparisons, as the variation in rates is influenced by both reporting and verification rates.

Office of Child Welfare -- Performance and Quality Management 12
Child Protective Investigations: Workforce
Monthly Separations
There were 44 CPI and Senior CPI separations in March 2016, compared to 38 in February 2016. This is 13
more than in March 2015 and 15 more than in March 2014.
Time in Classification
The percent of less experienced CPIs has continued to be high, with 77.6% having less than two years of
experience as of April 1, 2016. Additionally, 21.6% of the workforce has less than six months of experience,
with a cumulative 45.2% having less than one year of experience. Those having three or more years of
experience constitute only 14.6% of the current CPI workforce.

Office of Child Welfare -- Performance and Quality Management 13
Flow from CPI to Community-Based Care Lead Agencies: Removals
Removals and Removal Rate Trend
The total number of removals for March 2016 (1,243) was 249 less than in March 2015, and the rate of
removals per 100 children investigated in January 2016 was 6.2 compared to 6 in January 2015.
Quarterly Stratification by Circuit and Sheriff’s Office
There is wide variation among the circuits and sheriff’s offices on this indicator. However, caution should be
used in making comparisons, as the variation in rates is influenced by both reporting rates and verification
rates.

Office of Child Welfare -- Performance and Quality Management 14
Flow from CPI to Community-Based Care Lead Agencies: Removals
Quarterly Stratification by Circuit/CBC Lead Agency
Community-Based Care Lead Agencies: In-Home and Out-of-Home Services
Children Receiving Services In-Home and Out-of-Home
The trend for total number of children receiving in-home services has remained relatively flat for the past three
calendar years, while the number of children receiving services in out-of-home care has been steadily trending
upward since June 2013. As of March 31, 2016, 35,309 children are receiving in-home or out-of-home
services.

Office of Child Welfare -- Performance and Quality Management 15
Community-Based Care Lead Agencies: In Home and Out-of-Home Services
Children Receiving Services In-Home and Out-of-Home: Stratification by CBC Lead Agency
There has historically been wide variation among Circuits and CBC Lead Agencies on this indicator.
Community-Based Care Lead Agencies: Removals, Discharges and Placements
Removals and Discharges for Children in Out-of-Home Care
The total number of removals decreased by 3.5% in March 2016 as compared to February 2016 and the
number of children discharged increased by just under 1% during the same period
Source: CPI and CWS
Trend (“Spinner”) Report
Office of Child Welfare -- Performance and Quality Management 16
Community-Based Care Lead Agencies: Removals, Discharges and Placements
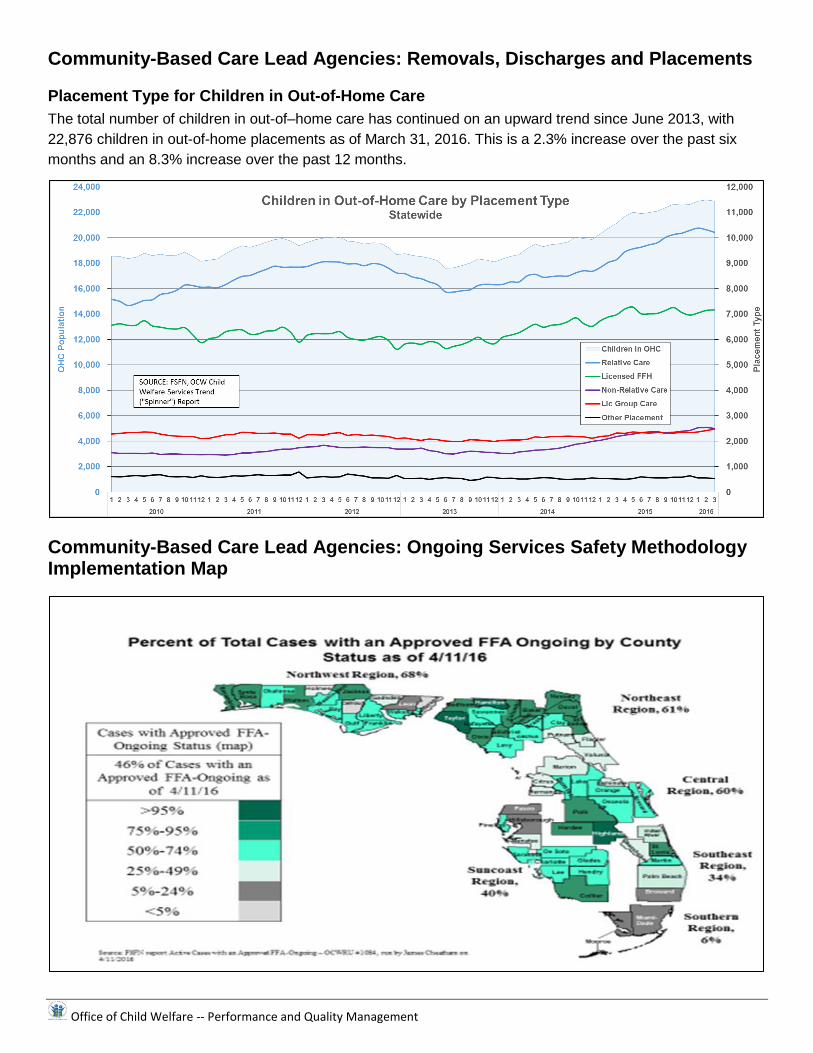
Placement Type for Children in Out-of-Home Care
The total number of children in out-of–home care has continued on an upward trend since June 2013, with
22,876 children in out-of-home placements as of March 31, 2016. This is a 2.3% increase over the past six
months and an 8.3% increase over the past 12 months.
Community-Based Care Lead Agencies: Ongoing Services Safety Methodology Implementation Map
Office of Child Welfare -- Performance and Quality Management 17
Community-Based Care Lead Agencies: Safety
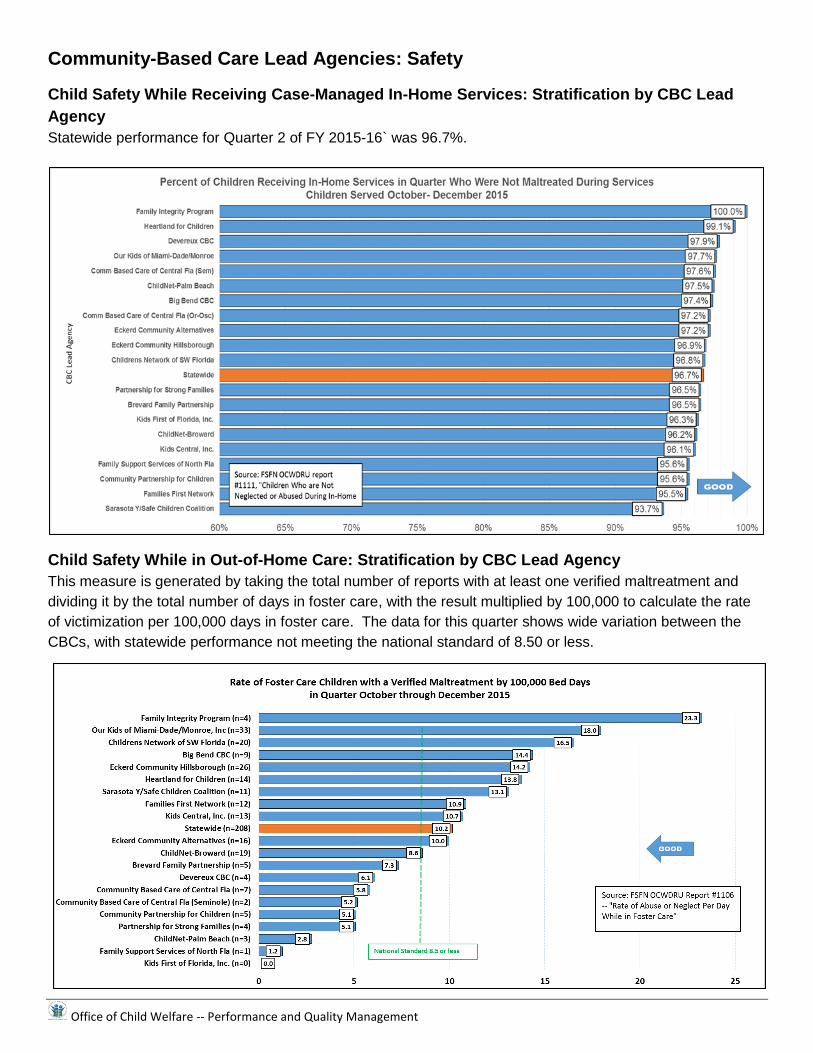
Child Safety While Receiving Case-Managed In-Home Services: Stratification by CBC Lead
Agency
Statewide performance for Quarter 2 of FY 2015-16` was 96.7%.
Child Safety While in Out-of-Home Care: Stratification by CBC Lead Agency
This measure is generated by taking the total number of reports with at least one verified maltreatment and
dividing it by the total number of days in foster care, with the result multiplied by 100,000 to calculate the rate
of victimization per 100,000 days in foster care. The data for this quarter shows wide variation between the
CBCs, with statewide performance not meeting the national standard of 8.50 or less.

Office of Child Welfare -- Performance and Quality Management 18
Community-Based Care Lead Agencies: Safety
Child Safety after Termination of Services: Stratification by Circuit/CBC Lead Agency
Statewide performance for this indicated Quarter was at 95.2%
Child Safety after Termination of Family Support Services: Stratification by CBC Lead Agency
Statewide performance for this indicated Quarter was at 94.1%.
Office of Child Welfare -- Performance and Quality Management 19
Community-Based Care Lead Agencies: Safety
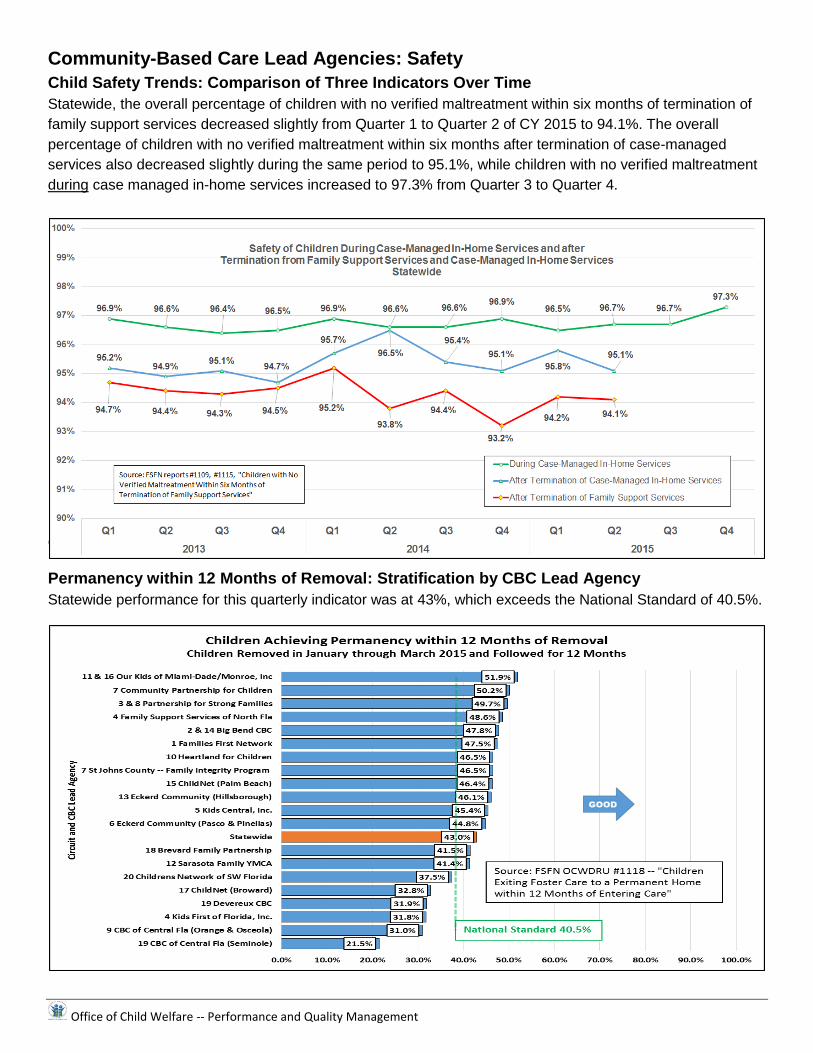
Child Safety Trends: Comparison of Three Indicators Over Time
Statewide, the overall percentage of children with no verified maltreatment within six months of termination of
family support services decreased slightly from Quarter 1 to Quarter 2 of CY 2015 to 94.1%. The overall
percentage of children with no verified maltreatment within six months after termination of case-managed
services also decreased slightly during the same period to 95.1%, while children with no verified maltreatment
during case managed in-home services increased to 97.3% from Quarter 3 to Quarter 4.
Community Based Care Lead Agencies: Permanency
Permanency within 12 Months of Removal: Stratification by CBC Lead Agency
Statewide performance for this quarterly indicator was at 43%, which exceeds the National Standard of 40.5%.
Office of Child Welfare -- Performance and Quality Management 20
Community-Based Care Lead Agencies: Permanency
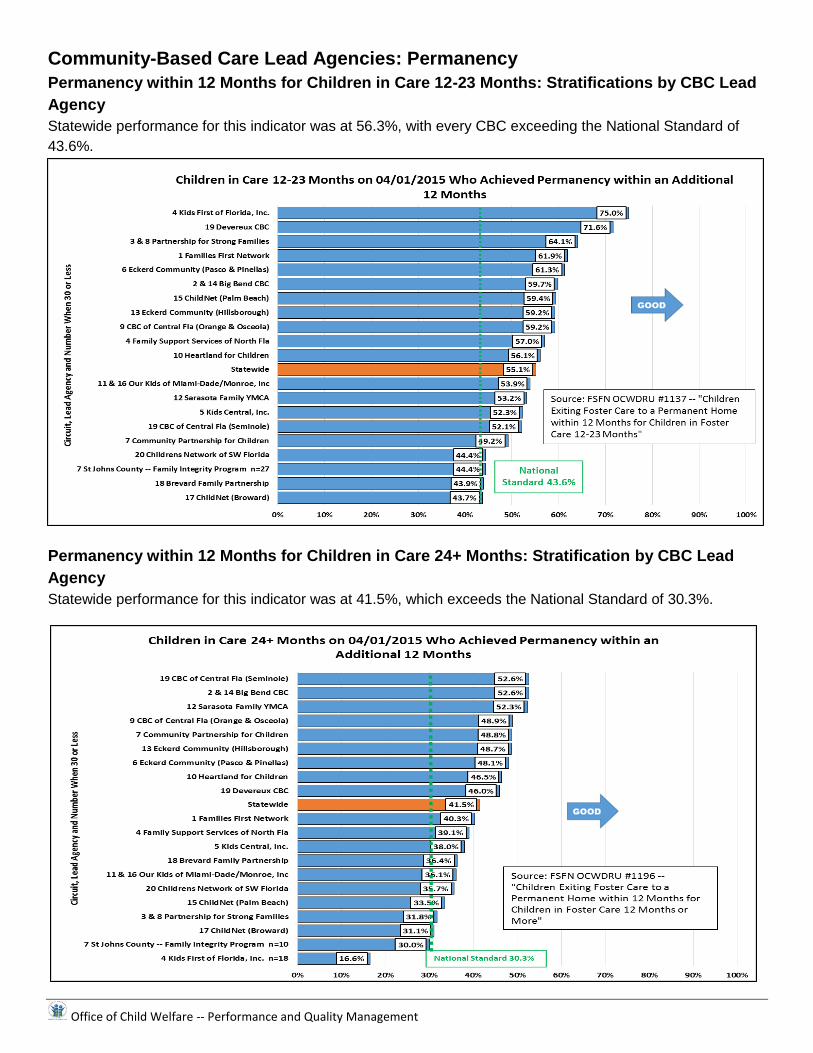
Permanency within 12 Months for Children in Care 12-23 Months: Stratifications by CBC Lead Agency
Statewide performance for this indicator was at 56.3%, with every CBC exceeding the National Standard of
43.6%.
Permanency within 12 Months for Children in Care 24+ Months: Stratification by CBC Lead
Agency
Statewide performance for this indicator was at 41.5%, which exceeds the National Standard of 30.3%.

Office of Child Welfare -- Performance and Quality Management 21
Community-Based Care Lead Agencies: Permanency
Re-Entry of Children into Care within 12 Months: Stratification by CBC Lead Agency
Statewide performance for this quarterly indicator was at 87.5%, which is below the National Standard of
91.7%. This new federal measure selects only children removed over 24 months ago who achieved
permanency over 12 months ago and did not return to out-of-home care within the following 12 months.
Community-Based Care Lead Agencies: Well-Being
Placement Stability: Stratification by CBC Lead Agency
CBC performance in the area of placement stability continues to vary greatly; however, statewide performance
exceeds the national standard of 4.12 moves or less, at 3.82 moves per 1,000 days in foster care.
GOOD
Office of Child Welfare -- Performance and Quality Management 22
Community-Based Care Lead Agencies: Well-Being
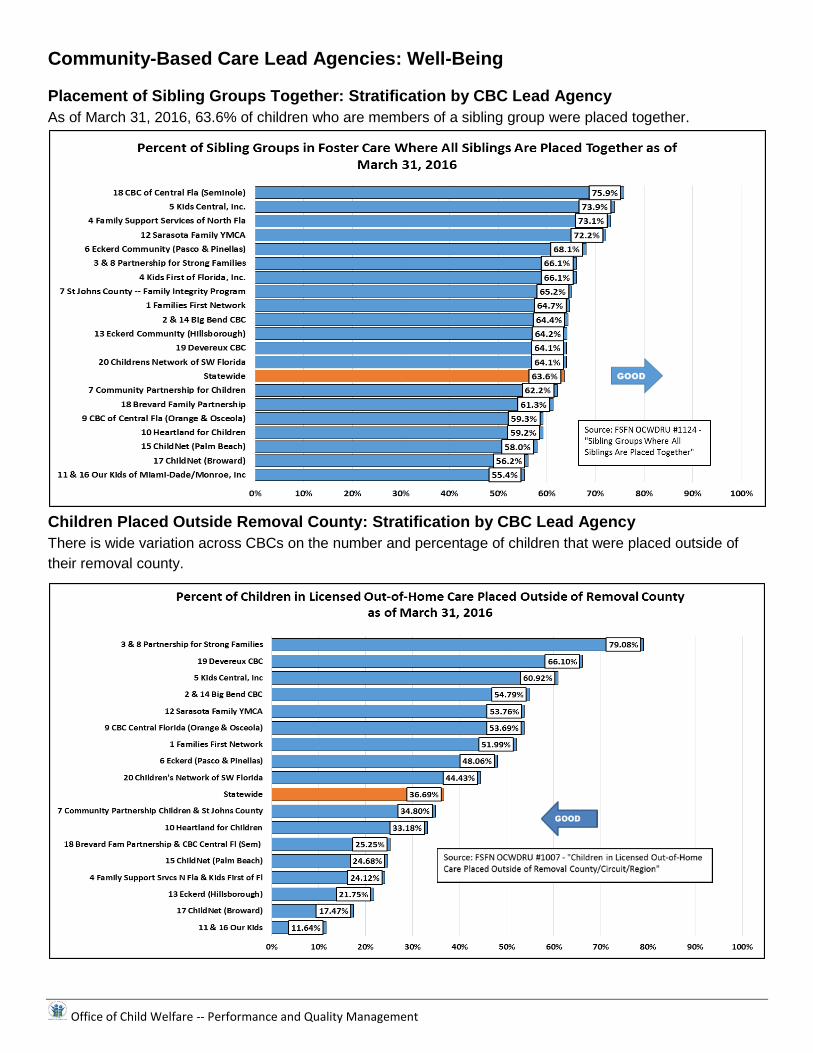
Placement of Sibling Groups Together: Stratification by CBC Lead Agency
As of March 31, 2016, 63.6% of children who are members of a sibling group were placed together.
Children Placed Outside Removal County: Stratification by CBC Lead Agency
There is wide variation across CBCs on the number and percentage of children that were placed outside of
their removal county.
Office of Child Welfare -- Performance and Quality Management 23
Community-Based Care Lead Agencies: Well-Being
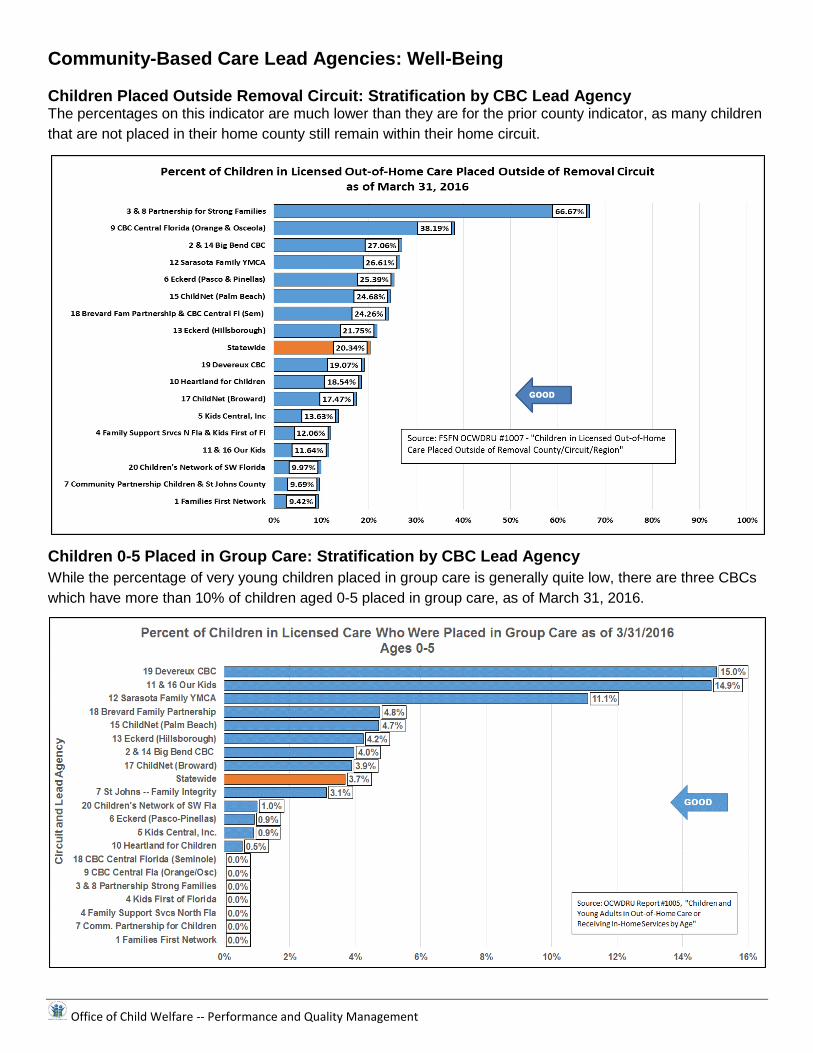
Children Placed Outside Removal Circuit: Stratification by CBC Lead Agency The percentages on this indicator are much lower than they are for the prior county indicator, as many children
that are not placed in their home county still remain within their home circuit.
Children 0-5 Placed in Group Care: Stratification by CBC Lead Agency
While the percentage of very young children placed in group care is generally quite low, there are three CBCs
which have more than 10% of children aged 0-5 placed in group care, as of March 31, 2016.
Office of Child Welfare -- Performance and Quality Management 24
Community-Based Care Lead Agencies: Well-Being
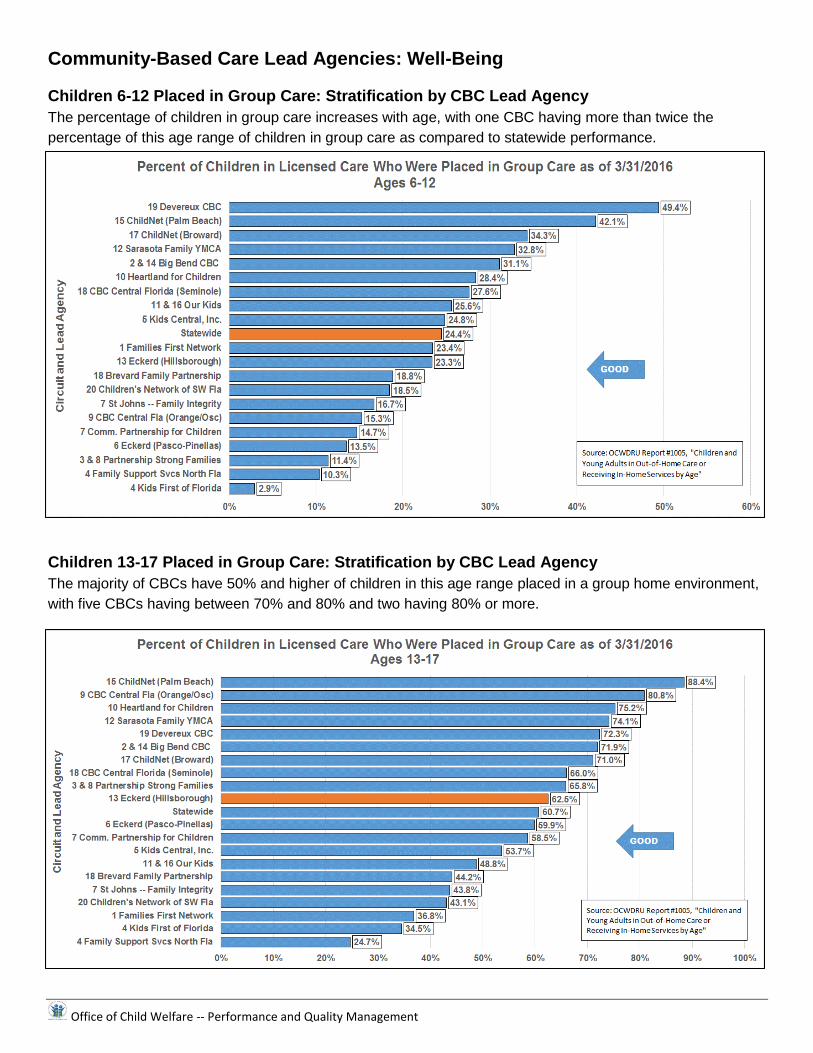
Children 6-12 Placed in Group Care: Stratification by CBC Lead Agency
The percentage of children in group care increases with age, with one CBC having more than twice the
percentage of this age range of children in group care as compared to statewide performance.
Children 13-17 Placed in Group Care: Stratification by CBC Lead Agency
The majority of CBCs have 50% and higher of children in this age range placed in a group home environment,
with five CBCs having between 70% and 80% and two having 80% or more.
Office of Child Welfare -- Performance and Quality Management 25
Community-Based Care Lead Agencies: Well-Being
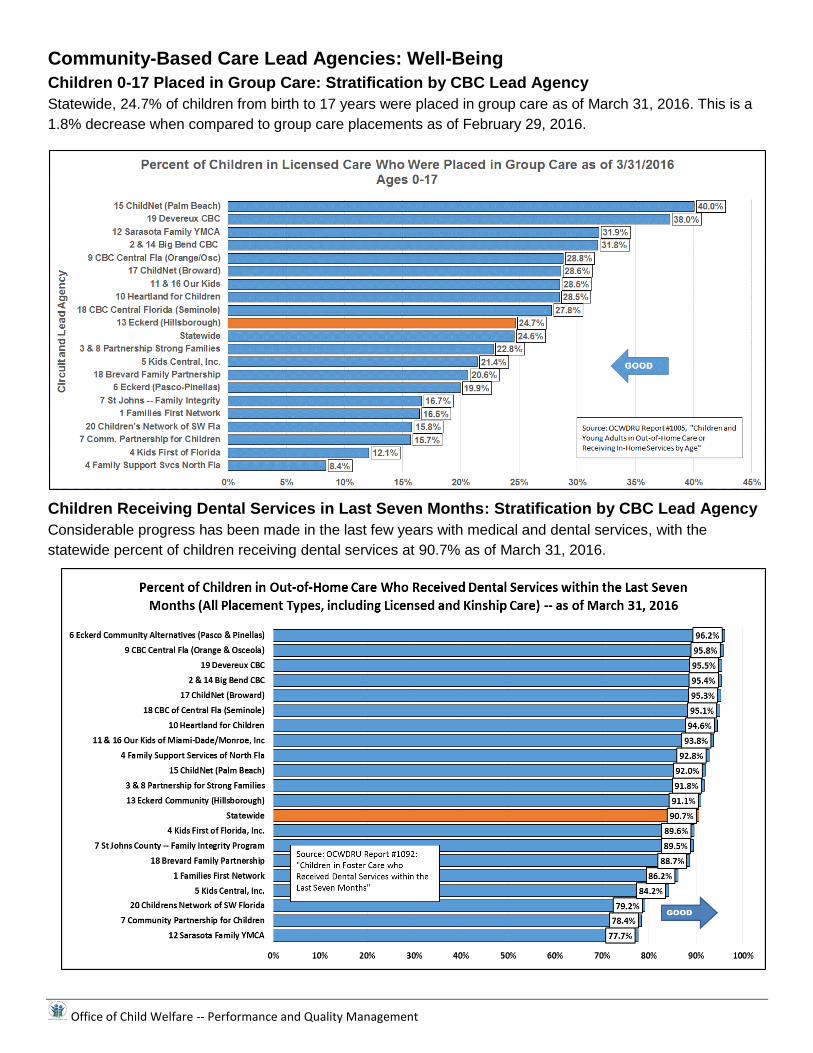
Children 0-17 Placed in Group Care: Stratification by CBC Lead Agency
Statewide, 24.7% of children from birth to 17 years were placed in group care as of March 31, 2016. This is a
1.8% decrease when compared to group care placements as of February 29, 2016.
Children Receiving Dental Services in Last Seven Months: Stratification by CBC Lead Agency
Considerable progress has been made in the last few years with medical and dental services, with the
statewide percent of children receiving dental services at 90.7% as of March 31, 2016.

Office of Child Welfare -- Performance and Quality Management 26
Community-Based Care Lead Agencies: Well-Being
Young Adults Aging Out Who Are Enrolled in Education Programs: Stratification by CBC Lead
Agency
For children who don’t achieve permanency prior to reaching adulthood, it is crucial that they are prepared for
life after foster care by the time they “age out” of care. This is one indicator of that preparation for adulthood,
but does not control for any of the many variables that influence this preparation, including time in care and the
child’s education level when entering care.
Community-Based Care Agencies: Quality
CBC Rapid Safety Feedback The chart below contains the results of Quality Assurance case reviews which rate the cases on 10 criteria as either
strengths or areas that are opportunities for improvement. A number of the areas below may be targets for systematic
quality improvement efforts.
Office of Child Welfare -- Performance and Quality Management 27
Human Trafficking
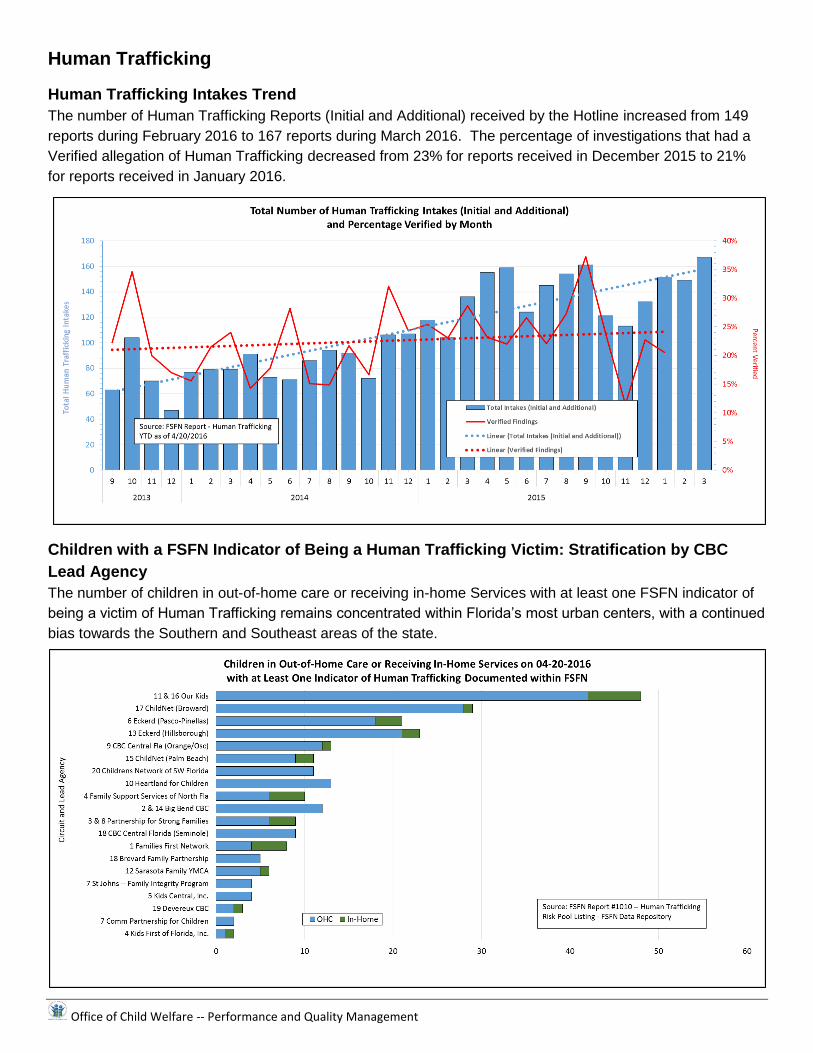
Human Trafficking Intakes Trend
The number of Human Trafficking Reports (Initial and Additional) received by the Hotline increased from 149
reports during February 2016 to 167 reports during March 2016. The percentage of investigations that had a
Verified allegation of Human Trafficking decreased from 23% for reports received in December 2015 to 21%
for reports received in January 2016.
Children with a FSFN Indicator of Being a Human Trafficking Victim: Stratification by CBC
Lead Agency
The number of children in out-of-home care or receiving in-home Services with at least one FSFN indicator of
being a victim of Human Trafficking remains concentrated within Florida’s most urban centers, with a continued
bias towards the Southern and Southeast areas of the state.
Office of Child Welfare -- Performance and Quality Management 28
Child Care Regulations
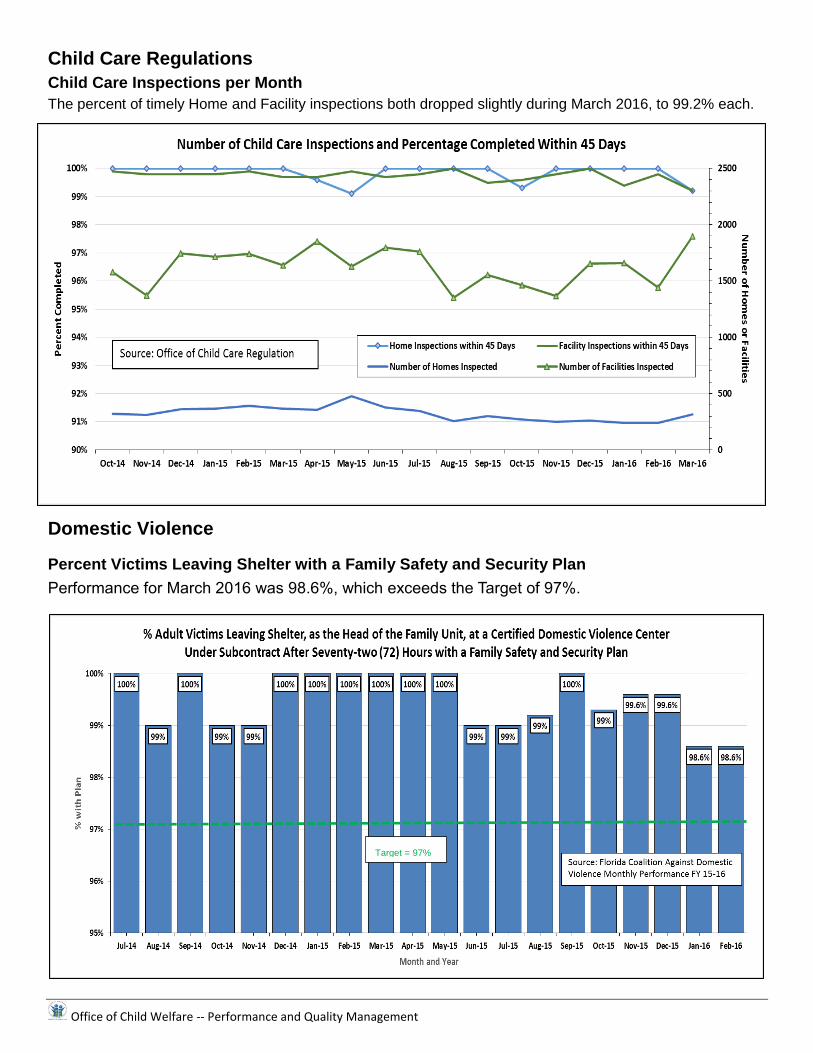
Child Care Inspections per Month
The percent of timely Home and Facility inspections both dropped slightly during March 2016, to 99.2% each.
Domestic Violence
Percent Victims Leaving Shelter with a Family Safety and Security Plan
Performance for March 2016 was 98.6%, which exceeds the Target of 97%.
Target = 97%