child vulnerability and social protection in kenya · acronyms cbt community-based targeting ct-ovc...
TRANSCRIPT

CHILD VULNERABILITY AND SOCIAL PROTECTION IN KENYA

AcknowledgementsThis report was prepared under the direction of WFP Kenya, UNICEF Kenya and the National Social Protection Secretariat. The report was authored by Bjorn Gelders, Senior Social Policy Specialist at Development Pathways. Helpful comments and inputs were received from Stephen Kidd, Juliet Attenborough, Diloá Athias, David Kamau, Luis Corral and Susan Momanyi.
The findings, interpretations and conclusions expressed herein are those of the authors and do not necessarily reflect the official view of the United Nations or the Government of Kenya.
Cover photo: © UNICEF
CHILD VULNERABILITY AND SOCIAL PROTECTION IN KENYA

AcronymsCBT Community-based targetingCT-OVC Cash Transfers to Orphans and Vulnerable ChildrenDPT Diphtheria, pertussis and tetanusGDP Gross domestic productGoK Government of KenyaHSNP Hunger Safety Net ProgrammeHSNP Hunger Safety Net ProgrammeITN Insecticide-treated netsKAIS Kenya AIDS Indicator SurveyKDHS Kenya Demographic and Health SurveyKIHBS Kenya Integrated Household Budget SurveyKNBS Kenya National Bureau of StatisticsKsh Kenyan shillingMICS Multiple Indicator Cluster SurveyMIS Management information systemNSNP National Safety Net ProgramOECD Organisation for Economic Co-operation and DevelopmentOPCT Older Persons Cash TransferOPM Oxford Policy ManagementOR Odds ratioOVC Orphans and vulnerable childrenPPP Purchasing power parityPWSD-CT Persons with Severe Disability Cash TransferUN United NationsUNDESA United Nations Department of Economic and Social AffairsUNHCR United Nations High Commissioner for Refugees
Contents
Acknowledgements ...........................................................................iiAcronyms ............................................................................ivExecutive summary ......................................................................... 21 Introduction ............................................................................ 52 Child poverty and vulnerability ....................................................... 7
2.1 Children living in poor and income-insecure families ......................7
2.2 Risks and vulnerabilities across the lifecycle of children ............... 11
2.3 What are the main determinants of childhood vulnerability? ......... 14
2.3.1 Are orphans more likely to have worse child outcomes than non-orphans? ...................................................................................................... 15
2.3.2 Results by child outcomes .......................................................................... 16
2.3.3 Results by markers of vulnerability .......................................................... 19
2.4 Other at-risk groups ................................................................ 20
2.5 Conclusion ............................................................................. 21
3 Effectiveness of cash transfer schemes in reaching vulnerable children ......................................................................23
3.1 Coverage and exclusion of the general child population ................ 24
3.1.1 Coverage of children under 18 years .........................................................24
3.1.2 Coverage of children by age group ............................................................26
3.1.3 Coverage of children by sex .......................................................................28
3.1.4 Coverage of children by region ..................................................................29
3.2 Coverage and exclusion of orphaned children ............................. 29
3.3 Coverage and exclusion of children in the poorest households ...... 30
3.4 Children with disabilities .......................................................... 32
3.5 Conclusion ............................................................................. 32
4 Proposals for building a more comprehensive and child-sensitive lifecycle social protection system ...................................................34
4.1 A lifecycle approach to social protection .................................... 34
4.2 Reforming the CT-OVC ............................................................. 35
4.3 Building an inclusive and child-sensitive social security system ..... 38
5 Conclusions ...........................................................................43
Selected references ........................................................................45
Executive summaryThe definition of child vulnerability used in Kenya’s social protection sector was shaped in the early 2000s, when policymakers noted an increasing number of orphans as a consequence of the AIDS pandemic and developed the National Plan of Action for Orphans and Vulnerable Children (OVC). Kenya’s Cash Transfer for Orphans and Vulnerable Children (CT-OVC) was launched in 2004 with the objective of providing regular cash transfers to poor families living with children identified as OVCs to encourage fostering and retention of children and promote their human capital development. OVCs are defined in the programme as children aged 0-17 years old with at least one deceased parent, or a parent who is chronically ill, or whose main caregiver is chronically ill. In recent years, however, there have been growing concerns about the way childhood vulnerability is defined in Kenya and whether targeting transfers to OVCs may lead to the exclusion of children who are equally or even more vulnerable.
Child poverty and vulnerabilityBased on extensive statistical analysis of nationally representative survey datasets, this paper concludes that orphaned children are not significantly more likely to live in poverty compared with non-orphaned children. Moreover, orphanhood is not consistently associated with worse child outcomes in other domains such as birth registration, health, nutrition, early marriage or early sexual debut. These findings are not unique to Kenya. Indeed, studies conducted in other countries in Africa and the rest of the world have also found that orphans are not necessarily more disadvantaged than their non-orphaned peers.
The paper assesses whether there are other markers that can be used to accurately identify vulnerable children and that can serve as a new definition of child vulnerability appropriate within the Kenyan context. Overall, household wealth is the only consistent and reliable predictor of childhood vulnerability across a range of across age-disaggregated outcomes. From a lifecycle perspective, young children under five living in income-poor households should be prioritised: evidence from the fields of neuroscience and developmental psychology show that poverty especially during early childhood can have negative and irreversible effects that last through adulthood. Disability is a risk across the lifecycle and the limited evidence that is available on the situation of children with disabilities indicates that they experience higher rates of poverty and have less access to basic social services than their non-disabled peers.
Effectiveness of cash transfer schemes in reaching vulnerable childrenCurrently, Kenya’s main social security cash transfers reach, directly or indirectly, an estimated 7.5 percent of the total child population. Children who have lost one or both parents are significantly more likely to be covered than their non-orphaned peers. This is as expected because orphans are the explicit target group of the CT-OVC and orphanhood is also a common proxy of vulnerability used in the other cash transfer programmes. However,
2

because orphanhood is not a consistent predictor of childhood vulnerability, this paper confirms that Kenya’s cash transfer system excludes many other non-orphaned children who are equally or more vulnerable by design.
Despite progress in expanding the number of beneficiaries, Kenya’s cash transfers do not yet reach the vast majority of children living in the poorest wealth quintiles, even though coverage is pro-poor. Another major gap in the system is the very low coverage of young children. Children under the age of five are significantly under-represented in the CT-OVC and, to a lesser extent, in the other programmes too. This goes against one of the key principles of child-sensitive social protection: to intervene as early as possible where children are at risk to prevent irreversible impairment or harm. The coverage of children with disabilities is also estimated to be very low (less than 2 percent).
Proposals for building a more child-sensitive lifecycle social protection systemThe paper puts forward a number of proposals for building a more inclusive and child-sensitive lifecycle national social protection system, in line with the vision outlined in Kenya’s National Social Protection Strategy (2011) and the right to social security for all citizens enshrined in the national Constitution. Ultimately, the key policy choice is whether to continue to target the CT-OVC programme to a group of (older) children who are not necessarily more vulnerable than other children, or to continue to transition towards an inclusive lifecycle social security system by implementing a more conventional child benefit.
In a context like Kenya where difficult decisions need to be made about how best to invest limited funds for social security, we argue that prioritising families with young children is a strategic and efficient use of resources. The main option presented is to adapt the CT-OVC programme and turn it into a child benefit, providing a flat transfer to young children under five. Rather than narrowly targeting such a programme to ultra-poor households, it is recommended to make either all children under five eligible, or at least 70 percent of young children. This is because evidence from panel surveys conducted in Kenya and elsewhere has demonstrated that there is no fixed group of children living in poverty that can easily be identified and targeted: household incomes and consumption are highly variable and there is significant churning around the poverty line and movement across the wealth spectrum, even over relatively short periods of time. This makes attempts to target relatively ineffective and expensive.
Using microsimulations, the paper shows that such a reform – as part of a broader lifecycle approach to social protection – would be affordable, have a significant impact on reducing child poverty and vulnerability, and would drastically increase the coverage among children and households in need of social protection.
3Child vulnerability and social protection in Kenya

4
1 INTRODUCTION

5Child vulnerability and social protection in Kenya
1 IntroductionThe definition of child vulnerability used in Kenya’s social protection sector was shaped in the early 2000s, when policymakers noted an increasing number of orphans as a consequence of the AIDS pandemic and developed the National Plan of Action for Orphans and Vulnerable Children (OVC). Kenya’s Cash Transfer for Orphans and Vulnerable Children (CT-OVC) was launched in 2004 with the objective of providing regular cash transfers to poor families living with children identified as OVCs to encourage fostering and retention of children and promote their human capital development. OVCs are defined in the programme as children aged 0-17 years old with at least one deceased parent, or a parent who is chronically ill, or whose main caregiver is chronically ill.
In recent years, however, there have been growing concerns about the way childhood vulnerability is defined in Kenya. An emerging body of global research has shown that orphanhood and co-residence with a chronically ill or HIV-positive adult are not universally robust measures of child vulnerability across national and epidemic contexts (Akwara et al., 2010; UNICEF, 2014a). Accordingly, relying on the current concept of OVC to target social transfer programmes may lead to the exclusion of children who are equally or even more vulnerable.
Within the context of Kenya, valuable research has been conducted on OVC, but significant gaps remain. For instance, there is a lack of nationally representative data across various dimensions of child well-being that is disaggregated by orphanhood status. The lack of vital strategic information is hindering policy makers and programme leaders from making well-informed decisions about the path forward. This paper therefore critically examines the utility of the concept of OVC for Kenya’s social protection sector.
Firstly, the paper analyses whether orphans in Kenya are indeed more likely to have worse outcomes than non-orphans using recent nationally representative survey data. It also assesses whether there are other factors that are consistently associated with poor child outcomes that can serve as proxies for identifying vulnerable girls and boys.
Next, the paper evaluates the effectiveness of Kenya’s various social protection schemes in reaching children. The proportion of children of different ages that are covered by and excluded from social transfers is central to an understanding a social protection system’s level of child sensitivity. The extent to which the most vulnerable children are reached is also critical. Drawing on administrative data from Kenya’s social protection management information systems (MIS), the Single Registry and recent survey data, the paper provides unique insights into issues of under-coverage and exclusion of children.
Finally, building on the preceding analysis, the paper puts forward a number of proposals for building a more inclusive and lifecycle-based national social protection system in line with the vision outlined in Kenya’s National Social Protection Strategy (2011) and the right to social security for all citizens set out in the national Constitution. These proposals were developed using a micro-simulation model that estimates the costs and impacts of different types of cash transfers programmes in Kenya.

6
2 CHILD POVERTY AND VULNERABILITY

7Child vulnerability and social protection in Kenya
2 Child poverty and vulnerabilityKenya has a young and fast-growing population. According to the latest projections, there are some 22.7 million children aged 0-17 years in Kenya, constituting 48 percent of the total population (UNDESA, 2015). Children face a wide range of vulnerabilities and challenges; indeed, most children require a multi-sectorial approach to be supported effectively throughout childhood. However, social protection schemes cannot address all forms of child vulnerability. This section therefore focuses mostly on those vulnerabilities that can be addressed or alleviated, directly or indirectly, through regular and predictable cash transfers. The section starts by describing poverty rates among children and the dynamic nature of family consumption and income. One major limitation, however, is that poverty statistics for Kenya are outdated: the latest Integrated Household Budget Survey (KIBHS) was conducted ten years ago in 2005/06 and results from the KIHBS 2015/16 will only become available in 2017. We then take a lifecycle approach to describe the main risks that children face across each stage of childhood. Next, we assess whether orphans are more likely to have worse child outcomes than their non-orphaned peers. We also consider whether there are other proxies that can be used to accurately identify vulnerable children. Finally, we look at specific at-risk groups that are not well covered in Kenya’s datasets, such as children with disabilities.
2.1 Children living in poor and income-insecure familiesNationwide, one in two children (51 percent) were living in households below the official poverty line in 2005/06. There was no gender disparity between boys and girls, although children living in female-headed household were somewhat more likely to experience poverty (54 percent) compared with those in male-headed households (49 percent). Figure 1below illustrates significant geographical disparities. For example, the prevalence of childhood poverty in the North Eastern region (76 percent) was three times higher than in Nairobi (26 percent).
76
64
57
54
51
48
35
26
0% 20% 40% 60% 80% 100%
NorthEastern
Coast
Western
Eastern
RiftValley
Nyanza
Central
Nairobi
FIGURE 1: Regional disparities in child poverty: Percentage of children 0-17 years living in households below the national poverty line, 2005/06
Source: Calculations based on KIBHS 2005/06.
8
Poverty in Kenya disproportionately impacts children. While children constituted half the total population, they accounted for two-thirds of the total number of people in poverty. The presence of children significantly increases the likelihood of a household living in poverty. For instance, the poverty rate among households with no children under six years of age was 38 percent in 2005/06, but this increased to 63 percent among households with three or more young children (World Bank, 2009). Analysis of data from Kenya’s 2014 Demographic and Health Survey (KDHS) confirms that children continue to be overrepresented among households in the lowest wealth quintiles, as measured by an asset index that serves as a proxy for a household’s long-term standard of living.
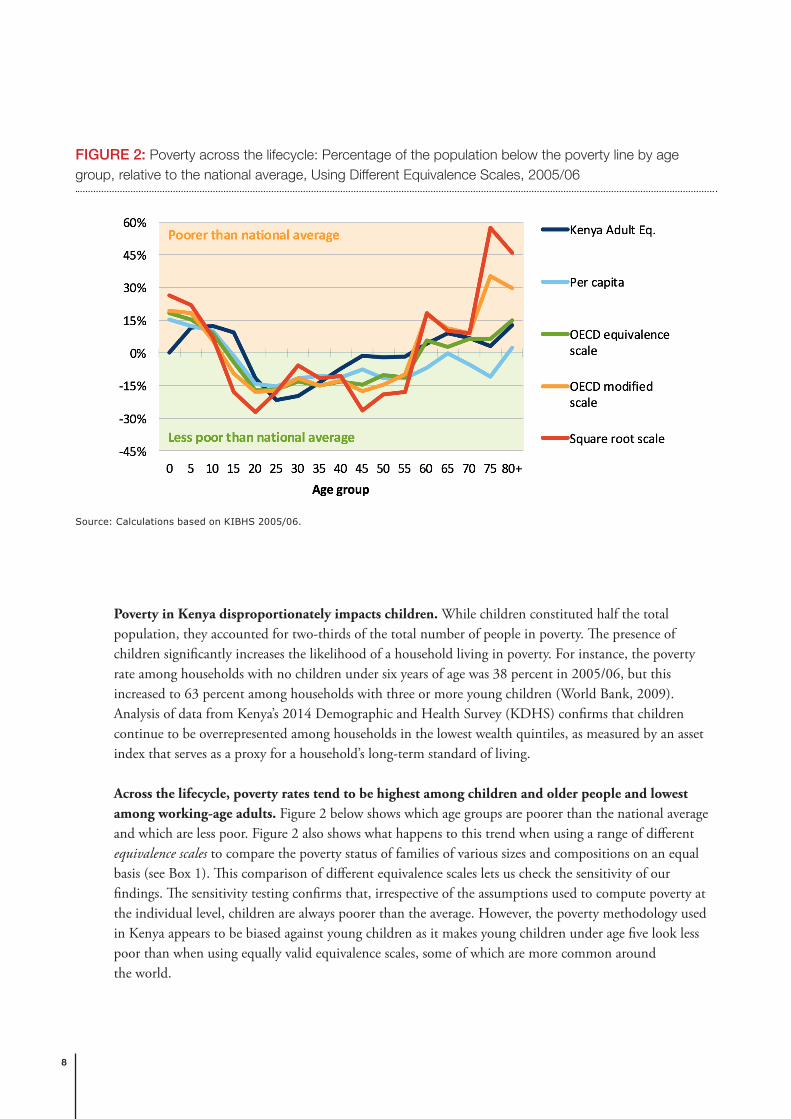
Across the lifecycle, poverty rates tend to be highest among children and older people and lowest among working-age adults. Figure 2 below shows which age groups are poorer than the national average and which are less poor. Figure 2 also shows what happens to this trend when using a range of different equivalence scales to compare the poverty status of families of various sizes and compositions on an equal basis (see Box 1). This comparison of different equivalence scales lets us check the sensitivity of our findings. The sensitivity testing confirms that, irrespective of the assumptions used to compute poverty at the individual level, children are always poorer than the average. However, the poverty methodology used in Kenya appears to be biased against young children as it makes young children under age five look less poor than when using equally valid equivalence scales, some of which are more common around the world.
FIGURE 2: Poverty across the lifecycle: Percentage of the population below the poverty line by age group, relative to the national average, Using Different Equivalence Scales, 2005/06
Source: Calculations based on KIBHS 2005/06.

9Child vulnerability and social protection in Kenya
Box 1: Equivalence scales and poverty lines
Kenya’s official poverty line is determined and based on the expenditure required to purchase a food basket that allows minimum nutritional requirements to be met, in addition to the costs of meeting basic non-food needs. However, adults eat more than small children do, and larger families spend more on some necessities than smaller families do. The Kenya National Bureau of Statistics therefore uses an adult equivalence scale to account for differences in needs among household members: children aged 0-4 years are weighted as 0.24, children aged 5-14 years are weighted as 0.65 and all people aged 15 years and over are assigned a value of unity. For a given household, the sum of these coefficients represents the number of equivalent adults in the household.
Internationally, a wide range of equivalence scales are used by different countries and there is no single universally accepted method. Yet, estimates of both the size and composition of the population in poverty are significantly influenced by the choice of equivalence scales employed. For example, if all individuals in Kenya, including children, were given an equal weight (i.e. dividing household expenditure by household size), the national child poverty rate would rise to 60 percent. In contrast, if the modified OECD scale were used – which assigns a value of 1 to the household head, of 0.5 to each additional adult member and of 0.3 to each child, this would result in a poverty rate of 20 percent for children under 18 years. In selecting a particular equivalence scale, it is therefore important to be aware of its potential effect on the level of inequality and poverty. Furthermore, it indicates that poverty rates are relatively arbitrary and can be easily changed by using different – and equally valid – assumptions.
Figure 3 shows the proportion of the population and children in Kenya living below different international poverty lines that are commonly used by the World Bank and other organisations. Those living below $1.9 per day expressed in purchasing power parity (PPP) dollars (approx. Ksh 84 in 2015 prices) are considered to be extremely poor. Those between $1.9 (Ksh 84) and $3.1 (Ksh 137) per day are considered to live in poverty. Those between $3.1 (Ksh 137) and $10 (Ksh 443) are considered to be insecure as they still have a high probability of falling back into poverty. Lastly, those above the threshold of $10 (Ksh 443) per day are regarded as being income secure. Globally, there is growing consensus that this $10 threshold, which is five times the extreme poverty line, is associated with economic security and protects people from falling back into poverty. This means that over 95 percent of children in Kenya continue to live a low-income existence, even if they are above the official national poverty line.
FIGURE 3: Poverty classification of kenya’s population and children using international poverty lines

10
The ‘poor’ are not a static group – people fluctuate in and out of poverty. As a result of the growing availability of panel data sets, which track the same households at different points in time, research is increasingly showing that household incomes and consumption are highly variable and that there is significant churning (fluctuation) around the poverty line, with large proportions of the population moving in and out of poverty. Figure 4, for example, illustrates the dynamic nature of poverty among 1,540 farm households in rural Kenya that were interviewed four times between 1997 and 2007 as part of the Tegemeo’s panel household survey. Over the 10-year period, only 16 percent of households never experienced an episode of poverty. Some 13 percent remained below the poverty line during the entire period, while the vast majority (7 out of 10 households) were sometimes poor but not always.
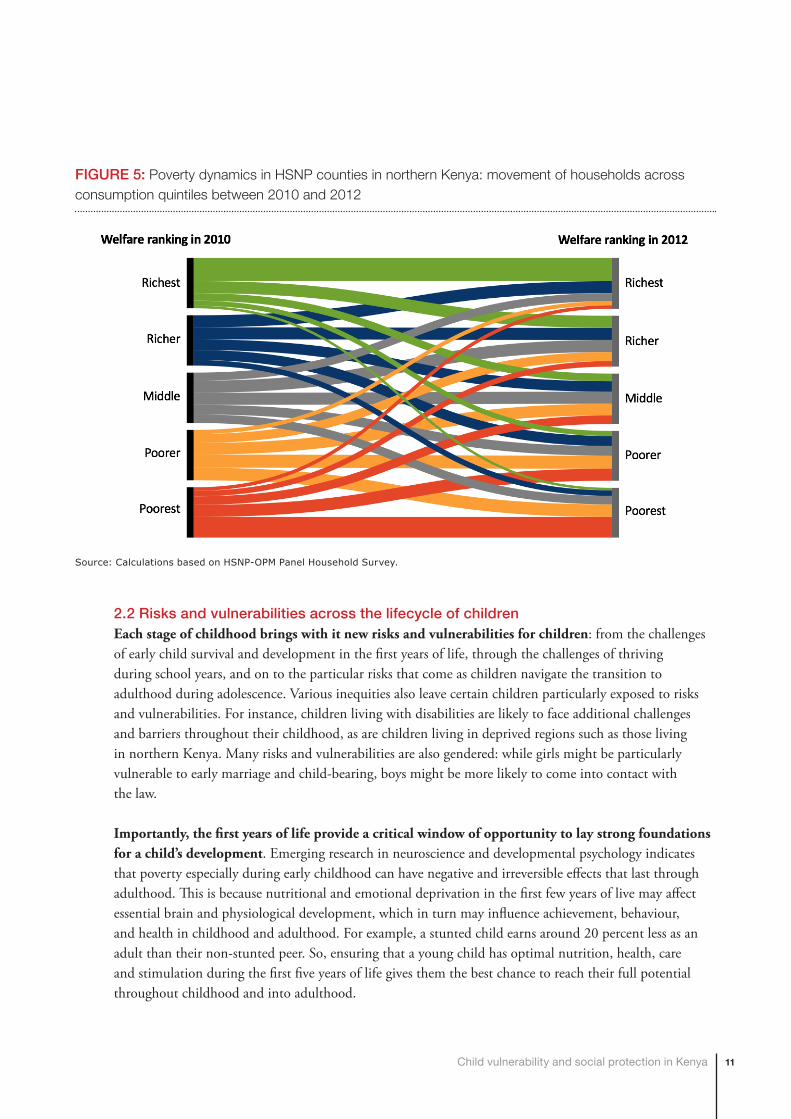
Likewise, our own analysis of the HSNP-OPM Panel Survey conducted in Northern Kenya (Mandera, Marsabit, Turkana and Wajir) between 2010 and 2012 confirms that there is significant movement across the wealth spectrum, even over a relatively short period of time (see Figure 5). These dynamics are the result of households experiencing “shocks” – such as illness, unemployment, drought, disability, death, childbirth, etc. – and responding to opportunities. Panel survey data, therefore, paint a much more complex and volatile picture than the conventional picture of poverty, where poverty is reduced to a single poverty rate figure collected at one point in time. Indeed, as we discuss later, targeting the poor is – as a result of the volatility of incomes – effectively trying to hit a moving target, particularly within the subsistence and informal sectors (Kidd, 2013).
12
The ‘poor’arenota staticgroup–people fluctuate inandoutofpoverty.Asa resultof thegrowingavailabilityofpaneldata sets,which track the samehouseholdsatdifferentpoints intime, research is increasingly showing that household incomes and consumption are highlyvariable and that there is significant churning (fluctuation) around thepoverty line,with largeproportionsofthepopulationmovinginandoutofpoverty.Figure4,forexample,illustratesthedynamicnatureofpovertyamong1,540farmhouseholdsinruralKenyathatwereinterviewedfourtimesbetween1997and2007aspartoftheTegemeo’spanelhouseholdsurvey.Overthe10-yearperiod,only16percentofhouseholdsneverexperiencedanepisodeofpoverty.Some13percentremainedbelowthepovertylineduringtheentireperiod,whilethevastmajority(7outof10households)weresometimespoorbutnotalways.
FIGURE4:MOVEMENTSINTOANDOUTOFPOVERTYOVERATEN-YEARPERIODINRURALKENYA,1997-2007
Source:BasedonTegemeo’spanelhouseholdsurvey,reportedin:Beegleetal.(2016).TheTegemeosurveyisrepresentativeofabout85%ofKenya’sruralpopulation.
Likewise, our own analysis of the HSNP-OPM Panel Survey conducted in Northern Kenya(Mandera, Marsabit, Turkana and Wajir) between 2010 and 2012 confirms that there issignificantmovementacrossthewealthspectrum,evenoverarelativelyshortperiodoftime(see Figure 5). These dynamics are the result of households experiencing “shocks” – such asillness, unemployment, drought, disability, death, childbirth, etc. – and responding toopportunities. Panel survey data, therefore, paint a much more complex and volatile picturethan the conventional picture of poverty, where poverty is reduced to a single poverty ratefigure collected at one point in time. Indeed, aswe discuss later, targeting the poor is – as aresultof thevolatilityof incomes–effectively tryingtohitamovingtarget,particularlywithinthesubsistenceandinformalsectors(Kidd,2013).
Alwayspoor13%
Sometimespoor71%
Neverpoor16%
0% 25% 50% 75% 100%
FIGURE 4: Movements into and out of poverty over a ten-year period in rural Kenya, 1997-2007
Source: Based on Tegemeo’s panel household survey, reported in: Beegle et al. (2016). The Tegemeo survey is representative of about 85% of Kenya’s rural population.
11Child vulnerability and social protection in Kenya
2.2 Risks and vulnerabilities across the lifecycle of childrenEach stage of childhood brings with it new risks and vulnerabilities for children: from the challenges of early child survival and development in the first years of life, through the challenges of thriving during school years, and on to the particular risks that come as children navigate the transition to adulthood during adolescence. Various inequities also leave certain children particularly exposed to risks and vulnerabilities. For instance, children living with disabilities are likely to face additional challenges and barriers throughout their childhood, as are children living in deprived regions such as those living in northern Kenya. Many risks and vulnerabilities are also gendered: while girls might be particularly vulnerable to early marriage and child-bearing, boys might be more likely to come into contact with the law.
Importantly, the first years of life provide a critical window of opportunity to lay strong foundations for a child’s development. Emerging research in neuroscience and developmental psychology indicates that poverty especially during early childhood can have negative and irreversible effects that last through adulthood. This is because nutritional and emotional deprivation in the first few years of live may affect essential brain and physiological development, which in turn may influence achievement, behaviour, and health in childhood and adulthood. For example, a stunted child earns around 20 percent less as an adult than their non-stunted peer. So, ensuring that a young child has optimal nutrition, health, care and stimulation during the first five years of life gives them the best chance to reach their full potential throughout childhood and into adulthood.
FIGURE 5: Poverty dynamics in HSNP counties in northern Kenya: movement of households across consumption quintiles between 2010 and 2012
Source: Calculations based on HSNP-OPM Panel Household Survey.

12
AGE GROUP MAIN CHALLENGES DATA FOR KENYA
In utero and at birth ▪ In utero exposure to maternal infections, nutritional deficiencies, and environmental toxins, as well as poor care around birth, may lead to severe and irreversible damage to the brain and other organs
▪ Lack of birth registration, which can lead to exclusion from essential services and rights later in life
▪ 62% of births are delivered by a skilled provider, but only 30% in the poorest wealth quintile (KDHS 2014)
▪ 22 out of every 1,000 newborns die in the first month of life (KDHS 2014)
▪ The births of 33% of children under five have never been registered (KDHS 2014)
Early childhood ▪ Poor maternal and early child nutrition leading to stunted growth and other life-long negative health, cognitive and productivity impacts
▪ Poor cognitive development if early care and stimulation inadequate, with lifelong impact
▪ Acute vulnerability to disease and infection/ poor access to health services
▪ Exposure to hazardous environments relating to poor housing and/or parents’ work
▪ High dependency: risk from loss of parent/carer
▪ Disability through lack of early intervention
▪ One in every 19 children die before reaching their fifth birthday (KDHS 2014)
▪ 29% of one-year olds do not receive all basic vaccinations (KDHS 2014)
▪ One in four children (26%) under five are stunted as a result of chronic malnutrition (KDHS 2014)
▪ 7% of children under five are identified as being OVC (KAIS 2012)
TABLE 1: Age-related risks and vulnerabilities for children

13Child vulnerability and social protection in Kenya
AGE GROUP MAIN CHALLENGES DATA FOR KENYA
Primary-school age ▪ Risk of not attending school, school dropout, or low educational quality because of lack of income or pressure due to income earning responsibilities
▪ Insufficient food or poor diets increasing likelihood of illness with knock-on effects in education
▪ Challenges faced by households with children with disabilities
▪ 86% of primary school-aged children (6-13 years) are attending school; this rate drops to 71% in the poorest wealth quintile (KDHS 2014)
▪ 26% of children aged 5-14 years are engaged in child labour (MICS 2000)
▪ 12% of children aged 5-9 years and 20% of children 10-14 years are identified as being OVC (KAIS 2012)
Secondary-school age ▪ Inadequate access to quality education and information on risky behavior
▪ Vulnerability of (especially girl) children to early withdrawal from school due to lack of parents/family income
▪ Challenges faced by children with disabilities
▪ Lack of access to training/formal employment leading to entry into high risk employment categories
▪ Risky sexual activity and substance abuse
▪ Risks from early marriage and child-bearing
▪ Increasing vulnerability of girls due to gender-based violence
▪ 33% of secondary school-aged children (14-17 years) are attending secondary school; this rate drops to only 13% in the poorest wealth quintile (KDHS 2014)
▪ 26% of children 15-17 years are identified as being OVC (KAIS 2012)
▪ Among 13-17 year olds, 11% of females and 4% of males have experienced sexual violence and 49% of females and 48% of males have experienced physical violence (VAC 2010)
▪ 23% of women aged 20-24 reported that they were married before the age of 18 (KDHS 2014)
▪ 18% of females 15-19 years old have begun child bearing; this rate increases to 26% in the poorest wealth quintile (KDHS 2014)
14
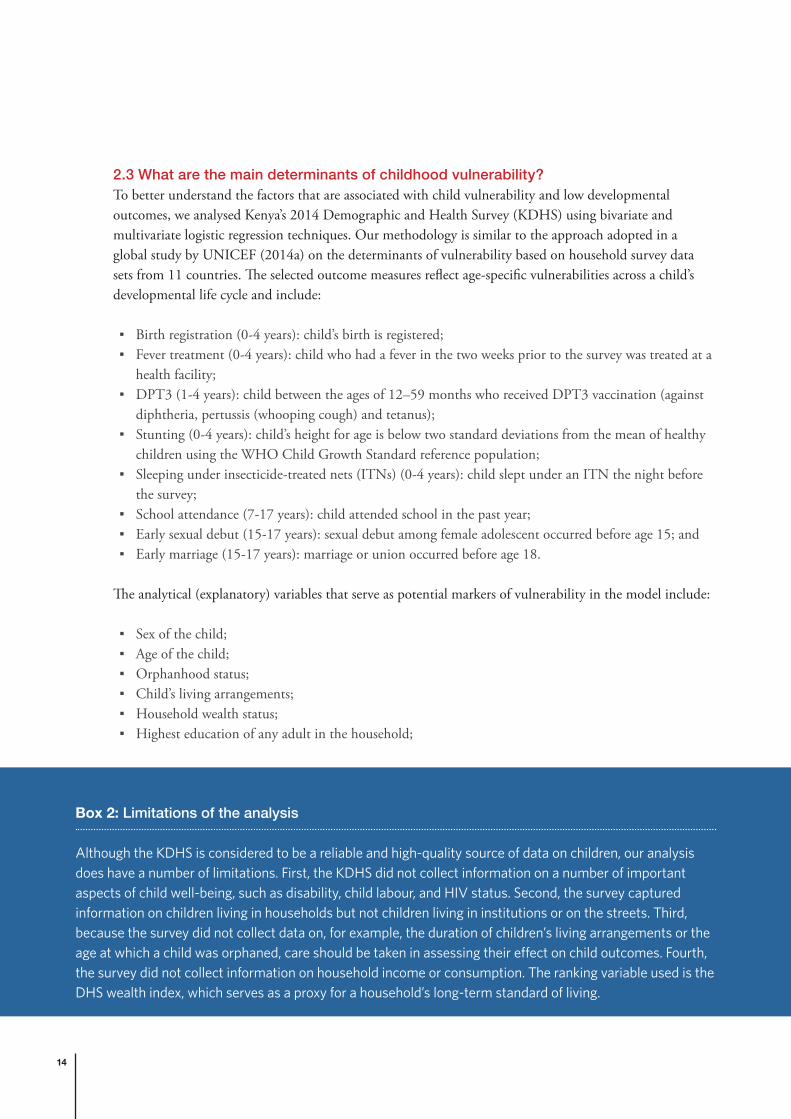
Box 2: Limitations of the analysis
Although the KDHS is considered to be a reliable and high-quality source of data on children, our analysis does have a number of limitations. First, the KDHS did not collect information on a number of important aspects of child well-being, such as disability, child labour, and HIV status. Second, the survey captured information on children living in households but not children living in institutions or on the streets. Third, because the survey did not collect data on, for example, the duration of children’s living arrangements or the age at which a child was orphaned, care should be taken in assessing their effect on child outcomes. Fourth, the survey did not collect information on household income or consumption. The ranking variable used is the DHS wealth index, which serves as a proxy for a household’s long-term standard of living.
2.3 What are the main determinants of childhood vulnerability?To better understand the factors that are associated with child vulnerability and low developmental outcomes, we analysed Kenya’s 2014 Demographic and Health Survey (KDHS) using bivariate and multivariate logistic regression techniques. Our methodology is similar to the approach adopted in a global study by UNICEF (2014a) on the determinants of vulnerability based on household survey data sets from 11 countries. The selected outcome measures reflect age-specific vulnerabilities across a child’s developmental life cycle and include:
▪ Birth registration (0-4 years): child’s birth is registered; ▪ Fever treatment (0-4 years): child who had a fever in the two weeks prior to the survey was treated at a
health facility; ▪ DPT3 (1-4 years): child between the ages of 12–59 months who received DPT3 vaccination (against
diphtheria, pertussis (whooping cough) and tetanus); ▪ Stunting (0-4 years): child’s height for age is below two standard deviations from the mean of healthy
children using the WHO Child Growth Standard reference population; ▪ Sleeping under insecticide-treated nets (ITNs) (0-4 years): child slept under an ITN the night before
the survey; ▪ School attendance (7-17 years): child attended school in the past year; ▪ Early sexual debut (15-17 years): sexual debut among female adolescent occurred before age 15; and ▪ Early marriage (15-17 years): marriage or union occurred before age 18.
The analytical (explanatory) variables that serve as potential markers of vulnerability in the model include:
▪ Sex of the child; ▪ Age of the child; ▪ Orphanhood status; ▪ Child’s living arrangements; ▪ Household wealth status; ▪ Highest education of any adult in the household;
15Child vulnerability and social protection in Kenya
▪ Sex of the household head; ▪ Household dependency ratio (ratio of adults age 65 and above and children under age 15 to adults age
15–64); ▪ Place of residence (urban/rural).
Variables for Kenya’s regions were included in all models as fixed effects, to control for region-specific unobservable effects. Standard errors were clustered at the primary sampling unit level to account for the multi-stage survey design. Assessments of statistical significance were made at the 0.05 level.
2.3.1 Are orphans more likely to have worse child outcomes than non-orphans?As discussed earlier, Kenya’s social protection sector defines child vulnerability in a narrow way, focusing on orphanhood and chronic illness. Based on data from the second Kenya AIDS Indicator Survey (KAIS 2012), there are an estimated 2.6 million children who meet the criteria for OVC in the country, of whom 1.8 million are orphans and 750,000 are considered to be vulnerable because of the presence of a chronically ill adult (Lee et al., 2014).
There is a common perception that children identified as OVCs are necessarily ‘vulnerable’. However, this is a largely untested claim, the validity of which needs to be evaluated empirically. To answer this question, we start by comparing selected child outcomes among orphans and non-orphans. In the following subsection, we conduct multivariate analysis to control for confounding factors and identify additional factors associated with poor child outcomes.
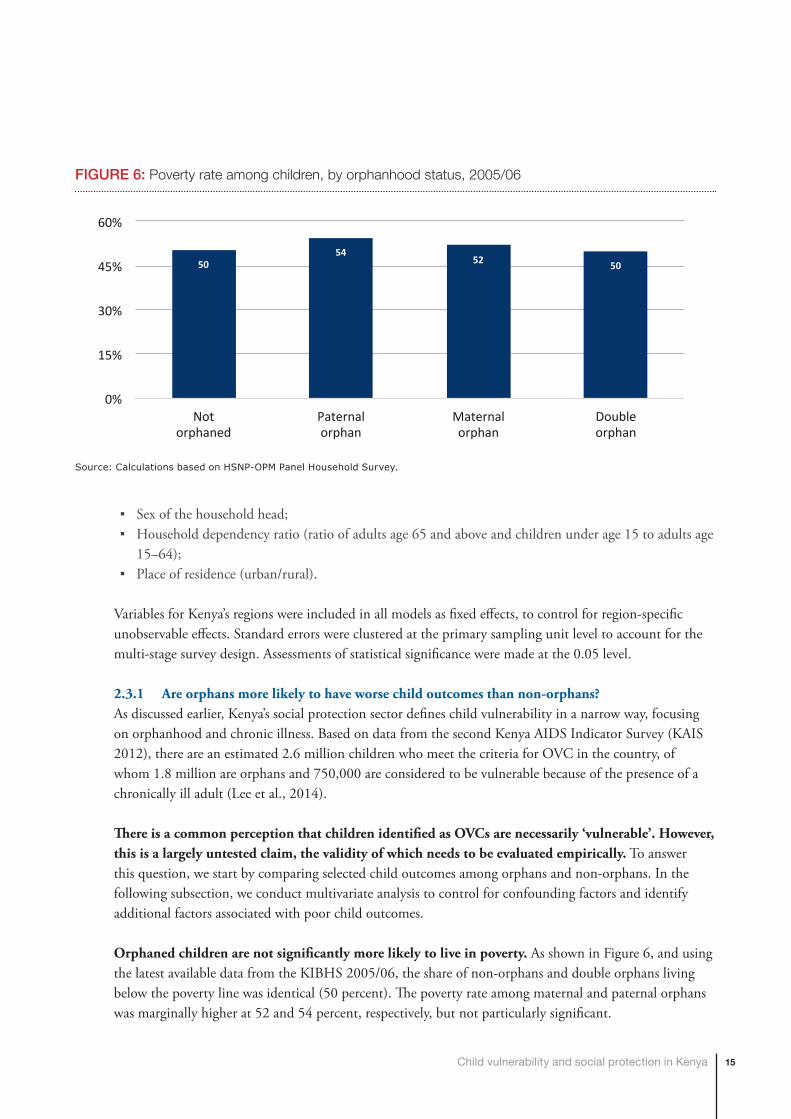
Orphaned children are not significantly more likely to live in poverty. As shown in Figure 6, and using the latest available data from the KIBHS 2005/06, the share of non-orphans and double orphans living below the poverty line was identical (50 percent). The poverty rate among maternal and paternal orphans was marginally higher at 52 and 54 percent, respectively, but not particularly significant.
5054
52 50
0%
15%
30%
45%
60%
Notorphaned
Paternalorphan
Maternalorphan
Doubleorphan
FIGURE 6: Poverty rate among children, by orphanhood status, 2005/06
Source: Calculations based on HSNP-OPM Panel Household Survey.
16
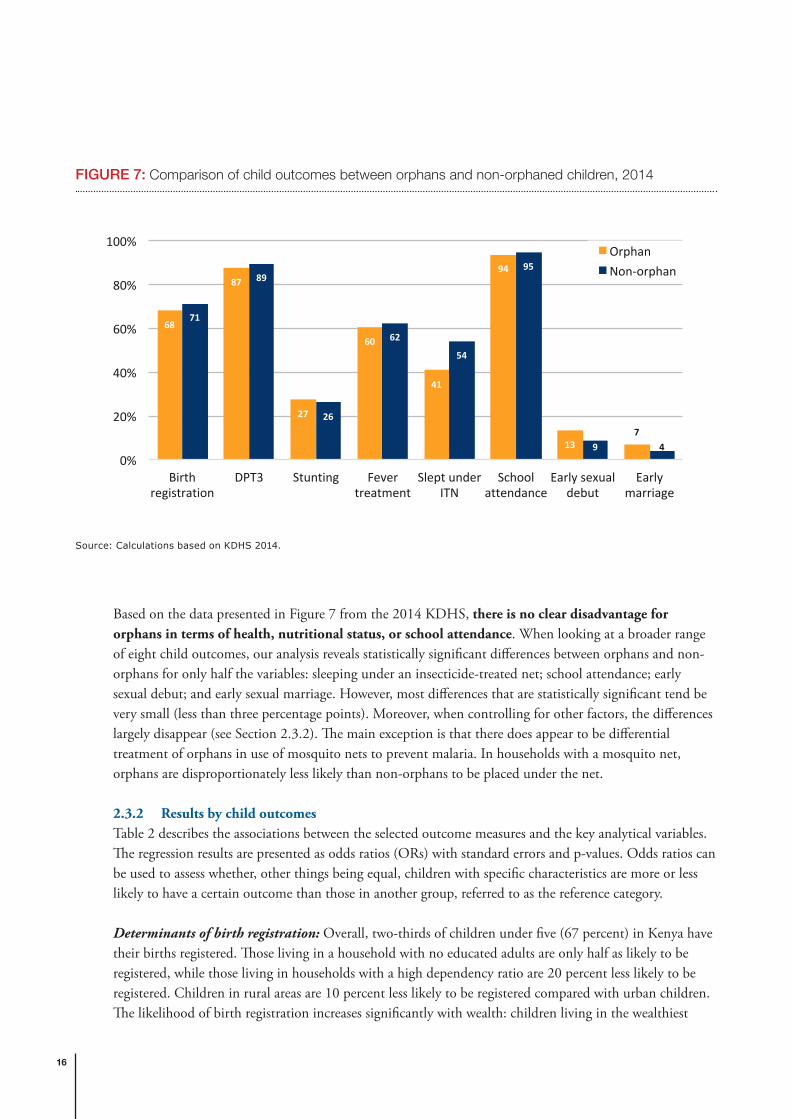
Based on the data presented in Figure 7 from the 2014 KDHS, there is no clear disadvantage for orphans in terms of health, nutritional status, or school attendance. When looking at a broader range of eight child outcomes, our analysis reveals statistically significant differences between orphans and non-orphans for only half the variables: sleeping under an insecticide-treated net; school attendance; early sexual debut; and early sexual marriage. However, most differences that are statistically significant tend be very small (less than three percentage points). Moreover, when controlling for other factors, the differences largely disappear (see Section 2.3.2). The main exception is that there does appear to be differential treatment of orphans in use of mosquito nets to prevent malaria. In households with a mosquito net, orphans are disproportionately less likely than non-orphans to be placed under the net.
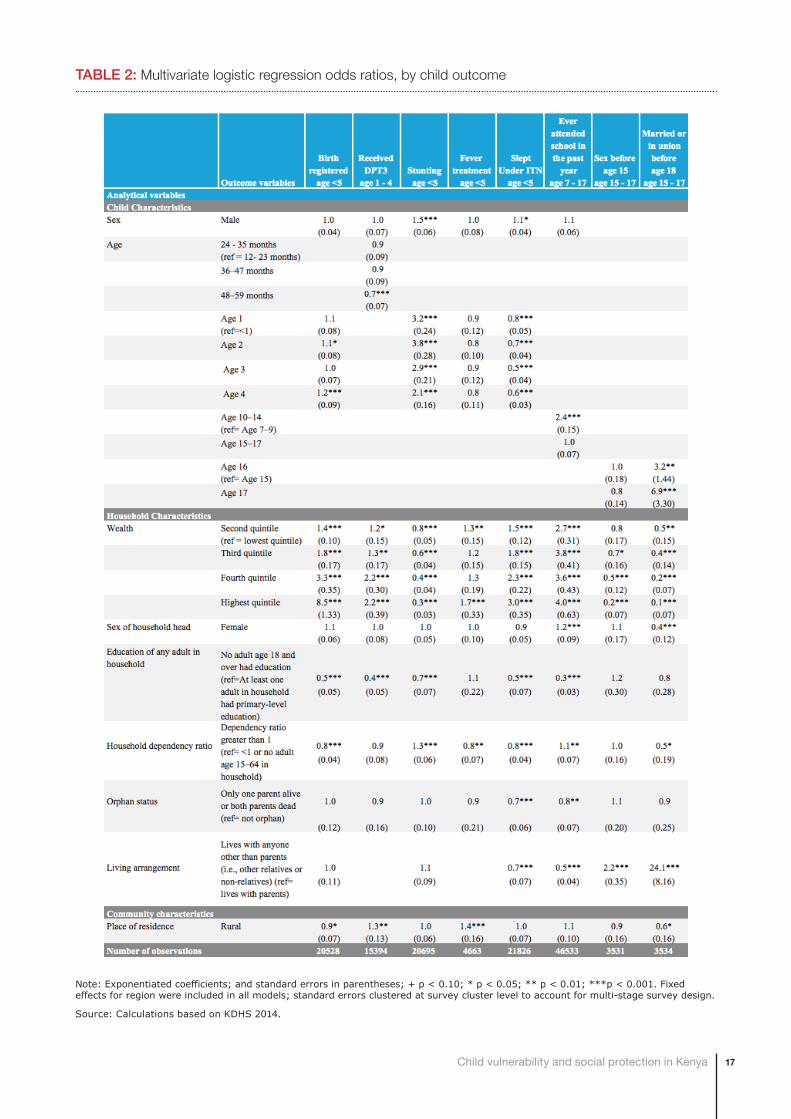
2.3.2 Results by child outcomesTable 2 describes the associations between the selected outcome measures and the key analytical variables. The regression results are presented as odds ratios (ORs) with standard errors and p-values. Odds ratios can be used to assess whether, other things being equal, children with specific characteristics are more or less likely to have a certain outcome than those in another group, referred to as the reference category.
Determinants of birth registration: Overall, two-thirds of children under five (67 percent) in Kenya have their births registered. Those living in a household with no educated adults are only half as likely to be registered, while those living in households with a high dependency ratio are 20 percent less likely to be registered. Children in rural areas are 10 percent less likely to be registered compared with urban children. The likelihood of birth registration increases significantly with wealth: children living in the wealthiest
68
87
27
60
41
94
137
71
89
26
62
54
95
9 40%
20%
40%
60%
80%
100%
Birthregistration
DPT3 Stunting Fevertreatment
SleptunderITN
Schoolattendance
Earlysexualdebut
Earlymarriage
OrphanNon-orphan
FIGURE 7: Comparison of child outcomes between orphans and non-orphaned children, 2014
Source: Calculations based on KDHS 2014.
17Child vulnerability and social protection in Kenya
Note: Exponentiated coefficients; and standard errors in parentheses; + p < 0.10; * p < 0.05; ** p < 0.01; ***p < 0.001. Fixed effects for region were included in all models; standard errors clustered at survey cluster level to account for multi-stage survey design.
Source: Calculations based on KDHS 2014.
TABLE 2: Multivariate logistic regression odds ratios, by child outcome
18
households are more than eight times more likely to have been registered than children living in the poorest households. There are no statistically significant differences based on the sex of the child or the sex of the household head, orphan status, or living arrangements.
Determinants of vaccination: The odds of having received DPT3 vaccine increases with each household wealth quintile. Other things being equal, children living in the wealthiest households are 2.2 times more likely to have received the vaccination compared with children living in the poorest households. Children under five experience 60 percent lower odds of having received their DPT3 vaccine if they are living in a household with no educated adults. There are no statistically significant differences based on the sex of the child or the sex of the household head, orphan status, or household dependency ratio.
Determinants of stunting: Nationwide, 26 percent of children under five are stunted. Household wealth is a significant predictor of stunting. The odds of stunting among children under five living in the wealthiest households are 70 percent lower compared with children living in the poorest households. Boys are 50 percent more likely to be stunted than girls, and the likelihood of stunting is greatest among one and two-year olds. Young children living in a household with a high dependency ratio have 30 percent greater odds of being stunted. There are no statistically significant differences based on the sex of the household head, orphan status, or living arrangements.
Determinants of fever treatment: Children under five living in households with a high dependency ratio are 20 percent less likely to have received fever treatment. The association of wealth quintile and fever treatment does not vary significantly, except among the second and the fifth quintiles. Children in the wealthiest households are 1.7 more likely to have been taken for fever treatment compared with children from the poorest households. There are no statistically significant differences based on the sex of the household head, the education status of adults in the household, or a child’s orphan status.
Determinants of sleeping under ITNs: Fifty-four percent of children under age five slept under an ITN the night before the survey. Household wealth is a significant predictor, with children living in the wealthiest households experiencing three times greater odds of sleeping under an ITN compared with children in the poorest households. Children living in households where no adult is educated are only half as likely to have slept under an ITN, while orphans and children living with anyone other than their parents are about 30 percent less likely to sleep under ITNs. A child’s age, sex and households’ dependency ratio are other statistically significant predictors.
Determinants of school attendance: The wealthier the household, the greater the odds that children aged 7-17 years attended school in the past year. The likelihood of attending school is four times higher for those living in the wealthiest households as compared with those in the poorest households. If no adults in the household are educated, children are about 70 percent less likely to attend school compared with their peers living in households where at least one adult has some education. Orphans are 20 percent less likely to have attended school compared with children whose parents are alive. Children living with anyone other than their parents experience 50 percent lower odds of having attended school compared with children living with one or both parents. Children in the age group 10-14 have the greatest odds of attending school. In fact, Kenya has a high level of school attendance overall among both boys and girls
19Child vulnerability and social protection in Kenya
aged 10-14 years, regardless of whether or not a parent is deceased (96 percent and 98 percent respectively) (KNBS, 2015).
Determinants of early sexual debut: Female adolescents living in the wealthiest households are 80 percent less likely to have experienced sexual debut before age 15 compared with the female adolescents in the poorest households. Female adolescents living with anyone other than their parents have almost double the odds of experiencing sex before age 15 compared with adolescents who lived with one or both parents. None of the other characteristics included in the model are statistically significant associates of early sexual debut.
Determinants of early marriage: The odds of early marriage among female adolescents decreases significantly with household wealth. Those living in the wealthiest households are 90 percent less likely to be married before age 18 than those living in poorest households. Female adolescents living in female-headed households are 60 percent less likely to marry early compared with those living in male-headed households. Other things being equal, the odds of early marriage are more than 24 times greater for adolescents living with other relatives or no relatives compared with those living with one or both parents. On the other hand, orphans and non-orphans have a similar probability of early marriage.
2.3.3 Results by markers of vulnerabilityOut of all potential proxies of vulnerability analysed, household wealth is the only marker to consistently show association or the power to differentiate across age-disaggregated outcomes. Children’s odds of attending school, birth registration, receiving DPT3 vaccine, and sleeping under an ITN increase significantly with rising household wealth. The odds of being chronically malnourished, experiencing early sexual debut or early marriage drop with each increase in wealth ranking compared with the poorest households.
A lack of education among adults in the households is the next most significant marker of vulnerability. The lack of educated adults in the households is significantly associated with lower odds of birth registration, receiving DPT3, sleeping under an ITN, and school attendance.
Children’s living arrangements have a strong association with poor outcomes especially among older girls. Other things being equal, children living with anyone other than their parents have lower odds of attending school and adolescent girls significantly higher odds of experiencing early sexual debut or early marriage.
Households’ dependency ratio has a bidirectional association with child outcomes. Children living in households with high dependency ratios are less likely to have their birth registered, to sleep under an ITN, to receive fever treatment and more likely to be stunted. However, children living in households with high dependency ratio have somewhat greater odds of school attendance and lower odds of early marriage.
Orphanhood is not consistently associated with poor child outcomes. After controlling for other factors, orphans are equally likely to have their births registered, to receive vaccinations, to be chronically malnourished, to receive treatment for fever, or to experience early sexual debut or marriage compared
20
with non-orphaned children. Orphan status is a statistically significant marker only for sleeping under an ITN and school attendance, although school attendance is high among both boys and girls, regardless of whether or not they have lost a parent.
2.4 Other at-risk groupsAs mentioned above, one limitation of the preceding analysis is that the KDHS did not collect information on a number of important aspects of child well-being, such as disability, child labour, or children on the streets.
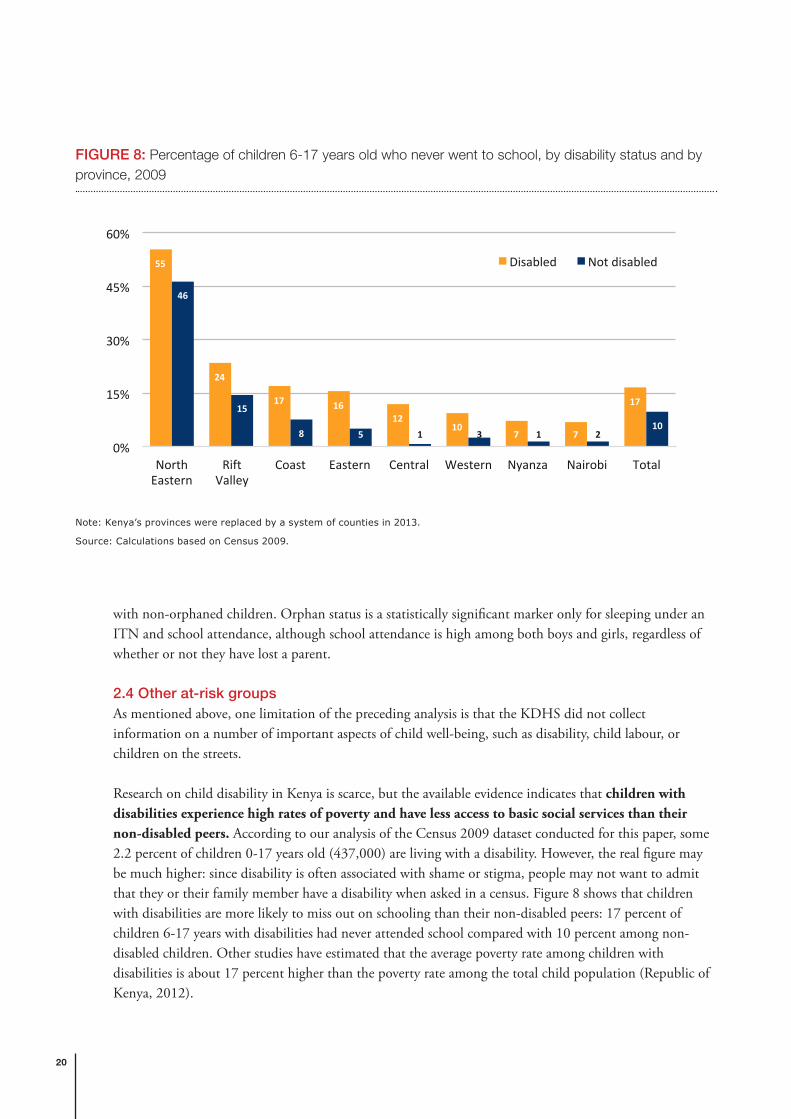
Research on child disability in Kenya is scarce, but the available evidence indicates that children with disabilities experience high rates of poverty and have less access to basic social services than their non-disabled peers. According to our analysis of the Census 2009 dataset conducted for this paper, some 2.2 percent of children 0-17 years old (437,000) are living with a disability. However, the real figure may be much higher: since disability is often associated with shame or stigma, people may not want to admit that they or their family member have a disability when asked in a census. Figure 8 shows that children with disabilities are more likely to miss out on schooling than their non-disabled peers: 17 percent of children 6-17 years with disabilities had never attended school compared with 10 percent among non-disabled children. Other studies have estimated that the average poverty rate among children with disabilities is about 17 percent higher than the poverty rate among the total child population (Republic of Kenya, 2012).
55
24
17 1612
107 7
17
46
15
8 5 1 3 1 210
0%
15%
30%
45%
60%
NorthEastern
RiftValley
Coast Eastern Central Western Nyanza Nairobi Total
Disabled Notdisabled
FIGURE 8: Percentage of children 6-17 years old who never went to school, by disability status and by province, 2009
Note: Kenya’s provinces were replaced by a system of counties in 2013.
Source: Calculations based on Census 2009.

21Child vulnerability and social protection in Kenya
The prevalence of child labour remains high in Kenya. UNICEF’s Multiple Indicator Cluster Survey (MICS) conducted in 2000 found that 27 percent of boys and 25 percent of girls aged 5-14 years were engaged in child labour, while the 2005/06 KIHBS estimated that over 1 million children aged 5-17 years were working for pay, profit or family gain. Research conducted in the districts of Busia, Kili, and Kitui in 2012 indicates that the majority of children work in the informal sector, for example, in subsistence and commercial agriculture, construction, mines or as domestic servants (UNICEF, 2014b).
Data and statistics on other at-risk groups are limited. According to one estimate reported in UNICEF (2014b), there are between 250,000 and 300,000 children living and working on the streets. According to records from the Department of Children’s Services, there are over 700 charitable children’s institutions housing up to 42,000 children, but the exact number of children residing in institutions is unknown and may be higher. Moreover, children make up an estimated 4 per cent of the prison population and most of them are accompanying imprisoned mothers (UNICEF, 2014b). Kenya is also hosting close to 600,000 refugees and asylum-seekers, out of whom 57 percent are children under 18 (UNHCR, 2015).
2.5 ConclusionKenya’s social protection sector defines child vulnerability in a narrow way, focusing on orphanhood and chronic illness. There is a common perception that children identified as OVCs are necessarily ‘vulnerable’. However, based on extensive statistical analysis of different nationally representative survey datasets, we conclude that orphaned children are not significantly more likely to live in poverty compared with non-orphaned children. Moreover, orphanhood is not consistently associated with worse child outcomes in other domains such as birth registration, health, nutrition, early marriage or early sexual debut. These findings are not unique to Kenya. Indeed, studies conducted in other countries in Africa and the rest of the world have also found that orphans are not necessarily more disadvantaged than their non-orphaned peers (UNICEF, 2014a; Akwara, 2010; Mishra et al., 2008). This means that social protection cash transfers should not focus exclusively on targeting children who are orphaned.
We also assessed whether there are other markers that can be used to accurately identify vulnerable children and that can serve as a new definition of child vulnerability appropriate within the Kenyan context. Overall, household wealth is the only consistent and reliable predictor of childhood vulnerability across a range of across age-disaggregated outcomes. Other relevant criteria include living in a household where adults lack education and living with anyone other than the child’s parents, though these criteria are less reliable predictors of childhood vulnerability than household wealth. From a lifecycle perspective, young children under five living in income-poor households should be prioritised: evidence from the fields of neuroscience and developmental psychology show that poverty especially during early childhood can have negative and irreversible effects that last through adulthood. Disability is a risk across the lifecycle and the limited evidence that is available on the situation of children with disabilities indicates that they experience higher rates of poverty and have less access to basic social services than their non-disabled peers.

22
3 EFFECTIVENESS OF CASH TRANSFER SCHEMES IN REACHING VULNERABLE CHILDREN

23Child vulnerability and social protection in Kenya
3 Effectiveness of cash transfer schemes in reaching vulnerable children
Kenya has four main tax-financed social security schemes: the Cash Transfers for Orphans and Vulnerable Children (CT-OVC); the Older Persons Cash Transfer (OPCT); the Persons with Severe Disability Cash Transfer (PWSD-CT); and the Hunger Safety Net Programme (HSNP). Together, these schemes were reaching approximately 520,000 households in 2015. Table 3 below shows the coverage of each of the programmes, the transfer value per household per month, and the programmes’ annual cost in local currency and expressed as a percentage of gross domestic product (GDP). In 2015, the OPCT and the PWSD-CT were fully financed by the government of Kenya, while 21 percent of funding for the CT-OVC and 85 percent for the HSNP were contributions from development partners.
SCHEME TARGET POPULATION
NUMBER OF HOUSEHOLDS
VALUE OF TRANSFER (KSH PER MONTH)
COST OF PROGRAMME (KSH)
COST OF PROGRAMME (% OF GDP)
Cash Transfer for Orphans and Vulnerable Children (CT-OVC)
Poor households caring for OVCs
255,643 Ksh 2,000 Ksh 6.5 billion
(US$ 70.2 million)
0.11
Older Persons Cash Transfer (OPCT)
Poor households with a member aged 65 or older
162,695 Ksh 2,000 Ksh 5.6 billion (US$ 60.6 million)
0.09
Persons with Severe Disabilities Cash Transfer (PWSD-CT)
People with severe disabilities who need permanent care
25,471 Ksh 2,000 Ksh 776 million
(US$ 8.4 million)
0.01
Hunger Safety Net Programme (HSNP)
Extreme poor households in four counties in northern Kenya
84,340 Ksh 2,550 Ksh 4.1 billion
(US$ 44.0 million)
0.07
Total 519,878 Ksh 16.9 billion 0.28
TABLE 3: Tax financed social security schemes in Kenya, 2014/2015
Source: Ministry of Labour and East African Affairs (2016).
24
The proportion of children of different ages that are covered by and excluded from social security transfers is central to understanding a social protection system’s level of child sensitivity. The extent to which particularly vulnerable children are reached is also critical. Drawing on administrative data from Kenya’s management information systems, the Single Registry and survey data from the 2014 KDHS, this section explores issues of under-coverage and the exclusion of children from social protection schemes in Kenya. It begins by estimating the overall share of children under 18 years that are reached by the current social security programmes in Kenya, disaggregated by age, sex and region. Next, we examine coverage and exclusion among children from the poorest households, orphans, and those with disabilities.
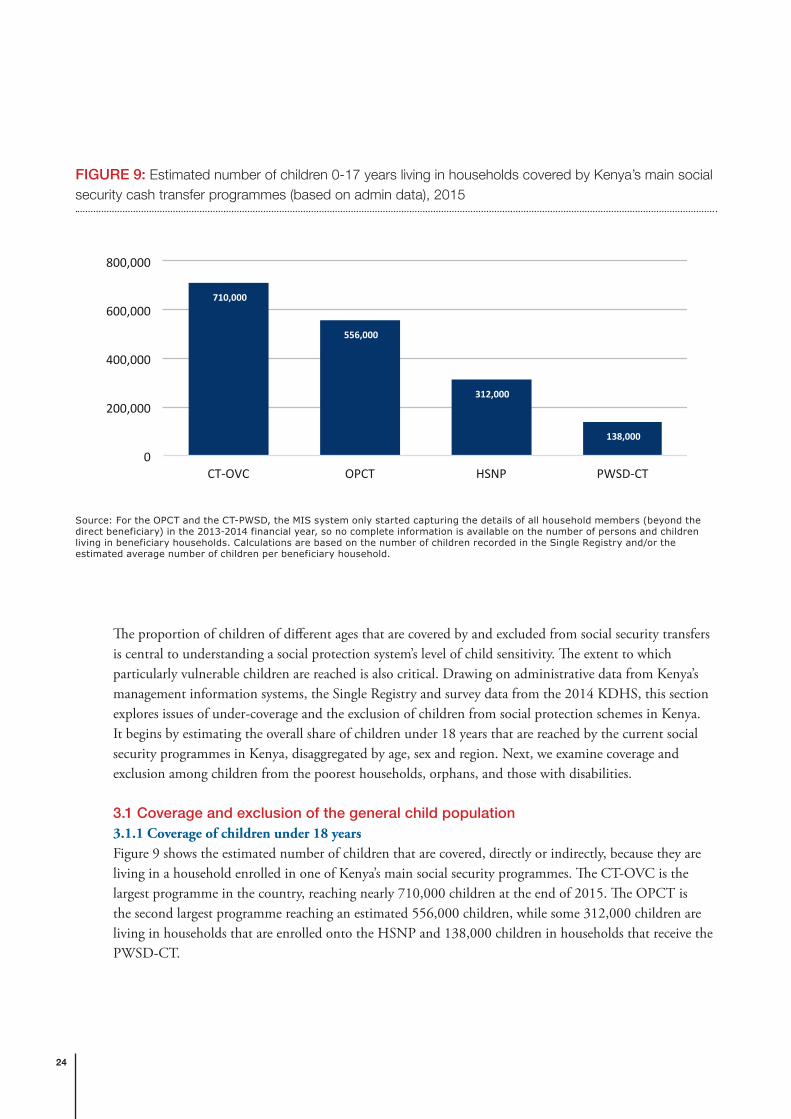
3.1 Coverage and exclusion of the general child population3.1.1 Coverage of children under 18 yearsFigure 9 shows the estimated number of children that are covered, directly or indirectly, because they are living in a household enrolled in one of Kenya’s main social security programmes. The CT-OVC is the largest programme in the country, reaching nearly 710,000 children at the end of 2015. The OPCT is the second largest programme reaching an estimated 556,000 children, while some 312,000 children are living in households that are enrolled onto the HSNP and 138,000 children in households that receive the PWSD-CT.
710,000
556,000
312,000
138,000
0
200,000
400,000
600,000
800,000
CT-OVC OPCT HSNP PWSD-CT
FIGURE 9: Estimated number of children 0-17 years living in households covered by Kenya’s main social security cash transfer programmes (based on admin data), 2015
Source: For the OPCT and the CT-PWSD, the MIS system only started capturing the details of all household members (beyond the direct beneficiary) in the 2013-2014 financial year, so no complete information is available on the number of persons and children living in beneficiary households. Calculations are based on the number of children recorded in the Single Registry and/or the estimated average number of children per beneficiary household.

25Child vulnerability and social protection in Kenya
Overall, the share of children benefiting directly or indirectly from social security schemes remains low. To estimate levels of coverage, we can either rely on estimates generated from representative surveys or compare administrative data with the estimated number of children in the country. Table 4 shows the estimated coverage of the different social security programmes according to the 2014 KDHS. It indicates that less than 2 percent of children 0-17 years were living in a household that received social transfers at the time of the survey. Estimates of coverage obtained from more recent administrative data are somewhat higher.1 For example, the 710,000 children recorded in the CT-OVC database at the end of 2015 represent 3.2 percent of the estimated child population of 22.3 million (UNDESA, 2015), while around 7.5 percent of the total child population is estimated to benefit, directly or indirectly, from one of the main cash transfer programmes.
The relative coverage of the social security schemes is expected to increase as the programmes continue to expand to different areas of the country. Under the government’s multi-year expansion plan, the total number of households enrolled in any social security scheme is projected to increase from around 520,000 in 2014/15 to 1,140,000 in 2016/17. However, this would still be limited coverage, with an estimated 10 percent of households nationally in receipt of a social security benefit. In this context, it is important to note that Kenya has one of the fastest growing populations in the world, adding more than one million people to its total population every single year. Since the latest census in 2009, it is estimated that the population has grown from 38.6 million to 46 million in 2015 (UNDESA, 2015).
1 It is not uncommon that the share of social transfers captured in household surveys is lower when compared with administrative data. This is because many such programmes are targeted to relatively narrow groups, which may be underrepresented in nationwide surveys. Moreover, statistical estimates for these small subsamples are characterized by large sampling errors. Finally, coverage of the programmes has expanded since the KDHS was conducted in 2014.
HOUSEHOLDS PERSONS CHILDREN
Cash transfers to orphans and vulnerable children (CT-OVC)
2.9% [CI: 2.6-3.2] 0.8% [CI: 0.6-1.1] 0.9% [CI: 0.7-1.3]
Older persons cash transfer (OPCT)
0.6% [CI: 0.5-0.8] 0.7% [CI: 0.5-0.8] 0.6% [CI: 0.5-0.8]
Persons with severe disability cash transfer (PWSD-CT)
0.1% [CI: 0.0-0.1] 0.1% [CI: 0.0-0.2] 0.1% [CI: 0.0-0.2]
Hunger safety net programme (HSNP)
0.2% [CI: 0.2-0.3] 0.3% [CI: 0.2-0.4] 0.3% [CI: 0.2-0.5]
Food/cash for assets (FFA/CFA)
0.1% [CI: 0.1-0.2] 0.1% [CI: 0.1-0.2] 0.1% [CI: 0.1-0.2]
TABLE 4: Estimated percentage of children living in households covered by Kenya’s main social security cash transfer programmes (based on survey data), 2014
Note: Values in brackets show the 95 percent confidence intervals.
Source: Calculations based on the 2014 KDHS.
26
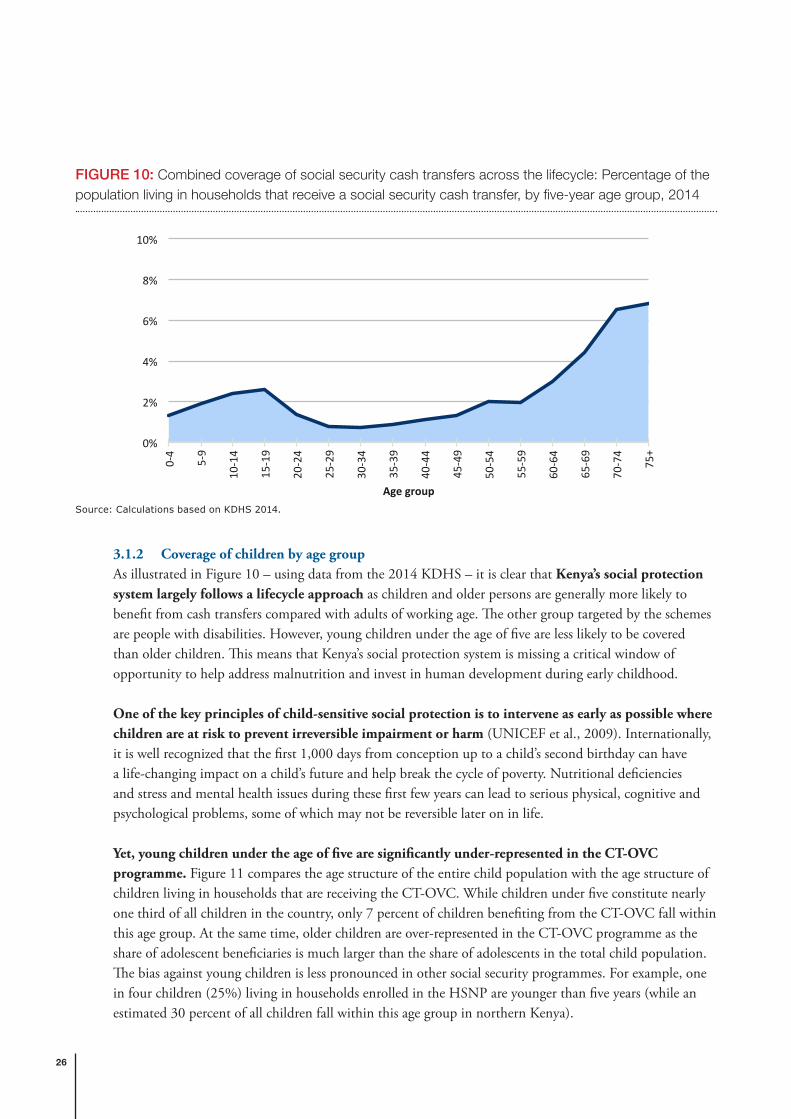
3.1.2 Coverage of children by age groupAs illustrated in Figure 10 – using data from the 2014 KDHS – it is clear that Kenya’s social protection system largely follows a lifecycle approach as children and older persons are generally more likely to benefit from cash transfers compared with adults of working age. The other group targeted by the schemes are people with disabilities. However, young children under the age of five are less likely to be covered than older children. This means that Kenya’s social protection system is missing a critical window of opportunity to help address malnutrition and invest in human development during early childhood.
One of the key principles of child-sensitive social protection is to intervene as early as possible where children are at risk to prevent irreversible impairment or harm (UNICEF et al., 2009). Internationally, it is well recognized that the first 1,000 days from conception up to a child’s second birthday can have a life-changing impact on a child’s future and help break the cycle of poverty. Nutritional deficiencies and stress and mental health issues during these first few years can lead to serious physical, cognitive and psychological problems, some of which may not be reversible later on in life.
Yet, young children under the age of five are significantly under-represented in the CT-OVC programme. Figure 11 compares the age structure of the entire child population with the age structure of children living in households that are receiving the CT-OVC. While children under five constitute nearly one third of all children in the country, only 7 percent of children benefiting from the CT-OVC fall within this age group. At the same time, older children are over-represented in the CT-OVC programme as the share of adolescent beneficiaries is much larger than the share of adolescents in the total child population. The bias against young children is less pronounced in other social security programmes. For example, one in four children (25%) living in households enrolled in the HSNP are younger than five years (while an estimated 30 percent of all children fall within this age group in northern Kenya).
0%
2%
4%
6%
8%
10%
0-4
5-9
10-14
15-19
20-24
25-29
30-34
35-39
40-44
45-49
50-54
55-59
60-64
65-69
70-74
75+
Agegroup
FIGURE 10: Combined coverage of social security cash transfers across the lifecycle: Percentage of the population living in households that receive a social security cash transfer, by five-year age group, 2014
Source: Calculations based on KDHS 2014.

27Child vulnerability and social protection in Kenya
The under-coverage of young children is mostly a consequence of the criteria used to determine eligibility for the CT-OVC. Survey data indicate that the likelihood of becoming an orphan increases sharply with age. The share of children who have lost one or both parents goes up from around 3 percent among under-fives to nearly 19 percent among children aged 15-17 years old (KNBS, 2015). As a result, older children are much more likely to fulfil the eligibility criteria for the programme than younger children. Figure 12 confirms that the age structure of CT-OVC beneficiaries is broadly in line with the age structure of orphaned children.
3229
25
13
7
27
39
27
0%
10%
20%
30%
40%
50%
0-4yrs 5-9yrs 10-14yrs 15-17yrsAgegroup
Allchildren ChildreninCT-OVCbeneficiaryhouseholds
FIGURE 11: Comparison of the age structure of the child population and CT-OVC beneficiaries: percentage distribution by age group, 2015
Source: Calculations based on UNDESA (2015) and CT-OVC MIS database (2015).
10
25
41
24
7
27
39
27
0%
10%
20%
30%
40%
50%
0-4yrs 5-9yrs 10-14yrs 15-17yrsAgegroup
Allorphans ChildreninCT-OVCbeneficiaryhouseholds
FIGURE 12: Comparison of the age structure of orphans and CT-OVC beneficiaries: percentage distribution by age group, 2015
Source: Calculations based on KDHS 2014 and CT-OVC MIS database (2015).
28
Nonetheless, there remains a slight bias against young children as 10 percent of orphaned children fall within the 0-4 year age group compared with only 7 percent of CT-OVC beneficiaries. This may be because (re-)targeting is undertaken infrequently, so there may be a lag between the time that children become orphaned and when they are able to enrol onto the programme. Moreover, as explained in Section 2.1, the methodology used for calculating poverty in Kenya is biased against young children, so it may be possible that households with young children are somewhat less likely to be selected by the proxy means test compared with those that have older children.
3.1.3 Coverage of children by sexAvailable data from the Single Registry indicates that girls may be slightly under-represented in Kenya’s social security cash transfer programmes. For instance, in 2015, female children represented 48.8 percent of all children living in CT-OVC beneficiary households and male children represented 51.2 percent. Yet, based on estimates from the 2014 KDHS and population projection, female orphans represent 50.4 percent of the total number of children 0-17 years who have lost one or both parents. Likewise, female children represent 47.7 percent of all children living in household enrolled onto the HSNP while male children represent 52.3 percent.
So, there appears to be a slight imbalance, although the difference between boys and girls is not very large. An evaluation of the CT-OVC programme conducted between 2007 and 2009 found that, when communities were asked to list children orphaned during the last 12 months in their community, 59 percent of the children named were boys (OPM, 2010). This suggests that there may be some gender bias when communities are asked to draw up lists of potentially eligible households for the programme.
0%
4%
8%
12%
16%
Kericho
Nairobi
Kiam
bu
Narok
Tharaka-Nith
iWestP
okot
Kisumu
Meru
Nyamira
Mandera
Kisii
Embu
Laikipia
Nyeri
Murang'A
Nyandarua
Kajiado
Nandi
UasinGish
uElgeyoM
arakwet
Vihiga
Migori
Nakuru
Barin
go
Siaya
Mom
basa
Makueni
Garissa
Kirin
yaga
Kitui
HomaBay
Bungom
aKilifi
Machakos
Busia
Kw
ale
Kakamega
Lamu
TanaRiver
Bomet
Isiolo
Trans-Nzoia
TaitaTaveta
Samburu
Wajir
Marsabit
Turkana
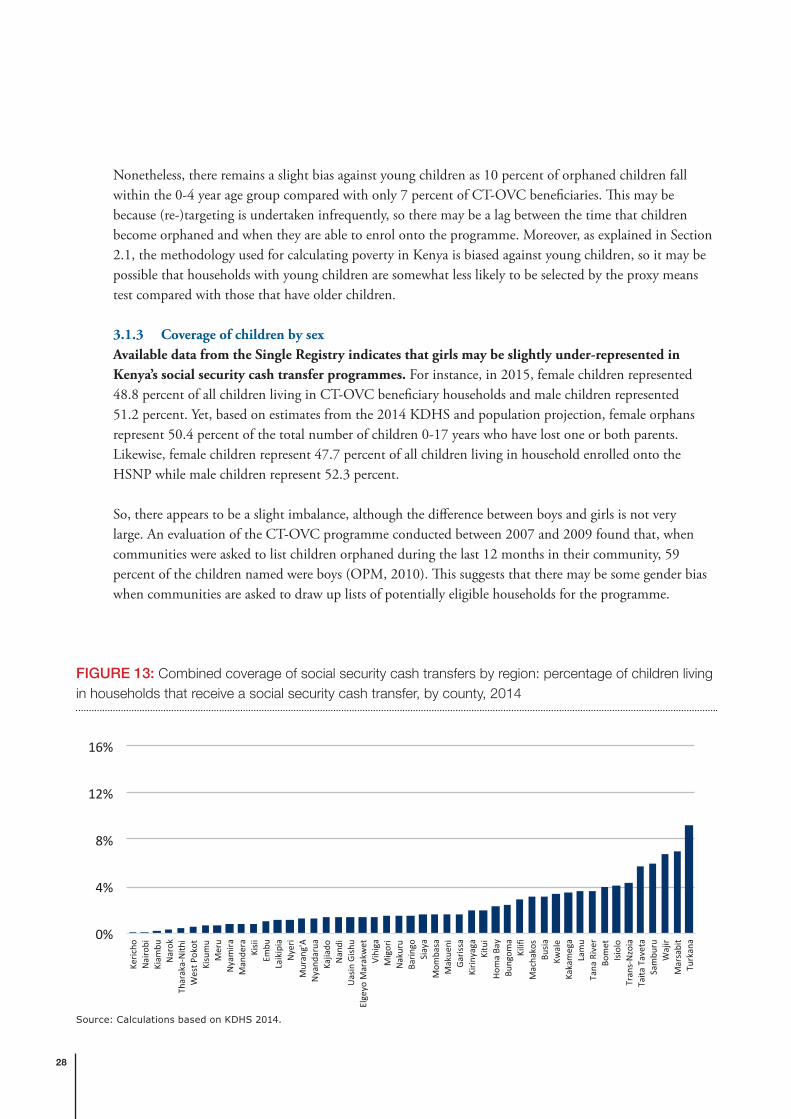
FIGURE 13: Combined coverage of social security cash transfers by region: percentage of children living in households that receive a social security cash transfer, by county, 2014
Source: Calculations based on KDHS 2014.

29Child vulnerability and social protection in Kenya
3.1.4 Coverage of children by regionAs illustrated in Figure 13 – using data from the 2014 KDHS – there are significant geographic disparities in the coverage of children across the country. The estimated share of children benefiting, directly or indirectly, from one of the main social security cash transfer programmes ranged from a high of 9.3 percent in Turkana to a low of 0.1 percent in Nairobi in 2014. This is not an unexpected finding since all of the four programmes first target resources to the poorest geographical areas and then, within those areas, identify households that fall into the categories that are eligible for support. Under the government’s multi-year expansion plan, 30 percent of any new number of beneficiaries allocated to a cash transfer programme in each fiscal year should be distributed among all 290 constituencies in Kenya, with the remaining 70 percent being allocated to locations prioritized according to their poverty levels.
3.2 Coverage and exclusion of orphaned childrenFigure 14 shows the estimated share of orphans and non-orphaned children covered by the main cash transfer programmes, based on data from the 2014 KDHS. Overall, children who have lost one or both parents are more than three times more likely to live in a household that is enrolled onto a cash transfer programme compared with their non-orphaned peers. This is as expected because orphans are the explicit target group of the CT-OVC, which is the largest programme in the country.
Moreover, orphanhood is also a common proxy of vulnerability used in the other cash transfer programmes, particularly during the community-based targeting processes when lists of potentially eligible households are drawn up. For instance, based on data from the Single Registry, an estimated 27 percent of households enrolled onto the HSNP have at least one orphaned child (significantly higher than the
2 2 2 2 2
3
6
87
7
0%
2%
4%
6%
8%
10%
0-4yrs 5-9yrs 10-14yrs 15-17yrs TotalAgegroup
Non-ophans Orphans
FIGURE 14: Percentage of children living in households that receive a social security cash transfer, by orphan status, 2014
Source: Calculations based on KDHS 2014.

30
13 percent of households nationwide that are housing an orphan). The criteria used for the selection of beneficiary households for the OPCT programme also include the number of OVCs in the household, as eligible households should be ranked using the following criteria (in order of priority): age of the oldest member in a household; poverty level of a household; number of OVCs in a household; number of PWDs in a household; and number of chronically ill individuals in a household.
3.3 Coverage and exclusion of children in the poorest householdsHousehold wealth is the most consistent marker of child vulnerability and poor development outcomes (see Section 2.5). However, because of their low coverage, existing national social security programmes do not reach the vast majority of children living in the poorest wealth quintiles. As illustrated in Figure 15, even though coverage is pro-poor because children from the poorest households are more likely to benefit, more than 95 percent of children in the bottom quintiles do not yet receive support.
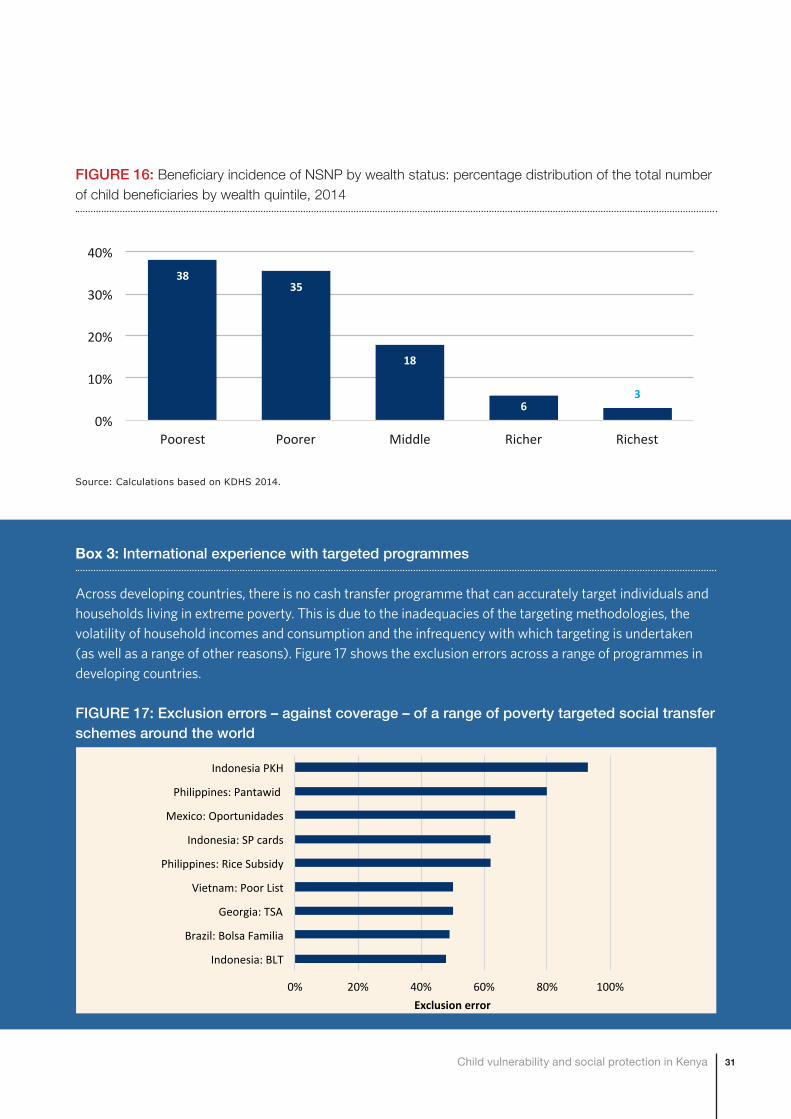
Despite the challenges of under-coverage and exclusion, nearly three-quarters of child beneficiaries fall within the bottom 40 percent of the national wealth distribution (Figure 16). This would generally be regarded as good targeting performance. Yet, the national social security programmes explicitly attempt to target the ultra-poor, and about a quarter of beneficiaries are from the middle or wealthier households according to the 2014 KDHS. This is not surprising: no developing country in the world has ever succeeded in conducting accurate poverty-targeting. As explained in Section 2, targeting the poor is – as a result of the volatility of incomes – effectively like trying to hit a moving target, in particular in the subsistence and informal sectors. In fact, it is common for the best targeted programmes in the world to exclude over half of their intended beneficiaries (see Box 3).
3.2 3.1
1.70.6 0.4
0%
2%
4%
6%
8%
10%
Poorest Poorer Middle Richer Richest
FIGURE 15: Coverage of social security schemes by wealth status: percentage of children living in households that receive a social security cash transfer, by wealth quintile, 2014
Source: Calculations based on KDHS 2014.
31Child vulnerability and social protection in Kenya
3835
18
63
0%
10%
20%
30%
40%
Poorest Poorer Middle Richer Richest
FIGURE 16: Beneficiary incidence of NSNP by wealth status: percentage distribution of the total number of child beneficiaries by wealth quintile, 2014
Source: Calculations based on KDHS 2014.
Box 3: International experience with targeted programmes
Across developing countries, there is no cash transfer programme that can accurately target individuals and households living in extreme poverty. This is due to the inadequacies of the targeting methodologies, the volatility of household incomes and consumption and the infrequency with which targeting is undertaken (as well as a range of other reasons). Figure 17 shows the exclusion errors across a range of programmes in developing countries.
FIGURE 17: Exclusion errors – against coverage – of a range of poverty targeted social transfer schemes around the world
0% 20% 40% 60% 80% 100%
Indonesia:BLT
Brazil:BolsaFamilia
Georgia:TSA
Vietnam:PoorList
Philippines:RiceSubsidy
Indonesia:SPcards
Mexico:Oportunidades
Philippines:Pantawid
IndonesiaPKH
Exclusionerror
32
3.4 Children with disabilitiesBased on data from the Single Registry, it is estimated that around one in three persons with severe disabilities (33 percent) who are receiving the PWSD-CT are children under the age of 18 years. The total number of children with severe disabilities estimated to be enrolled onto the PWSD-CT is around 7,000. However, these figures should be treated with caution as the MIS database of the PWSD-CT is missing the date of birth of a large number of beneficiaries. Nonetheless, it is clear that coverage is low (less than 2 percent) when compared with the 437,000 children 0-17 years old that were reported to have a disability in the census 2009. Moreover, the programme only targets persons with severe disabilities, yet many children may have mild and moderate disabilities that could be overcome with assistance, which would enable them to participate and develop their abilities.
3.5 ConclusionThis section reviewed the effectiveness of Kenya’s various social protection schemes in reaching children, directly or indirectly, using data from the country’s social protection management information systems (MIS), the Single Registry and recent survey data from the 2014 KDHS. It estimated that CT-OVC programme was reaching nearly 710,000 children under the age of 18 years at the end of 2015. Moreover, an estimated 556,000 children were living in households receiving the OPCT, around 312,000 children were living in households enrolled onto the HSNP and some 138,000 children were in households receiving the PWSD-CT. Nonetheless, total coverage remains relatively low: 7.5 percent of the total child population is estimated to benefit, directly or indirectly, from one of the main cash transfer programmes (based on admin data).
We also assessed to what extent Kenya’s cash transfer programmes are reaching vulnerable children to identify specific gaps in coverage. Children who have lost one or both parents are significantly more likely to be covered than their non-orphaned peers. This is as expected because orphans are the explicit target group of the CT-OVC and orphanhood is also a common proxy of vulnerability used in the other cash transfer programmes. However, as discussed in Section 2, orphanhood is not a reliable predictor of childhood vulnerability, so Kenya’s cash transfer system excludes many other non-orphaned children who are equally or more vulnerable by design.
Household wealth is the most consistent and reliable predictor of childhood vulnerability. Because of their low coverage, existing national social security programmes do not reach the vast majority of children living in the poorest wealth quintiles. Despite the challenges of under-coverage and exclusion, nearly three-quarters of child beneficiaries do fall within the bottom 40 percent of the national wealth distribution. This would generally be regarded as good targeting performance, but it also highlights the difficulties that Kenya’s programmes (like elsewhere in the world) experience in trying to reach their target group of ultra-poor households.
A major gap in the system is the very low coverage of young children. Children under the age of five are significantly under-represented in the CT-OVC and, to a lesser extent, in the other programmes too. This goes against one of the key principles of child-sensitive social protection: to intervene as early as possible where children are at risk to prevent irreversible impairment or harm. The coverage of children with disabilities is also estimated to be very low (less than 2 percent).
33Child vulnerability and social protection in Kenya
4 PROPOSALS FOR BUILDING A MORE COMPREHENSIVE AND CHILD-SENSITIVE LIFECYCLE SOCIAL PROTECTION SYSTEM

34
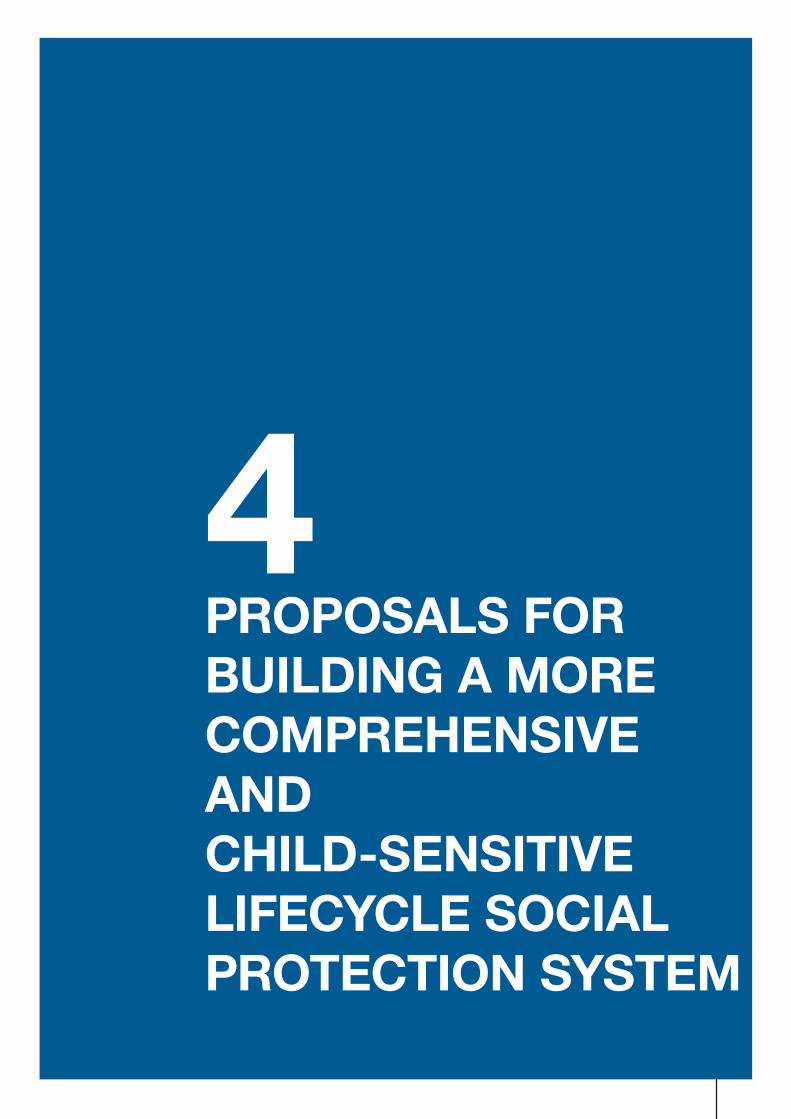
4 Proposals for building a more comprehensive and child-sensitive lifecycle social protection systemBuilding on the preceding analysis, this section puts forward a number of proposals for building a more inclusive and child-sensitive lifecycle national social protection system, in line with the vision outlined in Kenya’s National Social Protection Strategy (2011) and the right to social security for all citizens enshrined in the national Constitution. It starts by briefly reviewing the case for using a lifecycle approach to social protection, and then proposes options for strengthening the CT-OVC, OPCT and HSNP schemes. The options were developed using a micro-simulation model that estimates the costs and impacts of different types of cash transfers programmes in Kenya.
4.1 A lifecycle approach to social protectionBroadly speaking, there are two types of approaches to building social protection systems. The first attempts to target social assistance schemes to households living in poverty. The second aims to address the challenges that people face across the lifecycle, such as in childhood, working age and old age. Typical lifecycle schemes include old age pensions, disability benefits, and child benefits. These are often provided as entitlements for all citizens, rather than as poverty targeted social assistance. So, while social assistance benefits for households tackle the symptoms of poverty, lifecycle schemes tackle some of the key underlying causes of poverty.
As a result of the limited coverage and effectiveness of many social security systems in developing countries, the United Nations initiated an international initiative for countries to support the introduction of social protection floors. This Initiative was reinforced in 2012 when governments – including Kenya – adopted the Social Protection Floors Recommendation (No. 202) at the 101st Session of the International Labour Conference. Social protection floors are nationally-defined sets of basic social security guarantees which secure protection aimed at preventing or alleviating poverty, vulnerability and social exclusion. These guarantees should ensure at a minimum that, over the life cycle, all in need have access to essential health care and basic income security.
Moving towards a more inclusive lifecycle social protection system is an explicit policy objective outlined in Kenya’s National Social Protection Strategy (2011, p. 23-24):
“In the immediate to medium term, the government, by coordinating the currently fragmented social protection interventions, will establish and provide a basic minimum social protection package as defined in the AU Social Protection Framework (2008). In the meantime, the Government will also be planning longer-term actions in line with the UN/ILO Social Protection Floor (SPF) Initiative, which guarantees a universal minimum package that adopts a lifecycle approach to social protection. The SPF package consists of the following elements: access to education and essential health services; income security through family or child benefits; unemployment benefits; disability benefits; and income security in old age (through both contributory and non-contributory pensions).”
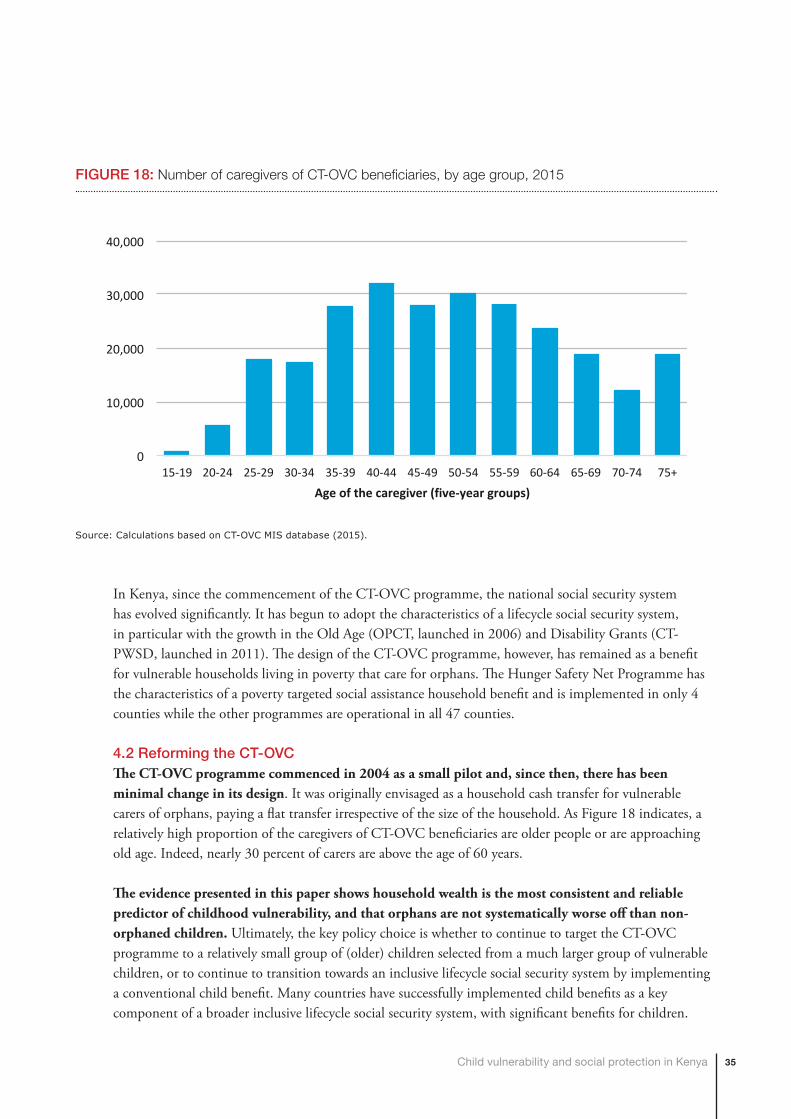
35Child vulnerability and social protection in Kenya
In Kenya, since the commencement of the CT-OVC programme, the national social security system has evolved significantly. It has begun to adopt the characteristics of a lifecycle social security system, in particular with the growth in the Old Age (OPCT, launched in 2006) and Disability Grants (CT-PWSD, launched in 2011). The design of the CT-OVC programme, however, has remained as a benefit for vulnerable households living in poverty that care for orphans. The Hunger Safety Net Programme has the characteristics of a poverty targeted social assistance household benefit and is implemented in only 4 counties while the other programmes are operational in all 47 counties.
4.2 Reforming the CT-OVCThe CT-OVC programme commenced in 2004 as a small pilot and, since then, there has been minimal change in its design. It was originally envisaged as a household cash transfer for vulnerable carers of orphans, paying a flat transfer irrespective of the size of the household. As Figure 18 indicates, a relatively high proportion of the caregivers of CT-OVC beneficiaries are older people or are approaching old age. Indeed, nearly 30 percent of carers are above the age of 60 years.
The evidence presented in this paper shows household wealth is the most consistent and reliable predictor of childhood vulnerability, and that orphans are not systematically worse off than non-orphaned children. Ultimately, the key policy choice is whether to continue to target the CT-OVC programme to a relatively small group of (older) children selected from a much larger group of vulnerable children, or to continue to transition towards an inclusive lifecycle social security system by implementing a conventional child benefit. Many countries have successfully implemented child benefits as a key component of a broader inclusive lifecycle social security system, with significant benefits for children.
0
10,000
20,000
30,000
40,000
15-19 20-24 25-29 30-34 35-39 40-44 45-49 50-54 55-59 60-64 65-69 70-74 75+
Ageofthecaregiver(five-yeargroups)
FIGURE 18: Number of caregivers of CT-OVC beneficiaries, by age group, 2015
Source: Calculations based on CT-OVC MIS database (2015).

36
Indeed, Kenya’s National Social Protection Policy (2011) includes a policy objective to explore the possibility of establishing broader child benefits.
From a lifecycle perspective, young children under five living in income-poor households should be prioritised: evidence from the fields of neuroscience and developmental psychology show that poverty especially during early childhood can have negative and irreversible effects that last through adulthood. Adequate support during this critical window provides children with the best possible foundations for good lifelong development, whereas deficits during this period can impose lifelong vulnerabilities. Figure 19 above shows that the rate of return expected from investments in early childhood is significantly higher than investments across any other point in the lifecycle of children. Yet, young children under the age of five are significantly under-represented in Kenya’s social security programmes. In a context like Kenya where difficult decisions need to be made about how best to invest limited funds for social security, prioritising programmes directed towards families with young children is therefore a strategic and efficient use of resources.
However, rather than creating a new child benefit, one option is for Kenya to adapt the CT-OVC programme and turn it into a conventional child benefit, providing a flat transfer to young children under five, but paid to the female carer in the family (or the male, if a female is not present). A transfer of KSh500 per month per child would be the equivalent of 4 percent of GDP per capita, which, as Figure 20 indicates, is in line with the value of effective child transfers internationally.
If Kenya were to implement a child benefit for all children aged 0-4 years (or reform the CT-OVC), it would cost 0.64 percent of GDP and, if it were affluence tested, with the most affluent 30 percent
FIGURE 19: Rate of return to human development investment across all ages
Source: Carneiro and Heckman (2003).
37Child vulnerability and social protection in Kenya
excluded, it would cost 0.45 percent of GDP in 2016. While this would imply an increase on current levels of investment, it is in line with the level spending by other middle-income countries that have committed to comprehensive child grants, and government’s multi-year expansion plan which foresees a doubling of the number of CT-OVC beneficiary households by 2016/17.
Over time, the costs of the child benefit would fall due to anticipated gains in economic growth. Figure 21 indicates the likely costs of the grants up to 2040, assuming they are indexed to inflation and that average growth of Kenya’s GDP is 2.5 per cent per year (which is the average GDP growth rate experienced over the last decade). Any increase in the rate of economic growth would further reduce the
6.5
5.04.5
4.1 4.0 4.0 4.0 3.9 3.83.3 3.2 3.1
2.72.2 2.0 2.0 1.8 1.8 1.7
0.8 0.6
0%
2%
4%
6%
8%
Germ
any
Austria
Nep
al
Mon
golia
Arge
ntina
KENYA
Net
herla
nds
Unite
dKing
dom
Sout
hAf
rica
Swed
en
Denm
ark
Belgium
Luxe
mbo
urg
Cypr
us
Slov
akia
Nor
way
Bang
lade
sh
Viet
nam
Braz
il
Esto
nia
Gree
ce
FIGURE 20: Comparison of the value of proposed child benefit in Kenya with other child benefits, as a percentage of GDP per capita
0.00%
0.10%
0.20%
0.30%
0.40%
0.50%
2016 2018 2020 2022 2024 2026 2028 2030 2032 2034 2036 2038 2040Year
FIGURE 21: Projected cost of a child benefit for 70 percent of children aged 0-4 years, as a percentage of GDP, 2016-2040
Source: Carneiro and Heckman (2003).

38
cost of the child grant. For instance, the IMF projects that Kenya would experience an average GDP growth rate of 3.3 percent per year during the period 2015 to 2020, so our estimates of the cost of the child benefit are relatively conservative.
4.3 Building an inclusive and child-sensitive social security systemChild benefits are only one component of a comprehensive lifecycle social protection system. Other key components would typically include an old age pension and a disability benefit, building on current programmes. Table 5 outlines a proposal for a broad inclusive social protection system which would cost around 1 percent of GDP. This would imply an increase on current levels on investment, but it is significantly below the level of expenditure on social transfers of middle-income countries such as Mauritius, Brazil, South Africa, Georgia and Uzbekistan, which invest between 3 and 6 per cent of GDP.
Table 6 indicates the potential impacts that the proposed system would have on levels of poverty and the poverty gap among beneficiary households, while Figure 22 shows the impacts on the poverty gap among the total population by age group. Overall, the proposed system would achieve significant reductions in the poverty rate and the poverty gap among beneficiaries and their households. For example, the share of households with young children below the national poverty line would be reduced by 9 percent and the poverty gap by 16 percent. The impacts are considerably higher when looking at the share of households
TABLE 5: A potential lifecycle social security system for Kenya
SCHEME AGE GROUP COVERAGE VALUE OF TRANSFER (KSH PER MONTH)
COST OF SCHEME (KSH)
COST OF SCHEME (% OF GDP)
Child Benefit 0-4 years 70% 500 30.5 billion 0.45%
Adult disability benefit
19-64 years 100% 1,900 6.8 billion 0.10%
Old age pension 65+ years 100% 1,900 30.8 billion 0.45%
Total 519,878 68.1 billion 1.00%
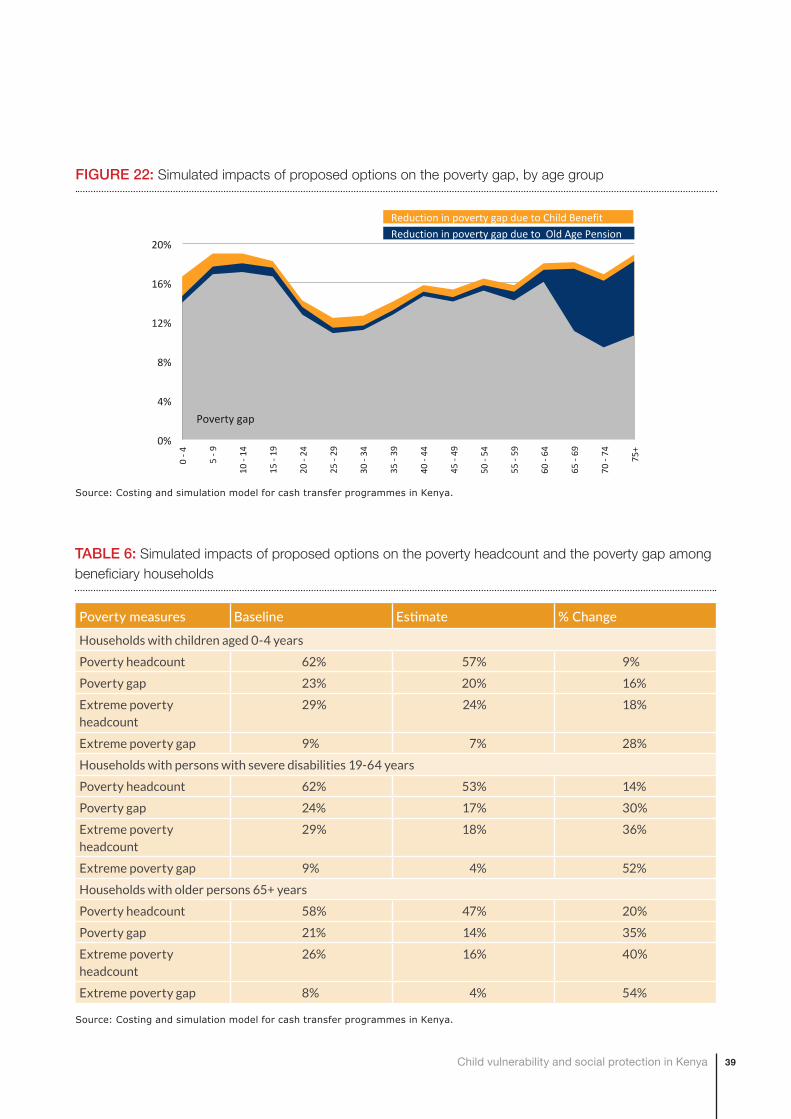
39Child vulnerability and social protection in Kenya
0%
4%
8%
12%
16%
20%
0-4
5-9
10-14
15-19
20-24
25-29
30-34
35-39
40-44
45-49
50-54
55-59
60-64
65-69
70-74
75+
ReductioninpovertygapduetoChildBenefitReductioninpovertygapduetoOldAgePension
Povertygap
FIGURE 22: Simulated impacts of proposed options on the poverty gap, by age group
Source: Costing and simulation model for cash transfer programmes in Kenya.
TABLE 6: Simulated impacts of proposed options on the poverty headcount and the poverty gap among beneficiary households
Poverty measures Baseline Estimate % Change
Households with children aged 0-4 years
Poverty headcount 62% 57% 9%
Poverty gap 23% 20% 16%
Extreme poverty headcount
29% 24% 18%
Extreme poverty gap 9% 7% 28%
Households with persons with severe disabilities 19-64 years
Poverty headcount 62% 53% 14%
Poverty gap 24% 17% 30%
Extreme poverty headcount
29% 18% 36%
Extreme poverty gap 9% 4% 52%
Households with older persons 65+ years
Poverty headcount 58% 47% 20%
Poverty gap 21% 14% 35%
Extreme poverty headcount
26% 16% 40%
Extreme poverty gap 8% 4% 54%
Source: Costing and simulation model for cash transfer programmes in Kenya.
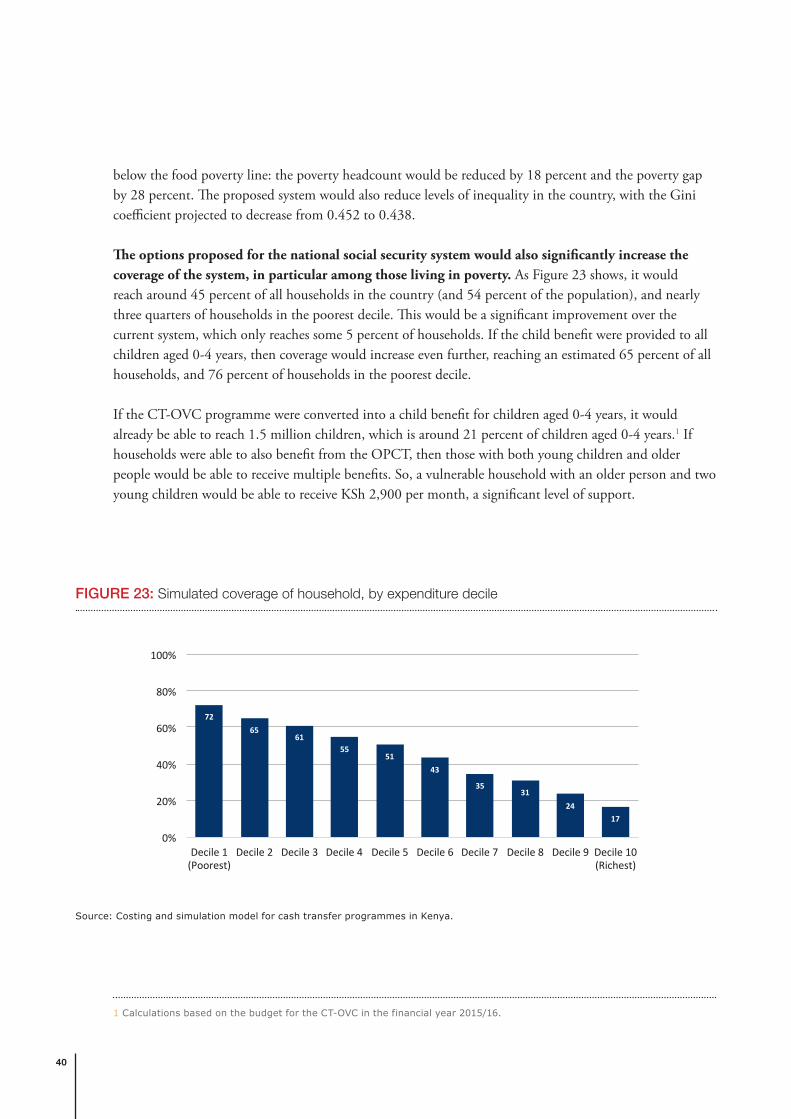
40
7265
6155
5143
3531
2417
0%
20%
40%
60%
80%
100%
Decile1(Poorest)
Decile2 Decile3 Decile4 Decile5 Decile6 Decile7 Decile8 Decile9 Decile10(Richest)
FIGURE 23: Simulated coverage of household, by expenditure decile
Source: Costing and simulation model for cash transfer programmes in Kenya.
below the food poverty line: the poverty headcount would be reduced by 18 percent and the poverty gap by 28 percent. The proposed system would also reduce levels of inequality in the country, with the Gini coefficient projected to decrease from 0.452 to 0.438.
The options proposed for the national social security system would also significantly increase the coverage of the system, in particular among those living in poverty. As Figure 23 shows, it would reach around 45 percent of all households in the country (and 54 percent of the population), and nearly three quarters of households in the poorest decile. This would be a significant improvement over the current system, which only reaches some 5 percent of households. If the child benefit were provided to all children aged 0-4 years, then coverage would increase even further, reaching an estimated 65 percent of all households, and 76 percent of households in the poorest decile.
If the CT-OVC programme were converted into a child benefit for children aged 0-4 years, it would already be able to reach 1.5 million children, which is around 21 percent of children aged 0-4 years.1 If households were able to also benefit from the OPCT, then those with both young children and older people would be able to receive multiple benefits. So, a vulnerable household with an older person and two young children would be able to receive KSh 2,900 per month, a significant level of support.
1 Calculations based on the budget for the CT-OVC in the financial year 2015/16.
41Child vulnerability and social protection in Kenya
Box 4: Other options for strengthening Kenya’s lifecycle social protection system
The Older Persons Cash Transfer (OPCT) programme aims to strengthen the capacity of older people and improve their livelihoods. It targets extremely poor households that include a member aged 65 or older who does not receive a pension. However, if government achieves its plan to provide the OPCT to 460,000 people in 2016/17, it could actually reach everyone aged 74+. Taking a universal approach would make the targeting much easier and keep administrative costs down.
The Hunger Safety Net Programme (HSNP) scheme is a form of social assistance targeting extremely poor households in northern Kenya, and as such does not currently operate as part of a lifecycle social security system. Given the Government’s focus on a lifecycle approach to social security, coupled with the particular challenges of accurately identifying the poorest households due to volatility in incomes, another policy option would be to redirect existing HSNP funds to expand the coverage of inclusive lifecycle schemes, in line with the Government of Kenya’s priorities. This could include the CT-OVC, OPCT and the PWSD-CT.
Box 4 below outlines other potential options for building a more inclusive lifecycle national social protection system.

42
5 CONCLUSIONS
43Child vulnerability and social protection in Kenya
5 ConclusionsKenya’s social protection sector defines child vulnerability in a narrow way, focusing on orphanhood and chronic illness. There is a common perception that children identified as OVCs are necessarily ‘vulnerable’. However, based on extensive statistical analysis of different nationally representative survey datasets, we conclude that orphaned children are not significantly more likely to live in poverty compared with non-orphaned children. Moreover, orphanhood is not consistently associated with worse child outcomes in other domains such as birth registration, health, nutrition, early marriage or early sexual debut. These findings are not unique to Kenya. Indeed, studies conducted in other countries in Africa and the rest of the world have also found that orphans are not necessarily more disadvantaged than their non-orphaned peers.
We assessed whether there are other markers that can be used to accurately identify vulnerable children and that can serve as a new definition of child vulnerability appropriate within the Kenyan context. Overall, household wealth is the only consistent and reliable predictor of childhood vulnerability across a range of across age-disaggregated outcomes. From a lifecycle perspective, young children under five living in income-poor households should be prioritised: evidence from the fields of neuroscience and developmental psychology show that poverty especially during early childhood can have negative and irreversible effects that last through adulthood.
Despite significant growth in recent years, the overall coverage of Kenya’s main social security cash transfers is still limited, as a result of the relatively modest budget allocations. Many other middle-income countries such as Mauritius, Brazil, South Africa, Georgia and Uzbekistan invest significantly more in social protection compared to the size of their economies. Moreover, Kenya’s cash transfer system excludes many vulnerable children by design. This is because orphans are the explicit target group of the CT-OVC and orphanhood is also a common proxy of vulnerability used in the other cash transfer programmes. However, orphanhood is not a reliable predictor of childhood vulnerability.
The major gap in the social security system is the very low coverage of young children. Children under the age of five are significantly under-represented in the CT-OVC and, to a lesser extent, in the other programmes too. This goes against one of the key principles of child-sensitive social protection: to intervene as early as possible where children are at risk to prevent irreversible impairment or harm. The coverage of children with disabilities is also estimated to be very low.
The paper put forward a number of proposals for building a more inclusive and child-sensitive lifecycle national social protection system, in line with the vision outlined in Kenya’s National Social Protection Strategy (2011) and the right to social security for all citizens enshrined in the national Constitution. Ultimately, the key policy choice is whether to continue to target the CT-OVC programme to a relatively small group of (older) children selected from a much larger group of vulnerable children, or to continue to transition towards an inclusive lifecycle social security system by implementing a conventional child benefit.

44
In a context like Kenya where difficult decisions need to be made about how best to invest limited funds for social security, we argued that prioritising families with young children is a strategic and efficient use of resources. The main policy option presented is to adapt the CT-OVC programme and turn it into a more conventional child benefit, providing a flat transfer to young children under five, paid to the female carer in the family (or the male, if a female is not present). Rather than narrowly targeting such a programme to ultra-poor households, it is recommended to make either all children under five eligible, or at least 70 percent of young children. This is because evidence from panel surveys conducted in Kenya and elsewhere has demonstrated that there is no fixed group of children living in poverty that can easily be identified and targeted: household incomes and consumption are highly variable and there is significant churning around the poverty line and movement across the wealth spectrum, even over relatively short periods of time. This makes attempts to target relatively ineffective and expensive.
Using microsimulations, the paper shows that such a reform – as part of a broader lifecycle approach to social protection – would be affordable, have a significant impact on reducing child poverty and vulnerability, and would drastically increase the coverage among children and households in need of social protection.
45Child vulnerability and social protection in Kenya
Selected referencesAkwara, P. A., Noubary, B., Lim Ah Ken P., Johnson K., Yates R., Winfrey W., Chandan UK., Mulenga D., Kolker J., & Luo C. (2010). Who is the Vulnerable Child: Using survey data to identify children at risk in the era of HIV and AIDS. AIDS Care, vol. 22, no. 9, pp. 1066– 1085.
Beegle, K., Christiaensen, L., Dabalen, A., & Gaddis, I. (2016). Poverty in a Rising Africa. Washington, DC: World Bank.
Carneiro, P. M., & Heckman, J. (2003). Human Capital Policy. IZA Discussion Paper No. 821.
Kidd, S. (2013). Rethinking “Targeting” in International Development. Oxfordshire: Development Pathways. Retrieved from http://www.developmentpathways.co.uk.
KNBS. (2015). Kenya Demographic and Health Survey 2014. Nairobi: Kenya National Bureau of Statistics.
Lee VC, Muriithi P, Gilbert-Nandra U, Kim AA, Schmitz ME, Odek J, Mokaya R, Galbraith JS; KAIS Study Group (2014). Orphans and vulnerable children in Kenya: results from a nationally representative population-based survey. Journal of Acquired Immune Deficiency Syndromes, 1; 66 Suppl 1:S89-97.
Ministry of Gender, Children and Social Development. (2011). Kenya National Social Protection Policy. Nairobi: Government of Kenya.
Ministry of Labour and East African Affairs. (2016) Inua Jamii: Towards a More Effective National Safety Net for Kenya. Nairobi: MLEAA.
Mishra, V., & Bignami-Van Assche, S. (2008). Orphans and Vulnerable Children in High HIV-Prevalence Countries in Sub-Saharan Africa. DHS Analytical Studies No. 15. Calverton, Maryland, USA: Macro International.
OPM (2010). Cash Transfer Programme for Orphans and Vulnerable Children (CT-OVC), Kenya, Operational and Impact Evaluation, 2007–2009, Final Report.
Republic of Kenya. (2012). Kenya Social Protection Sector Review. Ministry of State for Planning, National Development and Vision 2030.
UNDESA. (2015). World Population Prospects: The 2015 Revision. New York: United Nations, Department of Economic and Social Affairs, Population Division.
UNHCR (2015). Registered Refugees and Asylum-Seekers (October 2015). Nairobi: UNHCR.

46
UNICEF, DFID, HelpAge International, Hope & Homes for Children, Institute of Development Studies, International Labour Organisation, Overseas Development Institute, Save the Children UK, UNDP and the World Bank (2009). Joint Statement on Advancing Child-Sensitive Social Protection. New York: UNICEF.
UNICEF. (2014a). Measuring the Determinants of Childhood Vulnerability. New York: UNICEF.
UNICEF. (2014b). Situation Analysis of Children and Adolescents in Kenya. Nairobi: United Nations Children’s Fund (UNICEF) and the Government of Kenya.
World Bank. (2009). Kenya Poverty and Inequality Assessment: Executive summary and synthesis report (No. 44190-KE). Washington, DC: The World Bank.

47Child vulnerability and social protection in Kenya