child malnutrition and antenatal care: evidence from three latin
TRANSCRIPT

Working Paper No. 536
Nohora F. Ramirez, Luis F. Gamboa, Arjun S. Bedi and Robert Sparrow
March 2012
Child Malnutrition and Antenatal Care: Evidence from three Latin American countries

2
ISSN 0921-0210
The Institute of Social Studies is Europe’s longest-established centre of higher education and research in development studies. On 1 July 2009, it became a University Institute of the Erasmus University Rotterdam (EUR). Post-graduate teaching programmes range from six-week diploma courses to the PhD programme. Research at ISS is fundamental in the sense of laying a scientific basis for the formulation of appropriate development policies. The academic work of ISS is disseminated in the form of books, journal articles, teaching texts, monographs and working papers. The
Working Paper series provides a forum for work in progress which seeks to elicit comments and generate discussion. The series includes academic research by staff, PhD participants and visiting fellows, and award-winning research
papers by graduate students.
Working Papers are available in electronic format at www.iss.nl
Please address comments and/or queries for information to:
Institute of Social Studies P.O. Box 29776
2502 LT The Hague The Netherlands
or
E-mail: [email protected]

3
Table of Contents
ABSTRACT 4
1 INTRODUCTION 5
II EMPIRICAL FRAMEWORK 8
II.1 Determinants of child malnutrition 8
II.2 Examining socioeconomic inequalities in stunting 9
III THE DATA AND DESCRIPTIVE STATISTICS 10
IV ESTIMATES 11
IV.1 Prevalence of child malnutrition 11
IV.2 Determinants of child malnutrition 12
IV.3 Inequality in child malnutrition 13
IV.4 Oaxaca decomposition 14
V. CONCLUDING REMARKS 15
REFERENCES 15
TABLES AND FIGURES 19
APPENDICES 26
4
Abstract
The importance of ever-earlier interventions to help children reach their physical and cognitive potential is increasingly being recognized. In part, as a result of this, in developing countries, antenatal care is becoming an important element of strategies to prevent child stunting in utero and later. Notwithstanding their policy relevance and substantial expansion, empirical evidence on the role of antenatal care (ANC) programs in combating stunting is scarce. This study analyzes the role of ANC programs in determining the level and distribution of child stunting in three Andean countries - Bolivia, Colombia, and Peru - where since the 1990s, expanding access to such care has been an explicit policy intervention to tackle child malnutrition. We find that the use of such services is associated with a reduction in the level of malnutrition and at the same time access to such services is relatively equally distributed. While this is a positive sign, it also suggests that further expansion of ANC programs is unlikely to play a large role in reducing inequalities in malnutrition.
Keywords
Child malnutrition, antenatal care, inequality decomposition, height for age.

5
Child Malnutrition and Antenatal Care1 Evidence from three Latin American countries
1 Introduction
Child malnutrition, especially amongst the poorest segments of the population, is an important policy concern in Latin America where 16 percent of children under age five are stunted (ECLAC, 2006). Despite progress, stunting in early childhood continues to display sharp disparities across urban and rural regions, and across various socio-economic characteristics (ECLAC, 2006; Ruel, 2001; Larrea and Freire, 2002). Furthermore, with regard to the Millennium Development Goals, reductions in child nutrition and improvements in related outcomes such as maternal health and access to antenatal care are yet to be reached in several Latin American countries (UN, 2008).
In the last few decades, research on the determinants of child malnutrition in developing countries has attracted substantial attention. Various papers have identified the importance of maternal physical and mental health, education and wealth, illness control, poor child care, and unstimulating home environments as determinants of child stunting, a marker of child malnutrition. While the role of such factors may be considered common-place, less common and a key implication from the literature is the importance of early interventions to help children reach their physical and cognitive potential (see, for example, Li et al., 2004; Grantham-McGregor et al., 2007; Victora et al., 2008; Hoddinott et al., 2008). On the basis of their review of the literature on developing countries covering the period 1985 to 2006, Grantham-McGregor et al., (2007, p. 62) argue that patterns of growth retardation are similar across countries and that stunting “begins in utero or soon after birth, is pronounced in the first 12-18 months and could continue to around 40 months”. Related work points out that “poor fetal growth or stunting in the first two years of life leads to irreversible damage” (Victora et al., 2008, p. 340), including reductions in adult height (Martorell, 2005), poor cognitive skills, lower levels of educational attainment (Alderman et al., 2006), and reduced income (Chen and Zhou, 2007).
While a distinction needs to be drawn between small and healthy versus growth restricted infants who are more susceptible to post-natal episodes of morbidity and mortality, according to Kramer (1998) intra uterine growth retardation (IUGR) accounts for a majority of low birth weight infants in developing countries. Among other factors, maternal malnutrition, low gestational weight gain, weight loss due to illness, and infection during pregnancy, hypertension, smoking, drug use, and alcohol consumption increase the risk of stunting in utero and small for gestational age (SGA) children (see Falkner et al., 1993; Kramer, 1998; McDermott et al., 1999; Breeze and Lees, 2007). Prenatal care programmes, which typically identify high-risk mothers and include nutritional and educational interventions such as information and advice on food hygiene, diet and lifestyle advice, including cessation of
1 We acknowledge the help of MACRO International for access to the Demographic and Health Surveys (DHS). Authors are: Nohora F. Ramirez, Faculty of Economics, University of Rosario, Colombia, em: [email protected]; Luis F. Gamboa, Faculty of Economics, University of Rosario, Colombia, em: [email protected]; Arjun S. Bedi, International Institute of Social Studies (ISS), Erasmus University Rotterdam, The Netherlands, em: [email protected]; and Robert Sparrow, Crawford School of Economics and Government, Australian National University, Australia, em: [email protected].
6
smoking and the effects of drug use and alcohol consumption, have been designed to deal with factors that are most likely to be associated with growth stunting. Such programmes have been widely advocated as a way of alleviating the incidence of low birth weight and avoiding adverse pregnancy outcomes (Alexander and Korenbrot, 1995; Singh et al., 2003; Wagstaff and Claeson, 2004).
Notwithstanding their policy relevance and substantial expansion, empirical evidence on the role of ante-natal care programs in combating stunting, especially in developing countries is scarce. This study aims to analyze the role of prenatal care in determining the level and distribution of child stunting in three Andean countries - Bolivia, Colombia, and Peru - where since the 1990s, such care has received attention as an explicit policy intervention to tackle child malnutrition, yet little is known about the effects of these policies.
For instance, in Bolivia, there have been several programs geared towards providing free health care services to mothers and children. Most recently, since 2003, the Universal Insurance for Mothers and Children (SUMI) program began providing a broader range of services and its target group includes pregnant women, and children under five. According to Moloney (2009) the Bolivian government has actively tried to discourage home births and tried to encourage pregnant women especially in rural areas to visit health clinics for prenatal checks. In Peru, the 2004 National Sexual and Reproductive Health Sanitary Strategy (ESNSSR) recognizes that sexual and reproductive health implies paying attention to intrauterine life and that one of the pathways to achieve this goal is improved access and use of prenatal care. Since 2000, in Colombia, in an effort to standardize clinical procedures relating to antenatal care, the Ministry of Health has established guidelines for antenatal care and exempted antenatal care from copayments. Although not all prenatal care services are free, the Ministry of Social Protection (2010) claims that the country has worked towards prioritizing health services for pregnant women and children under-five and enhancing access to prenatal care for women from poorer socioeconomic backgrounds. In all three countries the various policy initiatives have expanded access to prenatal care, most notably in Bolivia where it increased from 40 percent in 1990 to more than 75 percent in 2008. The corresponding figures in Peru were 60 percent in 1990 and 90 percent in 2008 and in Colombia, 81 percent in 1990 to 93.5 percent in 2005.2
While a large literature has analyzed the determinants of stunting in these and other countries, typically, the role of prenatal care has not been explicitly considered. For instance, Desai and Alva (1998) use Demographic and Health Surveys (DHS) from 22 developing countries including Bolivia and Colombia, and find that maternal secondary education has a substantial effect on height-for-age especially in Latin American countries potentially due to its effect on health-promoting behavior. In their cross-country analysis of child malnutrition covering the period 1970 to 1996, Smith and Haddad (2000) identify women’s secondary school enrollment, their relative status as measured by differences in life-expectancy and the health environment as measured by access to safe water as the most important determinants of child malnutrition in Latin American countries.
Turning to country specific analyses, based on the 1998 DHS for Bolivia, Morales et al. (2004) show that child height is negatively influenced by altitude and speaking Quechua. Their work is based on parsimonious specifications and does not control for access to health infrastructure which may be correlated with altitude and region. Valdivia (2004) uses three
2 All figures are from the latest edition of the World Development Indicators produced by the World Bank, http://data.worldbank.org/data-catalog/world-development-indicators.

7
rounds of the Peruvian DHS covering the period 1992 to 2000 to analyze the effect of the rapid expansion of the country’s health infrastructure on child height-for-age. The analysis shows that the massive increase in the country’s public health infrastructure between 1992 and 1999 is associated with a small increase in height-for-age only in urban areas.3 Attanasio et al. (2004) use data on poor Colombian households from a 2002 survey to investigate the effect of a range of public infrastructure variables on height-for-age. These include the presence of a public hospital, access to piped water, distance to a health care provider and the number of hours that growth and development check-ups are provided in the municipality. The presence of a public hospital has a positive and statistically significant effect on height-for-age and is associated with a 0.16 standard deviation increase while the number of hours of development check-ups is marginally significant (8 percent level). Attanasio et al’s. (2004) paper is notable due to its focus on access to child health services as there is relatively little work on the effect of such measures on anthropometric outcomes. Larrea et al. (2005) focus on the ethnic and regional determinants of child malnutrition in Ecuador, Peru and Bolivia. Their work relies on a 1998 DHS collected in Bolivia and three DHS collected between 1992 and 2000 in Peru. Similar to the findings of Morales et al. (2004) they find that ethnicity and region/altitude have substantial negative effects on height-for-age in both Peru and Bolivia. They also consider the effect of an access to health services index, which includes access to prenatal care, on stunting. While their estimates suggest a positive link between health services access, at least for some of their specifications, since their index includes six items it is hard to discern the effect of access to prenatal care.
The contribution of the paper is twofold. First, it provides updated evidence on the prevalence and inequalities in child malnutrition in three Andean countries. Second, and most importantly, the paper adds to the existing literature on child malnutrition, by explicitly investigating the role of prenatal care on the level and distribution of child malnutrition. At the outset it should be clear that while our assessment of the link between prenatal care and child malnutrition controls for a number of confounding factors which may influence both the use of prenatal care and malnutrition, we do not purport to provide a causal analysis. Notwithstanding this caveat, given the rapid expansion of such services and the call for ever-earlier interventions (Grantham-McGregor et al., 2007) it is relevant to enquire whether such care has a discernible effect on child malnutrition.
The paper is organized as follows. The following section lays out an empirical framework, while section III describes the data. Section IV presents the estimates, and section V concludes the paper.
3 Between 1992 and 1999 the number of public health facilities increased by 52 percent and the number of doctors by 35 percent. In terms of the effects of this increase, a 1 standard deviation increase in health infrastructure is associated with a 0.03 standard deviation increase in height-for age in urban areas while the effect in rural areas is zero.

8
II Empirical framework
Our empirical work is divided into three stages. First, we analyze the determinants of child malnutrition. Second, we use concentration curves and indices to describe inequalities in child malnutrition. Finally, to identify the source of inequalities we carry out decomposition analyses.
II.1 Determinants of child malnutrition
Child height-for-age is used as a long-run indicator of a child’s nutritional status (Martorell and Ho, 1984; Martorell, 1999). Height-for- age z-scores (HAZ), which measure a child’s deviation in height (in terms of standard deviation units) relative to a reference population, is
computed as SD
MedianHeightHAZ i −
= , where iHeight refers to the length (under two) or
height (older than two) of a child, and Median and SD refer to the median and standard deviation of the height values of the National Centre for Health Statistics (NCHS) reference population (Hamill et al., 1977). Values of the HAZ below two (three) standard deviations indicate chronic (severe) malnutrition.
Following a well-established literature (Mosley and Chen, 1984; Thomas and Strauss, 1992) - which invokes a child health production function, and the idea that households make decisions by attempting to maximize their welfare subject to budget and time constraints within the confines of an externally determined public health infrastructure - a child’s height may be treated as a function of several initial and current individual, household, and community-level characteristics.
In the present case, individual child height (hi), as measured by height-for-age z-scores is written as,
iik
CC
kik
HC
kik
Ch
kik
AC
k0i ηxβxβxβxββh ∑∑∑ ∑ +++++= (1)
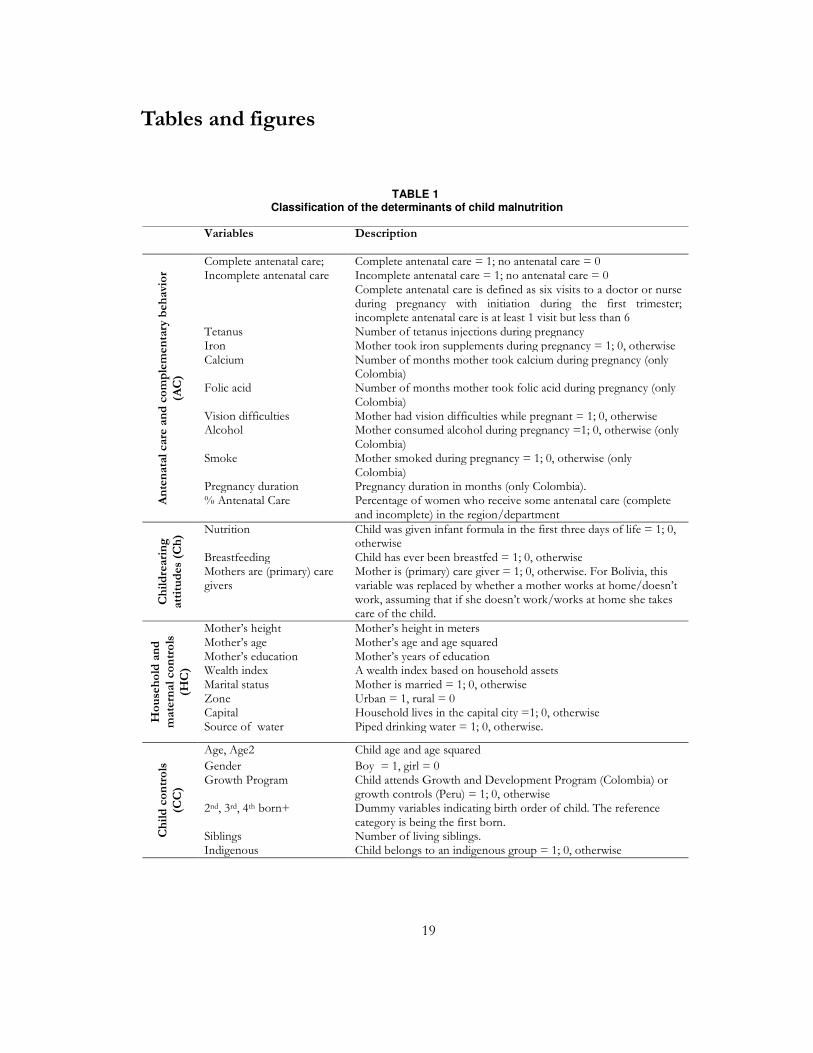
that is, a function of four categories of determinants: (i) access to and use of antenatal care and complementary behavior (AC) (ii) childrearing practices (Ch) (iii) household and maternal characteristics (HC) (iv) child characteristics (CC). Table 1 provides a description of the variables (xik) in each set of determinants. The βk are coefficients to be estimated, and ηi reflects unobserved heterogeneity in child stature. To ease interpretation, the outcome variable, hi,, is the negative of the HAZ, so that the estimated coefficients may be interpreted in terms of their effect on malnourishment. Since HAZ is a continuous variable, as opposed to a discrete indicator of chronic or severe malnutrition, (1) is estimated using OLS.
Our main aim is to identify the effect of antenatal care on height-for-age. The main empirical concern is that while availability of antenatal care may be treated as exogenous to the household, actual use of such services is subject to maternal/household choice. For instance, if women with lower (higher) unobserved health status are more likely to use antenatal care, then estimates based on (1) will underestimate (overestimate) the effect of antenatal care. To deal with such concerns (1) includes a wide range of control variables such as mothers’ height, age, education, and a household wealth index which are likely to influence both the use of

9
prenatal care and be correlated with a women’s unobserved health status. While the inclusion of a wide range of controls (as listed in Table 1), may be expected to mitigate potential bias in estimates of the effect of antenatal care on HAZ, we cannot rule out the possibility that unobserved health status may be correlated with the use of antenatal care.
II.2 Examining socioeconomic inequalities in stunting4
To assess socioeconomic-related inequality in child stunting we plot concentration curves which display the share of stunting accounted for by the cumulative share of children ranked on the basis of a wealth index.5 To provide a sense of the magnitude of inequality we compute the concentration index, which is directly linked to the concentration curve,
),cov(2
= rhµ
CI (2)
where, ir is the fractional rank (ri = i/N) for child i in the sample of N children in living
standards (here the wealth index); ih is the negative value of HAZ, and µ its mean. The
concentration index ranges between -1 and 1 and measures twice the area between the line of equal distribution and the concentration curve. A negative value indicates that child malnutrition is concentrated among the less wealthy, in which case the curve lies above the 45 degree line.
Additional insights on the source of this inequality may be obtained by decomposing the index and assessing the effect of individual variables on wealth-related inequality in stunting. Wagstaff, van Doorslaer, and Watanabe (2003) show that, in cases such as in the current application, the overall concentration of wealth-related inequality in stunting can be decomposed into the contributions of individual factors which enter (1) where the contribution of each factor is the product of the elasticity ( µ/xβ kk
) of hi with respect to the
factor and the wealth-related concentration of that factor (kC ). µ is the mean of the HAZ.
Hence, the concentration index (CI) may be written as,
µ
CC
µ
xβCI ε
k
k
kk +=∑ (3)
where kx is the mean of each of the variables included in (1) and the second component on
the right hand side of (3) is a residual term.
4 See O’Donnell et al. (2008) for an extensive account and application of these methods. 5 Alternative measures of living standards such as consumption or income may also be used. The DHS does not collect information on these metrics and hence we rely on the wealth index to develop the concentration curve and the concentration indices. For 19 countries, Wagstaff and Watanabe (2003) show that the concentration index for malnutrition is not particularly sensitive to the use of consumption or wealth as a living standards measure.

10
We also explicitly consider the effect of antenatal care on child stunting by first examining whether there is a gap in mean HAZ between children whose mothers received incomplete antenatal care (hIAC), and children whose mothers received complete antenatal care (hCAC).6 The mean gap in the HAZ is then decomposed into its constituents using an Oaxaca decomposition, that is,
ECCEβ∆x∆xβ∆βx∆hh CACIACIACCAC ++=++=- (4)
Where x∆ is the difference in the means of variable across the two groups and β∆ is the
difference in the estimated coefficients across the two groups. This decomposition allows us to establish the extent to which differences in the mean child nutritional status across the two groups of children is due to differences in the mean endowments of the two groups (E), differences in the coefficients (C ) or due to interactions between the endowments and the coefficients (EC).
III The data and descriptive statistics
The analysis draws on data contained in DHS conducted in Bolivia (2008), Colombia (2005) and Peru (2008). The DHS are representative at the national and the urban and rural levels, and consist of a household and a women’s survey instrument. The household level information consists of demographic and educational data on all household members, the characteristics of the dwelling and a wealth index.7 The women’s questionnaire is restricted to the age group 15 to 49 and contains information on a range of issues including maternity care, breastfeeding and nutrition and children’s health. Of particular interest to this paper, for children under the age of five, the survey records height and weight and there is a module with information on the type, timing and frequency of antenatal consultations of last born children. The sample used in the paper is restricted to children under five and consists of 4,945 observations from Bolivia, 7,540 from Colombia and 4,208 from Peru.
Table 2 contains descriptive statistics for the sample used in the paper. Although there are in-country regional differences, across all three countries most women have had at least one antenatal care visit. Colombia clearly has the most comprehensive antenatal care regime with 62 percent of women receiving complete antenatal care followed by Bolivia (43 percent) and Peru (28 percent). With regard to child rearing practices, across all three countries almost all children have been breast fed. There are differences in terms of the care regime with only 17 percent of mothers serving as primary care givers in Colombia followed by 36 percent in Peru
6 The decomposition is restricted to the two groups - complete and incomplete antenatal care - as the proportion of mothers with no antenatal care is limited. For Bolivia 9.1 percent off mothers have not received any antenatal care while the corresponding figures for Colombia and Peru are 6 and 2.4 percent, respectively. 7 The wealth index developed by Macro International is based on the possession of assets such as cars, bicycles, radios, televisions, and household infrastructure which includes source of drinking water, access to toilet, type of floor, and overcrowding.

11
and 42 percent in Bolivia.8 With regard to maternal characteristics there is a fair degree of similarity across the three countries in terms of average age (28.5 to 29.8), height (1.5-1.6 meters) and education of mothers (7.7-8.7 years), although in general, Peru and Bolivia are more similar to each other as compared to Colombia. Colombia is relatively more urbanized, 72 percent versus 58 and 63 percent in Bolivia and Peru, respectively, and related to this households appear to have better access to water/sanitation infrastructure.
IV Estimates
IV.1 Prevalence of child malnutrition
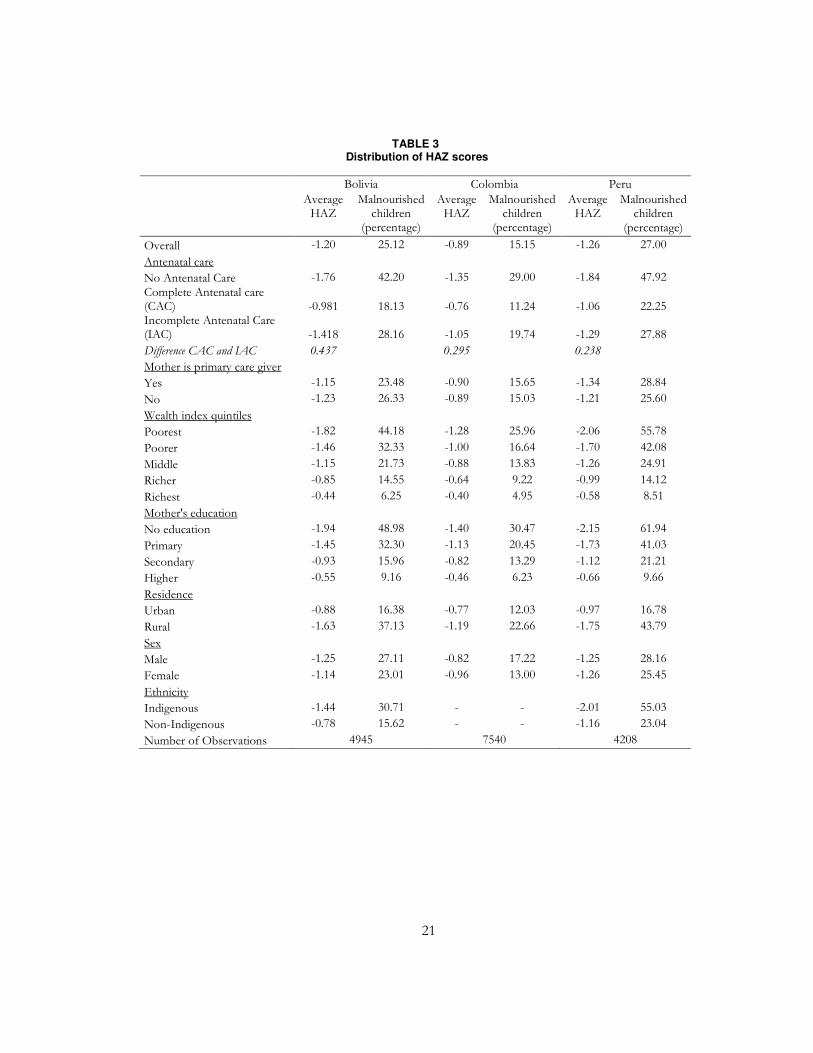
The prevalence of stunting is particularly pronounced in Peru and Bolivia where about a quarter of children are more than 2 standard deviations from the median. The corresponding figure in Colombia is substantially lower (15 percent). The mean HAZ is -0.89 in Colombia followed by Bolivia (-1.20) and Peru (-1.26). Comparisons of these figures which are based on the most recent DHS with estimates based on previous DHS show very little change over time. For instance, based on the 1998 DHS, Morales et al. (2004) report that about 25 percent of children in Bolivia were stunted which is the same as we find based on the 2008 DHS. For Peru, the mean HAZ was -1.29 in 1996 and -1.3 in 2000 (see Valdivia, 2004). The latest figure (-1.26) does indicate a slight decline but it is clearly not remarkable. In the case of Colombia according to DHS (2000), 13.5 percent of children were classified as malnourished (Flórez, Ribero and Samper, 2003).
In all three countries there is a clear hierarchy with a lower prevalence of malnutrition and a higher mean HAZ score amongst children whose mothers received complete antenatal care, followed by mothers who received incomplete and no care. In Bolivia and Peru about half the children without access to any antenatal care are malnourished while it is about a third in Colombia (Table 3). The gap between the two extremes (complete versus no access) in terms of the incidence of malnourishment is about 25 percent in Bolivia and Peru and 18 percent in Colombia. In terms of the HAZ, there is a large 0.437 unit gap in Bolivia, followed by 0.295 in Colombia and 0.238 in Peru between those who have received complete and incomplete antenatal care.
As may be expected, there are sharp differences in HAZ across wealth quintiles in all three countries (Table 3). The differences are much sharper in Peru, a gap of -1.48 units between the richest and the poorest quintiles followed by Bolivia (gap of -1.38) and Colombia which has a substantially smaller gap (-0.88). In Peru, about 56 percent of children in the poorest quintile are malnourished while in Colombia the figure is about half of that with Bolivia lying in between these two extremes. Similar patterns are observed with regard to maternal education. About 50 to 60 percent of children who have mothers with no education are malnourished in Boliva and Peru while in Colombia the corresponding figure is 30 percent.
There is clear evidence of urban-rural disparities in all three countries with rural areas recording at least twice the level of malnourishment as compared to urban areas (Table 3). While gender differences are limited, there are sharp differences in HAZ across indigenous
8 The variable takes value of 1 if the mother is the primary care giver and zero otherwise. The options include, partner; older female child; older male child; other relatives; neighbors; friends; housekeeper; child is in school; other.
12
and non-indigenous children. In Peru, 23 percent of non-indigenous children are malnourished while amongst the indigenous the figure is 55 percent. While the level is lower in Bolivia, indigenous children are still twice as likely to be malnourished as compared to their non-indigenous counterparts (31 versus 16 percent).
IV.2 Determinants of child malnutrition
As discussed in section II, child malnutrition is treated as function of four sets of variables. Table 4 provides OLS estimates of the determinants of height-for-age z-scores.
The strongest association, statistically significant at the 1 percent level, between access to antenatal care and malnutrition is in Colombia where access to (complete or incomplete) such care is associated with a large 0.23 to 0.25 point reduction in malnutrition. In Peru, the results are similar, yet less precise - although there is a negative link (0.21 to 0.26) between malnutrition and antenatal care, it is not statistically significant for complete antenatal care. In contrast to these two counties, in Bolivia, there seems to be no link between the use of such services and a reduction in malnutrition. The large effect in Colombia is notable as it is the effect of ANC visits after controlling for other aspects such as the use of iron, calcium, folic acid supplements and the incidence of tetanus injections. As a proxy for access to supply of medical care in the region the specification includes a variable indicating the percentage of women who have had at least one antenatal care visit. Access to health services is associated with a reduction in malnutrition but the effect is quite small ranging from a z-score reduction of 0.005 points to 0.024 points.9
As may be expected, a mother’s height has a strong influence on child stunting and a one centimeter increase in maternal height is associated with a z-score reduction of 0.05 to 0.06 units. The effects of maternal age are also similar across countries and indicate that older mothers are less likely to have stunted children till about the age of fifty. Beyond that, age is positively associated with malnutrition. Across all three countries wealth and maternal education are strongly associated with reductions in malnutrition. In terms of location effects, after controlling for wealth, living in a rural area does not seem to hamper malnutrition expect in the case of Peru. In Colombia living in the capital city seems to jeopardize child nutritional status. This may be associated with the high levels of displaced population living in the capital due to violence in rural areas.
Gender differences are limited, except in Colombia where boys are more likely to be malnourished. Across the three countries, there are clear birth-order effects with later-born children more likely to be malnourished. The effects are large and show that being a fourth born child is associated with 0.23 to 0.40 point increase in malnutrition. In addition to the birth-order effect the presence of a larger number of siblings also works towards increasing stunting. The “siblings” variable indicates the diminishing per-capita availability of resources (financial, parental time) in general in a large family while the birth-order variables show that the effect of reduced resources, including reduced maternal health, falls increasingly on later born children. Even after controlling for a range of characteristics, indigenous children are more likely to be malnourished. The effect is statistically significant for both Bolivia and Peru although the effect is about three times larger in Peru.
9 This variable may also capture other influences such as externalities associated with access to ante natal care as well as more generally the availability of medical services.

13
Overall, consistent with previous work (discussed in the introduction) maternal height, wealth, educational status, ethnicity and birth order are strongly associated with child stunting. The relatively novel element, use of antenatal care is strongly associated with a reduction in child stunting in Colombia, less so in Peru and not at all in Bolivia. This variation may be due to cross-country differences in the quality of prenatal care. Given the range of additional vitamin supplements, other complementary measures and the longer history of ANC provision in Colombia it is likely that such services are of a higher quality in the country as compared to Bolivia and Peru. The expansion of access to ANC services is also of more recent vintage in Bolivia and likely to be relatively poorer in quality. The size of the antenatal care coefficient is large and suggests that ensuring complete antenatal care could compensate for wealth differences.
IV.3 Inequality in child malnutrition
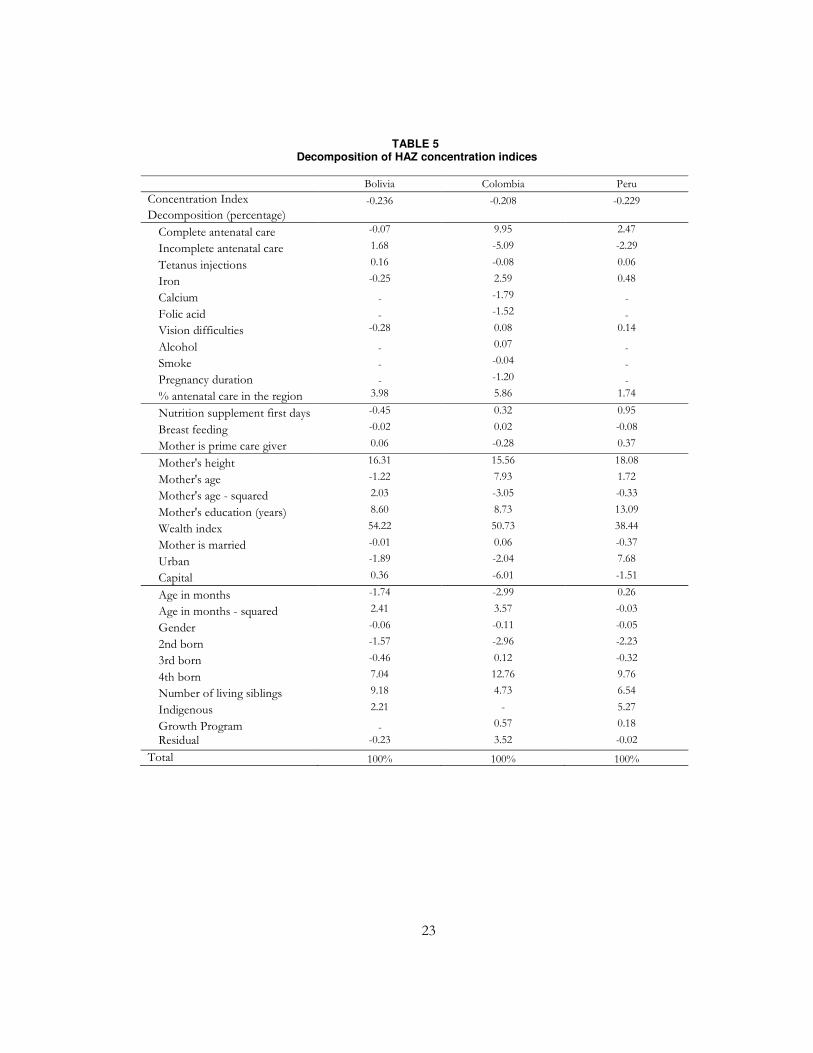
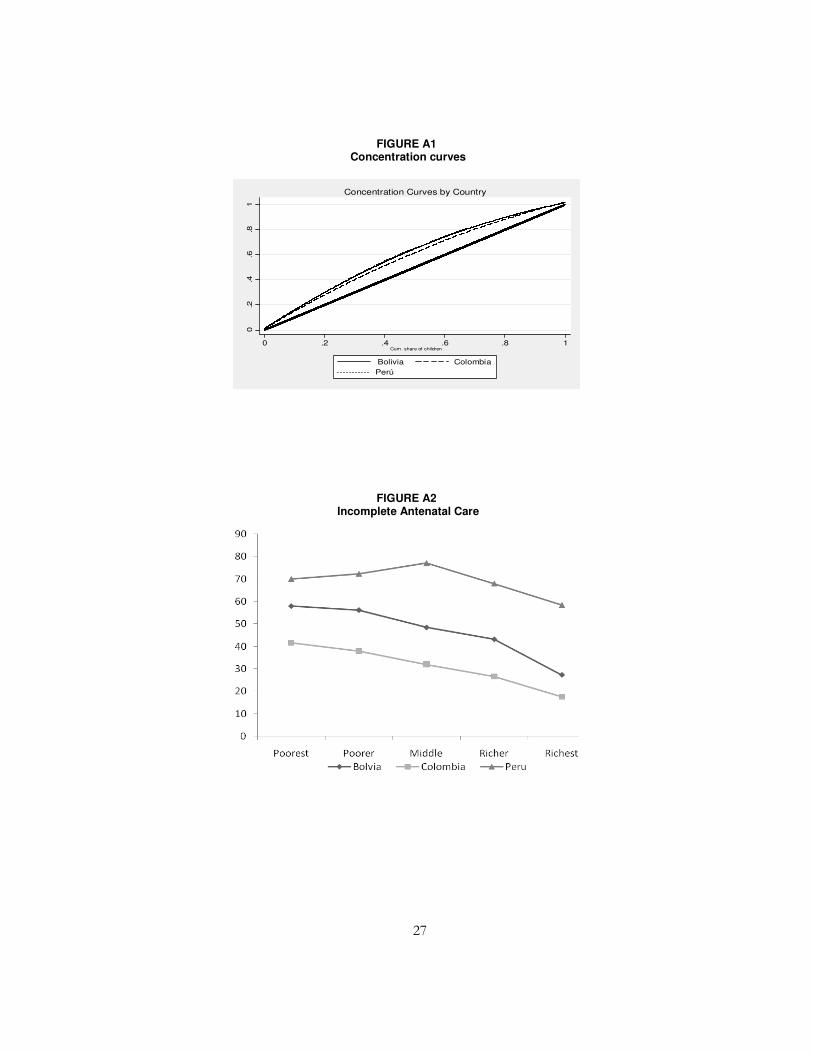
In order to assess wealth-related inequalities in child malnutrition, concentration curves and their corresponding concentration indices are estimated. As discussed in section II, the outcome variable is the negative of the HAZ and the proxy for living standards is the wealth index. Given the main concern of this paper, the concentration curves are estimated separately for three groups of children – no ANC, incomplete ANC and complete ANC (see Figure 1) and concentration indices are presented in the top row of Table 5.
Based on an examination of the concentration index and the concentration curve two points may be made. First, based on the concentration index, the distribution of malnourishment across countries is quite similar and across the three countries and ranges between -0.21 and -0.24. In general, the bottom 20 percent of children account for roughly 35 percent of observed malnourishment while the top 20 percent account for about 10 percent. Second, in all three countries, wealth-related inequality in malnourishment is more pronounced amongst those who have access to complete ANC as compared to those who have incomplete or no ANC. This suggests that access to complete ANC is more equally distributed than wealth. For example, in Colombia the 90-10 percentile ratio in the wealth distribution is 4.7 while 80 percent of the richest quintile accesses complete prenatal care as compared to 40 percent amongst the poorest quintile. Similarly, in the case of Peru, the 90-10 percentile ratio is 2.57 as compared to the prenatal care access ratio across wealth quintiles of about 1.8.
To explore the contribution of various factors to the wealth-related inequality in malnourishment we carry out the decomposition described in section II. The decomposition allows us to distinguish between the direct effect of wealth on inequality in malnourishment and the indirect effect of wealth on malnutrition due to the correlation between wealth and other factors that determine malnutrition. As may be expected, in all three countries the direct effect of wealth dominates and accounts for between 38 to 54 percent of the inequality in malnourishment (see Table 5). This is followed by the effect of the various child controls which together account for between 16 to 19 percent of wealth-related inequality in malnourishment. Amongst these characteristics, the largest effects emanate from the fourth born and siblings variables and indicates that wealth has a large effect on determining family size which in turn, due to diminished resources accounts for a substantial proportion of inequality in malnourishment. The third important factor is maternal height (16-18 percent). The large effect of this variable is driven by its importance in determining child stunting

14
(elasticity) and not due to wealth-related concentration in height.10 Wealth-related differentials in child-rearing practices are limited and these variables are not responsible for the inequality in malnourishment.
Finally, with regard to prenatal care access and the general availability of antenatal services in a region, in the case of Bolivia, jointly these variables account for about 6 percent of wealth-related inequality. While the wealth-related concentration of “complete ANC” is relatively high (0.202) the concentration of medical services (0.007) is quite small. The relative importance of the latter variable stems from its importance (elasticity) in determining malnutrition. In the Colombian case these variables account for about 10 percent of wealth-related inequality in malnutrition. The concentration index of complete ANC is 0.116 which is considerably smaller than the concentration indices of the family size variables (absolute values of 0.355 and 0.193 for the fourth born and the siblings variables). The concentration index of the medical service availability variable is 0.017. The role of these variables in determining inequality in Peru is very limited (about 2 percent).
The upshot of this analysis is that access to prenatal care services and more generally to medical services are not as heavily influenced by the distribution of wealth as compared to other variables. These variables do account for some of the wealth-related inequality in malnutrition but play a relatively limited role as access to such services is more equally distributed than wealth. While this is a positive sign it also suggests that the increasing spread of such services (with no changes in quality) will have a limited role in reducing wealth-related inequality in malnutrition.
IV.4 Oaxaca decomposition
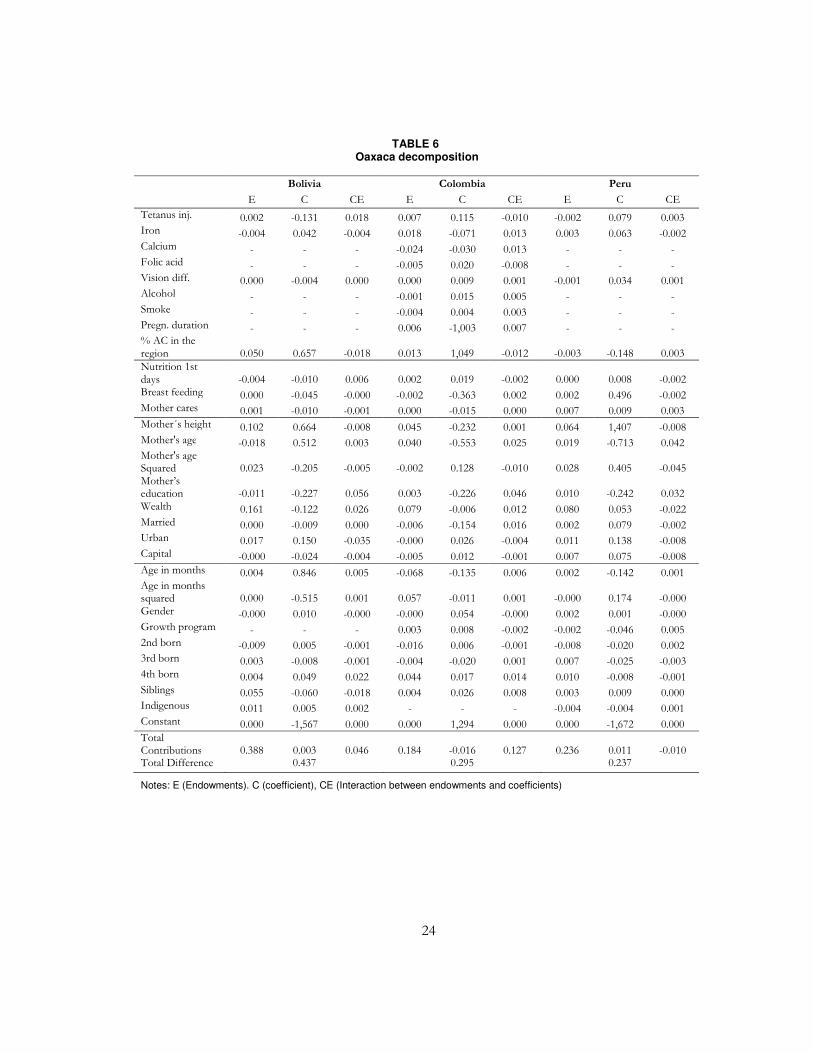
Based on the preceding discussion, antenatal care is associated with a reduction in child stunting (in Colombia and Peru) yet accounts for a relatively small proportion of wealth-related inequality in malnourishment. This section rounds out our empirical work by using a Oaxaca decomposition to examine the sources of the observed gap between those who have received complete ANC versus incomplete ANC.11 The main idea is to examine whether the factors that explain the gap in HAZ between these two groups are different from those that explain the wealth-related variation in HAZ.
Estimates of the decomposition provided in Table 6 show that across all three countries the overwhelming proportion of the difference in HAZ scores is explained by differences in endowments across complete and incomplete ANC users. In Peru the figure is practically 100 percent followed by 89 percent in Bolivia and 62 percent in Colombia. In terms of the individual variables, similar to the preceding discussions, wealth accounts for the largest proportion of the endowment effect followed by maternal height and at least in the case of Bolivia and Colombia by the family size variables. Taken together with the estimates from the preceding discussion, these estimates imply that while the contribution of the antenatal care variables to inequality in malnourishment is quite modest, the same factors that determine
10 The elasticity and concentration of each of the individual factors which in turn determines their contribution to the concentration index is not reported for all three countries. Figures for Colombia are provided in a supplemental appendix. 11 We focus on these two groups as the proportion of mothers who have not made use of any antenatal care is quite small (see Table 2).
15
inequality in malnourishment are also responsible for the observed HAZ gap between users of complete and incomplete ANC.
V. Concluding remarks
Motivated by the spread of ANC programs in three Andean countries - Bolivia, Colombia, and Peru - where since the 1990s, increasing access to such services has been an explicit policy intervention designed to tackle child malnutrition, and limited evidence on the effects of such programs, this study examined the link between use of ANC and the level and distribution of child stunting.
While there are differences across countries, our overall assessment is that the use of ANC is weakly associated with a reduction in the level of child stunting. We find that access to antenatal care has a statistically significant and large effect on reducing malnutrition in Colombia, in Peru the magnitude of the effect is similar to that found in Colombia although it is not precisely estimated. In the case of Bolivia there is no association between ANC access and child stunting. The variation across countries is probably due to differences in the quality of such care.
Analysis of the distribution of ANC services showed that it is more equally distributed than wealth. We also found that wealth-related concentration in access to ANC services plays a small role in explaining the overall wealth-related concentration in malnutrition. While this is a positive aspect, it also indicates that further expansion of ANC programs can only play a limited role in reducing inequalities in malnutrition. Given the strong direct and indirect influence of the concentration of wealth in determining inequalities in malnutrition, this suggests that from the perspective of reducing inequalities, additional attention needs to be paid at least to those components of the wealth index, such as access to water and sanitation services which are amenable to public policy.
References
Alderman, H., J. Hoddinott and B. Kinsey (2006). “Long term consequences of early childhood malnutrition.” Oxford Economic Papers 58: 450-74.
Alexander, G. and C. Korenbrot (1995). “The role of prenatal care in preventing low birth weight.” Future Child 5 (1): 103-20.
Attanasio, O., L.C. Gomez, A.G. Rojas, M. Vera-Hernandez (2004). “Child health in rural Colombia: determinants and policy interventions.” Economics and Human Biology 2(3): 411-438.
Barber, S. and P. Gertler (2002). Child health and the quality of medical care. Working Papers Haas School of Business, University of Berkeley
Behrman J. R. and E. Skoufias (2004) "Correlates and determinants of child anthropometrics in Latin America: background and overview of the symposium." Economics and Human Biology 2 (3): 335-351.
Breeze, A. and C. Lees (2007). "Prediction and perinatal outcomes of fetal growth restriction." Seminars in fetal and neonatal medicine 12: 383-397.
Camacho, A. (2008). "Stress and birth outcomes: evidence from terrorist attacks." American Economic Review 98(2).
16
Caulfield, L., M. Bentley, S. Ahmed. (1996). "Is prolonged breastfeeding associated with malnutrition? Evidence from nineteen Demographic and Health Surveys." International Journal of Epidemiology 25(4): 693-703.
Chen, Y and L.A. Zhou (2007). "The long-term health and economic consequences of the 1959-1961 famine in China" Journal of Health Economics 26: 659-81.
Currie, J. (2000). Child health in developed countries. Handbook of Health Economics. A. J. Culyer and J. P. Newhouse. Amsterdam, Elsevier Science B.V.
Desai, S. and A. Alva (1998). "Maternal education and child health: Is there a strong causal relationship?" Demography 35(1): 71-81.
ECLAC (2006). Desnutrición infantil en América Latina y el Caribe. Desafíos, Comisión Económica para América Latina y el Caribe: 2-12.
Falkner, F., W. Holzgreve, and R. Schloo (1993). Prenatal influences on postnatal growth: Overview and pointers for needed research. In Causes and mechanisms of Linear Growth Retardation. J. Waterlow and B. Scürch. London Editors.
Flores, R. and E. Frongillo (2001). Levels and Trends in Growth Failure in Developing Countries. Nestlé Nutrition Workshop Series. Philadelphia, Nestlé: 85-96.
Flórez, C. E. and O. A. Nupia (2001). Desnutrición infantil en Colombia: inequidades y determinantes. Documentos CEDE. Bogotá, Universidad de los Andes: 2-34.
Flórez, C. E., R. Ribero, and B. Samper (2003). Health, Nutrition, Human Capital And Economic Growth in Colombia 1995-2000. Documentos CEDE 002785, Universidad de Los Andes-CEDE.
Forero, N. and L. F. Gamboa (2010). "Family size in Colombia: Guessing or Planning? Intended vs. Actual Family Size in Colombia " Desarrollo y Sociedad 64: 85-118.
Gaviria, A. and M. d. P. Palau (2006). "Nutrición y salud infantil en Colombia: determinantes y alternativas de política." Coyuntura económica 36: 33-64.
Grantham-McGregor, S., Y. B. Cheung, Cueto, P. Glewwe, L. Richter, B. Strupp and the International Child Development Steering Group. (2007). "Developmental potential in the first 5 years for children in developing countries." The Lancet 369 (9555): 60-70.
Grossman, M. (1972). "On the Concept of Health Capital and the Demand for Health." The Journal of Political Economy 80(2): 223-255.
Hamill P.V., T.A. Drizd, C.L. Johnson, R.B. Reed, A.F. Roche (1977). NCHS growth curves for children birth-18 years. United States: Vital Health Statistics 11:1-74.
Hoddinott, J., J. Maluccio, J. Behrman, R. Flores, and R. Martorell (2008). "Effect of a nutrition intervention during early childhood on economic productivity in Guatemalan adults." The Lancet 371: 411-416.
Kramer M.S. (1998) "Socioeconomic determinants of intrauterine growth retardation." European Journal of Clinical Nutrition 52(S1): 29-33.
Larrea, C. and W. Freire (2002). "Social inequality and child malnutrition in four Andean countries." Panamerican Journal of Public Health 11(5): 356-364.
Larrea, C., P. Montalvo, and A. Ricaurte. (2005). Child malnutrition, social development and health services in the Andean region. Research Network Working Papers. New York, Inter-American Development Bank.
Li, H., A. DiGirolamo, H. Barnhart, A Stein, and R. Martorell (2004). "Relative importance of birth size and postnatal growth for women's education achievement." Early Human Development 76: 1-16.
Marston, C. and J. Cleland (2010). "Do unintended pregnancies carried to term lead to adverse outcomes for mother and child? An assessment in developing countries." Population Studies 57(1): 77-93.

17
Martorell, R. (1999). "The nature of child malnutrition and its long-term implications." Food and Nutrition Bulletin 20(3): 288-292.
Martorell, R. and T.J. Ho (1984). "Malnutrition, Morbidity, and Mortality." Population and Development Review 10: 49-68.
Martorell, R., J.R. Behrman, R. Flores, A.D. Stein (2005). "Rationale for a follow-up study focusing on economic productivity." Food and Nutrition Bulletin 26 (supp. 1): S5-14.
McDermott, J., C. Drews, M. Adams, H. Hill, C. Berg, and B. McCarthy (1999). "Does inadequate prenatal care contribute to growth retardation among second-born African babies?" American Journal of Epidemiology 150: 706-713.
Moloney, A. (2009). "Bolivia tackles maternal and child deaths." The Lancet 374 (9688):442.
Morales, R. A.M. Aguilar, A. Calzadilla (2004). "Geography and culture matter for malnutrition in Bolivia" Economics and Human Biology 2(3): 373-389.
Peruvian Ministry of Health. (2006). "Avanzando hacia una maternidad segura en el Peru: Derecho de todas las mujeres."
Martorell, R. (2005). The policy and program implications of research on the long-term consequences of early childhood nutrition: lessons from the INCAP follow-up study. Washington DC: Pan American Health Organization.
Ministry of Social Protection. (2010). "Informe de Gestión. Ministerio de la Protección Social." República de Colombia.
Mosley, H. and L. Chen (1984). "An Analytical Framework for the Study of Child Survival in Developing Countries." Population and Development Review 10 (Supplement: Child Survival: Strategies for Research): 25-45.
O'Donnell, O., E. v. Doorslaer, A. Wagstaff and M Lindelow. (2008). Analyzing Health Equity Using Household Survey Data: Washington D.C.
PAHO (2005). Seguro Universal Materno-Infantil. Estudios de Caso, Pan American Health Organization 51-62.
Paraje, G. (2008). Evolución de la desnutrición crónica infantil y su distribución socioeconómica en siete países de América Latina y el Caribe. Políticas Sociales. Santiago de Chile, Naciones Unidas: 3-66.
Ruel, M. (2001). The Natural History of Growth Failure: Importance of Intrauterine and Postnatal Periods. Nestlé Nutrition Workshop Series. Philadelphia, Nestlé: 123-157.
Shapiro-Mendoza, C., B. Selwyn, D. Smith, M. Sanderson (2004). "Parental pregnancy intention and early childhood stunting: findings from Bolivia." International Journal of Epidemiology 34: 387-396.
Singh, Susheela; Jacqueline E. Darroch; Michael Vlassoff & Jennifer Nadeau (2003). Adding it up: the benefits of investing in Sexual and Reproductive Health care. New York NY, Alan Guttmacher Institute/UNFPA
Smith, L. and L. Haddad (2000) Explaining Child Malnutrition in Developing Countries: A Cross Country analysis. IFPRI. Research Report III. 112 pages
Smith, L., M. Ruel, A. Ndiaye (2004). Why is child malnutrition lower in urban than rural areas? Evidence from 36 developing countries. FCND Discussion Paper. Washington, International Food Policy Research Institute.
Steckel, R. (1995). "Stature and the Standard of Living." Journal of Economic Literature 33(4): 1903-1940.
Strauss, J. and D. Thomas (1998). "Health, Nutrition, and Economic Development." Journal of Economic Literature 36(2): 766-817.
Thomas, D. and J. Strauss (1992). "Prices, Infraestructure, household characteristics and child height." Journal of Development Economics 39: 301-331.

18
Thomas, D., J. Strauss, M. Henriques. (1990). "Child survival, height for age and household characteristics in Brazil." Journal of Development Economics 33: 197-234.
United Nations (2008). Objetivos de Desarrollo del Milenio: La progresión hacia el derecho a la salud en América Latina y el Caribe. Santiago de Chile, United Nations.
Valdivia, M (2004) "Poverty, health infrastructure and the nutrition of Peruvian children." Economics and Human Biology 2(3):489-510.
Victora, C., L. Adair, P. Hallal, R. Martorell, L. Ritcher, H. Singh. (2008). "Maternal and child undernutrition: consequences for adult health and human capital " The Lancet 371: 340-357
Wagstaff, A., and M. Claeson (2004). The Millennium Development Goals for Health: Rising to the Challenges. Washington, DC: World Bank.
Wagstaff, A., E. van Doorslaer, N. Watanabe (2003). "On decomposing the causes of health sector inequalities with an application to malnutrition inequalities in Vietnam." Journal of Econometrics 112: 207-223.
Wagstaff, A., P. Pact, E. van Doorslaer. (1991). "On the measurement of inequalities in health." Social Science and Medicine 33(5): 545-557.
Wagstaff, A. and N. Watanabe (2003). "What difference does the choice of SES make in health inequality measurement?" Health Economics 12 (10): 885-90.
Zerai A., and Tsui A.O. (2001). The Relation between Prenatal Care and subsequent modern contraceptive use in Bolivia, Egypt and Thailand. African Journal of Reproductive Health 5(2):68–82
19
Tables and figures
TABLE 1 Classification of the determinants of child malnutrition
Variables Description
Antenata
l care
and com
plem
entary
behavior
(AC)
Complete antenatal care; Incomplete antenatal care
Complete antenatal care = 1; no antenatal care = 0 Incomplete antenatal care = 1; no antenatal care = 0 Complete antenatal care is defined as six visits to a doctor or nurse during pregnancy with initiation during the first trimester; incomplete antenatal care is at least 1 visit but less than 6
Tetanus Number of tetanus injections during pregnancy Iron Mother took iron supplements during pregnancy = 1; 0, otherwise Calcium Number of months mother took calcium during pregnancy (only
Colombia) Folic acid Number of months mother took folic acid during pregnancy (only
Colombia) Vision difficulties Mother had vision difficulties while pregnant = 1; 0, otherwise Alcohol Smoke
Mother consumed alcohol during pregnancy =1; 0, otherwise (only Colombia) Mother smoked during pregnancy = 1; 0, otherwise (only Colombia)
Pregnancy duration Pregnancy duration in months (only Colombia). % Antenatal Care Percentage of women who receive some antenatal care (complete
and incomplete) in the region/department
Childre
aring
attitudes (C
h)
Nutrition Child was given infant formula in the first three days of life = 1; 0, otherwise
Breastfeeding Child has ever been breastfed = 1; 0, otherwise Mothers are (primary) care givers
Mother is (primary) care giver = 1; 0, otherwise. For Bolivia, this variable was replaced by whether a mother works at home/doesn’t work, assuming that if she doesn’t work/works at home she takes care of the child.
House
hold
and
matern
al controls
(HC)
Mother’s height Mother’s height in meters Mother’s age Mother’s age and age squared Mother’s education Wealth index
Mother’s years of education A wealth index based on household assets
Marital status Mother is married = 1; 0, otherwise Zone Urban = 1, rural = 0 Capital Household lives in the capital city =1; 0, otherwise Source of water Piped drinking water = 1; 0, otherwise.
Child controls
(CC)
Age, Age2 Child age and age squared
Gender Boy = 1, girl = 0 Growth Program Child attends Growth and Development Program (Colombia) or
growth controls (Peru) = 1; 0, otherwise 2nd, 3rd, 4th born+ Dummy variables indicating birth order of child. The reference
category is being the first born. Siblings Number of living siblings. Indigenous Child belongs to an indigenous group = 1; 0, otherwise

20
TABLE 2 Descriptive statistics
Bolivia Colombia Peru
Antenat
al care
and com
plem
entary
beh
avio
r
% of mothers receiving complete antenatal care % of mothers receiving incomplete antenatal care % of mothers receiving no antenatal care % of mothers who received tetanus injections
43.1 47.8 9.1 70.8
61.6 32.3 6.0 89.8
28.1 69.6 2.4 76.5
Average number of tetanus injections 1.3 1.8 1.4
% of mothers who took iron during pregnancy 77.6 75.0 77.5
Average number of months the mother took calcium - 2.1 -
Average number of months the mother took folic acid
- 2.1 -
% of mothers who had vision diff, during pregnancy 13.7 10.9 14.4
% of mothers who consumed alcohol during pregnancy
- 9.1 -
% of mothers who smoked during pregnancy - 3.5 -
Average pregnancy duration - 8.8 -
Childre
arin
g
attitudes
% of children who were given infant formula in the first three days of life
5.1 25.3 16.2
% of children who were ever breastfed 99 97.8 98.0
% of mothers who are the caregivers 42.5 16.9 36.5
House
hold
and m
atern
al
controls
Average height of the mother 1.5 1.6 1.5
Average age of the mother 29.5 28.5 29.8
Average years of the mother's education 7.7 8.3 8.7
Wealth index 2.52 2.40 2.91
% of married women (or those who live with their partner)
85.4 74.6 84.6
% of women in urban areas 57.9 71.7 63.0
% of women in the capital city 27.9 14.5 22.9
% of women who access piped water 75.3 83.5 69.6
Childre
n controls Average age of the children (months) 27.8 34.4 30.2
% of girls 48.7 48.4 50.7
% of children who attend growth and development program
- 43.6 64.8
Average number of siblings 2.0 1.3 1.6
% of indigenous children 62.9 - 11.7
21
TABLE 3 Distribution of HAZ scores
Bolivia Colombia Peru
Average HAZ
Malnourished children
(percentage)
Average HAZ
Malnourished children
(percentage)
Average HAZ
Malnourished children
(percentage)
Overall -1.20 25.12 -0.89 15.15 -1.26 27.00
Antenatal care
No Antenatal Care -1.76 42.20 -1.35 29.00 -1.84 47.92
Complete Antenatal care (CAC) -0.981
18.13 -0.76
11.24 -1.06
22.25
Incomplete Antenatal Care (IAC) -1.418
28.16 -1.05
19.74 -1.29
27.88
Difference CAC and IAC 0.437 0.295 0.238
Mother is primary care giver
Yes -1.15 23.48 -0.90 15.65 -1.34 28.84
No -1.23 26.33 -0.89 15.03 -1.21 25.60
Wealth index quintiles
Poorest -1.82 44.18 -1.28 25.96 -2.06 55.78
Poorer -1.46 32.33 -1.00 16.64 -1.70 42.08
Middle -1.15 21.73 -0.88 13.83 -1.26 24.91
Richer -0.85 14.55 -0.64 9.22 -0.99 14.12
Richest -0.44 6.25 -0.40 4.95 -0.58 8.51
Mother's education
No education -1.94 48.98 -1.40 30.47 -2.15 61.94
Primary -1.45 32.30 -1.13 20.45 -1.73 41.03
Secondary -0.93 15.96 -0.82 13.29 -1.12 21.21
Higher -0.55 9.16 -0.46 6.23 -0.66 9.66
Residence
Urban -0.88 16.38 -0.77 12.03 -0.97 16.78
Rural -1.63 37.13 -1.19 22.66 -1.75 43.79
Sex
Male -1.25 27.11 -0.82 17.22 -1.25 28.16
Female -1.14 23.01 -0.96 13.00 -1.26 25.45
Ethnicity
Indigenous -1.44 30.71 - - -2.01 55.03
Non-Indigenous -0.78 15.62 - - -1.16 23.04
Number of Observations 4945 7540 4208

22
TABLE 4 Determinants of height-for-age z-scores (OLS)
Bolivia Colombia Peru
βk P-value βk P-value βk P-value
Complete antenatal care 0.002 0.980 -0.250*** 0.000 -0.207 0.152
Incomplete antenatal care 0.082 0.328 -0.225*** 0.000 -0.262* 0.064
Tetanus injections -0.020 0.289 0.008 0.589 0.041** 0.031
Iron 0.029 0.484 -0.104*** 0.003 -0.063 0.168
Calcium - - 0.010 0.168 - -
Folic acid - - 0.008 0.204 - -
Vision difficulties -0.039 0.391 0.010 0.813 0.053 0.328
Alcohol - - 0.039 0.439 - -
Smoke - - -0.022 0.802 - -
Pregnancy duration - - -0.141*** 0.000 - -
% antenatal care in the region -0.024*** 0.000 -0.009*** 0.000 -0.005** 0.016
Nutrition supplement first days 0.057 0.506 -0.042 0.202 -0.033* 0.070
Breast feeding -0.078 0.678 0.068 0.550 -0.051 0.758
Mother is prime care giver -0.014 0.725 -0.089** 0.017 0.068 0.101
Mother's height -5.477*** 0.000 -6.062*** 0.000 -5.985*** 0.000
Mother's age -0.069*** 0.007 -0.057*** 0.002 -0.062** 0.012
Mother's age - squared 0.001* 0.087 0.000 0.145 0.001 0.156
Mother's education (years) -0.014** 0.014 -0.013*** 0.005 -0.025*** 0.000
Wealth index -0.277*** 0.000 -0.180*** 0.000 -0.221*** 0.000
Mother is married -0.006 0.914 0.031 0.341 -0.052 0.305
Urban 0.026 0.689 0.026 0.537 -0.121** 0.042
Capital -0.089 0.126 0.464*** 0.000 0.197** 0.047
Age in months 0.038*** 0.000 0.035*** 0.000 0.005 0.594
Age in months - squared 0.000*** 0.000 0.000*** 0.000 0.000 0.483
Gender 0.061 0.108 0.077*** 0.005 -0.034 0.368
2nd born 0.121** 0.040 0.229*** 0.000 0.258*** 0.000
3rd born 0.155** 0.050 0.314*** 0.000 0.281*** 0.000
4th born 0.233** 0.024 0.398*** 0.000 0.397*** 0.001
Number of living siblings 0.069*** 0.001 0.034 0.137 0.060** 0.017
Indigenous 0.101** 0.028 - - 0.278*** 0.002
Growth Program - - -0.039 0.187 0.023 0.545
Constant 12.314*** 0.000 13.320*** 0.000 12.420*** 0.000
Observations 3,001 5,134 2,728
R-squared 0.294 0.247 0.337
Note: Statistical significance: *** 1%; **5%; * 10%
23
TABLE 5 Decomposition of HAZ concentration indices
Bolivia Colombia Peru
Concentration Index -0.236 -0.208 -0.229
Decomposition (percentage)
Complete antenatal care -0.07 9.95 2.47
Incomplete antenatal care 1.68 -5.09 -2.29
Tetanus injections 0.16 -0.08 0.06
Iron -0.25 2.59 0.48
Calcium - -1.79 -
Folic acid - -1.52 -
Vision difficulties -0.28 0.08 0.14
Alcohol - 0.07 -
Smoke - -0.04 -
Pregnancy duration - -1.20 -
% antenatal care in the region 3.98 5.86 1.74
Nutrition supplement first days -0.45 0.32 0.95
Breast feeding -0.02 0.02 -0.08
Mother is prime care giver 0.06 -0.28 0.37
Mother's height 16.31 15.56 18.08
Mother's age -1.22 7.93 1.72
Mother's age - squared 2.03 -3.05 -0.33
Mother's education (years) 8.60 8.73 13.09
Wealth index 54.22 50.73 38.44
Mother is married -0.01 0.06 -0.37
Urban -1.89 -2.04 7.68
Capital 0.36 -6.01 -1.51
Age in months -1.74 -2.99 0.26
Age in months - squared 2.41 3.57 -0.03
Gender -0.06 -0.11 -0.05
2nd born -1.57 -2.96 -2.23
3rd born -0.46 0.12 -0.32
4th born 7.04 12.76 9.76
Number of living siblings 9.18 4.73 6.54
Indigenous 2.21 - 5.27
Growth Program - 0.57 0.18
Residual -0.23 3.52 -0.02
Total 100% 100% 100%
24
TABLE 6 Oaxaca decomposition
Bolivia Colombia Peru
E C CE E C CE E C CE
Tetanus inj. 0.002 -0.131 0.018 0.007 0.115 -0.010 -0.002 0.079 0.003 Iron -0.004 0.042 -0.004 0.018 -0.071 0.013 0.003 0.063 -0.002 Calcium - - - -0.024 -0.030 0.013 - - - Folic acid - - - -0.005 0.020 -0.008 - - - Vision diff. 0.000 -0.004 0.000 0.000 0.009 0.001 -0.001 0.034 0.001 Alcohol - - - -0.001 0.015 0.005 - - - Smoke - - - -0.004 0.004 0.003 - - - Pregn. duration - - - 0.006 -1,003 0.007 - - - % AC in the region 0.050 0.657 -0.018 0.013 1,049 -0.012 -0.003 -0.148 0.003 Nutrition 1st days -0.004 -0.010 0.006 0.002 0.019 -0.002 0.000 0.008 -0.002 Breast feeding 0.000 -0.045 -0.000 -0.002 -0.363 0.002 0.002 0.496 -0.002 Mother cares 0.001 -0.010 -0.001 0.000 -0.015 0.000 0.007 0.009 0.003 Mother´s height 0.102 0.664 -0.008 0.045 -0.232 0.001 0.064 1,407 -0.008 Mother's age -0.018 0.512 0.003 0.040 -0.553 0.025 0.019 -0.713 0.042 Mother's age Squared 0.023 -0.205 -0.005 -0.002 0.128 -0.010 0.028 0.405 -0.045 Mother’s education -0.011 -0.227 0.056 0.003 -0.226 0.046 0.010 -0.242 0.032 Wealth 0.161 -0.122 0.026 0.079 -0.006 0.012 0.080 0.053 -0.022 Married 0.000 -0.009 0.000 -0.006 -0.154 0.016 0.002 0.079 -0.002 Urban 0.017 0.150 -0.035 -0.000 0.026 -0.004 0.011 0.138 -0.008 Capital -0.000 -0.024 -0.004 -0.005 0.012 -0.001 0.007 0.075 -0.008 Age in months 0.004 0.846 0.005 -0.068 -0.135 0.006 0.002 -0.142 0.001 Age in months squared 0.000 -0.515 0.001 0.057 -0.011 0.001 -0.000 0.174 -0.000 Gender -0.000 0.010 -0.000 -0.000 0.054 -0.000 0.002 0.001 -0.000 Growth program - - - 0.003 0.008 -0.002 -0.002 -0.046 0.005 2nd born -0.009 0.005 -0.001 -0.016 0.006 -0.001 -0.008 -0.020 0.002 3rd born 0.003 -0.008 -0.001 -0.004 -0.020 0.001 0.007 -0.025 -0.003 4th born 0.004 0.049 0.022 0.044 0.017 0.014 0.010 -0.008 -0.001 Siblings 0.055 -0.060 -0.018 0.004 0.026 0.008 0.003 0.009 0.000 Indigenous 0.011 0.005 0.002 - - - -0.004 -0.004 0.001 Constant 0.000 -1,567 0.000 0.000 1,294 0.000 0.000 -1,672 0.000 Total Contributions 0.388 0.003 0.046 0.184 -0.016 0.127 0.236 0.011 -0.010 Total Difference 0.437 0.295 0.237
Notes: E (Endowments). C (coefficient), CE (Interaction between endowments and coefficients)

25
Figure 1 Concentration Curves by groups of children
01
0.2
0.4
0.6
0.8
Cu
mu
lative u
nde
r_five
sh
are
of m
aln
utr
itio
n
0 10.2 0.4 0.6 0.8Cumulative share of children
No Antenatal Care Complete Antenatal Care
Incomplete Antenatal Care
Bolivia (2008)
01
0.2
0.4
0.6
0.8
Cu
mu
lative u
nde
r-five s
ha
re o
f m
aln
utr
itio
n
0 10.2 0.4 0.6 0.8Cumulative share of children
No AC Complete Antenatal Care
Incomplete Antenatal Care
Colombia (2005)
01
0.2
0.4
.60
.8C
um
ula
tive
un
de
r-five s
ha
re o
f m
aln
utr
itio
n
0 10.2 0.4 0.6 0.8Cumulative share of children
No AC Complete AC
Incomplete AC
Peru (2008)

26
Appendices
TABLE A1 Decomposition of HAZ concentration index for Colombia
Elasticity CI Contribution Percent
Complete antenatal care -0.179 0.116 -0.021 9.95
Incomplete antenatal care -0.077 -0.138 0.011 -5.09
Tetanus injections 0.016 0.010 0.0002 -0.08
Iron -0.087 0.062 -0.005 2.59
Calcium 0.022 0.169 0.004 -1.79
Folic acid 0.020 0.161 0.003 -1.52
Vision difficulties 0.001 -0.134 -0.0002 0.08
Alcohol 0.004 -0.036 -0.0001 0.07
Smoke -0.001 -0.109 0.0001 -0.04
Pregnancy duration -1.400 -0.002 0.002 -1.20
% antenatal care in the region -0.722 0.017 -0.012 5.86
Nutrition supplement first days -0.012 0.056 -0.001 0.32
Breast feeding 0.074 -0.001 -0.00005 0.02
Mother is prime care giver -0.017 -0.034 0.001 -0.28
Mother's height -10.568 0.003 -0.032 15.56
Mother's age -1.822 0.009 -0.017 7.93
Mother's age - squared 0.419 0.015 0.006 -3.05
Mother's education (years) -0.121 0.150 -0.018 8.73
Wealth index -0.552 0.191 -0.106 50.73
Mother is married 0.026 -0.005 -0.0001 0.06
Urban 0.021 0.204 0.004 -2.04
Capital 0.075 0.166 0.013 -6.01
Age in months 1.371 0.005 0.006 -2.99
Age in months - squared -0.728 0.010 -0.007 3.57
Gender 0.045 0.005 0.0002 -0.11
2nd born 0.077 0.080 0.006 -2.96
3rd born 0.066 -0.004 -0.0002 0.12
4th born 0.075 -0.355 -0.027 12.76
Number of living siblings 0.051 -0.193 -0.010 4.73
Indigenous - - - -
Growth Program -0.019 0.062 -0.001 0.57
Residual -0.007 3.52
27
FIGURE A1 Concentration curves
0.2
.4.6
.81
0 .2 .4 .6 .8 1Cum. share of children
Bolivia Colombia
Perú
Concentration Curves by Country
FIGURE A2 Incomplete Antenatal Care

28
FIGURE A3 Complete Antenatal Care