child labour and school attendance in palestine: the … · child labour and school attendance in...
TRANSCRIPT

Child labour and school attendance in Palestine:
the role of local labour market and the effect of conflict with Israel
Michele Di Maio
University of Naples ’Parthenope’
Tushar K. Nandi∗
University of Siena
First Version: June 2008
This Version: September 2009
Abstract
This paper studies the impact of changes in the local labour market conditions and in
the Israeli-Palestine conflict on child labour and school attendance of Palestinian children
in the West Bank. We use a novel dataset obtained by matching the Palestinian Labour
Force Survey with a separate data set of children (10-14 years). We consider the period
between the beginning of the Second Intifada (September 2000) and 2006. Using a bivariate
probit model for child labour and school attendance outcomes, we find that an increase in
the border restrictions imposed by Israel increases child labour while it does not affect school
attendance. We also find that child labour increases when the labour market opportunities
improve. This substitution effect is much smaller during conflict periods when - following a
reduction in the market wage - child labour tends instead to increase.
Keywords: Palestine, Israel, child labour, school attendance, conflict, closure days
JEL Classification: J13, C35
∗Corresponding author: Michele Di Maio, Department of Economic Studies, Faculty of Economics, University
of Naples ’Parthenope’: E-mail: [email protected]. We would like to thank Davide Castellani,
Eric Edmonds, Tommaso Frattini, Ira Gang, Gianna Giannelli, Marco Manacorda, Patrizio Piraino, seminar
participants at University of Siena, University of Bethlehem, University of Perugia, XXIII AIEL Conference and
the 2nd IZA Workshop on Child Labour in Developing Countries for comments and suggestions. All errors are
of course our own responsibility. Financial support from the FIRB Project ”Creation of a Centre for Advanced
Studies and Research in Cooperation and Development at Bethlehem University” is gratefully acknowledged.
1

Contents
1 Introduction 3
2 Child labour, labour market opportunities and the conflict 4
3 Estimation 7
3.1 Estimation strategy . . . . . . . . . . . . . . . . . . . . . . . . . . . . . . . . . . 7
3.1.1 Number of closure days and the evolution of the Palestinian labour market 9
4 Data 10
4.1 Descriptives statistics . . . . . . . . . . . . . . . . . . . . . . . . . . . . . . . . . 11
5 Estimation results 14
5.1 Discussion of the results . . . . . . . . . . . . . . . . . . . . . . . . . . . . . . . . 18
5.2 Robustness checks and other model specifications . . . . . . . . . . . . . . . . . . 19
6 Concluding remarks 20
7 Appendix 25
2

1 Introduction
The existence of child labour naturally raises a number of ethical, social and economic issues.
While the dimension of the phenomenon is well known, there is still a large disagreement con-
cerning its main determinants. One reason is that - as recent research indicates - child labour
is a more varied, country and context-specific phenomenon than usually believed. In particular,
the empirical evidence suggests that not only the child and household characteristics but also
the features of the labour market may play a fundamental role in determining the level and
dynamics of child labour. If the labour market is an important determinant of child labour, it
follows that any factor that modifies its functioning may have a large impact on child labour
too. This is especially true for weak and fragile developing countries whose labour market is
directly affected by a military conflict. This is the case of the Palestinian Territories.
Starting from the Six-Day War in 1967, the Palestinian Territories (West Bank and Gaza
Strip) have been occupied by Israel. Since then, periods of conflict of different intensity followed
one after the other. After a decade of (relative) amelioration of the economic and political
situation during the 90’s, the situation had dramatically worsen since the so-called Second
Intifada (September 2000). In response to re-surge of the conflict, Israel started increasingly
imposing on Palestinian workers a number of mobility restrictions through different means:
closures of borders, curfews and sieges.1 In particular, the closure of borders made impossible
for Palestinian workers employed in Israel to reach their job places. Given that those represent
a relevant share of Palestinian workers, the closures severely affected the performance of the
Palestinian labour market.
The starting point of the present paper is the presumption that these effects are likely to
reverberate on child labour and school attendance. The conflict can affect children’s outcomes
through a direct and an indirect channel. It directly impacts on children belonging to households
whose father is employed in Israel but it also affects child outcome through the modification of
the general economic condition of the region and in particular of the the labour market. The
closure of borders causes a sudden and unanticipated change in the earnings for Palestinian
workers employed in Israel. Repeated incidence of closure can encourage returning workers to
look for local jobs modifying the domestic labour market, increasing domestic unemployment
and reducing local wage. Households - either directly or indirectly affected by the mobility
restrictions - unable to smooth consumption during temporary shocks may decide to send their
children work. The luxury axiom indeed implies that that during sever economic down-turns
the drop in household income should induce an increase in child labour and a reduction in
school attendance. At the same time, closures affect the local labour market and modify the
child opportunity cost of not working. From a theoretical point of view, a change in latter is
predicted to have two opposite effects on child labour (and school attendance): the income and1Closure consists of banning the movement of labor and goods between the Occupied Territories and Israel,
as well as between, and within, the West Bank and the Gaza Strip. Siege implies the the closing off of a town.
3

the substitution effect. It is an empirical question which of these effects prevails.
In this paper we determine the response of children’s time allocation to changes in the local
labor market conditions, to the intensity of the conflict and to the changes induced by the latter
on the former. We use data on 10-14 years old children between the beginning of the Second
Intifada (September 2000) and the end of 2006 in the West Bank. Our results show that 1) the
intensity of the conflict - measured by the number of closure days - increases the probability of
child labour; 2) the probability of child labour is positively correlated with the labour market
opportunities measured by the local average market wage, i.e. the substitution effect prevails;
3) the conflict modifies the ”‘normal”’ relationship between the opportunity cost of not working
and child labour decision. When closure are in place, the income effect becomes stronger: this
suggests that child labour tends to increase as a reaction to the worsening of the economic
conditions.
Our paper is related to two lines of research on child labour - the effects of local labour market
dynamics on child labour (Wahba, 2006) - and the impact of aggregate shocks on children’
outcomes (see i.e. Duryea and Arends-Kuenning, 2003). To the best of our knowledge, this is
the first paper that analyzes how child labour and school attendance in West Bank are affected
by the intensity of the Israeli Palestinian conflict and how the latter impacts on the relation
between the labour market opportunities and child choice.
The paper is structured as follows. The next section review the two strands of literature to
which the paper is related to. Section 3 presents the estimation strategy. Section 4 describes
the dataset and the characteristics of child labour and school attendance in West Bank. Section
5 presents the estimation results and robustness checks. Section 6 concludes the paper.
2 Child labour, labour market opportunities and the conflict
This section reviews the two strands of literature that are relevant for our analysis. The first
concerns the interaction between child labour, school attendance and the local labour market in
developing countries. The second is related to the analysis of the evolution of the Palestinian
labour market and how it has been affected by the conflict with Israel.
Child labour and labour market opportunities Until recently, most of the analysis of
child labor has focused on testing the ’luxury axiom’ introduced by Basu and Van (1998) which
states that parents send their children to work when household income is low. While the luxury
axiom is considered the reference point in the theoretical literature, there is no consensus in the
empirical literature on the relationship between poverty and child labour. In fact, although child
labour is likely to be positively correlated to household poverty, it is also likely to be determined
by other socio-economic factors: access to school, intergenerational expectations, inequality
and employment opportunities. Indeed all these elements have been shown to be important
components in explaining child labour (Edmonds, 2008). In particular, recent research has
4

focused on the effect of opportunities provided by the labour market (see for instance Edmonds
et al, 2009). These are usually measured by the local average market wage which gives the
opportunity cost of not-working. From a theoretical point of view two effects that are in place
when the market wage change: the income and the substitution effect. The former prevails when
a lower market wage increases child labour. This is the case when the child works for reaching
a given level of consumption. On the contrary, the substitution - or own price effect - prevails
when an increase in the market wage - the opportunity cost of not working - induces the child
to work more. It is an empirical question which of the two effects prevails.
Empirical evidence from developing countries suggests the substitution effect to dominate
the income effect. Levison (1991) and Barros et al. (1994) find that child labour in Brazil is
higher in high income cities with thriving labour markets than in cities with higher poverty
rates. Duryea and Arends-Kuennings (2003) analyze child labour and schooling decision in
Brazil using a dataset comprising repeated cross-sections covering 1977-1998 to determine the
effect of changes in labour market opportunities on child labour and schooling. They find that
market wage of low-skilled workers (a proxy for child’s opportunity cost of not working) has a
positive and significant effect on child labour. Wahba (2006) uses individual data from the 1988
Egypt’s Labour Force Survey to study the sensitivity of household supply of child labour to
adult market wages. She finds that higher the adult male and female provincial wages relative
to the national average, lower is the probability of child labour, while child wages are negatively
correlated with child labour. Finally, Kruger (2007) documents an increase in child labor and
a decline in schooling in coffee-growing regions of Brazil during a temporary boom in coffee
exports.
While different as for methodologies and datasets used, all these studies point to two facts.
First, a strong country effect seems to be present (Ray, 2000). Second, child labor responds to
the availability of jobs and to the opportunity cost of not working.
Child labour and the closure of Israel-Palestine borders The Palestinian economy is
characterized by a peculiar labour market: Palestinian unemployment and domestic wage have
long strongly responded to job opportunities and wage dynamics in Israel (Angrist 1996; Kadri
and MacMillen, 1998; Sayre 2001).2 This is not surprising considering that by the late 1990s
- under conditions of relatively open but controlled borders - more than one-fifth of the total
labor force was commuting daily to Israel (Ruppert Bulmer, 2003).
The recent re-surge of Palestine-Israel conflict, started by the Second Intifada in September
2000, has added another dimension of complexity to the dynamics of the Palestinian labour
market. While the prohibition to enter Israel for Palestinians without a special work permit
has been there since the beginning of the 90s3, the closures that prohibit the movement of all2See also Farsakh (2002), Shaban (1993).3Until the late 1980s, Palestinians and Israelis could move freely between each other’s territories. Israel
introduced permit requirements in 1991 to control the movements of Palestinian workers. After the 1993 Oslo
5

Palestinians, including authorized workers, between the Palestinian Territories and Israel are
now increasingly used (together with a number of other measures) in order to militarily control
the area.
The closure of borders is intended to be a security measure taken in the presence of surges,
or expected surges, in the Israeli-Palestinian conflict (Miaari and Sauer, 2006). But their effects
obviously are much more pervasive. Recently academic researchers, international agencies and
NGOs have documented how the closures have impacted the Palestinian economy (see for in-
stance B’Tselem, 2007; OCHA, 2007; PCBS, 2001; United Nations, 2002; World Bank, 2003).
In particular, academic research has mostly focused on measuring the effect of changes in the
number of closure days on the performance of the Palestinian labour market. The reason is
twofold. First, the labour market is the part of the economy expected to be affected the most
by these measures since closures have a direct impact on Palestinian workers employment op-
portunities. Second, the availability of a detailed Labour Force Survey allows a careful analysis
of the phenomenon.
Ruppert Bulmer (2003) is the first study of the effect of changes in the Israeli border policy on
daily Palestinian labour flows to Israel, unemployment and wages. The calibrated model predicts
that closures would raise total unemployment in Palestine, increasing domestic employment with
decreasing wages. the latter effect is the result of the downward pressure caused by the return
of workers previously employed in Israel. Aranki (2004) and Miaari and Sauer (2006) both
estimated the effect of closures on the Palestinian labour market using data from the PCBS
Labour Force Survey. Their results suggest that closures have a negative effect on Palestinian
workers, not only on those who commute to Israel for work. In particular, closure increases
the probability of being unemployed and decrease the monthly earnings of Palestinian workers
regardless of their work location (Israel or Palestinian Territories). The only paper we are aware
of studying child labour and schooling in Palestine is Al Kafri (2003). It analyzes child labour
and schooling decision in Palestine comparing year 2000 and 2001 (i.e. before and after the
Second Intifada) focusing on supply factors at the household level. However, his analysis does
not include the number of closure days, the market wage and household income as explanatory
variables. The results of the sequential-response model show an increase in the probability for
male child to go to work and for female child to leave school following the beginning of the
Second Intifada.
Accords permit controls and other mobility restrictions (i.e., temporary border closures) were started to be strictly
enforced.
6

3 Estimation
3.1 Estimation strategy
This section describes the econometric model used to study the effect of changes in local market
opportunities and conflict on child labour and school attendance. Our estimation strategy is
based on the fact that the number of closure days - our measure for the intensity of the conflict
- is exogenous to the evolution of the Palestinian labour market condition. At the same time we
argue that the average district low-skilled market wage - our proxy for the opportunity cost of
child labour4 - is exogenous to the probability of child labour and school attendance. We argue
that the latter is exogenous to our dependent variables on two grounds. First, given the different
level of aggregation (district vs. individual) the relation between the two is not direct. Second,
in the Palestinian case child labour is so low that it is unlikely to have any effect on the average
market wage. Thus we conclude that the average district market wage can be consistently used
to estimate the effect of labour market opportunities on child labour and school attendance.
Following Duryea and Arends-Kuenning (2003), we assume that the decisions (work and
school) are interdependent.5 Accordingly, we use a bivariate probit model to estimate the prob-
abilities of child labour and school attendance. Indeed, an interesting feature of this model is that
it allows for the correlation of random components and it gives a measure of the interdependence
of the working and schooling decisions.
Let cl∗i and sc∗i denote two latent variables underlying the working and schooling decisions,
respectively, for child i in household j in district k. We represent the decision making process
as follows:
cl∗i = gi1 (·) + ui1 (1)
sc∗i = gi2 (·) + ui2
where [ui1, ui2] ∼ BN (0, 0, 1, 1, ρ) and BN stands for the bivariate normal distribution. The
index function for child z has the form:
gi (·) = αj + βk + γt + θλjt + δσt + X′jktφ l = 1, 2 (2)
where α, β and γ are household, district and quarter fixed effects, respectively. σ is the variable
which captures the intensity of the conflict as the number of days the borders between Israel4To measure the child’s opportunity cost of not working, the obvious candidate would be the average child
wage at the district level. This was not possible due to the etremely low number of observations on child wage in
our dataset.5The estimation method reflects the household decision making process about supplying child labour or sending
child to school. Conceptually four options are available: only school, only work, both, and neither of them. In the
child labour literature, children’s work and schooling are often treated either as two independent decisions or as a
sequential process. We deviate from these methods on the following grounds. First, a multinomial choice model
requires the a unlikely assumption that child labour and schooling are simultaneous and independent to hold.
Second, a sequential choice model requires a strong assumption on the hierarchy of the options which depends on
the different welfare perspectives adopted (Wahba 2006).
7

and Palestinian Territories remained closed in a quarter. The associated coefficient measures the
impact of the conflict on child outcomes. λ is our measure of the tightness of the labour market,
i.e. the average district level low-skilled market wage. In the baseline specification this is the
(log) wage of private sector workers with less than seven years of education.6 The coefficient θ
captures the extent to which changes in labour market opportunities induce a change in child
status. Xjt is a vector of control variables that account for individual, household and district
characteristics and the interaction factors. Its content varies across specifications. In the baseline
specification it includes child’s age, parents’ years of education - which controls for the long-run
household income, mother being employed, a categorical variable for household income (net of
child wage) and the interactions between the number of closure days and the average market
wage, the distance from the Israeli border and the household income. In section 5.2 we consider
a number of robustness checks and other model specifications.
Suppose now that cli and sci are the observed dummy variables for working and schooling
decisions, defined as:
cli
{= 1 if cl∗i > 0
= 0 otherwise
sci
{= 1 if sc∗i > 0
= 0 otherwise
The choice probabilities for child i are:
p11i = Pr[cli = 1, sci = 1] = Φ [gi1 (·) , gi2 (·) , ρ]
p10i = Pr[cli = 1, sci = 0] = Φ [gi1 (·) ,−gi2 (·) , ρ]
p01i = Pr[cli = 0, sci = 1] = Φ [−gi1 (·) , gi2 (·) , ρ]
p00i = Pr[cli = 0, sci = 0] = Φ [−gi1 (·) ,−gi2 (·) , ρ]
where Φ ( ) is the standardized bivariate normal distribution function. Define qi1 = 2cli − 1 and
qi2 = 2sci−1 such that qij takes value 1 or -1 depending on the value of the constituting dummy
variable. Define ρ∗i = qi1qi2ρ. The model is estimated maximizing the log likelihood function
that takes the following form.
LL =n∑
i=1
lnΦ [qi1gi1 (·) , qi1gi2 (·) , ρ∗i ]
Since one of our focus variables, local market wage, is constructed from the individual ob-
servations, the intra-cluster correlation of the error terms can affect the estimated standard
error. In our estimation we take into account and correct for this possible bias. Error correction
for other aggregate variables are used as robustness checks. This includes estimation of robust6Wages are in constant 1996 New Israeli Shekels (NIS), obtained by deflating nominal wages by the Consumer
Price Index in West Bank provided by the PCBS. In the robustness checks we consider other and more restrictive
definition of low-skilled wage. Note, however, that the average father’s years of education in our sample is 10.
8

standard errors taking into account household and other district level variables constructed from
individual observations.
One potential problem with using the market wage to capture the tightness of the local
labour market - and thus the opportunity cost of not working - is that the former is likely to be
correlated with un-observable characteristics at the district level. Indeed the level of the wage
is likely to be associated with the general economic condition of the district: e.g. a higher wage
would indicate a richer district. We use fixed effects at the district, household and individual
level to control for the time invariant heterogeneity.7
Another possible concern with this empirical strategy is potential endogeneity of closure
days. We now present some compelling evidence supporting our statement on the exogeneity of
closure days.
3.1.1 Number of closure days and the evolution of the Palestinian labour market
Since the end of the first Gulf War, Israel has used temporary closures of West Bank and Gaza
Strip to restrict the movement of Palestinians between Palestinian Territories and Israel (see
also Section 2). This was intended to be a security measure taken in the presence of insurgency,
or expected insurgency, in the Israeli-Palestinian conflict (Miaari and Sauer, 2006). In practice,
closures consist of restrictions on the movement of all Palestinians (including the Palestinian
workers with legal permit to work in Israel) and goods between the West Bank, Gaza, and Israel
(as well as third countries).
We used two sources for constructing the series of closure days for the West Bank. The
main source was the Office of the United Nations Special Coordinator (UNSCO) in Ramallah
which provided us with data for the period 1999-2004. UNSCO calculates the number of days
of effective closures by netting out of comprehensive closures Saturdays, half the number of
Fridays (labor and commercial flows are at about half their normal workday level on Fridays)
and Jewish and Muslim holidays. We complemented these data with the information collected
by B’Tselem on closure days for the period 2004 2006 checking also for consistency between the
two data series.
Figure 1 shows the number closure days imposed by Israel on the West Bank in each quarter
between 1999 and 2006. After the dramatic increase following the Second Intifada (fourth
quarter of 2000), the number of closures days have fluctuated with a rather high variance during
the period under consideration.
For our estimation strategy to be able to capture the effect of the conflict on our depen-
dent variables (child labour and schooling attendance) the number of closure days have to be
exogenous to both the dependent variables and to the other variables (in particular the average
market wage) in our model. In the following we show that the number of closure days: 1) do7The underlying assumption here is that there is no time-variant heterogeneity which influences the outcome
variables. Considering the evolution of the Palestinian economy in the period under consideration, we cannot
indicate any of these possible sources of heterogeneity.
9

Table 1: Determinants of the number of closure days
Number of closure days Coeff. p-value
wage lag -1.15 0.483
unemployment lag -1.12 0.309
closure lag -0.13 0.564
# 24
F 0.482
R-square 0.113
Note: OLS regression. Variable definition is reported in the Appendix.
not depend on the economic conditions or the labour market in Palestine; 2) are not systematic
across quarters (they are not seasonal) and do not have a trend. This evidence will support our
statement that in fact the number of closure days is exogenous to the evolution of the Palestinian
domestic labour market and only responds to military consideration.
As first piece of evidence, we have that the number of closure days are not correlated with
the average wage, the low skilled average wage or the unemployment rate in WB in the previous
period.8 As an additional check we also regressed the number of closure days on previous period
number of closure days, average wage and unemployment rate. The results are reported in the
Table 1. We also verified that the number of closure days does not have a seasonal component.9
These results confirms the view in Miaari and Sauer (2006) that the (temporary) closures of the
West Bank are not related to unobserved determinants of Palestinian labor demand or to the
evolution of the economic situation in the region. Finally, we find that the correlation between
closure days and the percentage of child labour at the district level is positive significant (0.18),
while the correlation with schooling is not statistically different from zero.
4 Data
This paper uses individual level data from the Palestinian Labour Force Survey, carried out
by the Palestinian Central Bureau of Statistics (PCBS), for the period 1999-2006. Each round
of the survey consists of a nationally representative sample of 7,600 households in Palestinian
territories. The survey collects detailed information on employment and socio-economic charac-
teristics of individual household members aged 15 years or more. We merged this dataset with
separate data on 10-14 years old children, provided by the Palestinian Central Bureau of Statis-
tics (PCBS). The present analysis is based on children between 10 and 14 years old for whom
full information on schooling, labour participation and a number of parents’ characteristics is8The correlation coefficients between the number of closure days and average wage, low skilled average wage
and unemployment rate in WB in the previous quarter are −0.24, −0.09 and −0.28, respectively: all coefficients
are not statistically significantly different from zero.9Detailed results are available from the Authors upon request.
10

Figure 1: Number of closure days (quarterly).
4060
Num
ber
of c
losu
re d
ays
020
Num
ber
of c
losu
re d
ays
200
0:4
200
1:1
200
1:2
200
1:3
200
1:4
200
2:1
200
2:2
200
2:3
200
2:4
200
3:1
200
3:2
200
3:3
200
3:4
200
4:1
200
4:2
200
4:3
200
4:4
200
5:1
200
5:2
200
5:3
200
5:4
200
6:1
200
6:2
200
6:3
200
6:4
Quarter
Note: effective closure days are comprehensive closures net of Saturdays, half the number of Fridays and Jewish
and Muslim holidays. Source: UNSCO and B’Tselem.
available.10 We consider only male children for analysis since observations for female working
children are very few. A child is considered working if he worked and was remunerated for at
least one hour during the reference week of the survey, or was working as an unpaid family mem-
ber. This is the definition of child labour adopted by the International Labour Organisation,
and often followed in child labour literature. We also restricted the analysis to West Bank since
the data on child labour in the Gaza Strip seems not reliable.11
4.1 Descriptives statistics
Tables 2 presents descriptive statistics of the sample of children between 10 and 14 years old in
West Bank (WB). The first column presents the characteristics of the total sample. The sec-
ond and third columns present the distribution of child, parental and household characteristics
for school participants and non-school participants respectively. The fourth and fifth columns10The Palestinian Labour Law, effective since mid-2000, prohibits the employment of children before they reach
the age of 15. The Chapter on Juvenile Labour in the Palestinian Labour Law defines boys between 15-18 years as
working juveniles and accordingly allows them to work but prohibits their employment in industries hazardous to
their safety or health, in night work, or on official holidays (Birzeit University Development Studies Programme
and UNICEF (2004)).11The data for GS in the LFS are quite different from the data in the 2004 Child Labour Survey conducted by
the PCBS (PCBS, 2004). The analysis of the child labour and schooling decision for Palestinian in the GS are
available upon request from the authors.
11

Figure 2: Number of closure days (quarterly) against closure days in the previous quarter
2000:Q4-2006:Q4.
4060
Num
ber
of C
losu
re d
ays
prev
ious
per
iod
020
Num
ber
of C
losu
re d
ays
prev
ious
per
iod
0 20 40 60Number of Closure days
Note: effective closure days are comprehensive closures net of Saturdays, half the number of Fridays and Jewish
and Muslim holidays. Source: UNSCO and B’Tselem.
present the characteristics for working children (child labour) and non-working children respec-
tively.
Our analysis is based on a sample of 17,248 observations. In the sample school participation
rate is 97.9% and child labour is 3%. The sample consists of 61.1% in 10-12 years group and
38.9% in 13-14 years group. School participation is higher among younger children and child
labour is higher among older children. Going down the list of characteristics we observe that
there is considerable variation in terms of parental characteristics. Father’s education is higher
for the children who attend school than for two other groups - non-school participants and child
labour. It is interesting to note that among the school participants unemployed father is more
prevalent than self-employed father. Also note that among the child labour percentage of children
with self employed father is higher than that with unemployed father. For mother’s education, it
appears that mother’s education is lower for child labour than for school participants. Employed
mother is notably higher among the child labour as compared to school participants. In terms
of break down of household characteristics for different children outcomes, number of adult
unemployed is less for child labour than for school participants.
The last group of descriptives gives the district and year level break down of the sample and
different children outcomes. The first column gives the percentage of children from different
districts. Three districts - Hebron, Ramallah and Nablus - represent around half of the sam-
12

Table 2: Sample descriptive statistics
Total Working Non-Working School Non School
Sample Participants Participants
All (%) 100 3.0 97.0 97.9 2.1
Child’s characteristics (%)
Age (%)
10-12 years 61.1 34.2 61.9 61.8 27.813-14 years 38.9 65.8 38.1 38.2 72.3
Father’s characteristics (%)
Education
No education 2.7 3.1 2.7 2.6 6.61 to 4 years 6.5 7.8 6.5 6.3 13.75 to 8 years 29.8 31.3 29.8 29.4 48.69 to 12 years 31.8 29.1 31.9 32.1 20.1More than 12 years 29.2 28.7 29.3 29.6 11.0
Employment status
Unemployed 19.3 10.5 19.6 19.0 32.1Self employed 14.6 27.4 14.2 14.5 19.0Wage earner 66.1 62.1 66.2 66.5 48.9
Mother’s characteristics (%)
Education
No education 8.2 13.4 8.0 7.9 20.11 to 4 years 8.8 10.5 8.7 8.6 16.85 to 8 years 31.8 35.9 31.7 31.7 35.79 to 12 years 36.8 32.0 36.9 37.1 22.5More than 12 years 14.4 8.2 14.6 14.7 5.0
Employment status
Unemployed 74.6 34.8 75.8 74.5 78.6Employed 25.4 65.2 24.2 25.5 21.4
Household’s characteristics
Number of children: 10-14 years 2.2 2.4 2.2 2.2 2.2Number of children: 15-17 years 0.8 0.9 0.8 0.8 1.0Number of unemployed adults 0.4 0.2 0.4 0.4 0.3Size 6.5 7.0 6.5 6.5 6.9
District (%)
Jenin 8.8 12.8 8.7 8.8 8.5Tubas 4.1 4.3 4.1 4.2 3.6Tulkarm 6.3 8.2 6.3 6.3 6Nablus 12.0 20.8 11.7 12 11.8Qalqilya 4.7 3.9 4.8 4.8 3.6Salfit 3.7 3.5 3.7 3.8 2.5Ramallah 14.3 8.7 14.5 14.2 17Jericho 4.5 1.0 4.6 4.5 5.2Jerusalem 4.1 0.0 4.2 4.2 2.8Bethlehem 10.4 1.9 10.7 10.4 9.6Hebron 27.0 35.0 26.7 26.9 29.4
Year (%)
2000a 4.0 4.7 3.9 3.9 6.62001 16.4 8.5 16.6 16.3 21.42002 11.9 2.5 12.2 11.9 11.82003 14.1 12.6 14.1 14.1 142004 14.7 7.4 15.0 14.8 12.42005 19.1 20.4 19.1 19.2 12.42006 19.9 43.9 19.2 19.9 21.4
Sample size (N) 17,248 515 16,733 16,884 364
Source: Authors’ elaboration based on data from PCBS.
Note: aData refers only to the 4th quarter
13
ple. The schooling in Ramallah appears more than the sample proportion, and child labour in
Nablus and Hebron appears less than sample proportion. The last block of numbers shows the
composition of the sample in terms of year of survey. It shows that considerable variation exists
in the pool in terms of year of survey and children outcomes.
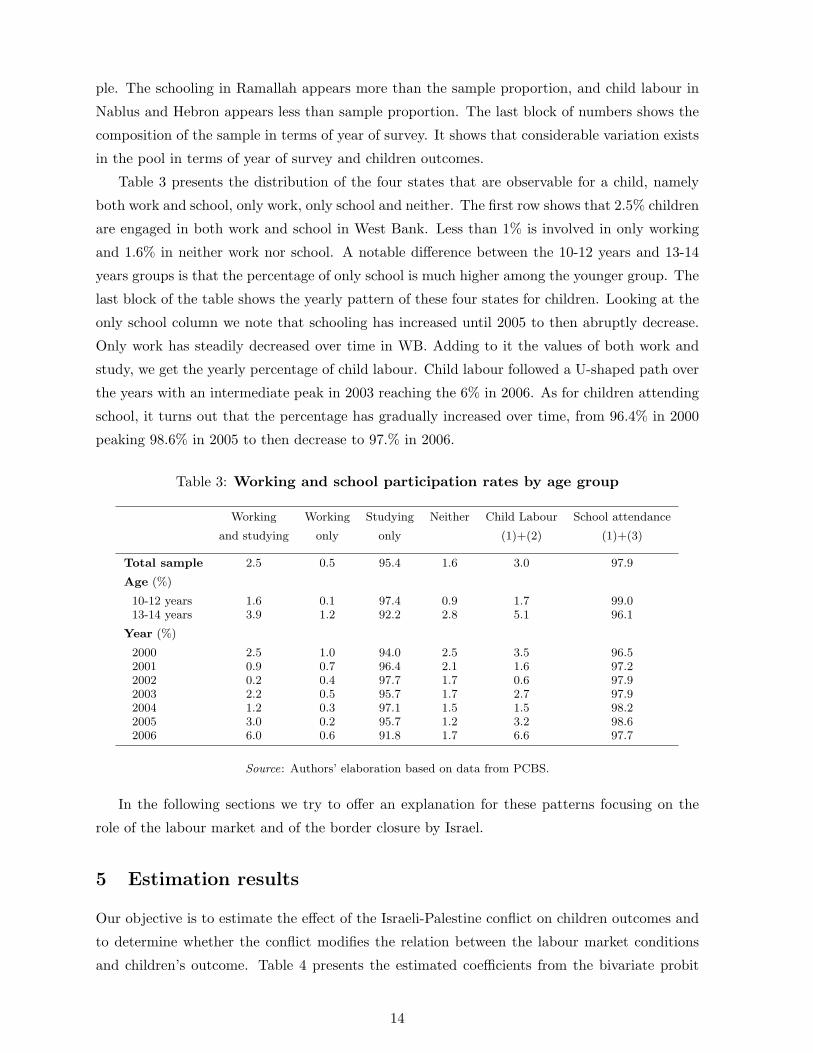
Table 3 presents the distribution of the four states that are observable for a child, namely
both work and school, only work, only school and neither. The first row shows that 2.5% children
are engaged in both work and school in West Bank. Less than 1% is involved in only working
and 1.6% in neither work nor school. A notable difference between the 10-12 years and 13-14
years groups is that the percentage of only school is much higher among the younger group. The
last block of the table shows the yearly pattern of these four states for children. Looking at the
only school column we note that schooling has increased until 2005 to then abruptly decrease.
Only work has steadily decreased over time in WB. Adding to it the values of both work and
study, we get the yearly percentage of child labour. Child labour followed a U-shaped path over
the years with an intermediate peak in 2003 reaching the 6% in 2006. As for children attending
school, it turns out that the percentage has gradually increased over time, from 96.4% in 2000
peaking 98.6% in 2005 to then decrease to 97.% in 2006.
Table 3: Working and school participation rates by age group
Working Working Studying Neither Child Labour School attendance
and studying only only (1)+(2) (1)+(3)
Total sample 2.5 0.5 95.4 1.6 3.0 97.9
Age (%)
10-12 years 1.6 0.1 97.4 0.9 1.7 99.013-14 years 3.9 1.2 92.2 2.8 5.1 96.1
Year (%)
2000 2.5 1.0 94.0 2.5 3.5 96.52001 0.9 0.7 96.4 2.1 1.6 97.22002 0.2 0.4 97.7 1.7 0.6 97.92003 2.2 0.5 95.7 1.7 2.7 97.92004 1.2 0.3 97.1 1.5 1.5 98.22005 3.0 0.2 95.7 1.2 3.2 98.62006 6.0 0.6 91.8 1.7 6.6 97.7
Source: Authors’ elaboration based on data from PCBS.
In the following sections we try to offer an explanation for these patterns focusing on the
role of the labour market and of the border closure by Israel.
5 Estimation results
Our objective is to estimate the effect of the Israeli-Palestine conflict on children outcomes and
to determine whether the conflict modifies the relation between the labour market conditions
and children’s outcome. Table 4 presents the estimated coefficients from the bivariate probit
14

model. The regressions pool together children across the period 2000:Q4-2006:Q4. All estimation
incorporates weights provided by the PCBS. The definition of variables is reported in Table 7
in the Appendix.
Regression (1) is the baseline specification. The error correlation between the child labour
and schooling attendance decision is −.485. The negative sign indicates that the unobservable
factors affect child labour and school attendance in opposite direction, i.e. there is a trade off
between the two outcomes. The relatively high value of the parameter indicates that in West
Bank child labour and schooling decisions are interdependent rather than being independent.
Estimation results in Table 4 show that the labour market situation (as proxied by the low-
skilled district level average market wage) strongly influences the probability of child labour.
The coefficient of the market wage is positive and very significant for all specifications: the
higher the market wage the higher child labour. This meas that in WB the substitution effect
prevails over the income effect. The coefficient of the market wage is instead not significant for
school attendance: this suggests that the latter decision is not influenced by the evolution of the
labour market and that other factors probably play a more important role in determining that
choice. Our estimation also indicates that child labour decision is influenced by the intensity of
the conflict as proxied by the number of closure days: an increase in the number of closure days
increases child labour. While the number of closure days has a direct effect on child labour, it
does not affect schooling attendance. Finally our results also indicate that the Israeli-Palestinian
conflict has an effect on the relationship that exists between the labour market condition and
child labour. The coefficient of the interaction between market wage and number of closure days
is negative and highly significant. We interpret this result as indicating that when the borders
are closed, i.e. when the intensity of the conflict is higher, a decrease in market wage tends
to increase child labour. This implies that the positive correlation between the opportunity
cost of not-working and the supply of child labour is much reduced when the conflict is more
severe. While the correlation between market wage and child labour may still be positive, this
result shows that the conflict has a strong impact on the child labour’s response to the labour
market conditions. As for the other control variables, results are as expected. Consistently
with previous studies (i.e. Desai and Jain, 1994), we find that mother’s education is associated
with a lower probability of child labour and a higher school attendance. The mother being
employed is positively associated with the probability of child labour12 while no correlation is
found with school attendance. As for household wage income13, we find that it is negatively
correlated with child labour. This is consistent with the luxury axiom (Basu and Van, 1998).12This result is consistent with Francavilla and Giannelli (2007) who found that mother’s labour market par-
ticipation is associated with child labour in India. Also Manacorda (2006) finds that child labour is positively
associated with the mother being employed.13We use a categorical variable defined as follows: low income is the upper bound of the 25th percentile, middle
income is between 25th and 75th percentile, high income is the lower bound of the 75th percentile of the full
sample. In section 5.2 we check our results with respect to alternative measurement of household well-being.
15

In addition, the coefficient of the interaction term indicates that the negative relation between
household income and child labour becomes weaker during closure days and it decreases more for
mid-income rather than for high income households. School attendance is positively correlated
with household income but the coefficients are smaller and less precisely estimated than for child
labour. Again the conflict results to impact more on the the middle-income households than on
the high-income ones: the interaction terms show that when closure is in place the probability
of school attendance decreases for the former but not for the latter.
Table 4 also report the regression results when we expand the set of control variables in
X in equation (2). In regression (2) we include a control for the father’s place of work: Israel,
another district in WB or the district of residence (reference category). We interact this variable
with the number of closure days to capture the possible changes in the effect of the father being
employed in Israel when the conflict is more severe. In regression (3) we also control for the
type of father’s employment (with father unemployed being the reference category). The type
of father’s employment turns out to be correlated with the probability of school attendance but
not with child labour. The father being employed increases the probability of school attendance
with the probability being highest if the father is employed in the public sector rather than in
the private sector or being self-employed. The interaction of the father’s type of employment
with the number of closure days is never significant. In regression (4) we include a number of
household characteristics: the number of siblings 10-14 and 15-17 years old in the household,
the ratio of female children in the household, the head of the family being a female, the number
of unemployed adults in the household and the household size. In regression (5) we consider the
household place of living, a refugee camp, a rural or an urban area. Finally in regression (6) we
also control for the characteristics of the labour demand at the district level. Since the informal
sector is the more likely candidate for employing children, we estimate the model controlling for
the share of informality and for the unemployment rate at the district level. While the latter is
never significant, the former is positively significantly correlated with child labor. Even if the
coefficient of the interaction term is small, it indicates that when closures are in place school
attendance is negatively correlated with the informality rate.
Predicted probabilities Tabel 5 presents the predicted probabilities from the estimates of
our baseline model. Each column reports the yearly percentage change in the dependent variable
following one standard deviation increase in the explanatory one. Our results indicates that a
one standard deviation increase in the average district market wage increases the probability of
child labour by 8% on average over the period 2000-2006. To compare our results to previous
ones, we also computed the effect of a 10% increase in the wage. In our model the latter would
increase child labour by 3.5%. Rosenzweig (1981), using aggregate data, finds that in rural India
a 10% increase in adult male wages reduces male children’ labour supply by 10%. In Duryea and
Arends-Kuenning (2003), the relationship between the market wage and child labour is positive
but smaller in our case: a 10% increase in the market wage increasing child labour probability by
16

Tab
le4:
Bip
robi
tre
gres
sion
resu
lts
vari
able
(1)
(2)
(3)
(4)
(5)
(6)
Child
Labour
School
Child
Labour
School
Child
Labour
School
Child
Labour
School
Child
Labour
School
Child
Labour
School
avera
ge
dis
tric
t(l
ow
skille
d)
mark
et
wage
0.6
1**
-0.2
40.6
2**
-0.2
20.6
3**
-0.2
40.6
4**
-0.2
50.6
3**
-0.2
60.7
5***
-0.1
3
no.c
losu
redays
0.0
7***
0.0
10.0
7***
0.0
10.0
7***
0.0
10.0
7***
0.0
10.0
7***
0.0
10.0
8***
0.0
2
no.c
losu
redays×
mark
et
wage
-0.0
1***
0.0
0-0
.02***
0.0
0-0
.02***
0.0
0-0
.02***
0.0
0-0
.02***
0.0
0-0
.02***
0.0
0
no.c
losu
redays×
dis
tance
0.0
0-0
.00***
0.0
0-0
.00***
0.0
0-0
.00***
0.0
0-0
.00***
0.0
0-0
.00***
0.0
0-0
.00***
age
0.2
4***
-0.2
0***
0.2
4***
-0.2
0***
0.2
4***
-0.2
0***
0.2
4***
-0.2
2***
0.2
4***
-0.2
2***
0.2
4***
-0.2
2***
fath
er
educati
on
0.0
10.0
4***
0.0
10.0
4***
0.0
10.0
3***
0.0
10.0
3***
0.0
10.0
3***
0.0
00.0
3***
moth
er
educati
on
-0.0
4***
0.0
4***
-0.0
4***
0.0
4***
-0.0
4***
0.0
4***
-0.0
5***
0.0
5***
-0.0
5***
0.0
5***
-0.0
5***
0.0
5***
moth
er
em
plo
yed
0.8
3***
0.0
00.8
3***
0.0
00.8
0***
0.0
00.8
0***
0.0
00.8
1***
-0.0
20.8
1***
-0.0
2
hh
incom
e(m
ediu
m)
-0.4
4***
0.2
9**
-0.4
5***
0.3
0**
-0.4
9***
0.2
9**
-0.5
2***
0.3
0**
-0.5
4***
0.2
7**
-0.5
2***
0.2
7**
hh
incom
e(h
igh)
-0.5
5***
0.2
3*
-0.6
0***
0.2
3-0
.64***
0.2
3-0
.60***
0.2
1-0
.63***
0.1
9-0
.60***
0.2
0
hh
incom
e(m
ediu
m)×
no.c
losu
redays
0.0
1**
-0.0
1*
0.0
1**
-0.0
1*
0.0
1**
-0.0
1*
0.0
1**
-0.0
1*
0.0
1***
-0.0
1*
0.0
1**
-0.0
1
hh
incom
e(h
igh)×
no.c
losu
redays
0.0
10.0
00.0
10.0
00.0
1*
0.0
00.0
1*
0.0
00.0
1*
0.0
00.0
1*
0.0
0
fath
er
work
soth
er
dis
tric
t0.4
1*
0.0
50.3
8*
0.0
40.3
60.0
50.3
80.0
20.3
5-0
.02
fath
er
work
sin
Isra
el
0.1
5-0
.01
0.3
00.0
10.2
50.0
90.2
60.0
80.2
50.0
7
fath
er
work
soth
er
dis
tric
t×no.c
losu
redays
-0.0
1-0
.01
0.0
0-0
.01
-0.0
1-0
.01
-0.0
1-0
.01
0.0
0-0
.01
fath
er
work
sin
Isra
el×
no.c
losu
redays
0.0
00.0
00.0
00.0
00.0
00.0
00.0
00.0
00.0
00.0
0
fath
er
self-e
mplo
yed
0.2
50.3
0*
0.1
20.3
7**
0.1
00.3
5**
0.1
70.3
8**
fath
er
public
secto
rem
plo
yed
0.3
8*
0.3
3**
0.2
00.4
6***
0.1
80.4
4***
0.2
10.4
6***
fath
er
pri
vate
secto
rem
plo
yed
0.0
60.1
9-0
.12
0.3
2**
-0.1
40.3
1**
-0.0
90.3
4**
fath
er
self-e
mplo
yed×
no.c
losu
redays
0.0
00.0
00.0
0-0
.01
0.0
0-0
.01
0.0
0-0
.01
fath
er
public
secto
r×no.c
losu
redays
0.0
00.0
00.0
00.0
00.0
00.0
00.0
00.0
0
fath
er
pri
vate
secto
r×no.c
losu
redays
0.0
00.0
00.0
00.0
00.0
00.0
00.0
00.0
0
fem
ale
house
hold
head
-5.5
8***
5.5
1***
-5.7
9***
5.4
8***
-5.5
6***
5.2
2***
hh
childre
ngender
rati
ora
tio
-0.0
40.0
0-0
.04
0.0
0-0
.03
-0.0
1
hh
no.c
hildre
n10-1
40.1
2***
-0.0
40.1
3***
-0.0
40.1
3***
-0.0
4
hh
no.c
hildre
n15-1
70.0
2-0
.01
0.0
2-0
.01
0.0
3-0
.01
hh
unem
plo
yed
adult
s-1
.98***
1.0
2***
-1.9
8***
1.0
0***
-1.9
4***
0.9
9***
hh
size
-0.0
20.0
4***
-0.0
20.0
4***
-0.0
20.0
4***
urb
an
0.2
7**
0.1
7**
0.2
7**
0.1
9**
rura
l0.1
70.2
4***
0.1
70.2
5***
dis
tric
tunem
plo
ym
ent
0.0
00.0
0
dis
tric
tunem
plo
ym
ent×
no.c
losu
redays
0.0
00.0
0
%dis
tric
tin
form
ality
0.0
2***
0.0
0
%dis
tric
tin
form
ality
×no.c
losu
redays
0.0
0-0
.00***
const
ant
-7.9
1***
4.8
1***
-8.0
2***
4.7
3***
-8.2
3***
4.6
6***
-8.2
5***
4.4
4***
-8.4
0***
4.3
2***
-9.1
7***
3.7
3***
hh
fixed
effect
YES
YES
YES
YES
YES
YES
dis
tric
tdum
mie
sY
ES
YES
YES
YES
YES
YES
quart
er
dum
mie
sY
ES
YES
YES
YES
YES
YES
#17,248
17,248
17,248
17,248
17,248
17,248
F−
test
0.0
00
0.0
00
0.0
00
0.0
00
0.0
00
0.0
00
ρ−
.489∗∗
−.4
89∗∗
−.4
98∗∗
.483∗∗
−.4
83∗∗
.486∗∗
Wald
test
Ch
i2(9
2)
=6884.7
3C
hi2
(100)
=7746.2
1W
Ch
i2(1
12)
=6762.8
8C
hi2
(124)
=16273.6
9C
hi2
(128)
=18018.2
6C
hi2
(136)
=22024.0
5
Note
:B
ivari
ate
pro
bit
model,
weig
hts
use
d.
See
equati
ons
2and
3.1
.∗∗∗,∗∗,∗
stand
for
signifi
cant
at
1%
,5%
and
10%
level,
resp
ecti
vely
.C
orr
ecti
on
for
err
or
corr
ela
tion
for
mark
et
wage
clu
ster
and
robust
standard
err
or
for
all
oth
er
vari
able
suse
d.
All
regre
ssio
ns
have
254
clu
ster
for
mark
et
wage.
Refe
rence
cate
gori
es:
aunem
plo
yed;
bem
plo
yed
inth
edis
tric
tofre
sidence;
cre
fugee
cam
p.
17

Table 5: Predicted probabilities (% changes)
Base Number Av. district Household Mother
Closure days market wage Income Education
Child labour2000 2.8% 61.3 -3.8 -14.0 -28.8
2001 1.3% 77.6 1.4 -15.2 -31.4
2002 0.6% 87.5 39.1 -33.2 -33.6
2003 2.8% 73.4 12.0 -20.2 -28.1
2004 1.6% 91.6 5.9 -20.8 -30.2
2005 3.4% 66.7 2.0 -15.4 -26.9
2006 6.8% 58.9 -2.0 -12.5 -24.0
Weighted Averagea 3.0% 73.8 7.3 -18.3 -28.6
School attendance2000 97.0% -0.5 -0.3 0.4 0.8
2001 97.6% -0.4 -0.3 0.3 0.7
2002 98.0% -0.2 -0.3 0.1 0.6
2003 98.0% -0.4 -0.3 0.2 0.6
2004 98.3% -0.4 -0.3 0.3 0.5
2005 98.6% -0.2 -0.2 0.2 0.4
2006 97.7% -0.4 -0.3 0.4 0.7
Weighted Averagea 97.9% -0.3 -0.3 0.3 0.6
Note: Each variables increased by one standard deviation. Weights are year percentage from Table 2: column 2 for school
attendance and 4 for child labour. aWeights are share of each year observation in the total sample.
0.7% with respect to their baseline. As for closures, results show that if the number of closures
days in a quarter increases by one standard deviation, the probability of child labour increases
by around 74%.14 This is quite a large effect.
5.1 Discussion of the results
Our analysis indicates that the probability of child labour in West Bank is related, in addition
to a number of other elements, to the characteristics of the local labour market. In particular,
the substitution effect prevails over the income effect: the lower the wage the less is child labour.
Moreover the intensity of the conflict, proxied by the number of closure days, affects the prob-
ability of child labour and the relationship between the labour market opportunities and child
outcome. The closure of the Israeli-Palestinian borders leads to more domestic unemployment,
lower wages and (on average) lower household income.15 Our results show that the closures also
increases the probability of child labour and that this effect is not restricted only to children
whose father is employed in Israel. This means that the effect of closure reverberates on chil-14Over the period 2000-2006 the average number of closure days in quarter is 33.4 with a standard deviation of
19.4. This implies that increasing by the 1% the number of closure days increases the probability of child labour
by 1.6%.15Miaari and Sauer (2006) estimates that doubling of the frequency of closures reduces the mean monthly
earnings of Palestinians from the West Bank by 2.5%.
18

dren’s time allocation decision through its effect on the whole West Bank economy. Interestingly
this result is in line with the model presented in Epstein and Kahana.16 Finally, our estimation
results show that during the conflict periods, the relationship between the labour market con-
ditions and child labour is modified with respect to normal days. During the closure days, the
lower the market wage the higher child labour, i.e. as the condition of the labour market worsen
child labour increases. This indicates that child labour is in part a response to the worsening of
the general economic condition as caused by closures.
Our results also highlight the existing differences between the determinants of child labour
and school attendance decision. It clearly emerges from our analysis that, although the two
decisions are correlated, there are probably different determinants at play. Indeed, school at-
tendance appears not to be related either to market wage or to the number of closure days. We
speculate that an analysis of the determinants of school attendance would probably require also
additional information on the quality of education, the accessibility or the cost of education,
etc. Unfortunately, all these demand for school attendance variables are at the moment not
available. The use of district dummies, while being only possible control, is admittedly not
sufficient to account for all that characteristics that may strongly influence school attendance
decision. Further analysis and data collection is needed on this important aspect.
5.2 Robustness checks and other model specifications
Table 6 reports the results from a set of robustness checks. Regression (a) checks our results with
respect to our measure of the opportunity cost of not working. We run the the full specification
(regression (6) in Table 6) where the opportunity cost of not-working is measured as the (log)
market wage of workers employed in the private sector with less than 5 years of education as in
Duryea and Arends-Kuenning (2003). In regression (b), we run the full specification excluding
from the sample households living in Jerusalem Est, given the peculiar status of Palestinians
living in that area rather than in other district in West Bank. In regression (c), we run the
full specification including also an individual fixed effect. To control for a long-run possible
effect of the number of closure days, in column (d) we run our preferred specification including
the number of closure days of previous period (one quarter lag). Regression (e) we estimated
the full model including a dummy variable for the summer period to control for a possible
cyclical component in the child labour supply related to the school holidays. The summer
variable turns out to be significant for child labour with all other variables maintaining their
sign and significance. Finally, in regression (f) and (g) we consider alternative controls for the
household income. In regression (f) we use the (log) household wage income net of child wage.
The household income variable has the expected sign but it is not significant while our main16 The model predicts that - in a Basu-Van setting, emigration of fathers may move the economy from a
equilibrium-with child labour with an equilibrium without it. Our results indicate that the Palstinin case would
be an example of a reverse situation: the return of fathers - caused by the closure - increases child labour in the
economy.
19

variables of interest maintain the same sign and significance as in the full specification. Finally
in regression (g) we estimated the model using a set of proxies for the household income: the
ratio of employed adults in the household, the ratio of household members employed in the
private sector, in the public sector and self employed. The reason for using these proxies is
that they give a measure of household well-being which does not require household members to
declare a wage - which in some case may be missing or inaccurately reported. Again the sign
and significance of the market wage, number of closure days and their interaction do not change.
To take into account the observation in Moulton (1990) about the effect on standard errors
of using aggregate variables in individual regression, we considered alternative ways of correcting
standard errors. While in our baseline estimation we clustered errors around the district market
wage, as checks we used robust standard errors without any clustering variable, and robust
standard errors clustered around district unemployment and household income. Our results do
not change.
We also considered alternative model specifications. First we run two separated probit
regressions - one for child labour and one for school attendance. While points estimates are
different from the ones obtained with our model - the probit model does account for the trade-
off with the other outcome for child decision - the sign and the significance of our two main
variables are consistent with the bi-probit model results. Results do not change also including
school attendance and child labour as control variable, respectively. Then we considered a
Seemingly Unrelated (SUR) version of our model and we also estimated a tobit model for the
hours of child work. In both cases the coefficients for the number of closure days and the
average market wage are precisely estimated and the sign remains the same as in the baseline
specification.17
6 Concluding remarks
In this paper we have analysied the determinants of child labour and school attendance for
Palestinian children in West Bank between the beginning of the Second Intifada and 2006. In
particular, we studied how the characteristics of the local labour market and the intensity of the
conflict are related to the children’ outcome.
We find that the conflict with Israel had a large impact on child labour. Our results show
that the increase in the number of closure days increases the probability of child labour and
that this effect is not limited to households whose members are employed in Israel. We also find
a highly significant positive correlation between the opportunity cost of not working and child
labour. This indicates that the job opportunities in the local labour market are an important
determinant of child labour in the region. While this is the normal relation between the labour
market situation and child choice, it changes during conflict period. When borders are closed,
the substitution effect is much weaker than when they are open. This meas that during the17Results are available upon request from the Authors.
20

Tab
le6:
Rob
ustn
ess
chec
ks:
Bip
robi
tre
gres
sion
resu
lts
(a)
(b)
(c)
(d)
(e)
(f)
(g)
Av.d
istr
ict
wage
Exclu
din
gIn
div
idual
No.c
losu
reSum
mera
House
hold
bEm
plo
ym
ent
18-3
5,
edu
<5years
)Jeru
sale
mEst
fixed
effect
days
lag
incom
era
tio
Vari
able
CL
SC
CL
SC
CL
School
CL
SC
CL
SC
CL
SC
Mark
et
wage
0.4
6**
0.0
60.7
1***
-0.1
70.7
3***
-0.2
40.7
2***
-0.2
40.6
9**
-0.2
50.6
7***
-0.2
50.6
6***
-0.2
3
no.c
losu
redays
0.0
5**
0.0
20.0
7***
0.0
20.0
7***
0.0
10.0
7***
0.0
10.0
8***
0.0
10.0
7***
0.0
10.0
7***
0.0
1
no.c
losu
redays×
Mark
et
wage
-0.0
1***
0.0
0-0
.02***
0.0
0-0
.02***
0.0
0-0
.02***
0.0
0-0
.02***
0.0
0-0
.02***
0.0
0-0
.02***
0.0
0
no.c
losu
redays
lag
0.0
00.0
0
Sum
mer
0.3
5***
0.0
3
House
hold
wage
incom
ec
-0.1
30.0
6
Em
plo
ym
ent
rati
od
-2.9
4***
0.3
8
Em
plo
ym
ent
rati
o(s
elf-e
mplo
yed)e
2.7
8***
-0.7
3
Em
plo
ym
ent
rati
o(p
ublic
secto
r)-0
.92
-2.0
8***
Em
plo
ym
ent
rati
o(p
rivate
secto
r)0.5
6-1
.02**
indiv
idualfixed
effect
NO
NO
NO
NO
YES
YES
NO
NO
NO
NO
NO
NO
NO
NO
#obse
rvati
on
14,8
17
16,5
38
17,2
48
17,2
48
17,2
48
17,2
48
17,2
48
F−
test
0.0
00
0.0
00
0.0
00
0.0
00
0.0
00
0.0
00
0.0
00
ρ-.504
-.487
-.486
-.485
-.468
-.489
-.517
clu
ste
rs
189
238
254
254
254
254
254
Wald
test
chi2
(134)=
60196.4
8chi2
(132)=
18140.2
7chi2
(136)=
21236.6
0chi2
(134)=
21303.1
4chi2
(102)=
15494.0
4chi2
(130)=
20871.1
5chi2
(138)=
40104.1
8
Note
:B
ivari
ate
pro
bit
model,
weig
hts
use
d.∗∗∗,∗∗,∗
stand
for
signifi
cant
at
1%
,5%
and
10%
level,
resp
ecti
vely
.A
llre
gre
ssio
ns
inclu
de
the
set
ofcontr
olvari
able
sas
insp
ecifi
cati
on
(6)
ofTable
4.
ain
stead
of
quart
er
dum
mie
syear
dum
mie
sare
use
d.
bth
ecate
gori
calvari
able
for
house
hold
incom
euse
din
specifi
cati
on
(6)
isexclu
ded.
clo
gof
the
house
hold
wage
incom
enet
of
child
wage.
dth
era
tio
betw
een
em
plo
yed
mem
bers
ofth
ehh
and
size
ofth
ehh.
eth
era
tio
betw
een
self
em
plo
yed
(em
plo
yed
inth
epublic,pri
vate
secto
r)m
em
bers
ofth
ehh
and
size
ofth
ehh,re
specti
vely
.C
orr
ecti
on
for
err
or
corr
ela
tion
for
mark
et
wage
clu
ster
and
robust
standard
err
or
for
all
oth
er
vari
able
suse
d.
21

conflict periods, the choice of working is more due to a worsening of the economic condition
rather than to the increase in the opportunity cost of not working. In a situation of conflict with
decreasing wages, closure tends to increase child labour in West Bank also through this channel.
References
[1] Al Kafri, S. (2003). Impact of Israeli measures on Palestinian child labor and schooling.
ERF Working Paper Series no.215
[2] Angrist, J.D. (1996). Short-Run Demand for Palestinian Labor. Journal of Labor Eco-
nomics, Vol.14 (3), 425-453
[3] Aranki, T.N. (2004). The Effect of Israeli Closure Policy on Wage Earnings in the West
Bank and Gaza Strip. Orebro University Working Paper Series no.4
[4] Barros, R., Mendonca, R. and Velazco, T. (1994). Is Poverty the Main Cause of Child
Work in Urban Brazil? Texto para Discussao no. 351. Rio de Janerio: Instituto de Pesquisa
Economica Aplicada.
[5] Basu, K. and Van, P.H. (1998). The Economics of Child Labor. American Economic Review,
vol.88, 412-427
[6] Birzeit University Development Studies Programme and UNICEF (2004). The Children of
Palestine in the Labour Market (A qualitative participatory study).
[7] B’Tselem (2007). Annual Report: Human Rights in the Occupied Territories.
[8] Desai, S. and Jain, D. (1994). Maternal employment and changes in family dynamics: the
social context of women’s work in rural India. Population and Development Review, Vol. 20
(1), 115-136.
[9] Duryea, S. and Arends-Kuenning, M. (2003). School Attendance, Child Labor and Local
Labor Market Fluctuations in Urban Brazil. World Development, vol.31(7), 1165-1178.
[10] Edmonds, E. and Turk, C. (2004). Child Labor in Transition in Vietnam, in P. Glewwe,
N. Agrawal and D. Dollar (eds.), Economic Growth, Poverty and Household Welfare in
Vietnam. Washington DC: World Bank, pp. 505- 550
[11] Edmonds, E., Pavnick, N. and Topalova, P. (2009). Child labor and schooling in a global-
izing world: Evidence from urban India, Journal of the European Economics Association -
Papers and Proceedings, Vol. 7, No. 2-3, Pages 498-507
[12] Edmonds, E. (2008). Child Labour, in Schultz, T. P. and Strauss, J. (eds.), Handbook of
Development Economics, Volume 4, Ch.57, pp 3607-3709
22

[13] Epstein, G.S. and Kahana, N. (2008). Child labor and temporary emigration. Economics
Letters, vol.99, pp.545 - 548
[14] Farsakh, L. (2002). Palestinian labor flows to the Israeli economy: A finished story? Journal
of Palestine Studies, Vol. 32 (1), 13-27
[15] Francavilla, F. and Giannelli, G.C. (2007). The relation between child labour and mother’s
work: the case of India. IZA Discussion Paper No. 3099
[16] Levison, D. (1991). Children’s Labor Force Activity and Schooling in Brazil. Unpublished
Dissertation. Ann Arbor, MI: University of Michigan.
[17] Levison, Deborah, K.S. Moe, and Knaul, F.M. (2001). Youth Education and Work in Mex-
ico. World Development, vol.29 (1), pp 167-188.
[18] Kadri, A. and Macmillen, M. (1998). The political economy of Israel’s demand for Pales-
tinian labour. Third World Quarterly, vol.19, 297-311
[19] Manacorda, M. (2006). Child Labor and the Labor Supply of Other Household Members:
Evidence from 1920 America. American Economic Review, vol.96(5), 1788-1801.
[20] Miaari, S. H. and Sauer, R. M. (2006). The Labor Market Costs of Conflict: Closures,
Foreign Workers, and Palestinian Employment and Earnings. IZA Discussion paper No.
2282.
[21] Moulton, B. R, 1990. An Illustration of a Pitfall in Estimating the Effects of Aggregate
Variables on Micro Unit. Review of Economics and Statistics, vol. 72(2), pages 334-338
[22] OCHA (2007). The Humanitarian Monitor. UN-Office for the Coordination of Humanitar-
ian Affair - Occupied Palestinian Territory, Jerusalem
[23] PCBS (2001). Impact of the Israeli Measures on the Palestinian Labour Market. Palestinian
Central Bureau of Statistics, Ramallah, Palestine
[24] Ray, R. (2000). Analysis of child labour in Peru and Pakistan: A comparative study. Journal
of Population Economics, vol.13, 3-19
[25] Ruppert Bulmer, E. (2003). The impact of Israeli border policy on the Palestinian labor
market. Economic Development and Cultural Change, vol.51 (3), 657-676
[26] Sayre, E. (2001). Labor demand and the wage gap in the West Bank and the Gaza Strip.
Contemporary Economic Policy, vol.19 (2), 231-224
[27] Shaban, R.A. (1993). Palestinian labour mobility. International Labour Review, vol.132
(5-6), 655-72.
23

[28] United Nations (2002). The Impact of Closure and Other Mobility Restrictions on Pales-
tinian Productive Activities. UN-Office of the United Nations Special Coordinator, New
York
[29] Wahba, J. (2006) The influence of market wages and parental history on child labour and
schooling in Egypt. Journal of Population Economics, vol.19, 823-852
[30] World Bank (2003). Two Years of Intifada, Closures and Palestinian Economic Crisis: An
Assessment. The World Bank, Washington
24

7 Appendix
Table 7: Variables definition
Variable Definition
Child labour = 1 if a child worked and was remunerated for at leastone hour during the reference week of the survey,or was working as unpaid family member; 0 otherwise.
School = 1 if a child is attending school; 0 otherwise.
Child’ characteristics
Age age of the child
Father’s characteristics
Education father’s years of education.
Self employed = 1 if father is self employed; 0 otherwise.
Public sector wage earner = 1 if father is wage earner in the public sector; 0 otherwise.
Private sector wage earner = 1 if father is wage earner in the private sector; 0 otherwise.
Employed in other WBGS district = 1 father is not employed in the district the household lives.
Employed in Israel = 1 if father is employed in Israel
Mother’s characteristics
Education mother’s years of education.
Employed = 1 if mother is employed; 0 otherwise.
Household’s characteristics
Female household head = 1 if head of the household is female; 0 otherwise.
No.children: 10-14 years number of children in the age group 10 - 14 years.
No.children: 15-17 years number of children in the age group 15 - 17 years.
Children gender ratio ratio between female children in the hh and the total number of children (< 17).
No.male unemployed in the hh number of unemployed male adults (18-64) in the household.
Size number of people living in the household.
Rural = 1 if the household lives in a rural area; 0 otherwise.
Urban = 1 if the household lives in an urban; 0 otherwise.
Household income household income net of children wages
District characteristics
Market wage log the district level average dailywage of male (18-35) with less than 7 years of education
Average unemployment average unemployment at the district level
Closure days number of days in which mobility between Israel andPalestinian Territories is prohibited also for workerswith permission to work in Israel
Distance distance of the district capital to the closest Israeli border (Km).
25