chikara hiramatsu *, patrick de deckker - anupeople.rses.anu.edu.au/dedeckker_p/pubs/40.pdfde...
TRANSCRIPT
E L S E V I E R Palaeogeography, Palaeoclimatology, Palaeoecology 131 (1997) 391 412
PAI 0
The late Quaternary calcareous nannoplankton assemblages from three cores from the Tasman Sea
Chikara Hiramatsu *, Patrick De Deckker Department o[ Geology (The Australian Marine Quaternary Program), The Australian National University, Canberra,
ACT 0200, Australia
Received 11 May 1995; accepted 15 January 1996
Abstract
The composition of the late Quaternary calcareous nannoplankton in three deep-sea cores RC12-113, Z-2108 and GC-3, located along a N S transect at three different latitudes (25 :, 33 °, 44'S) in the Tasman Sea, has been investigated. The shift in floral dominance from small Gephyrocapsa to small placoliths (labelled here "Small Placolith"), and then to Emiliania huxleyi is recognized at stage 5 and stage 4, respectively, in cores RC12-113 and Z-2108. However, the occurrence of small Gephyrocapsa and Small Placolith displays a seesaw relationship in core GC-3 which is located today just north of the Subtropical Convergence, east of Tasmania. Gephyrocapsa muellerae and Coccolithus pelagicus increase their abundance geographically southwards and stratigraphically during glacial periods, whereas the percentage abundances of Florisphaera proJimda and Umbilicosphaera sibogae demonstrate reverse patterns. The relationships between the percentage abundance of each nannoplankton species and the 61so record for three cores are discussed in detail.
A transfer function for estimating past sea-surface temperatures ( = T N ) is attempted here; it is based on core-top data from the Tasman Sea and provides a good relationship between some calcareous nannoplankton assemblages and modern mean summer sea-surface temperatures. The TN value shows a good correspondence with the 61so record in all three cores.
Core GC-3 is much affected by CaCO3 dissolution in comparison with cores RC12-113 and Z-2108. The calcareous nannoplankton dissolution patterns recognized in the three cores do not show a systematic correspondence with the 01so record. Of interest, however, is the good preservation peaks that are recognized in all three cores at the transitions from glacial to interglacial events. © 1997 Elsevier Science B.V.
Keywords. calcareous nannoplankton; palaeoceanography; Tasman Sea
1. Introduction
There are few studies on the late Q u a t e r n a r y p a l a e o c e a n o g r a p h y o f the oceans su r round ing Aus t r a l i a tha t are based on ca lcareous nan-
* Corresponding author. Present address: JAPEX Research Center, 1-2-1 Hamada, Mihama-ku, Chiba, 261 Japan.
0031-0182/97/$17.00 © 1997 Elsevier Science B.V. All rights reserved. PH S003 1-0182(97)00013-8
nop l ank ton . O f impor t a nc e is the work o f O k a d a and Wells (1994) who inves t iga ted several cores f rom offshore Western Aust ra l ia . Several o ther studies, nevertheless, have resulted f rom the D S D P Leg 90 on the Lo rd Howe Rise. These are the work o f L o h m a n (1986) who recons t ruc ted a Neogene and Q u a t e r n a r y b io s t r a t i g r aphy for the southern Cora l Sea, Tasman Sea and southwestern

392 C. Hiramatsu. P. De Deckker / Palueogeogral;hy. Palaeoclimalolog~, Palaeoecology 131 (1997)391 412
Pacific Ocean. The works of Nelson et al. (1985), and Dudley and Nelson ( 1988, 1989) followed on by presenting the first stable-isotopic studies of calcareous nannoplankton for the region, with emphasis paid on the c313C signatures in these nannofossils as an indicator of palaeoproductivity for the region. The present study provides new data on late Quaternary calcareous nannoplankton from 3 cores located along a N S transect in the southern Coral and Tasman Seas.
This project benefited from a recent study of the distribution of calcareous nannoplankton in sur- face sediment in the Tasman and Coral Seas (Hiramatsu and De Deckker, 1997-this issue). For that study, sediment recovered from inside fora- minifera tests was examined from 53 core-top samples widely spaced in the above-mentioned two seas. The relationship between the percentage abundance of each nannoplankton species and summer sea-surface temperature (SST), and the relationship between species composition and the position of oceanic fronts were discussed in detail (Hiramatsu and De Deckker, 1997-this issue). Nevertheless, encouraging results indicated that floral composition is considerably controlled by SST, suggesting the possibility of using calcareous nannoplankton for estimating of past SST for the Western Pacific.
In the present paper, data from Hiramatsu and De Deckker's (1997-this issue) 53 core tops are applied to the late Quaternary assemblages reco- vered from three cores studied here. Calcareous nannoplankton assemblages were sampled in detail in all three cores with the aim to reconstruct the palaeoceanographic history of the Tasman Sea, and to build up a stratigraphic framework for the late Quaternary of the region. Moreover, the rela- tionship between the percentage abundance of each species in 3 cores and the 6180 record is also investigated in an attempt to decipher any possible signals of climatic change through the intermediary of calcareous nannoplankton.
2. Materials and methods
Three cores, taken from the Tasman Sea, were used for this study. From north to south, these
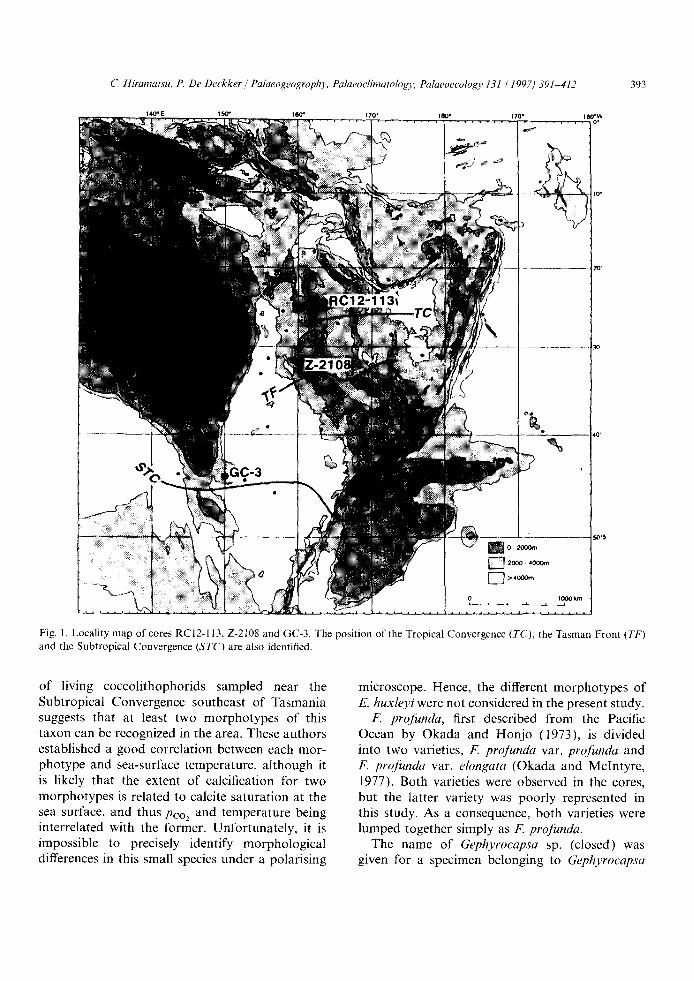
are: core RCI2-113 (lat. 24:53'S, long. 163 31'E, 2454-m water depth) from the northern portion of the Lord Howe Rise; core Z-2108 (lat. 33:23'S, long. 16137'E, 1448-m water depth) from the southern portion of the Lord Howe Rise; and core GC-3 (lat. 44 15'S, long. 149 59'E, at 2667-m water depth) was collected on the East Tasman Plateau (Fig. l ). These cores are located near the present position of the southern Tropical Convergence, the Tasman Front and the Subtropical Convergence, respectively (Fig. 1). Samples were examined at 10-cm intervals for the upper 2 m of core RCI2-113 and the entire of core Z-2108 which is 4 m long, and at 5-cm intervals for core GC-3 which is 4.7 m long.
Smear slides were prepared for microscopic observation by using unprocessed sediment samples from cores RC12-113 and GC-3. Smear slides were made from sediment preserved inside the globular foraminifera Orbulina universa reco- vered from core Z-2108. The similarity in floral compositions between the inside of a foraminifer and its surrounding matrix sediment was discussed in Hiramatsu and De Deckker ( 1997-this issue).
A stepwise counting method (Okada, 1992) was used throughout the study. More than 500 speci- mens first encountered for each sample were iden- tified (=Step 1). After the first counting, major species such as Emiliania huxleyi, Fh)risphaera pro- ./unda, all species grouped under the genus Gephyrocapsa and Small Placolith (<2.5 ram) [see taxonomic notes below] were eliminated from counting during the next procedure (=Step 2). More than 300 specimens, exclusive of those domi- nant taxa, were identified in the second counting. This provided a comprehensive list of the subdomi- nant taxa. All samples were observed under a polarising microscope at 1600 x magnification.
3. Taxonomic notes
E. huxleyi is a complex species characterized by several morphotypes. Genotypic variation of this species was studied in detail by Young and Westbroek (1991) on the basis of a biometric examination of numerous specimens. The recent, local study of Hiramatsu and De Deckker (1996)
C. Hiramatsu, P. De Deckker / Palaeogeography, Palaeoclimatology, Palaeoecology 131 (1997) 391 412 393
Fig. 1. Locality map of cores RC12-113, Z-2108 and GC-3. The position of the Tropical Convergence (TC), the Tasman Front (TF) and the Subtropical Convergence (STC) are also identified.
of living coccolithophorids sampled near the Subtropical Convergence southeast of Tasmania suggests that at least two morphotypes of this taxon can be recognized in the area. These authors established a good correlation between each mor- photype and sea-surface temperature, although it is likely that the extent of calcification for two morphotypes is related to calcite saturation at the sea surface, and thus Pco2 and temperature being interrelated with the former. Unfortunately, it is impossible to precisely identify morphological differences in this small species under a polarising
microscope. Hence, the different morphotypes of E. huxleyi were not considered in the present study.
F. proJimda, first described from the Pacific Ocean by Okada and Honjo (1973), is divided into two varieties, F. profunda var. profunda and F. proJunda vat. elongata (Okada and McIntyre, 1977). Both varieties were observed in the cores, but the latter variety was poorly represented in this study. As a consequence, both varieties were lumped together simply as F. profunda.
The name of Gephyrocapsa sp. (closed) was given for a specimen belonging to Gephyrocapsa

394 C. Hiramatsu, P. De Deckker Palaeogeography, Palaeoclimatology, Pahteoecology 131 (1997) 391- 412
with a closed central area. This phenomenon was similar for ReticuloJenestra petTlexa/productus when examined under the microscope. These taxa apparently have a convex central area, similar in structure to the distal shield of genus Gephyrocapsa when examined under SEM view (Plate I, A-C) . Gephyrocapsa sp. (closed) is considered to belong to G. caribbeanica which is heavily calcified and filled in central opening, because of the existence of transition form to both types and with similar stratigraphic occurrences in core GC-3.
The term "small Gephyroeapsa" was used for Gephyrocapsa specimens smaller than 2.5 gm in overall coccolith size (Plate I, D and E). Small Gephyrocapsa specimens principally belong to G. aperta and G. eriesonii.
"Small Placolith" was termed for placoliths smaller than 2.5 gm and without a central bridge. These specimens are thought to represent either "small Gephyroeapsa" species but which do not have central bridge, or small Reticulo[enestra species (Plate I, F - H ).
4. Calcareous nannoplankton assemblages from deep-sea cores from the Tasman Sea
4.1. Core RC12-113 (Table 1)
The isotope stratigraphy of this core, based on the /~180 of GIobigerinoides sacculiJ~,r, was taken from the work of Anderson et al. (1989) and the composition of planktonic foraminiferal assem- blages from Martinez (1994). An AMS14C date of 13,395 yr BP was determined for a sample taken at a depth of 25 cm in this core. The last glacial maximum ( L G M ) is recognized at a depth of 40 cm in this core (Anderson et al., 1989).
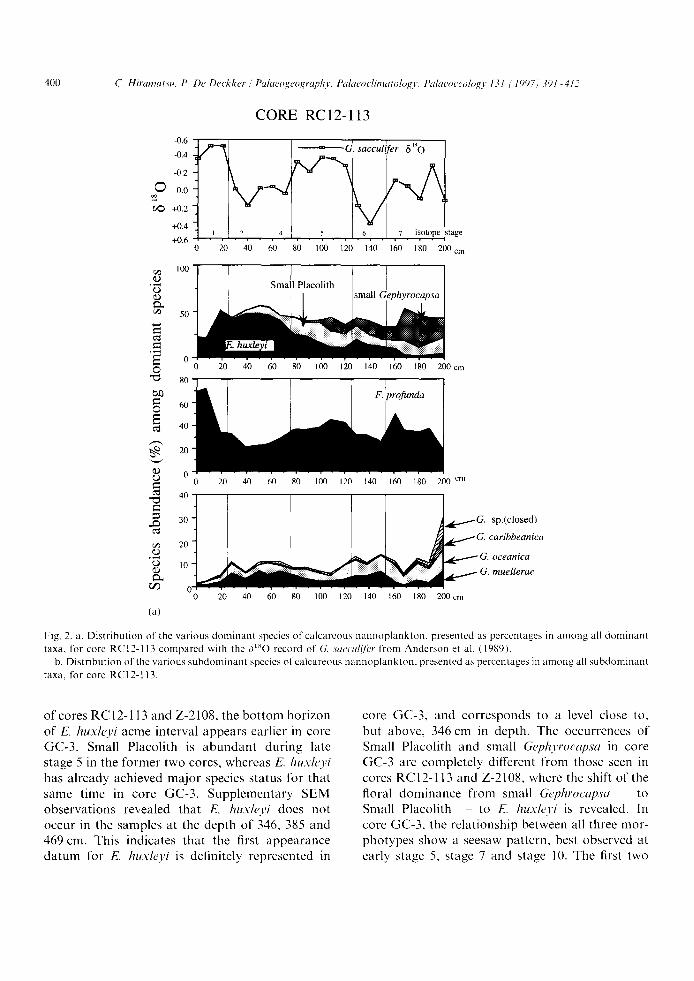
Figs. 2a and b displays the stratigraphic occur- rence of major species encountered in this core. Emiliania huxleyi increases in dominance up-core, and is particularly dominant during stages 4 2. This species again decreases at stage 1 in contrast to F. proJunda. The horizon characterized by domi- nant occurrence of E. huxh, yi (0 70 cm) is corre- lated to Gartner ' s E. huxleyi acme zone which spans the last 70 kyr BP (Gartner, 1977), whereas it spans the last 85 kyr BP in tropical and sub-
tropical waters and the last 73 kyr BP in transi- tional waters (Thierstein et al.~ 1977). E. huxh, yi shows a small abundance increase during stage 6. '°Small Placolith" is abundant through stages 7 to 5, and decreases in abundance during stages 4-2. It seems that E. huxleyi is the taxon that replaces '"Small Placolith", thus perhaps taking its ecologi- cal niche. Small Gephyroeapsa is abundant during stage 7, but then decreases progressively towards the top of the core. Small Gephyrocapsa is very rare in levels younger than stage 5. F. pro/unda is dominant during the Holocene, and relatively abundant during interglacial periods, whereas the percentage abundance of this species decreases during glacial periods. This stratigraphic change in abundance of F. proJunda is predicted from its geographic distribution of surface sediment samples (Hiramatsu and De Deckker, 1997-this issue) which identifies that this species is dominant in low latitudes and rare in high latitudes. G. muellerae, which is a high-latitude species in the Tasman Sea, increases its abundance during stages 6 and 4 2. G. oceanica does not show a systematic correspondence with the 61~O record, but appears to increase in number below the 100-cm level. Gephyroeapsa sp. (closed) and G. caribbeanica occur throughout the core, but in low number.
Among the subdominant species, middle to low latitudes species such as Neosphaera eoeeolithomor- pha, Oolithotus Jragilis, Rhabdosphaera clavigera and Umbilicosphaera sibogae are abundant in this core because it benefits from being in the most northern location of the three cores studied. Not surprisingly, Coccolithus pelagicus, which is abun- dant south of the Subtropical Convergence based on the study of Hiramatsu and De Deckker (1997-this issue), is extremely rare in core RC12-113.
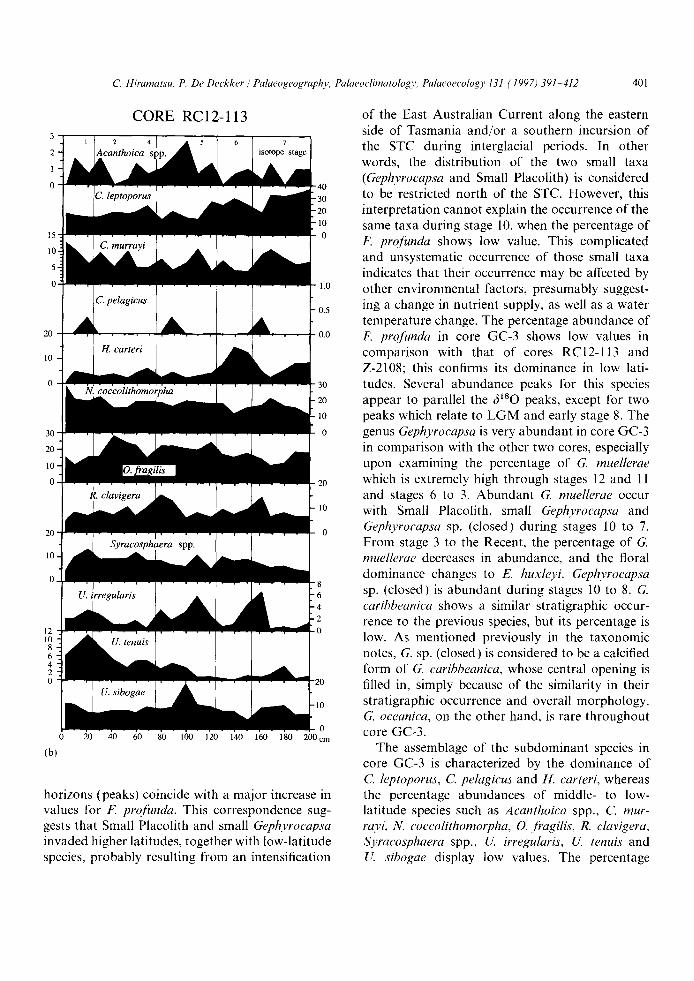
The percentage abundance of Acanthoica spp. increases during stage 5 and decreases for stages 6 and 4 2. Calcidiseus leptoporus is the major species among the subdominant species in this core, but less so in comparison with the other two cores; it is characteristically a high-latitude species as docu- mented through the study of modern samples of Hiramatsu and De Deckker ( 1997-this issue). The percentage abundance of C. h, ptoporus is high during stages 7 and 6, but shows significant reduc-
C Hiramatsu, P. De Deckker//Palaeogeography, Palaeoclimatology, Palaeoecology 131 (1997) 391-412 395
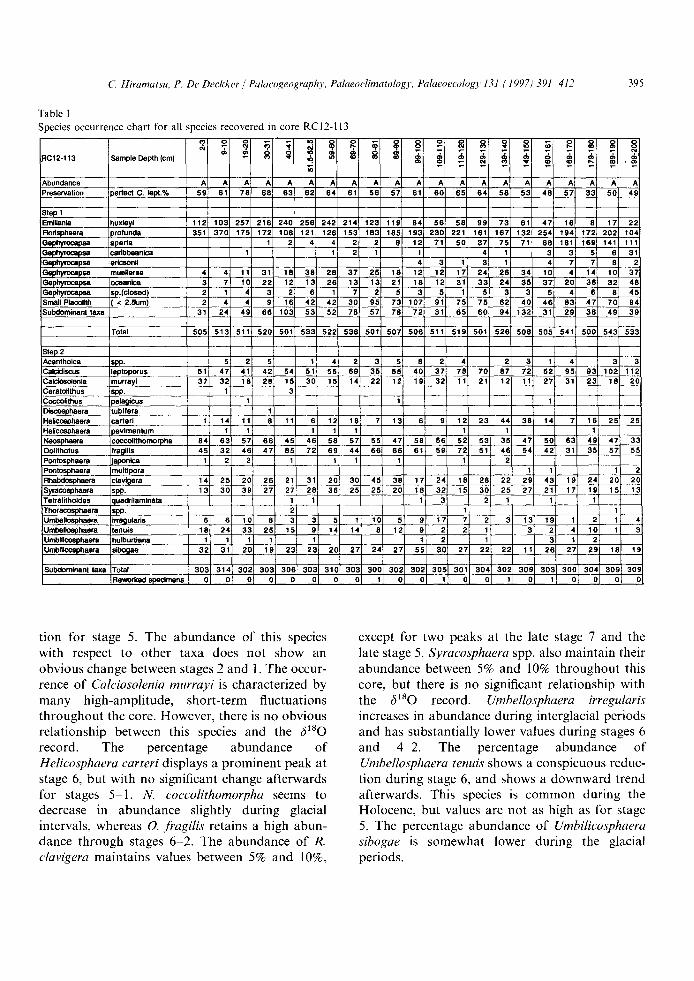
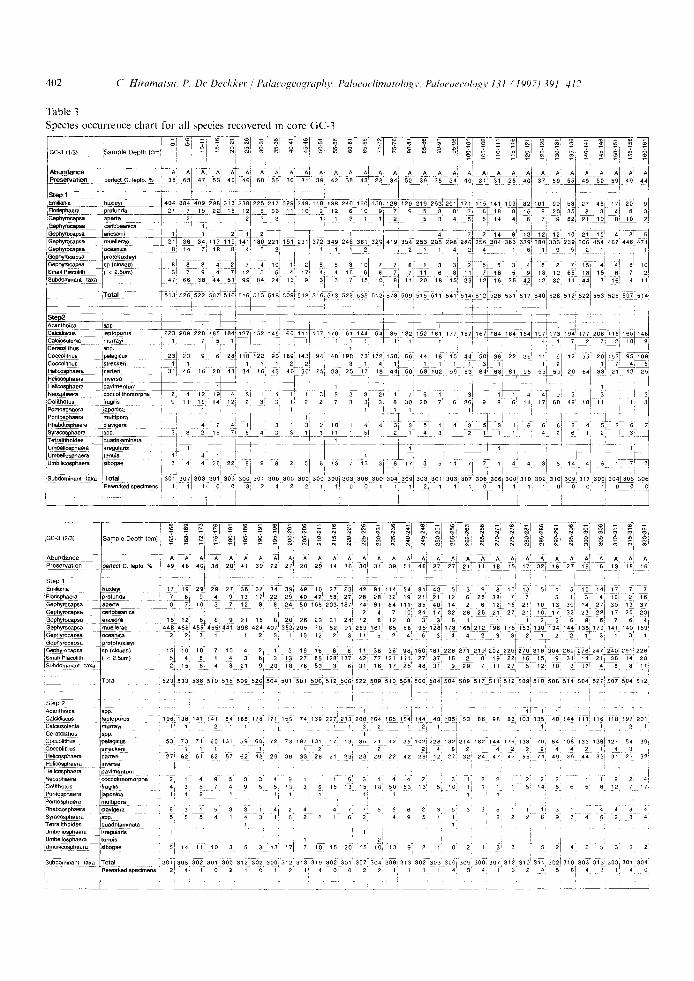
Table 1 Species occurrence chart for all species recovered in core RC12-113
:1C12-113 Sample Depth (cm)
Abundance !Preservation perfect C. lept.%
Step I Emiliania huxleyi Nodsphaera )rofunda ~-ephyrocapsa aperta 3aphyrocapsa cadbbeanica Qephyrocapsa edcsonii 3ephymcapsa muellerae Gephyrocapsa cceanica P-~ephyrocap~ sp.(closed) Small Placolith ( < 2.~Jm) Subdominant taxa
Total
Step 2 Acanthoica spp- CaloUiscus leptoporus Cak::tosolenla rnurrayi Ceratollthus lapp. Coccolithus Ioela~cus Discosphaera tubifera Heflcosphaera carted Helicosphaera ~)avimentum Neosphaera coccolithomorpha Oolithotus fragllis Pontasphaera japonica Pontosphaera multipora _ Rhabdosphaera clavi~lera Syracosphaera spP. Tetralithoides quadrilaminata Thoracosphaara spp. Umbellosphaera Irre~lularis Umbellosphaera enuls Umbificosphaera hulburtiana Umbillco~ohaera sibogae
Subdomlnanl taxa Total Reworked specimens
A A A A A A A A A A A A A A A A A A~ A ,4 A 59 61 78 68 63 62 64 61 58 57 61 60 65 64 58 53 48 57 33 50 49
112 103 257 216 240 256 242 214 123 119 84 56 58 99 73 61 47 16 8 171 22 351 37C 175 172 108 121 126 153 18~ 185 193 230 221 161 167 132 254 194 172 202 104
1 2 4 4 2 2 8 12 71 5(] 37 75 71 68 181 169 141 111 1 2 I 1 4 1 3 3 5 6 31
4 3 1 3 1 4 7 7 8 2 4 41 11 31 18 38 28 37 251 18 12 12 1"/ 24 26 34 1(] 4 14 10 37 3 7 10 22 12 13 26 13 13 21 18 12 31 33 24 35 3"/ 20 36 32 48 2 t 4 3 2 6 7 2 5 3 5 1 5 3 3 5 4 6 8 45 2 4 4 9 16 42 42 30 95 73 107 91 75 75 62 40 4t6 83 47 70 94
31 24 49 68 103 53 52 78 57 78 7~ 31 65 60 94 132 31 29 3(] 49 39
505 513 511 520 501 533 522 536 501 507 506 511 51~ 501 526 508 505 541 50(] 543 533
I
2 s ,I , 2 3 s 8 2 , 2 3 ,I , 3 3 51 47 41 42 54 51; 55 69 35 55 40 37 78 70 87 72 5a 95 931 102 112 37 32 18 28 15 30 15 14 22 12 19 32 11 21 12 11 27 31 23 18 2C
3 1 1
1 14 11 8 11 6 12 18 7 13 6 9 12 23 44 38 14 7 16 25 2E 1 1 1 1
84 63 57 66 45 46 58 57 55 47 58 5(] 52 53 35 4./ 50 63 49 47 3:: 45 32 4(] 47 85 72 69 44 66 6E 61 5~ 72 51 46 54 42 31 35 57 5,=
1 2 2 1 1 1 1 2
39 ~ 27 ~1 I 17
1 1 4 25 20 26 21 31 2(] 30 45 38 17 24 18 28 22 29 43 19 24 2(] 2( 13 30 27 2"/ 28 3(] 25 25 20 18 32 ~ 15 30 25 21 19 15 1,"
1 1 1 3! 2! 1 1 1 2 1 1
6 6 10 8 3 3 5 1 10 5 9 17 7 2 3 13 19 2 1; 18 24 33 25 15 9 14 14 8 12 9 2 2 3 2 4 10 1l
t 1 I I t 2 3 2 32 31 20 19 23 23 201 27 24 27 55 30 2? 22 22 11 26 27 29 18 1!
303 314 302 383 308 30~ 310 303 3081 302 302 -~05 301 304 302 309 3o3 300 3o~ 3o9 30, o o o o o o o o tl o (] ~ o o , o I o o o
tion for stage 5. The abundance of this species with respect to other taxa does not show an obvious change between stages 2 and 1. The occur- rence of Calciosolenia murrayi is characterized by many high-amplitude, short-term fluctuations throughout the core. However, there is no obvious relationship between this species and the 6180 record. The percentage abundance of Helicosphaera carteri displays a prominent peak at stage 6, but with no significant change afterwards for stages 5 1. N. coccolithomorpha seems to decrease in abundance slightly during glacial intervals, whereas O. fragilis retains a high abun- dance through stages 6-2. The abundance of R. clavigera maintains values between 5% and 10%,
except for two peaks at the late stage 7 and the late stage 5. Syracosphaera spp. also maintain their abundance between 5% and 10% throughout this core, but there is no significant relationship with the 6180 record. Umbellosphaera irregularis increases in abundance during interglacial periods and has substantially lower values during stages 6 and 4-2. The percentage abundance of Umbellosphaera tenuis shows a conspicuous reduc- tion during stage 6, and shows a downward trend afterwards. This species is common during the Holocene, but values are not as high as for stage 5. The percentage abundance of Umbilicosphaera sibogae is somewhat lower during the glacial periods.
396 C. Hiramatsu, P. De Deckker / Pala~Jogeography, Palaeoclimatology, Palaeoecology 131 (1997)391 412
P L A T E I

C. Hiramatsu. P. De Deckker / Palaeogeography, Palaeoclimatology, Palaeoecology 131 (1997)391 412 397
4.2. Core Z-2108 (Table 2)
Core Z-2108 is located today near the Tasman Front. The 6 '80 and c~13C of Globigerina bulloides and Uvigerina spp., measured by Nelson et al. ( ! 993), are used here to establish a chronology for this core. The aeolian quartz content of core Z-2108 was also studied by Thiede (1979).
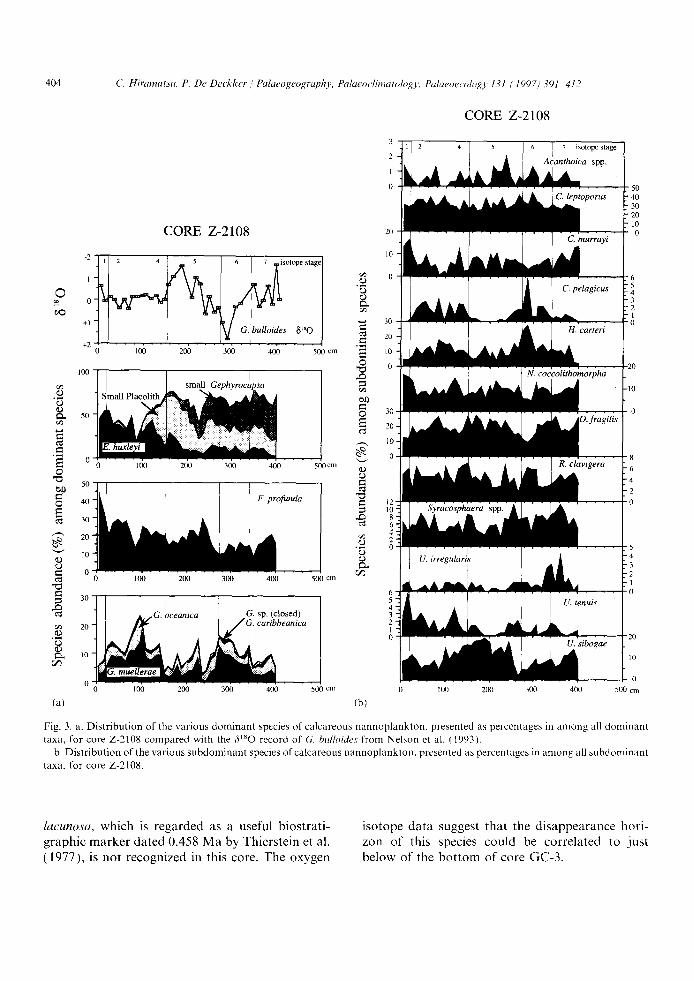
E. huxleyi shows an upward trend of increasing abundance, and predominates all other taxa for stages 4 to 1. This pattern is similar in core RC12-113 (Fig. 2a) and can thus be used as a means for stratigraphic correlation. Small Placolith is abundant during stages 7 to 4, and with particu- larly high values for the middle of stage 5 and the stage 4 transition. Small Placolith is rare in the younger levels. The shift in floral dominance from small Gephyrocapsa to Small Placolith, and then to E. huxleyi is recognized through the stage 5 4 transition in both cores RC12-113 and Z-2108. This stratigraphic/ecological succession of domi- nance among the phylogenetically related taxa of Erniliania huxleyi, Small Placolith and small Gephyrocapsa has already been discussed by Okada and Wells (1994) for offshore Western Australia in two deep-sea cores. These authors emphasized that this shift in floral dominance from small Gephyrocapsa to Small Placolith to E. huxleyi could become a new useful tool for identifying isotope stages 4 and 5. This biostratigraphic indica- tor is also useful for the middle latitudes in the Tasman Sea. However, as will be seen below, this phenomenon cannot be applied to core GC-3 located further south in the Tasman Sea. It is considered that the southern extent of this biostrat- igraphic phenomenon using the above-mentioned taxa occurs at the Subtropical Convergence. The percentage abundance of F. proJ~mda is high for
the Holocene and seems to be low during stage 6. This percentage, ranging from 10% to 30%, is relatively low in comparison with that in core RC12-113 where F. profunda ranges from 20% to 40%. This phenomenon is easily explained through the latitudinal distribution of F. profunda which is dominant today at low latitudes (Hiramatsu and De Deckker, 1997-this issue). The percentage abundance of G. muellerae is apparently higher during glacial periods, and decreases during inter- glacial periods, although percentage values are apparently high for stage 3. G. oceanica is ubiqui- tous throughout this core, and does not demon- strate a systematic correspondence with the 61sO record. Gephyrocapsa sp. (closed) and G. caribbe- anica are minor components in this core.
The occurrences of the subdominant taxa from core Z-2108 are described below (see Fig. 3b). The percentage abundance of Acanthoica spp. shows many short-term fluctuations, but there are appa- rently no relationship with the 6'sO record, although it is obvious that the stable-isotope curve is far from matching the standard one of SPECMAP (Martinson et al., 1987). The substan- tially high peak observed in the middle of stage 5 in core RC12-113 could probably correspond to a similar one in core Z-2108. C. leptoporus displays a fluctuating pattern in abundance, but with no obvious relationship with the /~lSO record; this pattern is as expected due to the now-known geographic distribution of this species within sur- face sediment samples (Hiramatsu and De Deckker, 1997-this issue). The percentage of C. leptoporus maintains high values (~30%) when compared to core RC12-113 since it is more common at higher latitudes today. The percentage abundance of C. murrayi also fluctuates through- out this core with no relation to the ()180 record.
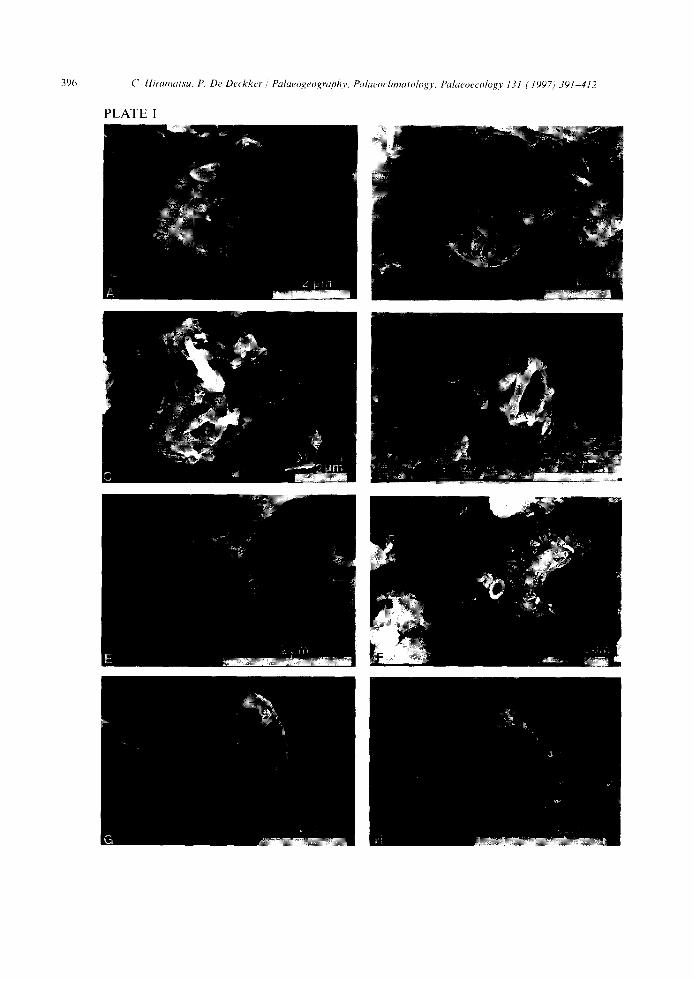
Plate I SCanning electron microscope photographs:
A. Gephyrocapsa sp. (closed) from core RC12-113 at 200-cm depth. B. Gephyrocapsa caribbeanica from core GC-3 at 346-cm depth. C. G. sp (closed) and G. caribbeanica from core RC12-113 at 200-cm depth. D. Small Gephyrocapsa from core GC-3 at 235-cm depth. E. Small Gephyrocapsa from core RC12-113 at 120-cm depth. F. Small Placolith (see arrow) on the distal shield of Coccolithus pelagicus from core GC-3 at 346-cm depth. G. Small Placolith from core GC-3 at 346-cm depth. H. Small Placolith from core RC 12-113 at 120-cm depth.

398 C. Hiramatsu, P. De Deckker / Pahteogeograpl y, Pahwoclimalology, Palaeoecology 131 (1997)391 412
Table 2
Species occurrence chart for all species recovered in core Z-2108
Z-2108 1/2 SarnNe Deothlcm~ ~ ~ m ~ ~ ~ ~ ¢~ o (~ 6 & - _o - ~ ~ ~ ~ g. _ _~ o o ,~
A ~ # , " A A' A A A- A I A' A i A ~ A - A A A A A A A A A/ A A A Abundance . . . . 76t 6 1 - - 6 1 - 46~ 54[ 58! 59 t o u 5 4 6 0 5 5 6 3 5 2 4 5 3 - -oed~ct C. lept.% 58! 5-£ 52 T 54- 66 P tion 63~ 46 ~ 5 8 4 4 ' 60 =:~ - -
. . . . . ~ L L Step 1 Erniliania t]uxleyl 2 2 7 2 6 8 ~ 281- 1 8 4 193~176- -151~216~ 89] 154~ 1 4 3 1 8 7 2 1 6 1 4 1 1271 6 5 1 4 6 F ~ 9 1 - 5 2 5 2 ~ 37T 46[ 37 Florisohaera profunda 2 1 6 ~ 1 6 2 ~ 1 0 3 1 3 5 1 4 7 1 3 4 1 4 1 99 63 9 3 1 2 6 ~ 119 9 9 1 1 2 j 1 0 6 1 9 9 i 68, 85J 76 98 87 116 t 1 3 94 Ge~hyrocapsa raperta " - 1 ~ 1 + g 6 g 5 g 2 3 ~-- - - 13 9 9 + 22 - 20 10 53 53 6 7 1 1 0 0 i 77 (3ephyrocapsa ~caribbeanica ~ 4 1 1 + 2, 3 + 2 = 1 3 3 1 T 2 2 3 3 G~hyrocapsa ;eric=on i ' 1" - - 1 ~ + } 51 7 7 ~ I 0 7 Gephyr~apsa ~ u e l l . . . . -- 14' 18~ 34 i 4 ~ 43~ 45~ 3 5 5 5 5 5 ' 6 9 8 9 4 3 3 8 4 4 4 9 1 4 _gj 12 v 3 0 1 9 t 1 7 - 1 9 2 1 4 3 ~yrocapsa +o¢eanica - 15 16 + 28. 18 7 1 ~ 7 ~ 1 2 191 351 43 i 181 13 i 12 i 12~ t l 3 1 7 - 7 ~ 151 1 4 1 20 1 4 : 2 0 2 8 Gephyrocapsa sp.(closed) 4 4 3+ 1 11 5 1 3+ 31 3 1 ] 2+ 3 2 1 2 3 1 31 3 1 Smal/F;I-acoith - - (<2 ,5urn ) - 2 3 4 8 18 ~ 13 ~ 12 2 0 4 10 60- 62 45 150 /178" 2 9 ~ 2 0 7 ~ 2 3 1 " 2 3 7 2 1 6 236 67 46 74
. . . . . ~ +" ~ ~ -- 651 381144 Su=+om,o=r,tt=== = , ~= 55 ,o~ .~ ,1, ,441 =~ ~+~ , ~ , +,,, ~ = 3 , ~ , 7 ~ q 30 , + 35 + ~ . , .
Wotal " 504- 5 0 8 5 2 3 5 0 3 1 0 4 5 0 2 5 0 5 5031103 m03 ! 506r 102 i 1051102 s t 6 - 5 0 4 - ~ 5 1 1 1 0 0 1 5 0 0 5 2 1 5 0 6 - 500 t 508 t +- + - - - + ' + + L + + I I
St/O/ Acanthoica {spp . " 4 ] 2 ~ 1 I 1 2 1 4 " ~ 1 31 " 2 3 1~ 1 4 3 3 Calcid , . . s ,.ptop . . . . 88 83 m000~ O6 I O ' / L . ~ 11,+! ++2 4 2 ~ I + +5 02' a3" + + , 0 3 42 92 09 + , 2 4 , 5 : +~ ++ +2 ,1m Calciosolenia rmurray 4 0 - - 4 9 - - 2 ~ 11 2 8 1 1 2 15 - 6 2 19 l a 36+ + 8 - 24 ~ 20 6 29+ 21+ 30 5 Ceratolthus spp, 1 1 1 + l Coccolithus p~petagcus - 2 - - 5 i 7 8 ~ 5 3 9 2 8- 2 7 7 2 1 1 Discosph . . . . ,ubif . . . . + ~ 9 ~ • i [ 1 ne+~osph . . . . 'cartefi 13 13j 19 36" 2 2 3 3 ~ 4 0 ' 2 0 ~ 52] 45 4 3 48 2 6 32 32 22 14 1 4 ~ 2 6 41 15 27 101 36 Helicos haera ' av+m ntum . . . . . ' sp p e l 1 1 6 4 2 1 1 = 2 1 1 1 1 1 1 2 Neosph . . . . . . . . . Ith . . . . pha 48 46 40~ 19 2 5 - - 2 6 1 9 3 1 1 2 1 = 28 20 3 5 44 3 4 9 22 25 23~ 3 2 t ~ 1 7 33' 25- 40 ~ 30 Oolithotus fragilis + 3{] ~ 34 57 43 5 2 - - 50 57 71+ 77~ 51 55 52 54 42 51 78-- 59 - - -81~ 68' 47 74 68' 6 9 52 Pontosphaera ]japonica ' ' " 3] 1 1 5 1 3 ~ ~ 2 1 ' " Pontosphaera spp. 1 2 1 1 Rhabdosphaea ]ciav~gera - - ~ 14 ~ 7 6 18~ 13 3 13 13 5 9 1 8 14 9 17 9~ 2 0 2 13 10- "6 I1 7 7 8 ~yraco~ph . . . . ~pp. 19" 12 171 16 t 26! 21 121 25t "11 1 1 ' ' 17 t 15 19 L 9 25~ 2 ~ 1 3 - 1 0 9 + 16 16; ' ' 5 retralithoides auadrilamlnata 1 1 2 1 _ 2
Jmbellosphaera irregulans 2 3+ 1 2 3 3 + 3 2 3 2 3[ 2 JmbellosDhaera lenuis B 17 6 6 9 6 2 E I 3 2 6 1 1 " 5 2 1 " 4 ~ 1 JmbJiico~haera Ihulburtiana 2 3 2 2 3 2 ~ 1 2 3 " "
rUmblicosphaera m b o g a e ~ 2 0 ~ 3 4 ~ 2 7 1 ~5 19 +9 26 13] 26 43 29 38 34 46 47 48" 53 53 59 51~ 32+ 39 44
Subdominant taxa +TotaIReworked soeamens 3003. 3040 3022. 3001330113300~07302a 3033 300130053 3002 3272 303. _ 300~330210130001 309i03043 300, 3130 3012 300113011 3010
The percentage shows the highest value during part of the Holocene in cores Z-2108 and RC12-113. The high value at the bottom of core Z-2108 corresponds to a more positive shift in 6110, which in fact could represent the end of stage 7. C. pelagicus apparently increases in abun- dance during glacial periods, and becomes extremely rare during interglacial periods. According to the investigations done on surface sediment samples (Hiramatsu and De Deckker, 1997-this issue), C pelagicus restrictedly occurs in samples taken south of the Tasman Front. Thus, the occurrence of C pelagicus in core Z-2108 located near the Tasman Front, indicates a more northward movement of the Front during glacial periods. This phenomenon was also recognised by Martinez (1994) for the same area through the investigation of planktonic foraminifera assem-
blages in several cores. H. carteri increases in abundance during stages 6 and 4 2, and decreases during stages 7, 5 and 1. It appears that the percentage abundances of this species show a reverse relationship with the (StsO record, despite no obvious relationship with SST in the modern surface sediment samples data of Hiramatsu and De Deckker (1997-this issue). A maximum value in abundance for this species during stage 6 follows the trend established in core RC12-113. The per- centage abundance of N. coccolithomorpha shows a good correspondence with the +5/80 record during stages 7 to late 5. especially with a remarkable reduction at stage 6. The abundance percentage of this species shows relatively low values when com- pared with core RC12-t 13. The percentage abun- dance of O. ji'agilis shows a similar pattern to the (5110 record. In particular, the substantial decline

C. Hiramatsu, P. De Deckker / Palaeogeography, Palaeoclimatology, Palaeoecology 131 (1997) 391-412 399
Abundance / A ~ A, A I A [ - - ~ - A ~ A AI .~ Pr~at ion ~pe~ff~totC. iept.% - 62- 7 ~ 5 6 60 57 52 ~ 52 ~ 65 + 541 46 + -52 ~ 52 ~ ~ - 4 6 4 7 i 52 ~ 45] 4E
Step 1 , ~ _ _ ~ _ Erniliania ~huxleyi ~ 26 ~ 74~-69j ~ ~ 6 9 ~ 3 - 5 ~ 6 2 ] 7 1 1 3 6 ~ 64~ 53 5 7 ] ~ 3 4 T ~ Ror~ . . . . ~rofunda 15~ 120 ~ ~ 4 7 50 771 69T 51" 81' 68~ 74~39~+ 74- 81~95] 1 0 ~ 1 Gephyro~psa -- ~aporta ---1"4<, 15 1 ] ~ 143 1 4 5 7 " ~ 2 7 ' 1,() 139--158:'175 146 1 8 5 1 6 i '78 l ,86L 182-V41 Geph~psa carribbeariica _ 2 1 2 ~ 2 5~ 4 2 L 3 5 3 L 2 2. L Gep~yr~,psa ericsonii 11 6' 4 12 13 1 4 15 14 r I 0 9 ~ 8 5 ~ 5 ~ 0 9 ~ 0 ~ 4 ~ 6/ G ephyrocapsa muellerae 4 2 ~ 23 6 3 491 4 9 4 4 . 40 3~33 3 9 . . 3 3 13. 1 3 1 ~ 16. 2 1 1 2 ] Gephyrocapsa oceanica 9 15~ 22 25 1 ~ 5 18~ 24 27 13 10 11 22 1 ~ 15 4 21 25 5] Gephyrocapsa sp_(closed) 2 ~ 7 " 1 ~ - 1 C 2 ~ 7 T ~ rr ~ L . 5~ 3 _ 5 4 SmallPlacolRh (<2.5urn) 120 176~156 118' 136 112~ 117 141 106 114~ 141 106 132 117 125 9 ~ 91~ I091 Subdominanttaxa 4~g 16 2 8 53~21- 4 1 62 52" 65 61 ~" 30- 60' 4 ~ - 2 3 ~ 4 4 , 50 3 7
Total 515 501 503 502 501 500 510 521 504 503 507 507 505 501 506 508 507 528
Step2 @ - - ' ~ 4 - - - ' 1" 3- - - ' ' 2" ~ '1 ~- Acanthoica ~ . 6 2 2 2 ! 2 ] 1 ' ~ 1 , 1 Calcidiscu~ , l e p t o p o ~ s ~ 7 3 82+ 9 ~ 2 ~ O 0 - 8 9 ~ 131- '96- 97! 79 ~ ~ 8 9 0 - - ~ 74 90 87~ 78- 76 Caciosolen-- Amurrayi " 23~-21- ~ ~ 13- iO: ~ 0 ' 2 4 8 [ ~ 2 ( ) [ ~ 2 3 20 39-- 40 Ceratolithus s p p . T . . . . . .
at stage 6 is well correlated, but the reverse occurs for stage 1. The percentage abundance of R. clavi- gera displays numerous fluctuations with no sys- tematic correspondence with the 51ao record. Percentage values are low in comparison with what is recorded in core RC12-113. Syracosphaera spp. are abundant during stages 7 and early 5, and decrease in abundance during stage 6. The percen- tage values maintain a zigzag pattern from stages 5 to 1, but there is no significant relationship with the (~180 record. The percentage abundance of U. irregularis peaks during stage 7, and shows very low value ( ~ 1%) during stages 6 to 1. On the other hand, U. tenuis is rare during stages 7 to 2, and shows high values during stage 1; this follows a similar trend found in core RC12-113. The abundance values of U. irregularis and U. tenuis in core Z-2108 are low when compared to core RC 12-113. The percentage abundance of U. sibo-
gae increases during interglacial periods and decreases during glacial periods; again, this follows the pattern recognized in core RC12-113.
4.3. Core GC-3 (Table 3)
Core GC-3 is located today near the Subtropical Convergence. The 6lso of planktonic foraminifera was measured and it is used for stratigraphic correlation. The oxygen isotope curve suggests that 4 glacial-interglacial cycles are represented in this core.
Figs. 4a and b documents the stratigraphic occurrence of dominant and subdominant species in core GC-3, respectively. E. huxleyi is abundant from middle stage 5 to stage 1, especially dominant during the Holocene. This increasing trend for E. huxleyi upcore near the top is common to all three cores studied. When compared to the occurrences
400 C H i r a m a t s u , P. D e D e c k k e r / Pa laeogeography . P a l a e o c l i m a t o l o g ', P a l a e o e c o l o g y 131 ( 1 9 9 7 ) 391 412
C O R E R C 1 2 - 1 1 3
-0.6
o 4
-0.2
0.0
+0,2
+0.4 1
+0.6 • ,
rJ'Z 100 ©
50
0 O 0
' ~ 80
6O O
~:~ 40
2o
0 0
40
30
20
~'~ 10 ~D
r.~ 0 0
(a)
~ - - G ' . saccull
2 '~. , . 5 .
2 o 4 o go so ioo 12o ~o
Fer 5 '80
, 7 . is, oto.pe stage
160 180 200 cm
20 40 60 80 100 120 140 160 180 200 cm
20 40 60 80 100 120 140 160 180 200 cm
20 40 60 80 100 120 140 160 180 200 cm
1)
ica
Fig, 2. a. Dis t r ibut ion of the var ious d o m i n a n t species of calcareous nannop lank ton , presented as percentages in a m o n g all dominan t
taxa, for core RCI2-113 c o m p a r e d with the 6 t s o record of (7,. saccul( l i ' r f rom Anderson et al. (1989).
b. Dis t r ibut ion of the var ious s u b d o m i n a n t species of ca lcareous n a n n o p l a n k t o n , presented as percentages in a m o n g all subdominan t
taxa, for core RC12-113.
of cores RC12-113 and Z-2108, the b o t t o m hor izon of E. huxleyi acme interval appea r s ear l ier in core GC-3. Small Placol i th is a b u n d a n t dur ing late stage 5 in the former two cores, whereas E. huxh,yi has a l ready achieved ma jo r species s tatus for that same t ime in core GC-3. Supp lemen ta ry SEM observa t ions revealed tha t E. huxh, yi does not occur in the samples at the depth o f 346, 385 and 469 cm. This indicates that the first appea rance d a t u m for E. huxlevi is definitely represented in
core GC-3, and cor responds to a level close to, but above, 346 cm in depth. The occurrences of Small Placoli th and small Gephyrocapsa in core GC-3 are comple te ly different from those seen in cores RC 12-113 and Z-2108, where the shift of the floral dominance from small Gephrocapsa to Small Placol i th - to E. hu'deyi is revealed. In core GC-3, the re la t ionship between all three mor- pho types show a seesaw pat tern , best observed at early stage 5, s tage 7 and stage 10. The first two
C. Hiramatsu, P. De Deckker / Palaeogeography, Palaeoclimatology, Palaeoecology 131 (1997)391-412 401
C O R E R C 1 2 - 1 1 3
0
(b)
20 40 60 80 1 DO 120 140 160 180 200 cm
horizons (peaks) coincide with a major increase in values for F. profunda. This correspondence sug- gests that Small Placolith and small Gephyrocapsa invaded higher latitudes, together with low-latitude species, probably resulting from an intensification
of the East Australian Current along the eastern side of Tasmania and/or a southern incursion of the STC during interglacial periods. In other words, the distribution of the two small taxa (Gephyrocapsa and Small Placolith) is considered to be restricted north of the STC. However, this interpretation cannot explain the occurrence of the same taxa during stage 10, when the percentage of F. profunda shows low value. This complicated and unsystematic occurrence of those small taxa indicates that their occurrence may be affected by other environmental factors, presumably suggest- ing a change in nutrient supply, as well as a water temperature change. The percentage abundance of F. profunda in core GC-3 shows low values in comparison with that of cores RC12-113 and Z-2108; this confirms its dominance in low lati- tudes. Several abundance peaks for this species appear to parallel the 6~80 peaks, except for two peaks which relate to LG M and early stage 8. The genus Gephyrocapsa is very abundant in core GC-3 in comparison with the other two cores, especially upon examining the percentage of G. muellerae which is extremely high through stages 12 and 11 and stages 6 to 3. Abundant G. muellerae occur with Small Placolith, small Gephyrocapsa and Gephyrocapsa sp. (closed) during stages 10 to 7. From stage 3 to the Recent, the percentage of G. muelh, rae decreases in abundance, and the floral dominance changes to E. huxleyi. Gephyrocapsa sp. (closed) is abundant during stages 10 to 8. G. caribbeanica shows a similar stratigraphic occur- rence to the previous species, but its percentage is low. As mentioned previously in the taxonomic notes, G. sp. (closed) is considered to be a calcified form of G. caribbeanica, whose central opening is filled in, simply because of the similarity in their stratigraphic occurrence and overall morphology. G. oceanica, on the other hand, is rare throughout core GC-3.
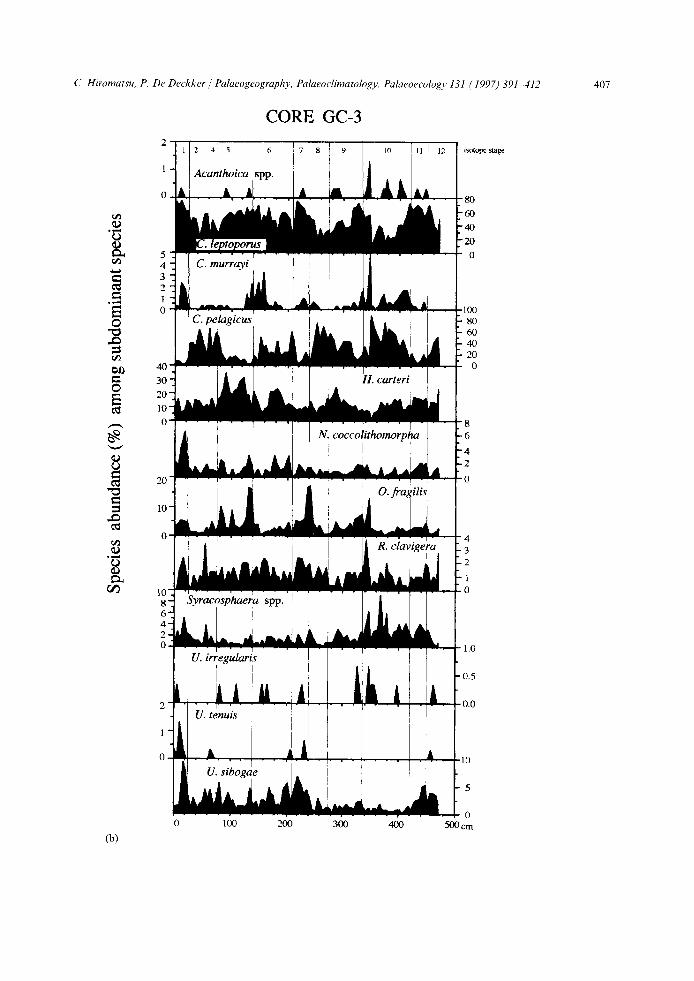
The assemblage of the subdominant species in core GC-3 is characterized by the dominance of C. leptoporus, C. pelagicus and H. carteri, whereas the percentage abundances of middle- to low- latitude species such as Acanthoica spp., C. mur- rayi, N. coccolithomorpha, O. fragilis, R. clavigera, Syracosphaera spp., U. irregularis, U. tenuis and U. sibogae display low values. The percentage
402 C'. Hiramatsu, P. De Deckker ," Palaeogeograplo,, Palctcoclimatolog|', Palaeoecology 131 (1997)391 412
Table 3 Species occurrence chart for all species recovered in core GC-3
A b u n d a n c e - - [ 3 8 " A 6~A A 53~ 4 A [ 0 A A A A / A A" A" A A A 4 ~ 3 2 9 A " A ~ A+ ~ A- A A A 311A A AIA A' A AA[ A]A A A ] AA A ~ e r v a t i o n - - p ~ f f e c t c . . . . . . . . . 47 . . . . 1 39+ 30 ~ 3 ~ 39 42 3 8 3+, 52- 3 0 35~ 34 40 3 , 26 ~+0~ 37 ~ 59 5 5 ~ 50 5 9 [ 4 9 ' 44
Geoh' . 'm~sa c~nbbeanica r - I 1" I t -- " ] t ? ' ~ " [ " q f f ' . ~ . . . . . .
G ~ h ~ s a -. ~ m ~ l . . . . ~ 2 2 1 ~ 38 34:117 115 141~180 2 2 1 1 1 5 ( 231[ 3 7 2 3 4 0 1 2 4 6 3 ~ I 39914191354-253-205"999 2 9 6 1 9 5 ( 3 0 4 393'3~333"239 3004~41407 44910711
Gep~ps, Iprotohuxleyi / t f T ' t - + ' ; j 1 G e p h ~ . Isp.(olose0)" ~I 8- 8 4 21 7 4+ 1oi 11 2 ~ 51 3 10 7 71 ~' I" 3 3 21 9 5 3 41 5 2 7 15, 4 4 6| 10 SmallPlacol~h ~('<'2.5um i L 31 7+ 9" 4+ 7 12 9j 5] 4- 17 4 4 I ~ 6[ 6- 7[ 7 ~ 11~ 6 81 1~ 7 - 1 6 9 9T 13 12" 95 18 ~ 19 6 ' 71 2 I Subdomin, n t t a x a 1 4 7 0 6 3 ~ 4 4 ~ 5 1 ' 90" 84 24r 13 0 3 3 7 15 I 0 - - 8] I [ 2 0 T 18 5 1 9 3 ~ ~ 'T19 3 5 4 2 1 2 32l 1 - 4 4 ~ 3] 01 4 '
I ~ ~ + m | I 1 ] I - ] r • I I ~ + ' ' [ T
Total [513 028~522 s071510351m 5 1 3 " 5 1 3 5 0 9 + , 5 1 8 5 1 0 + 3 1 3 5 2 2 5 5 5 5 1 2 " 5 7 8 : 5 0 9 5 5 ~ 5 5 4 ~5 Z 5 2 [ 5 2 8 5 3 ' 5 7 5 4 0 5 2 8 1 5 2 + 3 2 2 5 5 3 5 2 6 5 0 7 5 4 ' ? 1 ' ~ r + ! ' 1 • " . . . . t t -
t ~ T + ~ ~ . . . . T ~ . . . . . . ~ ~ . . . .
3eratolithus +pp
3occoli~hus [pelagicus 23 23 91 6 28 1 1 3 1 2 2 9 0 1B9 143 94 48 190 73 172 1501 66 44 13 T 43 44 50 39 22 36 11 6 12 59 20 1 5 ~ SoccolithuB Is recked " 1 " [ 1 2 2 [ r 3 1 4 1 1] 1 1 1 31 1 1 " 2 1 7 4 5- H e l c o s p h a e r a jcarleri j 3 1 L 4 6 16 2 0 ~ 34 16 43 40[ 3 0 25 33 25 47 18 4 4 ~ 5 0 6 8 ~ 1 0 2 59 ~ 53~ 64 ~ 68 81 95 551 55J 20 94 38 2 1 ~ - 2 5
, ~m u . . . . .
~e:cph°~ra-- 1':oaccol~tht:rnmorpha ~ 6: 4~ 1 2 - - I ~ 3 I] 4 " 1 1 1 3 1 5 ~ . . . . 1 6 1 1 3 1 i ~ I 4 4 - - 9 5 13 31 DO horus mg s • 9 5- 4- 2 2 3P 3" t + 2 9] 7" 3 + 3 3 8 30 20 7' 6 26 9 81 6 7 50 49 0 31 "ontesj~haera ~apo nica ' ] + 1 " [ ' 1 1 + ' I I I- I 11 t ' f ~ ~ l Pen os~haera m~u pora + + 1 " l ~ 1 ! ] [ ] , F] h~,i~phaera ~ e r a i 4' 7 4 + I 3' 3 9 10' I 4 4 3 + 3 5~ I 4' 3 5~ 3' 1 6 6 6 ! 2 + 4 S + 2T 6 7 + y + ~ e r a s p p 3: 8 ~ 2 ' 15 7 ~, 6t 4 3 3 11 1" 11 I 5 t " 2 + 1" 4 3 ' - 2 I 1 1 4 2 6 1 2" [ 3 3 | T~tralitl~oides q u a d r i l a ~ - - ' - ~ + - - - ~ + 1 . . . . | . . . . 1 + ~
Jmbilicosphaera Slbogae 3 4 4 2 B 2 2 8 2 8 2 5 61 13 7 13 3 8 " ~ 3 5 " " - 7 " 4 [ a 3 5 14 L a 6 1" - -
Subd . . . . . . . . . . Rewor~ea1"ota sDeQm~is 30130713031301+ 303-01 ) . . . . 3 0123 . . . . 4 20300130032, " . . . . . . . . . . . "J 0 0 1 ]304, 301 2 1 3031307~i . . . . . . 0 1 3 . . . . . . . . . . . " ' ' 0 3 . . . . . 0 0 3 0 0 i 3 0 4 3 ~ 1 O 03060
_
+. Jbund . . . . " - ~ I ~- Ar ~ " A A AI ~, AI ~ A I . . . . . ' A A- A ~ A " A~ A Ai J' A ~I . . . . . . I '
~ 0 , 0 ~ 0 0 "~ . . . . . . . . . . ~ 1 4 0 1 4 0 - 401 . . . . : . . . . I ~ 2 2~I ~ 0 2~ . . . . . . j ' . . . . . . . ; ~ 7 2~ 2 , , , _ , ~ . . . . . . . ,~, ,~ 32 ,+ ~ ,9, 0 , ~
S . . . . + - - " ,~ i 7 i " : ~++ ] T " - . . . . . .
Emili~la [huxley= + ~7- 9- 29' 29 27 3 6 37] 34~ 391 4 9 1 0 1 2 7 - - 2 3 4 2 ~ 1 " 4' 54 9 [ 4 3 - - 5] 3 9" 8 0 ! 13+ 5 1+ 5 10+ 4J 17~ 7- 7 ;Flodsphaera [profunda + 7 " 6 - g 4- 9 1 3 0 71 2 2 ~ 2 9 i 40 + 42 t 58 + 27! 28-- 28' 32 ~ 1 9 21[ 21 121 6 28 3 8 7 7 1 5 1 3 - 4 1 0 2- 16 ~ + + } ; , . . . - - + + ' ~ , 0 3+ . - ~ - + + 24+ ~- ,09~-+03,8,1 ,4' 81~ 84 . . . . . . o - . . . . . . ~ , + ~, , 0 ,3 ~0 ,4+ 2~ 1 30 ,3- 3,1 ~ a Icari~l~li3ica ~ ] . . . . . . . . . . 2 4' • 10' 2 4 17 + 32" 26 26 91 2 7 21' 1 0 17] 32 23 22 17" 2 0 23 [Gephytocapsa ~ % i 1 8 12' 8 6 ~ 9 2 1 15 81 29 261 23 3 1 24- 12 81 12 8' 3 + 3' 6 1 [ + 1' ' 1 + ~ 2 ~ 3 6 8~ 61 7 6" 4 I Gephyrocapsa m~uellerae '448~45814551459 i44 " 3 9 8 " 4 2 4 " 4 0 7 352 205 70 52 91"269" 61 + 85" 6 8 ~ 9 5 1 2 8 ~ 1 7 8 - 1 6 5 i 2 1 2 1961175+153 '130 134 '144 1381 79" 41+ 40 159 Gephyroca~- oceanma- ' 2 0 . . . . . . 2' 3 ++ ' 2 3 " 13 12 2 3 '~ 50 2" 4 T 6" 3' 4+ 4 ~ 2 3 3 i 2i 1- 2 2 1P 3 "+ 3 + Gephyrocapsa protohuxley
~ep[+yrccap . . . . . Idosedl 15~ 10 10 / 7 10 4 2 ' 5 15' 16 8 8 - 1 1 3 9 360 98 1 6 ~ 1 8 1 " 2 2 8 " 9 7 1 219~202 226~270 318F30 . . . . 2 7 6 r 2 4 7 0 2 4 0 2 9 1 ' 2 2 6 SLSLSLS~altPlacolith 25uml 5~ 4 6~ 1 4 3 9[ 3 13- -27- 85"1280137 42~ 7 7 ' 1 2 1 - 1 1 1 * 2 7 37 ~ 16' 2-- 8 ~ 9 - -22 ] 1 6 15" 90 31 ~ 14 ~ 21~ 38 ~ 14' 28 S u b d o ~ n l taxa 2 15" 8 4 8 21 0 20 1 3 ~ 7 6 93~ 3 = 6" 31 ~ 16" 17- 25 ~ 48+ 31 9+ 2 9 7 ~ 11 27' 5- 120 18 + 3+ 17- 4 + 6 ~ 8 11"
. . . . . . . . . . 7+_ r . . . . . .
Steo 2 . . . . . . . . . . r ' - t " - - + I r 1 I I + [
CalcidmcusAcanlh°lca leDIOPo~sSpp' - 196~138" 141+14~" 84+165"178+171"15 . ~" 73"139 227 '213+200 164 165-154 [144 48"105- -53+ 86 9 8 93 103 135 140 144 1111116 118 197"201 CalClO~olenla Ce ratal~thus sp[ Coccolithus pelaglcu$ 53 73 71 00 131 5 9 6 0 ~ 7 2 73 1 8 7 - 1 3 1 - - 1 7 1 3 35" 7 1 4 2 l 35~102 2 2 8 1 3 2 ~14+182"144+176 138' 70 84+108 133 136 127 54 39 i Coccolilhus streckeni 10 1 1+ ~ 1 " 1 2 ~ + 2 [ - - 2i 4 8 2" 1- 4" 2 2 21 4 4" 2" 1 4 3 ;
r HelicO~onaera carten 27" 62" 611 62 67 02" 480 291 36- 33 28" 2 1 2 3 2 3 " 29+ 22" 4 2 2 8 12- 27+ 32" 24 47" 43 56" 74 4 9 351 4 4 351 31~ 27 3 2 t~ellcoSpnaera nversa
H~elicos~aeae ra 3awmentuw Neosuh~era ;o~collthomoroha " 2- 1" 4 9 5 3 3 4+ 9 1 ' 1- 5 3 1 ' 4 4+ 2 3" 1 " 2 2 1 2 2' 2' 1 1 1 2 2 Oolithotus Ira~hs 4~ 3 5 - 4 9 5 ~ 13 3 S 15 13 1. = 18 50 53 13 5 0 1 " 5 14 8 6 5 8 12 17 Ponlosphaera )onlca _ . 4 2~ " . Pontospnaera mulupora Rhabdosohaera clavlgera 6 31 1= 5" 3 3 r ] 4 2 4 4 7 7 5 5 6 2 3 5 3 3 5 1 1 ] ' 4 { 3 4 Syracosprlaera spp. + 5- 5 5 4 + ~ ~ 3 " 6 2 ~ > ( 2 9 .' " " 2 2 2 6 ~ - _r ~_" 6" 2". } Tetra ~tnmaes qua0nlam,nala t LJm~l~osobaera rregulans " Umbel ~ e r a
LUmbilicosphaera [enuls 1 2 slbogae 5' 14 11[ 0 3 5 3j [ 3 171 7 10++ 5 20 IO 3 9- 2 1 8 2 3' 3 ~ b 2 4 ~ ~ 3 } 2 } + , I
3Ubd . . . . . 1 taxa Total 301 305 .302 :301L300 :312~302 :300 :3121313+319 :302+301 3 0 7 , 3 0 4 3 0 6 213 3 0 2 1 3 0 3 3 0 0 309: 300t 307: 312" 310r 311 3021310 303"313 303 3131 304 Rewo~ked spe~merls 2 4 1 0 2 + 0 2 + ~ 0 0 2 2 " " 4 3 4 3 2 4 5 6 ~ 2 " 4 0

C. Hiramatsu, P. De Deckker / Palaeogeography, Palaeoclimatology, Palaeoecology 131 (1997) 391 412 4 0 3
IGC-3 (3/3) Sample Depth (cm)
i _ IAbundanee JPreservation perfect C. lepto.%
)st~ i ,Em,~m - _ RorispCtaera profunda
Jii 3ephymcape~ sp,(ctosed) Small ~acohth ( < 2.5urn) Sul~lominanl taxa
t Total
S~pp2 Acanthoica spp. 'C~dcidiscus leptoporus Calcios01enia murra Cerato ~hus
+I ° " - ' . . . . . . . . . . + '
+'+++ + + +' ))1) ++ + ++ " ~. + ' + ,b + ~ <5 ,.,b 6 + m,
A' A AP
230 i 211:2051 tgo, 159 i23 + 160 179~fs9 51 631 72 561101 r" 5 5 " ~
1 3 : 1 9 12
122 178 210
t Oolitholus j Pomosphaera Pontosphaera Rhabdosphaera Syracosphaera Tetralilhoides UmbeMosphaera U m p e l l o s p h a e r a
: UmbiHcosphaera
Sub0ominant ta:
' + . . . . . ' " i ' 1 + - i + - - ~ + + + 1 ) i + . - ~ + - ~ ] t ~ - ~ ; i • t + - - - i
+. ?_~_ .+_ ,++ , !+ 'I t '+ + + " ++ , ++ , p + s+ ;
= 2 1, ~ c k ~ n , 2~ 2 i q 7~ t i I 2 , rted T i8~ 23 18+ 21+ 18; 5, 5' 16 i 2 1 ~ 3 3 t
o+,,.o.o..~++'v+°'+" ! + @ ~ } ~ ' ~ 1 T S sT " ~ ,+i :~,~,:~ar +" --+ dlipora : + , .gera ___ ~ : ~ [ 21 4! 3:
II 2= o= 1: 3 3t
i : i i °
I
1: 2ts; 187 los 2j~ T
5 2; 1 1
80" 29" 66i 1: 2 I
13 3 1 , + ~ 1 1
3O0302
abundance of C. leptoporus increases during inter- glacial periods, whereas that of C. pelagicus increases during glacial periods. The study of modern calcareous nannoplankton distribution in the Tasman Sea (Hiramatsu and De Deckker, 1997-this issue) showed that C. leptoporus and C. pelagicus are abundant at high latitudes. However, the percentages abundances of both species show a reverse relationship, thus implying that these taxa must either complement each other or com- pete for the same ecological niche. Nevertheless, it appears that C. pelagicus occurs in large numbers during the low TN values (viz. low temperature). The high values of C. leptoporus could indicate high-productivity events following the characteris- tics of this species given by Roth and Berger (1975, table 1). The percentage abundance of H. carteri does not show a systematic relationship with the 6~80 record. H. carteri is apparently
abundant during stage 5 in core GC-3 but, on the other hand, the percentage of this species shows low value at the same stage in cores RC12-113 and Z-2108. The percentage abundance of U. sibogae displays peaks during interglacial periods, but it is not obvious at stages 5 and 9.
The occurrences of biostratigraphic indicators throughout this core are reported below. Helicosphaera inversa is very rare, but constantly occurs during stage 10. This occurrence seems to be stratigraphically restricted. Takayama and Sato (1987) reported that the first and last occurrences of H. inversa are dated at 0.48 and 0.15 Ma, respectively, in the north Atlantic Ocean. Matsuoka and Okada (1989) reported that this species continuously occurs for the period ranging from 0.80 to 0.54 Ma in the northwestern Pacific Ocean. H. inversa was not found in cores RC12-113 and Z-2108. The last occurrence of Pseudoemiliania
404 C. Hiramatsu. P. De Deckker / Palaeogeography, Palaeoclimatologv Palaeoecology 131 (1997)391 412
CORE Z-2108
CORE Z-2108
- I - ©
O- ~XD
+ | -
+2
I0O
¢..;,
5o
..= E 0 O
5o ~O e- Q 40 fi e:I 30
~" 20
I0 ej
0
• 6 ~ s o t o p e stage
I JV G'lbull°ides ~I~O i
I00 200 300 400
1 ~ 2 ~ 3 ~ 4 ~
~funda
500 cm
500cm
0 I~ 2 ~ 3 ~ 4 ~ 5 ~ c m
= 3°jr I I ,.Q I P • .G. oceanica I G. sp. (closed)
I G. caribbeanica
I ~ I0
0 0 I00 200 300 400
(a)
L)
. .,,.,,
0
el)
0 E
eo
¢-.,
'B
20
0
30
20
10
0
30
20
10
I0
0
2
.... Ii 0
20
10
0 500 cm 0 100 200 300 40t] 5(10 cm
(b)
Fig. 3. a. D i s t r i b u t i o n o f the v a r i o u s d o m i n a n t species o f c a l c a r e o u s n a n n o p l a n k t o n , p r e s e n t e d as p e r c e n t a g e s in a m o n g all d o m i n a n t
t axa , f o r c o r e Z - 2 1 0 8 c o m p a r e d w i t h t he f i ' 8 0 r e c o r d o f G. bulloides f r o m N e l s o n et al. ( 1993 ) .
b. D i s t r i b u t i o n o f the v a r i o u s s u b d o m i n a n t species o f c a l c a r e o u s n a n n o p l a n k t o n , p r e s e n t e d as p e r c e n t a g e s in a m o n g all s u b d o m i n a n t
t axa , fo r c o r e Z-2108 .
lacunosa, which is regarded as a useful biostrati- graphic marker dated 0.458 Ma by Thierstein et al. (1977), is not recognized in this core. The oxygen
isotope data suggest that the disappearance hori- zon of this species could be correlated to just below of the bottom of core GC-3.

C. Hiramatsu, P. De Deckker / Palaeogeography, Palaeoclimatology, Palaeoecology 131 (1997)391-412 405
5. Estimates of palaeo-SST based on recent calcareous nannoplankton assemblages
The distribution of numerous calcareous nan- noplankton species recovered from core-top sedi- ments in the Tasman Sea is strongly controlled by SST (Hiramatsu and De Deckker, 1997-this issue). This suggests that an estimate of palaeo-SST using the nannofloral composition from core samples ought to be feasible. Following on from the study of calcareous nannoplankton from 53 core-top samples from the Tasman and Coral Seas, a ratio could be established to compare summer SST and a combination of subdominant taxa: W/(W+ C).
W representing the total percentage of species mainly distributed in middle to low latitudes (Acanthoica spp., C. murrayi, D. tubifera, N. coccol- ithomorpha, O. fragilis, R. clavigera, Syracosphaera spp., U. irregularis, U. tenuis and U. sibogae), and C representing the percentage of species domina- ting at high latitudes (C. leptoporus and C. pelag- icus). This ratio W/(W+ C) is plotted against SST in Fig. 5. Data of poorly preserved samples taken from deep-sea floor, and data of samples collected near the equatorial region, where C. leptoporus is regarded as low-latitude species, have been elimi- nated from this figure. As a consequence, only 43 data points were plotted in Fig. 5. The value of this ratio is well correlated with SST [correlation coefficient r2=0.905]. Thus, this ratio directly related to SST, has been applied to the core data to estimate palaeo-SST based on the change of W/(W+ C) ratio through time.
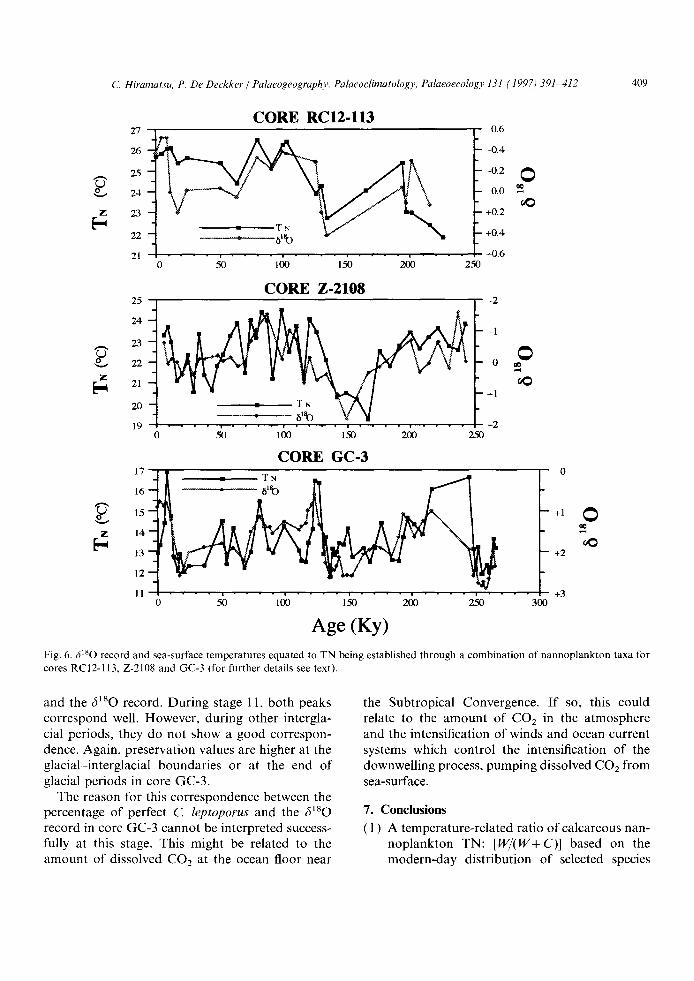
The estimated palaeo-SST tentatively, named as TN here, shows a good correspondence with the 3180 records in all three cores (Fig. 6). The TN curves obviously related to glacial-interglacial cycles.
The conventional method for the palaeotemper- ature estimation by using the ratio of warm and cold species is rather easy to carry out and can thus become a useful tool for rapidly determining climatic trends as reflected in cores. However, as discussed in detail by Yanagisawa (1993), this value is sensitive as a reliable thermometer only within a region of mixed water masses, whereas the palaeotemperature fluctuation signals are easily deformed in regions affected by a warm or cold
current. Moreover, it is obvious that the TN value used here is insensitive to SST below 12°C, due to the lack of recent core-top data (Hiramatsu and De Deckker, 1997-this issue) for nannoplankton living at temperatures below 12°C (Figs. 5 and 6). As a consequence, there became a need to develop here another method relying, in this case, on a statistical package in an attempt to estimate palaeo-SST.
According to Hiramatsu and De Deckker (1997-this issue), the percentage abundances of Emiliania huxleyi, Florisphaera profunda and Calcidiscus leptoporus are well correlated with SST in the Tasman Sea today. It is considered, there- fore, that these species ought to be useful indicators for palaeo-SST. Unfortunately, the abundance of E. huxleyi drastically changes near the stages 4 and 5 boundary, and abundance values are very low for levels below stage 4. Obviously, this trend does not represent a temperature change, but a phylogenetic change instead, as exemplified by E. huxleyi displaying a different pattern from the 6180 and TN curves. In other words, the relation- ship between the percentage of E. huxleyi and SST after the stages 4 and 5 boundary differs from before and, therefore, the modern relationship between the percentage abundance of E. huxleyi and SST cannot be applied to those strata older than the E. huxleyi acme Zone (Gartner, 1977) for estimating past SST. The occurrence of F. profunda in deep-sea cores, and which is occurs in the lower photic zone (Okada and Honjo, 1973), again is not directly related to SST. However, there is the apparent broad relation that is recognized between the low percentage values of F. profunda and the dissolution index using C. leptoporus. The pattern or movement of the Turbulent Boundary Layer in the upper ocean that affects F. profunda, following Molfino and McIntyre's (1990a,b) observations for the tropical Atlantic Ocean, is not clear in the case of core GC-3 because other factors, apart from temperature, must control the abundance of F. profunda. According to the distribution of C. leptoporus in surface sediments in the Tasman Sea (Hiramatsu and De Deckker, 1997-this issue), the percentage abundance of this species increases towards high latitudes, but high values are also shown in the equatorial region. This result suggests

406 C. Hiramatsu, P. De Deckker Palaeogeography, Palaeoclimatology, Palaeoecology 131 (1997) 391 412
CORE GC-3
c D ° ~
¢/1
° . . i
E 0
O
cD
Ca Ca
0 2 4 5
+1
7 8 9 ! 10
+3 • I I ,
+41 l . . o lOO 200 300 400
1 0 0 I J I ~ , I i ' , (
[ ] i i small Gephyrocapsa [ J ' ! 'i b L , Sma,, '.ooli ! I
o
20
1o
500 cm
100 200 300 400 500 cm
i s o t o p e s t age
t 4
F. profunda
o 0
100
50'
0 ¸ o
(a)
100 200 300 400 500 cm
100 200 300 400 500 cm
Fig. 4. a. Distribution of the various dominant calcareous nannoplankton species, presented as percentages in among all dominant taxa, for core GC-3 compared with the 6180 record of G. bulloides (for further details see text).
b. Distribution of the various subdominant calcareous nannoplankton species, presented as percentages in among all subdominant taxa, for core GC-3.
a g a i n t h a t t h e p e r c e n t a g e a b u n d a n c e o f C. lepto- porus is n o t o n l y a f fec ted b y SST, b u t ve ry l ike ly
b y a n o t h e r f a c t o r s u c h as t h e a v a i l a b i l i t y o f n u t r i -
en t s as w a s i den t i f i ed a l r e a d y b y R o t h a n d B e r g e r
( 1 9 7 5 ) . A d d i t i o n a l i n f o r m a t i o n is p r o v i d e d in
H i r a m a t s u a n d D e D e c k k e r ( 1 9 9 7 - t h i s i ssue) .
To s u m u p t he a b o v e , it is d i f f icul t to p o s t u l a t e
a p a l a e o - S S T w i t h g r e a t p r e c i s i o n a n d c o n f i d e n c e ,
b y s i m p l y u s i n g t he r e l a t i o n s h i p b e t w e e n the per -
c e n t a g e a b u n d a n c e o f a s ingle species a n d SST,
e spec ia l ly b y l o o k i n g a t F. pro[unda, C. leptoporus a n d E, huxh, yi, e i t h e r t o g e t h e r o r s e p a r a t e l y . T h e
C. Hiramatsu, P. De Deckker / Palaeogeography, Palaeoclimatology, Palaeoecology 131 (1997)391-412 407
CORE GC-3
o ~
K
° 1,,,~
E 0
0 E
r ~ cD
°~ , ,~
0
O~
(b)
~ ~ ~ 1 ~ U. sibogae ~ i [ . . . . . . .
1 oo 200 300 400
. A . 10
,11_ 5 o
500 cm

408 C. Hiramatsu, P. De Deckker / Palaeogeography, Palaeoclimatology, Palaeoecolog? 131 (1997) 391 412
30
25 y= l l . 443+17 .501x R"2= i 0.905 _ ~ . - ~
/ - i :oO r.~ 20
r~ 15 []
10 , , , , 0.0 0.2 0.4 0.6 0.8 1.0
W / W + C
Fig. 5. Relationship between W/(W+ C) and sea-surface tem- perature, where W represents the percentage of species princi- pally distributed in middle to low latitudes, and C represents those species dominating at high latitudes,
next approach, viz. to use a transfer function was also tried through reference of the assemblages data, and through a combination of selected species which are relatively well correlated with SST; all these species are recovered from the core- top sediments samples studied by Hiramatsu and De Deckker (1997-this issue). Two data sets involving all species including the dominant species, as well as subdominant species in the first instance, and only through use of a combination of F. proJhnda and G. muellerae, and combination of C leptoporus, N. coccolithomorpha, O. J?agilis and U. sibogae, (for all 3 cores) and C pelagicus (for core GC-3) were treated with the Principal Coordinate Analysis Statistical Package GENSTAT 5 in an at tempt to develop a transfer function [for further discussion refer to Hiramatsu and De Deckker (1997-this issue)]. Unfortunately, in all cases, no obvious correlation could be made between scores of recent data and those of core data, implying that additional environmental information (e.g., perhaps nutrients, dissolved oxygen) is required for the modern data set before coming up with a useful transfer function.
6. C a C O 3 d i s s o l u t i o n p a t t e r n s
Although the dissolution of coccoliths had been investigated quite extensively through the works of Honjo (1975) and Roth and Berger (1975), it is the method of Matsuoka (1990) which provided a means of evaluating the degree of CaCO3 dissolu- tion. Matsuoka 's (1990) method involves measur- ing the ratio of the perfectly preserved to the broken/part ly dissolved coccoliths of Calcidiscus h, ptoporus. This method is applied herewith to the three cores to investigate the change in degree of dissolution through time, and determine the rela- tionship between the dissolution curves and the 6180 record in the three cores. Up to 100 specimens of C. leptoporus were counted for each sample under a microscope at 1600 × magnification. The well-preserved specimens are called herein "perfect C. h'ptoporus".
The percentage of perfect C. leptoporus is com- pared against the 6~80 value for three cores in Fig. 7. The percentage of perfect C leptoporus in core RC12-113 maintains a high value, mostly within the range of 50 70% except for one low value during stage 7. This percentage does not show a systematic relationship with the ~gsO value in core RC12-113. The percentage values of perfect C. leptoporus in core Z-2108 are also fairly high (mostly 45 65%) and show many short-term fluc- tuations. Again, the percentage values do not show a systematic relationship with the ~gso value. As mentioned earlier, only a small amount of sediment preserved inside the Orbulina universa foraminifers was used for the nannoplankton study only for each level in core Z-2108. This procedure appears not to affect the estimates of C. h'ptoporus preser- vation since there is no significant difference in the degree of preservation/dissolution between the two cores RC12-113 and Z-2108. Of interest, however, are the apparent high values of perfect C. lepto- porus in the vicinity of the stages 5e 6 boundary in both cores. This phenomenon is repeated at the stages 1 2 transition. Nannoplankton specimens in core GC-3 are much more affected by dissolu- tion in comparison with the other two cores. The percentage of perfect C. leptoporus ranges from 10% to 60%, but is usually less than 50%. There are intricate relationships between this percentage
C. Hiramatsu, P. De Deckker / Palaeogeograph)', Palaeoclimatology, Palaeoecology 131 (1997) 391-412 409
C O R E R C 1 2 - 1 1 3 27 -0.6
26 -0.4
25 -0.2
2 4 - -- 0.0
7 23 +0.2 [ ~ -
2 2 . . . . . ~ . . . . 81~O +0.4
21 . . . . , . . . . . . . . . . . . . . , . . . . +0.6 0 50 1(30 150 200 2:50
C O R E Z - 2 1 0 8 25 -2
24 " _ I | ~ ~ . R. ~w "
23 .
2 2 - o z 21 00
- -+1 2O
. . . . . g~o V 19 . . . . , . . . . . . . . . . . . . . . . . . . +2
0 50 100 150 200 250
C O R E G C - 3
~ 1 5 1 6 ~ 1 7 _." I • TN ~ ~ +10 ~
14 - oO
1 3 . + 2
12
1 1 . . . . . - . . . . . . . . . . . . . , . . . . . . . . . + 3
50 100 150 200 250 300
A g e ( K y )
Fig. 6. ,~lsO record and sea-surface temperatures equated to TN being established through a combination of nannoplankton taxa for cores RC12-113, Z-2108 and GC-3 (for further details see text).
and the 6180 record. During stage 11, both peaks correspond well. However, during other intergla- cial periods, they do not show a good correspon- dence. Again, preservation values are higher at the glacial-interglacial boundaries or at the end of glacial periods in core GC-3.
The reason for this correspondence between the percentage of perfect C. leptoporus and the 6180 record in core GC-3 cannot be interpreted success- fully at this stage. This might be related to the amount of dissolved CO2 at the ocean floor near
the Subtropical Convergence. I f so, this could relate to the amount of C02 in the atmosphere and the intensification of winds and ocean current systems which control the intensification of the downwelling process, pumping dissolved C02 from sea-surface.
7. Conclusions
( 1 ) A temperature-related ratio of calcareous nan- noplankton TN: [W/(W+C)] based on the modern-day distribution of selected species

410 C. Hiramatsu, P. De Deckker / Palaeogeography, Palaeoclimatology, Palaeoecolog)' 131 (1997) 391 412
80
7o
6o
30 0
CORE RC12-113 -0.6
• perfect C. leptoporus . ' ~ ' - - 8 1 8 0 - - - 0 . 4
- - 0 . 2
0.0
-+0 .2
- + 0 . 4
+0.6 1 00 20O 30O 40O 500 c m
m
8 0 .....
E
} -
G 6o
5o ~. 4o,
o
CORE Z-2108 -2
• perfect C. leptoporus
- + 1
. . . . , . . . . , . . . . i . . . . , . . . . + 2
1 0 0 200 300 400 ~ c m
¢10
oO
CORE GC-3 r~ 7 0 0
60-- • , perfect C. leptoporus .
,~ 50 £_, +1
b 4o-, " 0
30 S +2 o0
20 +3 .
1 0 - - e ~
~. o . . . . . . . . . . . . . . . . . . . . . . . . +4 0 10o 200 300 ~ 50o cm
Fig. 7. C a C O 3 d isso lu t ion pa t t e rns in the three cores, eva lua ted th rough the ra t io of "perfect Calcidiscus leptoporus" (for fur ther
detai ls see text}.
(I4/.' Acanthoica spp., Calciosolenia murrayi, Discosphaera tubifera, Neosphaera coccolitho- morpha, Oolithotus Jragilis, Rhabdosphaera clavigera, Syracosphaera spp., Umbellosphaera irregularis, U. tenuis and Umbilicosphaera siho- gae; and C: Calcidiscus leptoporus and Coccolithus pelagicus) was deve loped and appl ied to the three cores f rom the Tasman
Sea. The T N value shows a good cor respon- dence with the 6180 record in three cores.
(2) The ca lcareous n a n n o p l a n k t o n compos i t ion o f all three cores was studied, and the re la t ion- ships between the percentage abundance of each species and the 6180 record o f p l ank ton ic
foraminifers are presented. (3) The shift f rom small Gephyrocapsa - - to Small

c: Hiramatsu, P. De Deckker / Palaeogeography, Palaeoclimatology. Palaeoecology 131 (1997) 391 412 411
Placolith to Emiliania huxleyi is recognized in cores RC12-113 and Z-2108, but the occur- rences o f the two former taxa show alternating patterns in core GC-3. This biostrat igraphic indicator is useful for identifying isotope stages 4 and 5 for middle latitudes in the Tasman Sea, but the southern extent o f this phenome- non occurs at the Subtropical Convergence.
(4) Gephyrocapsa muellerae increased its geo- graphical abundance southward and strati- graphically during glacial periods, whereas Florisphaera profunda showed a reverse rela- tionship. C. pelagicus increased its abundance southwards, and particularly so during glacial periods. In contrast , U. sibogae increases nor thward, especially during interglacial periods. C. leptoporus and Helicosphaera car- teri geographically increase southward, and Acanthoica spp., C. murrayi, N. coccolithomor- pha, O. fragilis, R. clavigera, Syracosphaera spp., U. irregularis and U. tenuis can increase nor thward f rom their present-day occurrences as seen in all three cores. However, these taxa do not clearly show systematic correspondence with the 6180 record.
(5) The degree o f dissolution, as measured th rough the preservation o f C. leptoporus, is high in core GC-3 in compar i son with cores RC12-113 and Z-2108. The dissolution pat- terns o f three cores do not show a systematic correspondence with the 6~80 record. Of inter- est, however, are the good preservation peaks that are recognized in all three cores at the transit ions f rom glacial to interglacial events.
(6) The apparent relation between low percentage values for F. proJunda in core GC-3 located near the STC today, and high dissolution recognized th rough the C. leptoporus index, remains unclear. This tends to suggest that the link between the posit ion o f the nutricline in the Turbulent Boundary Layer and wind strengthening, as demonst ra ted for the tropical Atlantic Ocean by Molfino and McIntyre (1990a,b), is not obvious for such a site located at a high latitude.
(7) A transfer function for estimating past-SST using calcareous nannop lank ton still awaits the light o f day. Addi t ional modern environ-
mental parameters are necessary to decipher the temperature signal f rom other variables.
Acknowledgements
The senior au thor (C.H.) wishes to thank Professor Hisatake Okada, H o k k a i d o University, for his useful advice and constructive criticisms during this project. He is also very grateful to J A P E X for permission to publish this paper. The stable-isotope measurements for core GC-3 were provided by the Research School o f Ear th Sciences at A N U .
We also thank the members o f the Austral ian Marine Quaternary P rogram for their helpful com- ments and encouragement , and Mr. R. Cunn ingham for his help with statistical t reatment o f the data.
References
Anderson, D.M., Prell, W.L., Barratt, N.J., 1989. Estimates of sea surface temperature in the Coral Sea at the last glacial maximum. Paleoceanography 4, 615 627.
Dudley, W.C., Nelson, C.S., 1988. The 613C content of calcare- ous nannofossils as an indicator of Quaternary paleoproduc- tivity in the Southwest Pacific region. N.Z.J. Geol. Geophys. 31, 111 116.
Dudley, W.C., Nelson, C.S., 1989. Quaternary surface-water stable isotope signal from calcareous nannofossils at DSDP Site 593, southern Tasman Sea. Mar. Micropaleontol. 13, 353 373.
Gartner, S., 1977. Calcareous nannofossil biostratigrapy and revised zonation of the Pleistocene. Mar. Micropaleontol. 2, 1-25.
Hiramatsu, C., De Deckker, P., 1996, The distribution of calcar- eous nannoplankton near the Subtropical Convergence, south of Tasmania, Australia. Mar. Freshwater Res. 47, 707 713.
Hiramatsu, C., De Deckker, P., 1997. Calcareous nannoplank- ton assemblages of surface sediments in the Coral and Tasman Seas. Palaeogeogr., Palaeoclimatol., Palaeoecol. 131,257-285.
Honjo, S., 1975. Dissolution of suspended coccoliths in the deep-sea water column and sedimentation of coccolith ooze. Cushman Found. Foraminiferal Res., Spec. Publ. 15, 114 128.
Lohman, W.H., 1986. Calcareous nannoplankton biostratigra- phy of the southern Coral Sea, Tasman Sea, and southwest-

412 C. Hiramatsu, P. De Deckker / Palaeogeography, Palaeocl#*latolog3', Palaeoecology 131 (1997) 391 412
ern Pacific Ocean, Deep Sea Drilling Project Leg 90: Neogene and Quaternary. Init. Rep. DSDP 90, 763 793.
Martinez, J.l., 1994. Late Pleistocene palaeoceanography of the Tasman Sea: Implications for the dynamics of the warm pool in the western Pacific. Palaeogeogr., Palaeoclimatol., Palaeo- ecol. 112, 19 62.
Martinson, D.G., Pisias, N.G., Hays, J.D., Imbrie, J., Moore, T.C., Jr., Shackleton, N.J., 1987. Age dating and the orbital theory of the ice ages: development of a high resolution 0-300,000 year chronostratigraphy. Quat. Res. 27, I 29.
Matsuoka, H., 1990. A new method to evaluate dissolution of CaCO3 in deep-sea sediments. Trans. Proc. Paleontol. Soc. Jpn. 157, 430 -434.
Matsuoka, H., Okada, H., 1989. Quantitative analysis of Qua- ternary nannoplankton in the subtropical Northwestern Pacific Ocean. Mar. Micropaleontol. 14, 97-118.
Molfino, B., Mclntyre, A., 1990a. Precessional forcing of nutri- cline dynamics in the equatorial Atlantic. Science 249, 766 769.
Molfino, B., Mclntyre, A., 1990b. Nutricline variation in the equatorial Atlantic coincident with the Younger Dryas. Paleoceanography 5,997 1008.
Nelson, C.S., Hendy, C.H., Dudley, W.C., 1985. Quaternary isotope stratigraphy of Hole 593, Challenger Plateau, south Tasman Sea; preliminary observations based on foraminifers and calcareous nannofossils, lnil. Rep. DSDP 90. 1413 1424.
Nelson, C.S., Hendy, C.H.. Cuthbertson, A.M., 1993. Compen- dium of stable oxygen and carbon isotope data for the Late Quaternary interval of deep-sea cores from the New Zealand sector of the Tasman Sea and Southwest Pacific Ocean. Dep. Earth Sci., Univ. Waikato, Occas. Rep. 16, 1 87.
Okada, H., 1992. Biogeographic control of modern nannofossil assemblages in surface sediments of Ise Bay, Mikawa Bay and Kumano-nada, off coast of central Japan. Mere. Sci. Geol., Mem. Ist. Geol. Mineral., Univ. Padova 43,431 449.
Okada, H., Honjo, S., 1973. The distribution of oceanic coccoli- thophorids in the Pacific. Deep-Sea Res. 2(/, 355 374.
Okada, H., Mclntyre, A., 1977. Modern coccolithophores of the Pacific and North Atlantic Oceans. Micropaleontology 23(1), 1 55.
Okada, H., Wells, P., 1994. Late Quaternary nannofossil indica- tors of climatic change in deep-sea cores RC9-150 and RS96GC21 off Western Australia. In: The Late Quaternary History of Oceans in the Australasian Region: Comparison with the Atlantic Record. Geol. Dep., Aust. Natl. Univ., Canberra, A.C.T., Nov. 1994 (abstract).
Roth, P.H., Berger, W.H,, 1975. Distribution and dissolution of coccoliths in the north and central Pacific. Cushman Found. Foraminiferal Res., Spec. Publ. 13, 87 113.
Takayama, T., Sato, T., 1987. Coccolith biostratigraphy of the North Atlantic Ocean, Deep Sea Drilling Project Leg 94. Init. Rep. DSDP 94, 651 702.
Thiede, J., 1979. Wind regimes over the late Quaternary south- west Pacific Ocean. Geology 7, 259 262.
Thierstein, H.R., Geitzenauer, K.R., Molfino. B., Shackleton, N.J., 1977. Global synchroneity of late Quaternary coccolith datum levels: validation by oxygen isotopes. Geology 5, 400 404.
Yanagisawa, Y., 1993. Note oi1 diatom temperature index (Td). Fossils 55, 1 8 (in Japanese, with English abstract).
Young, J.R., Westbroek, P., 1991. Genotypic variation in the coccolithophorid species Emiliania huxleyi. Mar. Micro- paleontol. 18, 5 23.