chief information security officer - usps current visualization will display a summary of the...
TRANSCRIPT

1
®
February 2018
MTAC
February 2018
Packages
2
®
February 2018
MTAC Discussion Topics
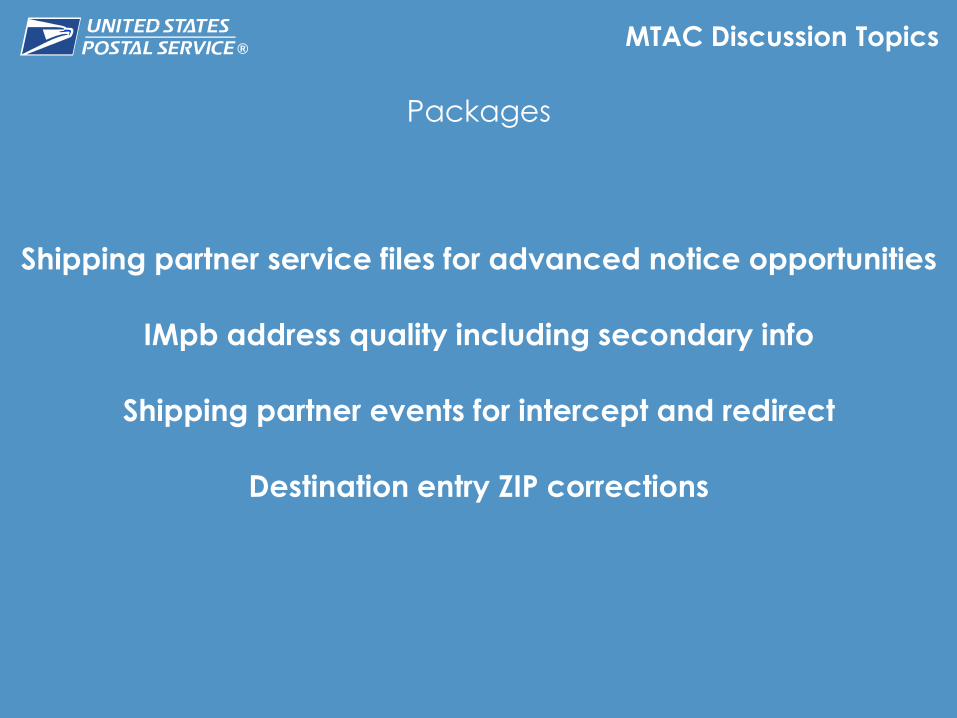
Packages
Shipping partner service files for advanced notice opportunities
IMpb address quality including secondary info
Shipping partner events for intercept and redirect
Destination entry ZIP corrections
3
®
February 2018
MTAC Pulse of the Industry Updates
Packages

4
®
February 2018
USPS to provide Facility IDs for DDU Return Packages
PTR is evaluating this request, working with other systems to document requirements and determine what changes would be needed to implement this functionality.
PTR Agenda & Action Items for Focus Groups
Status of the Federal Register Notice for IMpb compliance?
IMpb Federal Register Notice published 02/27/2018
If USPS determines t destination entry ZIP Code provided by shippers is incorrect,
USPS promise to provide the correct ZIP Code as part of a concession to include this
element as a component of IMpb Quality Compliance?
For packages with the Destination Rate Indicator equal “D” (Destination Delivery Unit) PTR compares the first 3 digits of the Event ZIP Code from the first Arrival-At-Unit (07 Event) to the first 3 digits of the Entry Facility ZIP Code provided in the Manifest Header Record from the shipper.
5
®
February 2018
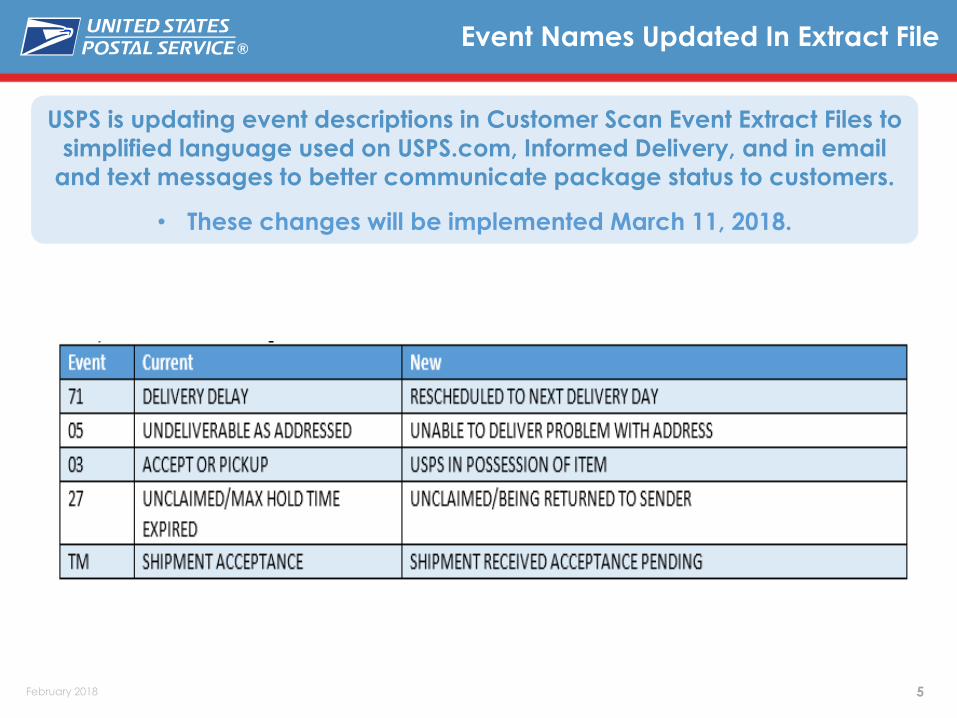
Event Names Updated In Extract File
USPS is updating event descriptions in Customer Scan Event Extract Files to
simplified language used on USPS.com, Informed Delivery, and in email
and text messages to better communicate package status to customers.
• These changes will be implemented March 11, 2018.

6
®
February 2018
IMpb Compliance
7
®
February 2018
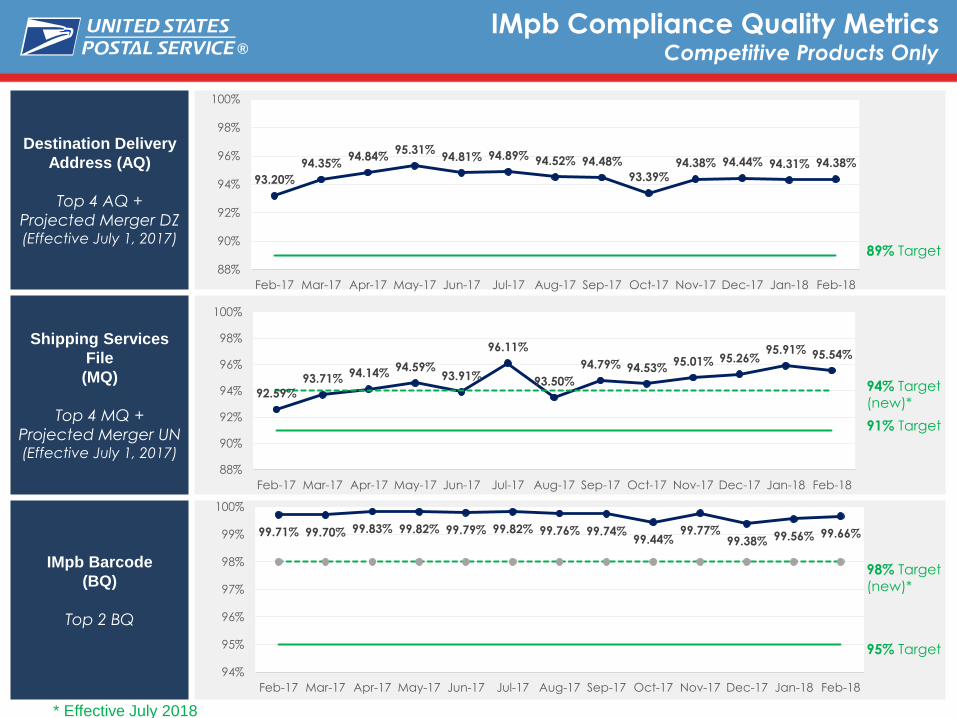
IMpb Compliance Quality MetricsCompetitive Products Only
Destination Delivery
Address (AQ)
Top 4 AQ +
Projected Merger DZ (Effective July 1, 2017)
Shipping Services
File
(MQ)
Top 4 MQ +
Projected Merger UN(Effective July 1, 2017)
IMpb Barcode
(BQ)
Top 2 BQ
89% Target
91% Target
94% Target(new)*
95% Target
98% Target(new)*
93.20%
94.35%94.84%
95.31%94.81% 94.89% 94.52% 94.48%
93.39%94.38% 94.44% 94.31% 94.38%
88%
90%
92%
94%
96%
98%
100%
Feb-17 Mar-17 Apr-17 May-17 Jun-17 Jul-17 Aug-17 Sep-17 Oct-17 Nov-17 Dec-17 Jan-18 Feb-18
92.59%
93.71% 94.14%94.59%
93.91%
96.11%
93.50%
94.79% 94.53%95.01% 95.26%
95.91% 95.54%
88%
90%
92%
94%
96%
98%
100%
Feb-17 Mar-17 Apr-17 May-17 Jun-17 Jul-17 Aug-17 Sep-17 Oct-17 Nov-17 Dec-17 Jan-18 Feb-18
99.71% 99.70% 99.83% 99.82% 99.79% 99.82% 99.76% 99.74%99.44%
99.77%99.38% 99.56% 99.66%
94%
95%
96%
97%
98%
99%
100%
Feb-17 Mar-17 Apr-17 May-17 Jun-17 Jul-17 Aug-17 Sep-17 Oct-17 Nov-17 Dec-17 Jan-18 Feb-18
* Effective July 2018
8
®
February 2018
IMpb WorkGroup 185 Discussion
The objective of WG 185 was to a determine reasonable, achievable threshold target for
Address Quality metric to be implemented in January 2018.
Recommendation Summary:
MTAC Work Group #185 recommends that the threshold for Address Quality (AQ) remain 89%, to allow Industry awareness and adoption of the validation rules before raising the threshold level. The workgroup would like to continue working to set the overall AQ threshold for January 2019.
Next Steps:
Continue the current WG 185 to determine a threshold recommendation for Address Quality to be implemented January 2019.
9
®
February 2018
IMpb WorkGroup185 Discussion
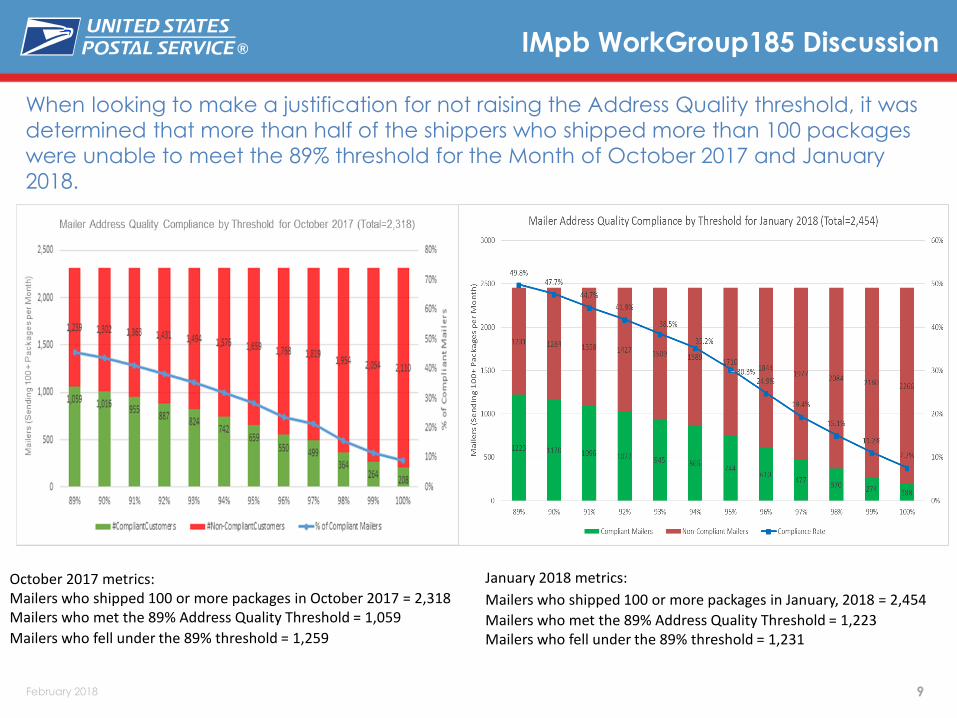
When looking to make a justification for not raising the Address Quality threshold, it was
determined that more than half of the shippers who shipped more than 100 packages
were unable to meet the 89% threshold for the Month of October 2017 and January
2018.
January 2018 metrics:
Mailers who shipped 100 or more packages in January, 2018 = 2,454
Mailers who met the 89% Address Quality Threshold = 1,223Mailers who fell under the 89% threshold = 1,231
October 2017 metrics:Mailers who shipped 100 or more packages in October 2017 = 2,318Mailers who met the 89% Address Quality Threshold = 1,059
Mailers who fell under the 89% threshold = 1,259

10
®
February 2018
IMpb WG 185 Recommendations
The following items are the concerns that Industry would like USPS to improve before raising
the current threshold for Address Quality in January 2019:
USPS to provide examples to the industry that illustrate the complexity of the various delivery address
information formats, and to communicate the standard to not fail the validation criteria elements.
o This will include the Delivery Address Line 1 and 2 differentiation
o File format guidance and limitations when delivery address form has two lines and the file format
has one line (field).
USPS should consider creating additional fields in the Shipping Services File and/or the Shipping
Partner file to provide additional space to accommodate delivery addresses that exceed the current
character limit, providing 2 address lines.
USPS to monitor and provide data analysis on numbers of the affected mailers and what elements are
causing them to fail the AQ validation criteria.
USPS to monitor and provide data analysis that shows what is on the label versus what is available in
the file (relative to secondary information)
o To host IMpb Quality customer educational webinars –targeted at smaller customers/infrequent
shippers and have provided IMpb Quality Deep Dives surrounding Address Quality improvements
and standards.
11
®
February 2018
IMpb Compliance Visualization
Dashboard Demo
Explore the possibility of providing a way for mailers to see quality metrics through a D3?
Visualization:
The current visualization will display a summary of the monthly IMpb Compliance Indicators (AQ, MQ, & BQ)
Mailers will be able to drill down to view compliance data at a state level which highlights IMpb compliance
issues by geographic location
http://56.72.7.32:9100/YK/Project_VII/versio
n_20180222/app/
IMPB DASHBOARD DEMO
12
®
February 2018
Address Quality Discussion
Timely, high quality, digitized address information is critical to enhancing the customer experience and leveraging operating efficiencies to increase the value and competitiveness for USPS package products
USPS will move forward with other strategies to electronically capture and correct Address Information for packages with:
• Missing Secondary Information elements
• Incomplete or incorrect street elements
• Untimely Data

13
®
February 2018
IMpb Dashboard Demo
Back Up Slides

14
®
February 2018
IMpb Dashboard
Explore the possibility of providing a way for mailers to see quality metrics through a D3?
Visualization:
The current visualization will display a summary of the monthly IMpb Compliance Indicators (AQ, MQ, & BQ)
Mailers will be able to drill down to view compliance data at a state level which highlights IMpb compliance
issues by geographic location
15
®
February 2018
IMpb Dashboard
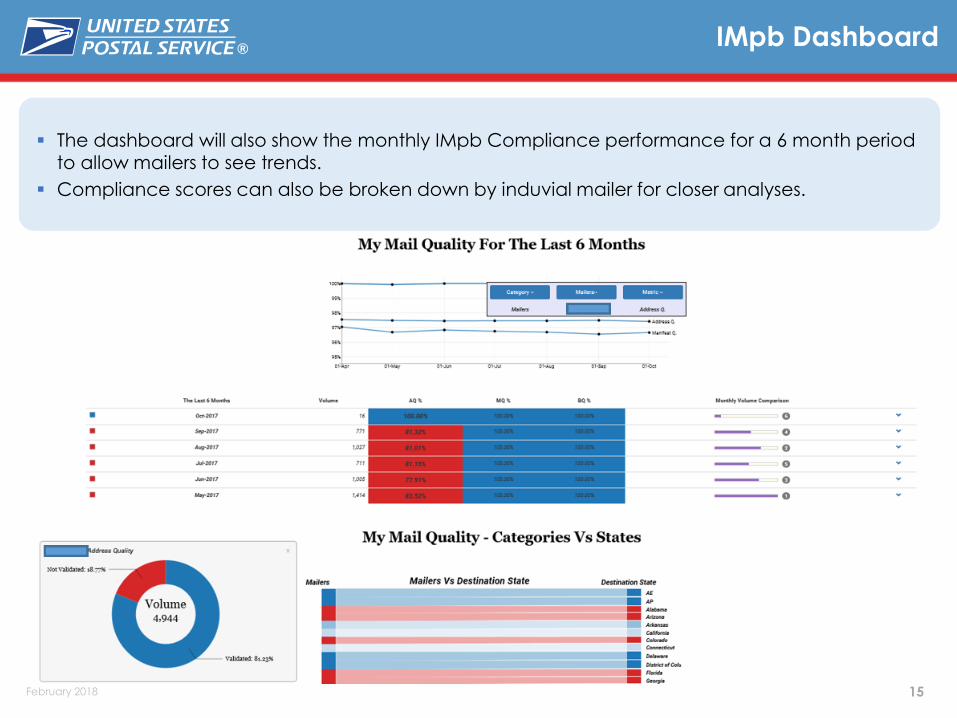
The dashboard will also show the monthly IMpb Compliance performance for a 6 month period to allow mailers to see trends.
Compliance scores can also be broken down by induvial mailer for closer analyses.
16
®
February 2018
IMpb Dashboard
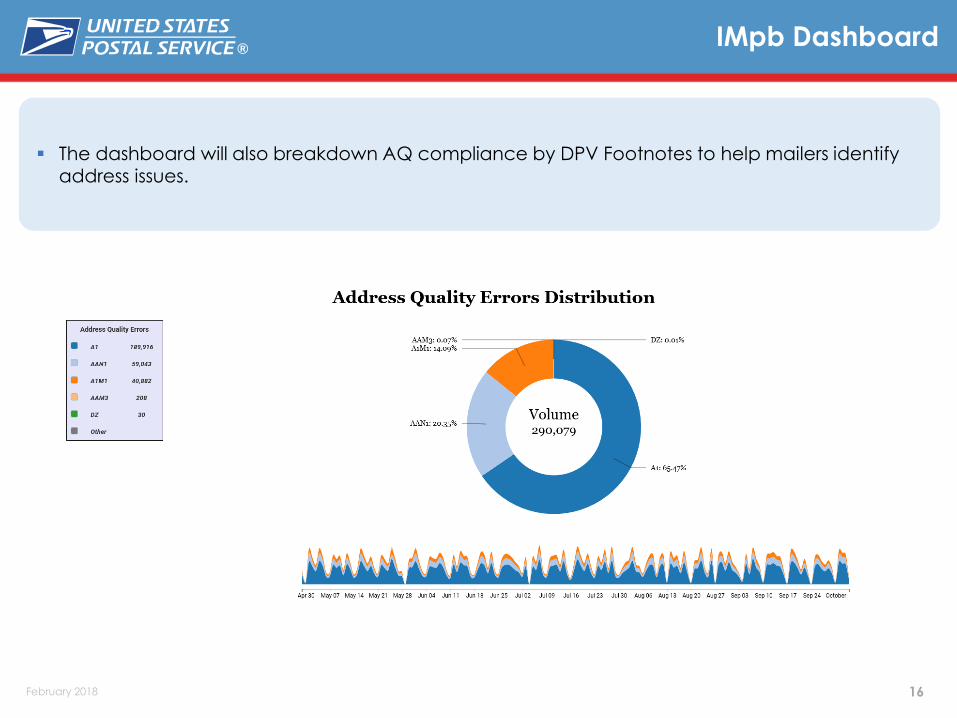
The dashboard will also breakdown AQ compliance by DPV Footnotes to help mailers identify address issues.
17
®
February 2018
IMpb Dashboard
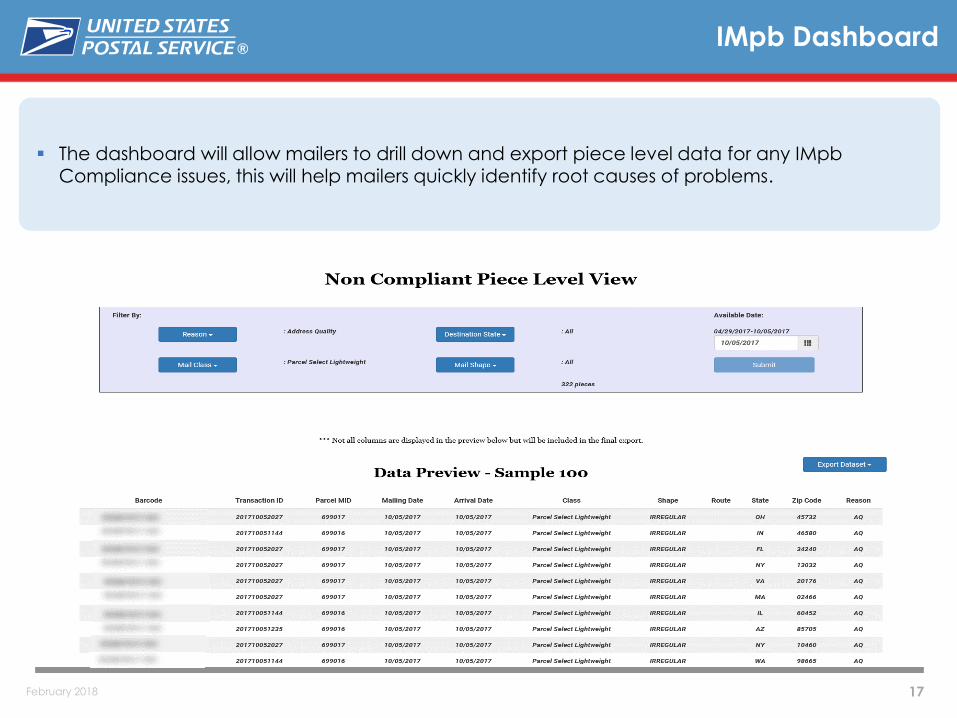
The dashboard will allow mailers to drill down and export piece level data for any IMpb Compliance issues, this will help mailers quickly identify root causes of problems.
99123456789101112052
99123456789101112052
99123456789101112052
99123456789101112052
99123456789101112052
99123456789101112052
99123456789101112052

18
®
February 2018
Addressing & Geospatial Technology

19
®
February 2018
CASS / MASS Cycle O
Informed Delivery
Address Authority Data Exchange

20
®
February 2018
Cycle O Highlights
21
®
February 2018
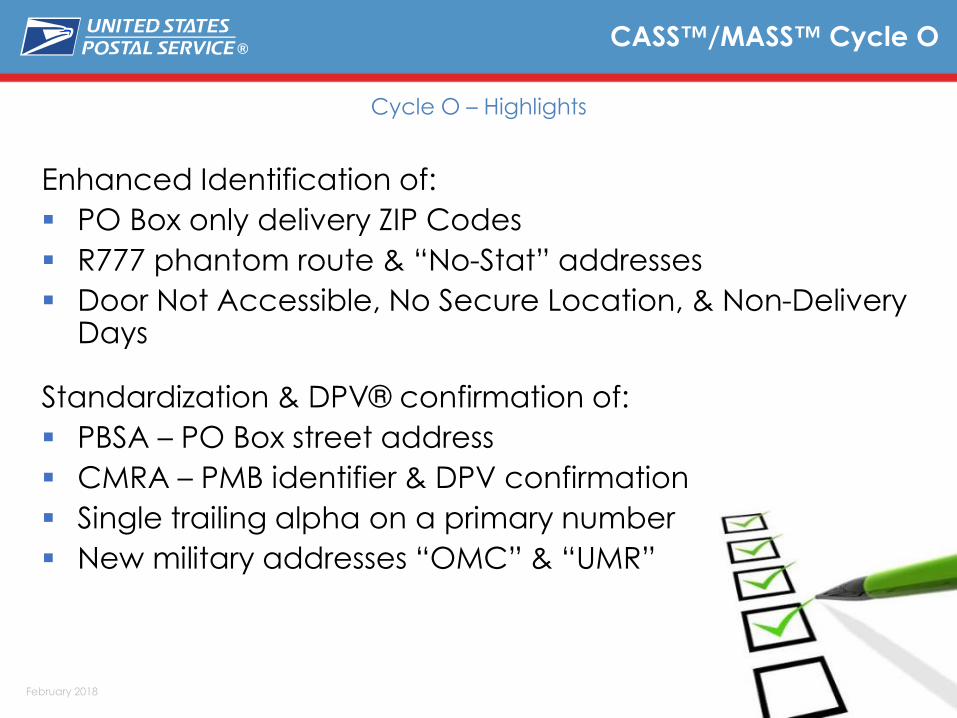
Enhanced Identification of:
PO Box only delivery ZIP Codes
R777 phantom route & “No-Stat” addresses
Door Not Accessible, No Secure Location, & Non-Delivery Days
Standardization & DPV® confirmation of:
PBSA – PO Box street address
CMRA – PMB identifier & DPV confirmation
Single trailing alpha on a primary number
New military addresses “OMC” & “UMR”
CASS™/MASS™ Cycle O
Cycle O – Highlights

22
®
February 2018
The USPS® has added a new table to the DPV/DSF2Hash Product called No-Stat Reason Code Table.
This table will provide details as to why the records are flagged as No-Stats.
This table is optional and will be available beginning in the May product, which will be posted to the Electronic Product Fulfillment (EPF) website on Monday, April 23.
During CASS™ Cycle O certification if a ‘Y’ is received on the DPV No-Stat table, the N-Stat Reason code must be correctly returned.
CASS™/MASS™ Cycle O
No-Stat Reason Codes
23
®
February 2018
CASS™/MASS™ Cycle O
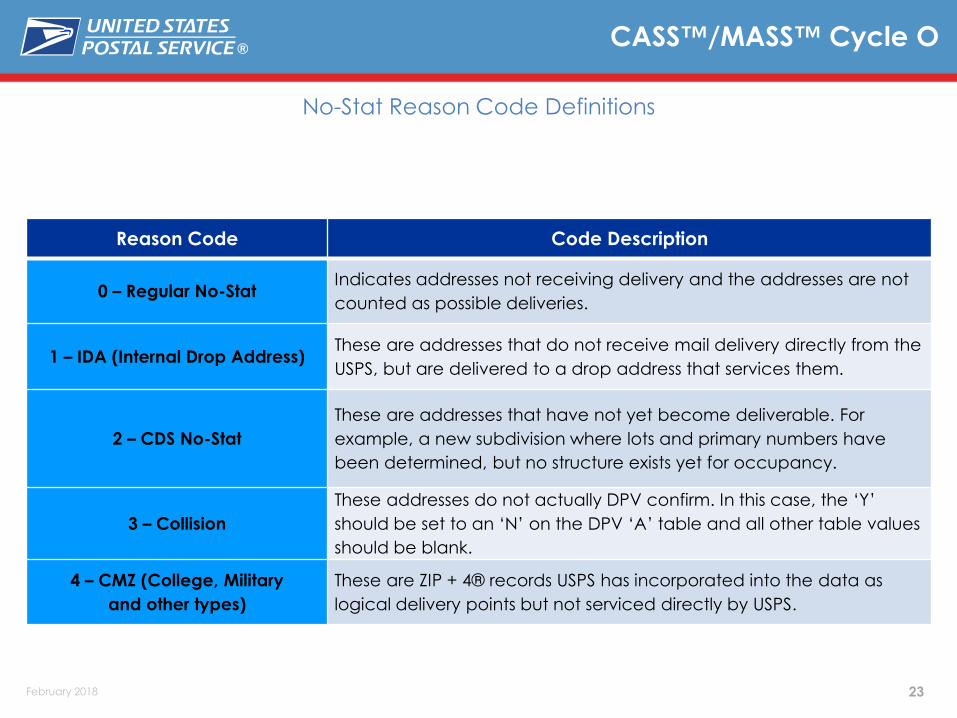
No-Stat Reason Code Definitions
Reason Code Code Description
0 – Regular No-StatIndicates addresses not receiving delivery and the addresses are not
counted as possible deliveries.
1 – IDA (Internal Drop Address)These are addresses that do not receive mail delivery directly from the
USPS, but are delivered to a drop address that services them.
2 – CDS No-Stat
These are addresses that have not yet become deliverable. For
example, a new subdivision where lots and primary numbers have
been determined, but no structure exists yet for occupancy.
3 – Collision
These addresses do not actually DPV confirm. In this case, the ‘Y’
should be set to an ‘N’ on the DPV ‘A’ table and all other table values
should be blank.
4 – CMZ (College, Military
and other types)
These are ZIP + 4® records USPS has incorporated into the data as
logical delivery points but not serviced directly by USPS.
24
®
February 2018
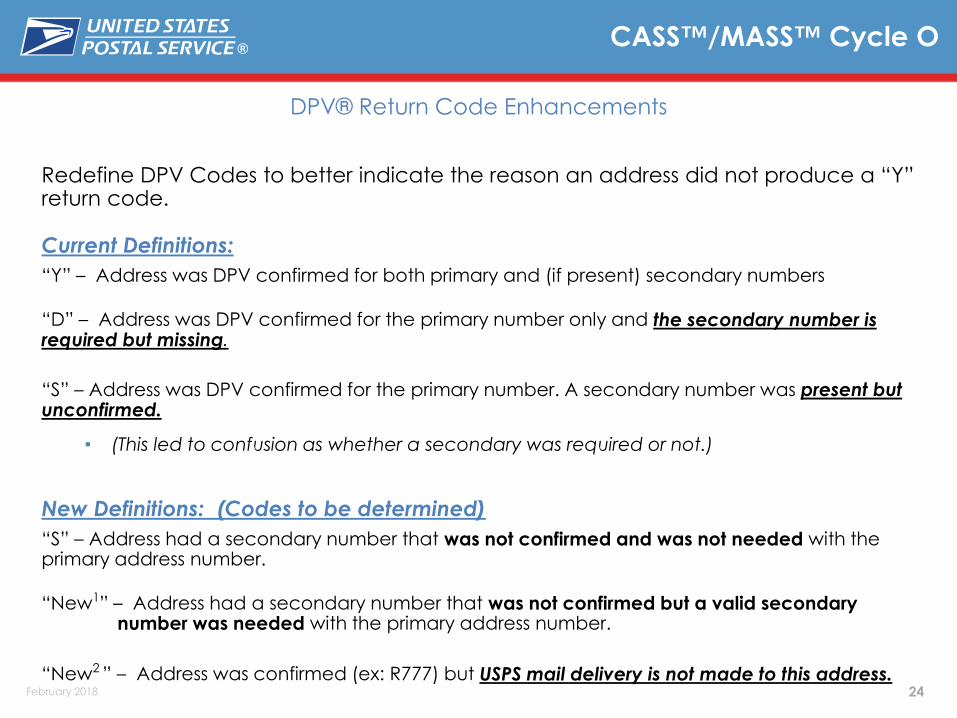
Redefine DPV Codes to better indicate the reason an address did not produce a “Y” return code.
Current Definitions:
“Y” – Address was DPV confirmed for both primary and (if present) secondary numbers
“D” – Address was DPV confirmed for the primary number only and the secondary number is required but missing.
“S” – Address was DPV confirmed for the primary number. A secondary number was present but unconfirmed.
• (This led to confusion as whether a secondary was required or not.)
New Definitions: (Codes to be determined)
“S” – Address had a secondary number that was not confirmed and was not needed with the primary address number.
“New1” – Address had a secondary number that was not confirmed but a valid secondary number was needed with the primary address number.
“New2 ” – Address was confirmed (ex: R777) but USPS mail delivery is not made to this address.
CASS™/MASS™ Cycle O
DPV® Return Code Enhancements

25
®
February 2018
CASS™/MASS™ Cycle O
Tentative Schedule
CASS Cycle “O” Pre-Meeting February 23 2018
Partnership In Tomorrow (PIT) Meeting May 1 2018
NCOALink® PIT May 8 2018
Official Rules Release June 1 2018
Send Static Data September 30 2018
CASS & NCOALink Stage I Release October 31 2018
CASS & NCOALink Stage II Release February 28 2019
MASS Test Decks Available September 30 2019
CASS Developers Certification Completed December 31 2019
MASS Manufacturers Certification Completed January 31 2020
Software Released to End-users NLT March 31 2020
Expiration of CASS™ Cycle N July 31 2020
Implementation of CASS Cycle O August 1 2020

26
®
February 2018
Informed Delivery

27
®
February 2018
Definition
Address records that are currently coded in the AMS database that share the same 11-digit delivery point. These addresses are currently ineligible for participation in the Informed Delivery program.
Objective
Resolve the 11-digit conflicts to allow address records to become eligible to participate in the Informed Delivery program.
Informed Delivery 11-Digit Conflicts
11-Digit De-conflicts
2,354,501
5,213,346
TOTAL DP CONFLICTS TOTAL ADDRESS RECORDS

28
®
February 2018
Option 1:
Crosswalk: Leverage existing geo-seg +4 even/odd ranges for the generation of a unique 11-digit. It limits the use of available ZIP+4 and potential ZIP Code saturation. Also limits impact on address matching software.
Option 2:
Convert records to a High-Rise; uniquely assigning a ZIP+4 to colliding deliveries. Potentially, 96% of the collisions can be corrected by using this method in conjunction with option 1.
Option 3:
Create a derivative linkage table similar to LACS that will allow software to query the table to search for an equivalent but unique 11-digit to be applied to the mail-piece. This method will be considered if necessary after options 1 and 2.
Option 4:
No Resolution; conflict can’t be broken.
Informed Delivery 11-Digit Conflicts
11-Digit De-conflicts Resolutions

29
®
February 2018
Informed Delivery 11-Digit De-confliction
11-Digit De-conflicts Resolutions and Breakdown

30
®
February 2018
There are 64 ZIP Codes with 11-Digit Conflicts in the Chicago District. These ZIPs have the highest potential for implementing ZIP splits as a result of the de-conflicting effort if using the unique ZIP+4 assignment effort.
Informed Delivery 11-Digit De-confliction
ZIP Codes with Highest Percentage of Conflicts
ZIP CODETOTAL
CONFLICTS
60618 13,814
60647 11,802
60625 9,632
60629 8,972
60639 8,757
60623 7,844
60619 7,729
Seven largest ZIP Codes with
Conflicts for Chicago District

31
®
February 2018
There are 159 ZIP Codes with 11-Digit Conflicts in the New York Metro Area. These ZIPs have the highest potential for implementing ZIP splits as a result of the de-conflicting effort if using the unique ZIP+4 is assignment effort.
Informed Delivery 11-Digit De-confliction
ZIP Codes with Highest Percentage of Conflicts
ZIP CODETOTAL
CONFLICTS
11236 12,222
11234 9,141
11214 8,768
11221 7,321
11219 6,923
11208 6,575
11233 6,060
Seven Largest ZIP Codes with
Conflicts for New York Metro Area

32
®
February 2018
Address AuthorityData Exchange (AADE)

33
®
February 2018
Partner with the Department of Transportation, and their efforts, to create the National Address Database.
Compare address data received from the DOT National Address Database (NAD) to the USPS® Delivery Point File (DPF) database. Unmatched records will be researched and validated to be potentially added to AMS as a valid delivery point.
Address Authority Data Exchange
Objective
34
®
February 2018
Address Authority Data Exchange
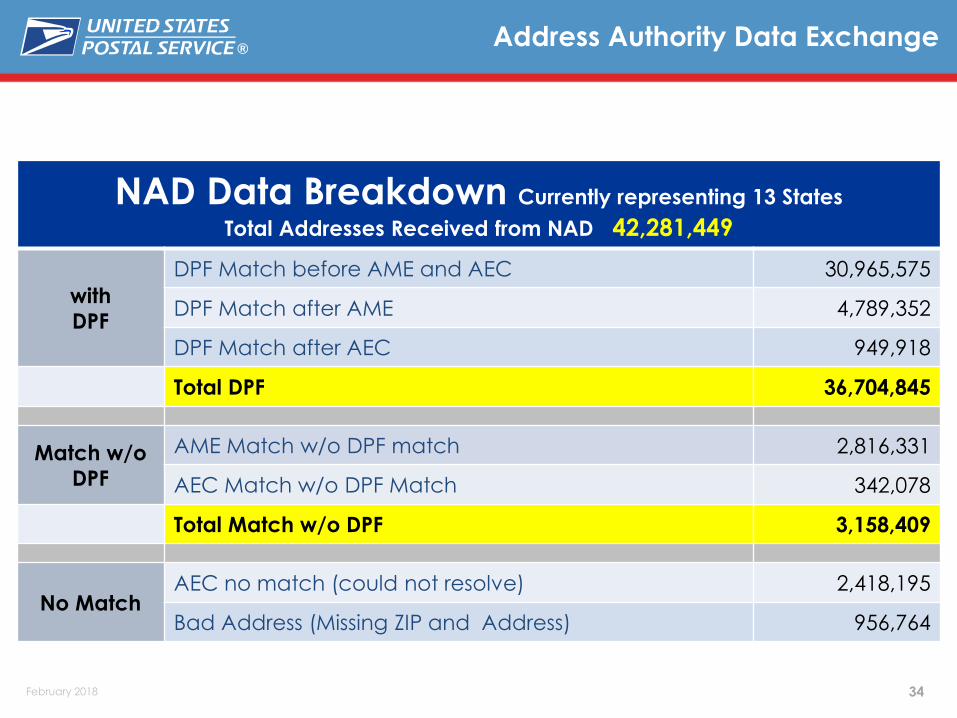
NAD Data Breakdown Currently representing 13 States
Total Addresses Received from NAD 42,281,449
with
DPF
DPF Match before AME and AEC 30,965,575
DPF Match after AME 4,789,352
DPF Match after AEC 949,918
Total DPF 36,704,845
Match w/o
DPF
AME Match w/o DPF match 2,816,331
AEC Match w/o DPF Match 342,078
Total Match w/o DPF 3,158,409
No MatchAEC no match (could not resolve) 2,418,195
Bad Address (Missing ZIP and Address) 956,764

35
®
February 2018
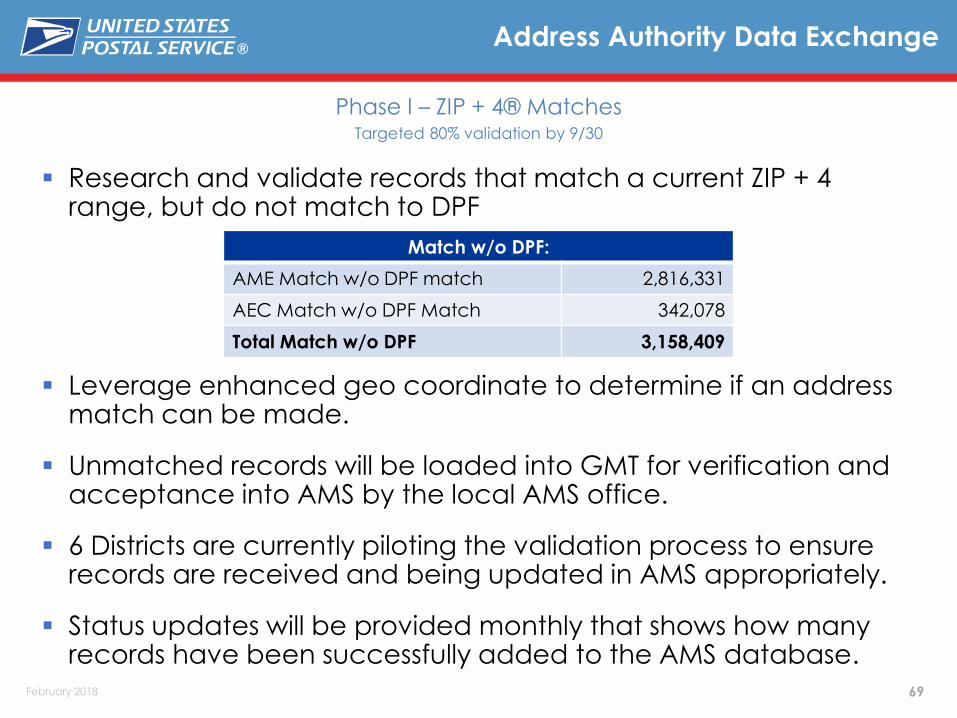
Research and validate records that match a current ZIP + 4 range, but do not match to DPF
Leverage enhanced geo coordinate to determine if an address match can be made.
Unmatched records will be loaded into GMT for verification and acceptance into AMS by the local AMS office.
6 Districts are currently piloting the validation process to ensure records are received and being updated in AMS appropriately.
Status updates will be provided monthly that shows how many records have been successfully added to the AMS database.
Address Authority Data Exchange
Phase I – ZIP + 4® Matches Targeted 80% validation by 9/30
Match w/o DPF:
AME Match w/o DPF match 2,816,331
AEC Match w/o DPF Match 342,078
Total Match w/o DPF 3,158,409

36
®
February 2018
Thank You!

37
®
February 2018
MTAC
February 2018
First-Class Mail

38
®
February 2018
MTAC Discussion Topics
All Classes
Bundle breakage data
Two sets of service data for disasters
Report that shows volume of automation flats in manual
The Future of Informed Visibility
Mail in Measurement Scorecard

39
®
February 2018
Informed Visibility Update

40
®
February 2018
Informed Visibility® Update
IV – our single source for near real-time data
Over 1,138 new mailers joined IV
since July 1, 2017!
+250 Million daily Logical Delivery
Events provided daily through IV-MTR
data feeds
1.1 Billion scan records processed
daily by IV
THANK YOU to industry partners!
41
®
February 2018
Informed Visibility Roadmap
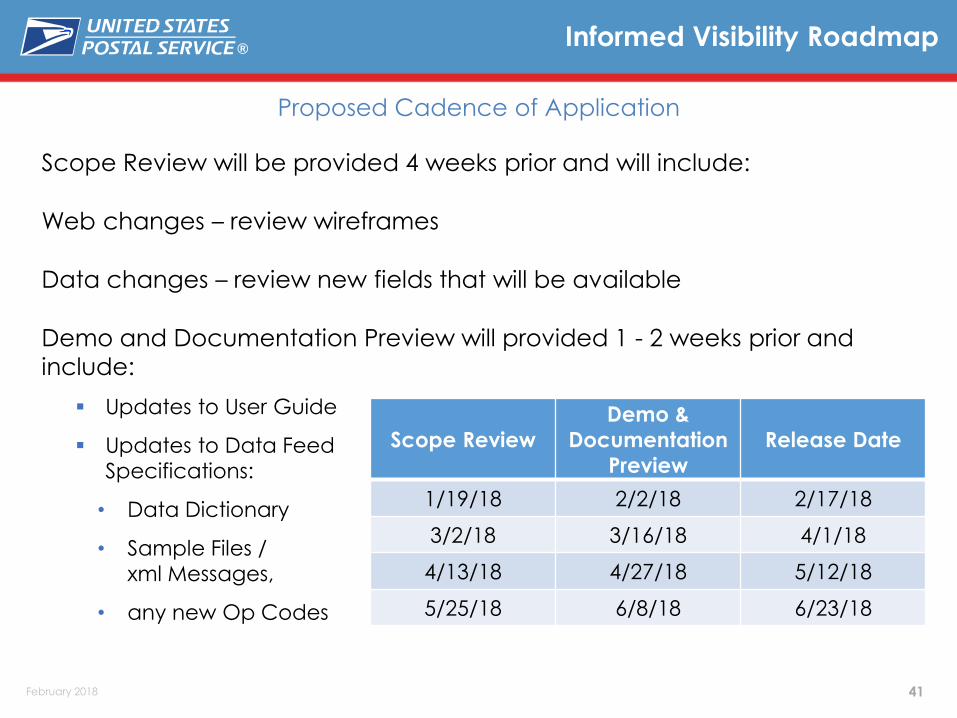
Proposed Cadence of Application
Scope Review will be provided 4 weeks prior and will include:
Web changes – review wireframes
Data changes – review new fields that will be available
Demo and Documentation Preview will provided 1 - 2 weeks prior and
include:
Updates to User Guide
Updates to Data Feed
Specifications:
• Data Dictionary
• Sample Files /
xml Messages,
• any new Op Codes
Scope Review
Demo &
Documentation
Preview
Release Date
1/19/18 2/2/18 2/17/18
3/2/18 3/16/18 4/1/18
4/13/18 4/27/18 5/12/18
5/25/18 6/8/18 6/23/18

42
®
February 2018
No Piece Scan

43
®
February 2018
No Piece ScanFY18 Q1
In FY18 Q1, about 4% of Letters had No Visibility
Note: Metrics based on Full-Service Volume with Start-the-Clock for Start-the-Clock Dates 10/1/2017 – 12/31/2017
Mail Class Mail Shape Entry Discount Volume with Visibility No Visibility Volume % No Visibility
Presort First Class Letters/Cards ORIGIN 5,486,453,698 155,762,025 2.76%
USPS Marketing Mail Letters
DSCF 6,926,570,710 310,289,152 4.29%
ORIGIN 903,892,831 127,372,459 12.35%
DNDC 844,055,360 50,541,148 5.65%
ASF 60,850,551 2,676,122 4.21%
DDU 61,992 3,453 5.28%
Total 14,221,885,142 646,644,359 4.35%
Mail Class Mail Shape Entry Discount Volume with Visibility No Visibility Volume % No Visibility
USPS Marketing Mail Flat
DSCF 1,814,330,379 254,281,697 12.29%
ORIGIN 221,069,753 45,966,052 17.21%
DNDC 140,035,415 45,231,647 24.41%
DDU 36,369,958 5,280,498 12.68%
ASF 2,354,093 5,022,337 68.09%
ADC 12,931 3,153 19.60%
Periodicals Flat
DSCF 467,176,575 100,184,638 17.66%
ORIGIN 103,774,942 33,116,484 24.19%
DNDC 13,109,306 8,022,938 37.97%
ADC 10,194,590 3,810,830 27.21%
DDU 1,220,505 1,716,064 58.44%
ASF 53,753 17,426 24.48%
Total 2,809,702,200 502,653,764 15.18%
In FY18 Q1, about 15% of Flats had No Visibility

44
®
February 2018
Periodicals
Deep Dive on No Piece Scan by Entry Type

45
®
February 2018
FY18 Q1 Periodicals Visibility FlowsMetrics by Entry Discount Type
Note: Metrics based on Full-Service Volume with Start-the-Clock for Start-the-Clock Dates 10/1/2017 – 12/31/2017
In FY18 Q1, about 20% of Periodicals did not have any visibility at the
piece level
DDU Entry had the highest % of Periodicals which did not have any
piece level visibility
Breakdown by Entry Type:
Entry Discount Type
% withNo Visibility
% withBundle Visibility
% withFSS Visibility
% withAFSM Visibility
% withOther Visibility
DSCF 17.66% 46.21% 18.64% 17.37% 0.13%
ORIGIN 24.19% 28.46% 10.97% 35.75% 0.62%
DNDC 37.97% 35.68% 7.05% 19.20% 0.10%
ADC 27.21% 28.77% 6.51% 37.39% 0.12%
DDU 58.44% 33.87% 0.04% 0.07% 7.58%
ASF 24.48% 20.25% 1.43% 53.66% 0.18%
Total 19.78% 42.26% 16.59% 21.12% 0.25%

46
®
February 2018
Manual Bullpen Scanning
Mail & Package Visibility

47
®
February 2018
Operation 110 – Initial Breakdown
Operation 126 – Dispatch
Manual Bullpen Visibility
Manual Operation Numbers
Nesting and Visibility
Proof-Of-Concept testing underway in two plants (Two scanner solutions)
Scanning Container Placards or Tray/Sack Labels > Nesting
Dependencies:
Full Service Mailings
eDoc Accuracy and Barcode Readability
Challenges relative to “Turnaround” Mail – Mailer is dropping Handling Units from eDoc at Delivery Units as well as origin plant

48
®
February 2018
Mail Visibility Applications (MVA)

49
®
February 2018
Mail Visibility Applications (MVA)
Two internal mobile applications launched in September 2017:
• Mail History Application
• Employees can use their USPS mobile devices to retrieve near real-time delivery information by scanning barcodes for containers, mail handling units, and single mail pieces
• Enhanced Barcode Diagnostics Application
• Employees can use their USPS mobile devices to scan barcodes to retrieve diagnostic data of the visible elements of the barcodes scanned and highlight invalid data elements
USPS is currently considering how to address long hauls.

50
®
February 2018
Addressing & Geospatial Technology

51
®
February 2018
CASS / MASS Cycle O
Green & Secure
Informed Delivery
Address Authority Data Exchange

52
®
February 2018
Cycle O Highlights

53
®
February 2018
Enhanced Identification of:
PO Box only delivery ZIP Codes
R777 phantom route & “No-Stat” addresses
Door Not Accessible, No Secure Location, & Non-Delivery Days
Standardization & DPV® confirmation of:
PBSA – PO Box street address
CMRA – PMB identifier & DPV confirmation
Single trailing alpha on a primary number
New military addresses “OMC” & “UMR”
CASS™/MASS™ Cycle O
Cycle O – Highlights

54
®
February 2018
The USPS® has added a new table to the DPV/DSF2Hash Product called No-Stat Reason Code Table.
This table will provide details as to why the records are flagged as No-Stats.
This table is optional and will be available beginning in the May product, which will be posted to the Electronic Product Fulfillment (EPF) website on Monday, April 23.
During CASS™ Cycle O certification if a ‘Y’ is received on the DPV No-Stat table, the N-Stat Reason code must be correctly returned.
CASS™/MASS™ Cycle O
No-Stat Reason Codes

55
®
February 2018
CASS™/MASS™ Cycle O
No-Stat Reason Code Definitions
Reason Code Code Description
0 – Regular No-StatIndicates addresses not receiving delivery and the addresses are not
counted as possible deliveries.
1 – IDA (Internal Drop Address)These are addresses that do not receive mail delivery directly from the
USPS, but are delivered to a drop address that services them.
2 – CDS No-Stat
These are addresses that have not yet become deliverable. For
example, a new subdivision where lots and primary numbers have
been determined, but no structure exists yet for occupancy.
3 – Collision
These addresses do not actually DPV confirm. In this case, the ‘Y’
should be set to an ‘N’ on the DPV ‘A’ table and all other table values
should be blank.
4 – CMZ (College, Military
and other types)
These are ZIP + 4® records USPS has incorporated into the data as
logical delivery points but not serviced directly by USPS.

56
®
February 2018
Redefine DPV Codes to better indicate the reason an address did not produce a “Y” return code.
Current Definitions:
“Y” – Address was DPV confirmed for both primary and (if present) secondary numbers
“D” – Address was DPV confirmed for the primary number only and the secondary number is required but missing.
“S” – Address was DPV confirmed for the primary number. A secondary number was present but unconfirmed.
• (This led to confusion as whether a secondary was required or not.)
New Definitions: (Codes to be determined)
“S” – Address had a secondary number that was not confirmed and was not needed with the primary address number.
“New1” – Address had a secondary number that was not confirmed but a valid secondary number was needed with the primary address number.
“New2 ” – Address was confirmed (ex: R777) but USPS mail delivery is not made to this address.
CASS™/MASS™ Cycle O
DPV® Return Code Enhancements

57
®
February 2018
CASS™/MASS™ Cycle O
Tentative Schedule
CASS Cycle “O” Pre-Meeting February 23 2018
Partnership In Tomorrow (PIT) Meeting May 1 2018
NCOALink® PIT May 8 2018
Official Rules Release June 1 2018
Send Static Data September 30 2018
CASS & NCOALink Stage I Release October 31 2018
CASS & NCOALink Stage II Release February 28 2019
MASS Test Decks Available September 30 2019
CASS Developers Certification Completed December 31 2019
MASS Manufacturers Certification Completed January 31 2020
Software Released to End-users NLT March 31 2020
Expiration of CASS™ Cycle N July 31 2020
Implementation of CASS Cycle O August 1 2020

58
®
February 2018
Green & Secure
59
®
February 2018
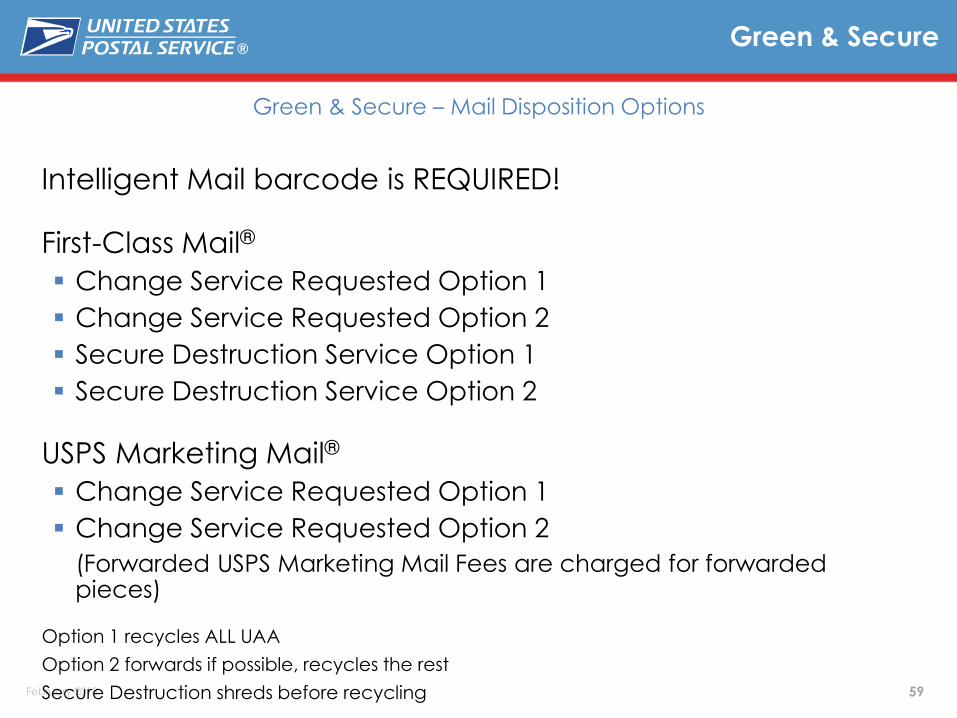
Intelligent Mail barcode is REQUIRED!
First-Class Mail®
Change Service Requested Option 1
Change Service Requested Option 2
Secure Destruction Service Option 1
Secure Destruction Service Option 2
USPS Marketing Mail®
Change Service Requested Option 1
Change Service Requested Option 2
(Forwarded USPS Marketing Mail Fees are charged for forwarded pieces)
Option 1 recycles ALL UAA
Option 2 forwards if possible, recycles the rest
Secure Destruction shreds before recycling
Green & Secure
Green & Secure – Mail Disposition Options

60
®
February 2018
Informed Delivery

61
®
February 2018
Definition
Address records that are currently coded in the AMS database that share the same 11-digit delivery point. These addresses are currently ineligible for participation in the Informed Delivery program.
Objective
Resolve the 11-digit conflicts to allow address records to become eligible to participate in the Informed Delivery program.
Informed Delivery 11-Digit Conflicts
11-Digit De-conflicts
2,354,501
5,213,346
TOTAL DP CONFLICTS TOTAL ADDRESS RECORDS
62
®
February 2018
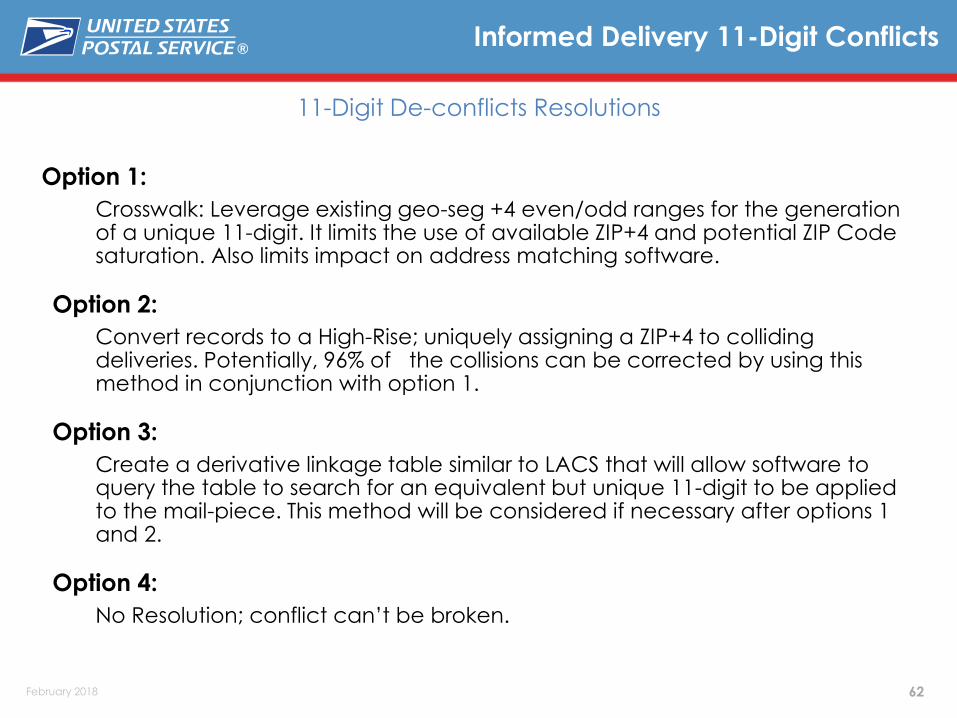
Option 1:
Crosswalk: Leverage existing geo-seg +4 even/odd ranges for the generation of a unique 11-digit. It limits the use of available ZIP+4 and potential ZIP Code saturation. Also limits impact on address matching software.
Option 2:
Convert records to a High-Rise; uniquely assigning a ZIP+4 to colliding deliveries. Potentially, 96% of the collisions can be corrected by using this method in conjunction with option 1.
Option 3:
Create a derivative linkage table similar to LACS that will allow software to query the table to search for an equivalent but unique 11-digit to be applied to the mail-piece. This method will be considered if necessary after options 1 and 2.
Option 4:
No Resolution; conflict can’t be broken.
Informed Delivery 11-Digit Conflicts
11-Digit De-conflicts Resolutions

63
®
February 2018
Informed Delivery 11-Digit De-confliction
11-Digit De-conflicts Resolutions and Breakdown
64
®
February 2018
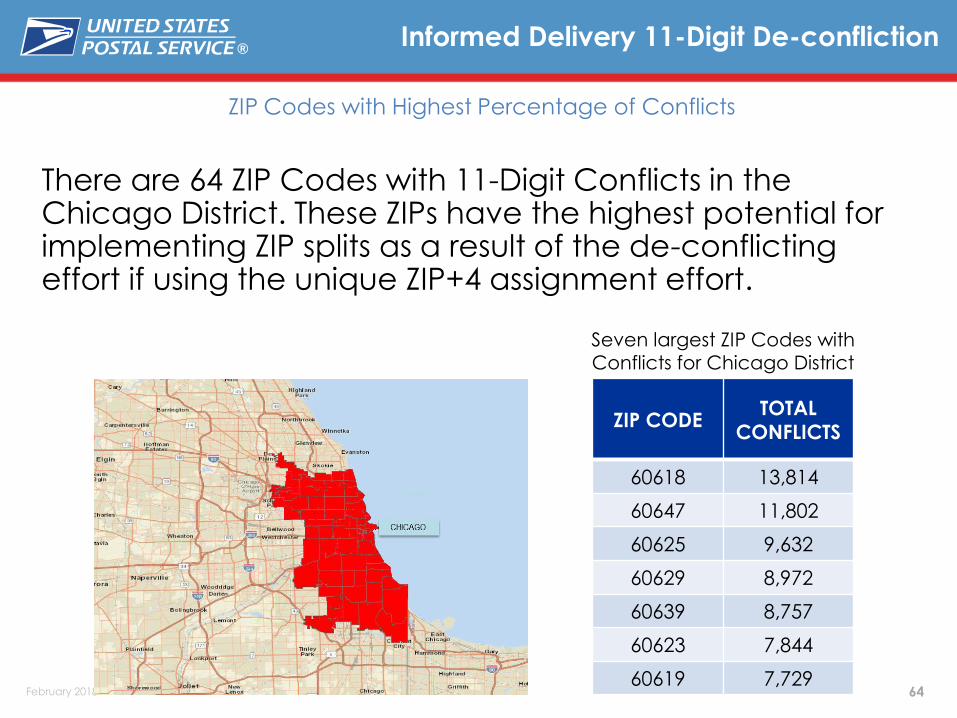
There are 64 ZIP Codes with 11-Digit Conflicts in the Chicago District. These ZIPs have the highest potential for implementing ZIP splits as a result of the de-conflicting effort if using the unique ZIP+4 assignment effort.
Informed Delivery 11-Digit De-confliction
ZIP Codes with Highest Percentage of Conflicts
ZIP CODETOTAL
CONFLICTS
60618 13,814
60647 11,802
60625 9,632
60629 8,972
60639 8,757
60623 7,844
60619 7,729
Seven largest ZIP Codes with
Conflicts for Chicago District
65
®
February 2018
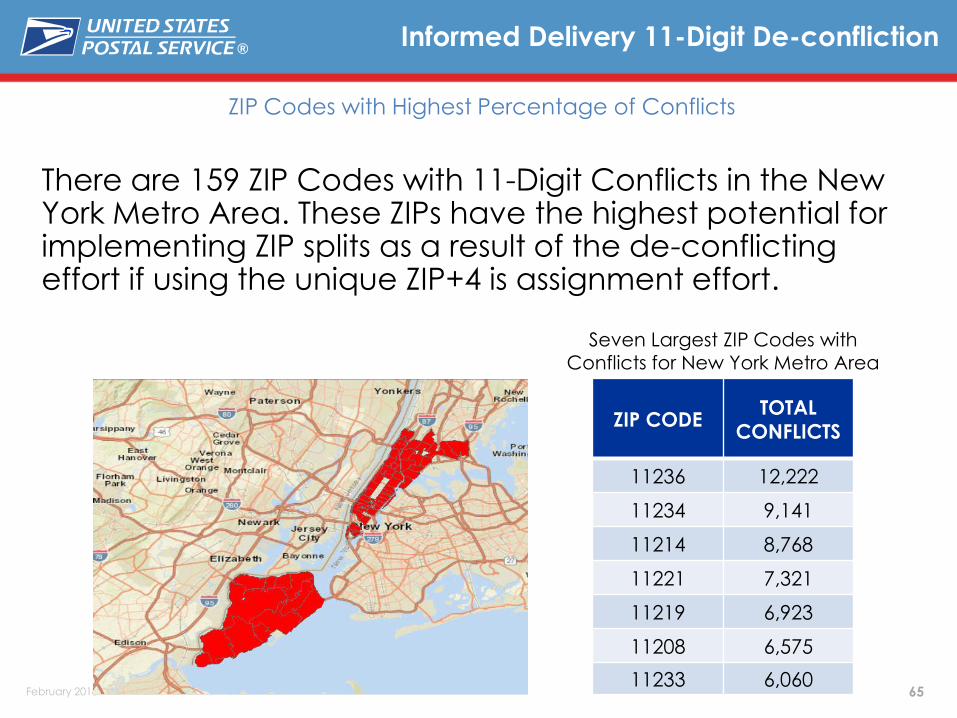
There are 159 ZIP Codes with 11-Digit Conflicts in the New York Metro Area. These ZIPs have the highest potential for implementing ZIP splits as a result of the de-conflicting effort if using the unique ZIP+4 is assignment effort.
Informed Delivery 11-Digit De-confliction
ZIP Codes with Highest Percentage of Conflicts
ZIP CODETOTAL
CONFLICTS
11236 12,222
11234 9,141
11214 8,768
11221 7,321
11219 6,923
11208 6,575
11233 6,060
Seven Largest ZIP Codes with
Conflicts for New York Metro Area

66
®
February 2018
Address AuthorityData Exchange (AADE)

67
®
February 2018
Partner with the Department of Transportation, and their efforts, to create the National Address Database.
Compare address data received from the DOT National Address Database (NAD) to the USPS® Delivery Point File (DPF) database. Unmatched records will be researched and validated to be potentially added to AMS as a valid delivery point.
Address Authority Data Exchange
Objective

68
®
February 2018
Address Authority Data Exchange
NAD Data Breakdown Currently representing 13 States
Total Addresses Received from NAD 42,281,449
with
DPF
DPF Match before AME and AEC 30,965,575
DPF Match after AME 4,789,352
DPF Match after AEC 949,918
Total DPF 36,704,845
Match w/o
DPF
AME Match w/o DPF match 2,816,331
AEC Match w/o DPF Match 342,078
Total Match w/o DPF 3,158,409
No MatchAEC no match (could not resolve) 2,418,195
Bad Address (Missing ZIP and Address) 956,764
69
®
February 2018
Research and validate records that match a current ZIP + 4 range, but do not match to DPF
Leverage enhanced geo coordinate to determine if an address match can be made.
Unmatched records will be loaded into GMT for verification and acceptance into AMS by the local AMS office.
6 Districts are currently piloting the validation process to ensure records are received and being updated in AMS appropriately.
Status updates will be provided monthly that shows how many records have been successfully added to the AMS database.
Address Authority Data Exchange
Phase I – ZIP + 4® Matches Targeted 80% validation by 9/30
Match w/o DPF:
AME Match w/o DPF match 2,816,331
AEC Match w/o DPF Match 342,078
Total Match w/o DPF 3,158,409
70
®
February 2018
MTAC Pulse of the Industry
Service performance Measurement

71
®
February 2018
Mail In Measurement
Approach to Increasing Mail in Measurement
72
®
February 2018
94%
83%
86%
49% 50% 51% 53%53%
57%60%
64%
69%
74%76%
79%82% 86% 87%
89% 89% 89% 90% 91% 90% 92% 92% 92% 92%
0%
10%
20%
30%
40%
50%
60%
70%
80%
90%
100%
Pe
rce
nta
ge o
f To
tal V
olu
me
th
at is
Fu
ll Se
rvic
e
FCM Letters & Cards FCM Flats MKT Letters MKT Flats PER Flats All Mail Types
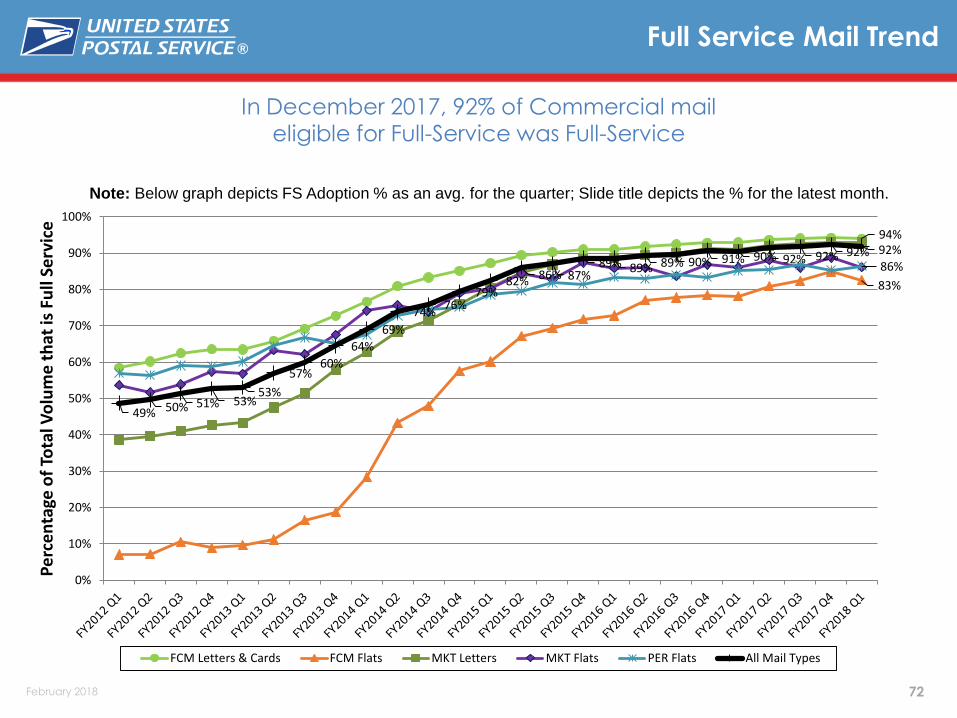
Note: Below graph depicts FS Adoption % as an avg. for the quarter; Slide title depicts the % for the latest month.
Full Service Mail Trend
In December 2017, 92% of Commercial mail eligible for Full-Service was Full-Service

73
®
February 2018
FY18 Q1 Commercial Mail VolumeMail In Measurement
In FY18 Q1, over 78% of Full-Service mail was in Measurement
Mail Class Mail Shape CommercialFull-Service
EligibleFull-Service In Measurement
% of Full-Service In Measurement
First Class Presort Letter/Card 9,749,483,116 9,372,407,989 8,977,992,193 6,635,144,431 73.90%
First Class Presort Flat 169,899,657 151,348,578 126,977,479 87,698,212 69.07%
USPS Marketing Letter 14,499,209,464 14,209,168,816 13,338,299,049 11,056,692,101 82.89%
USPS Marketing Flat 5,817,237,048 3,998,819,735 3,566,993,218 2,751,423,015 77.14%
Periodicals Flat 1,250,121,841 1,206,914,247 1,093,896,536 755,828,711 69.10%
Total 31,485,951,126 28,938,659,365 27,104,158,475 21,286,786,470 78.54%
Metrics are for Mailing Dates 10/1/2017 – 12/31/2017
Commercial and Full-Service Eligible Volumes sourced from PostalOne!

74
®
February 2018
M-in-M Network HQ Team
SPM – Priyanka Misri, John Nabor, Wayne Palmiter Accenture – Beau Rauch, Lisa Leu Marketing – Chip Brown III (MMS), Frank Montemayor (BMS), Phillip Parrish (MEPT) Networks – Prat Shah
Area Co-Coordinators (Mail Acceptance, Operations) CM – Danny Luc, Dmetrius Alexander EA – Barry Gilbert, Regis Curtin GL – Linda Bergeland, Drew Mason NE – Michelle Saracusa, Carla Edmonds PA – Claudia Munoz, Kelly Porter SO – Beth Baughman, Rick Bay WE – Ray Cordova, Jon Hummel
Resolution Chronology 03/2017 to 07/2017 – identify top 3 exclusion reasons for each mail class/shape and HQ team
investigate high volume site/mailer pairs for root cause and resolution
07/2018 – publish of HQ team results in Resolution Guide
08/2017 onward – investigate Field inquiries regarding published resolutions and update the Guide
11/2017 – complete L601 correction for LA, NJ, KC, and STL NDC’s for Invalid EPFED
11/2017 – complete Southern Area STC correction to FDB locale key and CSA’s for No Start-the-
Clock
01/2018 – eliminate Incorrect Entry Facility exclusion
02/2018 – initiate Field collaborations as method to develop resolutions for unresolved exclusions
03/2018 – implement resolution for Seamless BMEU entry for No Start-the-Clock
Pending – Long Haul exclusion dependent on completion of MVA Trailer Visibility application
Increase Mail In MeasurementTeams & Chronology

75
®
February 2018
Field Communications 07/2018 – publish Improved SPM Exclusions webpage
08/2018 onward – initiate and continue national focus on exclusion volume and
resolution efforts through monthly Area Co-Coordinator checkpoints. HQ team
participate in Area facilitated District Co-Coordinator checkpoints.
Field Tools 07/2018 – publish Resolution Guide for Commercial Mail Excluded from Measurement
(on 4th revision)
07/2018 – improve SPM Exclusions by Area analysis files (on 3rd revision)
Current Resolution Efforts Ongoing – Field analysis of exclusions and application of resolutions w/ HQ team
support
02/2018 – Field apply new resolution for SCF entry mail entered at co-located BMEU
02/2018 – HQ/Field collaboration w/ Omaha P&DC and North Texas P&DC to develop
resolutions for Inconsistent SPM Data and No Piece Scan exclusions for letters
02/2018 – initiate investigation into No Piece Scan exclusion for BPM
Results Mail in Measurement by FY: FY16 = 71.73%, FY17 = 74.88%, FY18 YTD = 78.50%
04/2017 – initiate I-MR charts to track monthly % included by mail class/shape
01/2018 – initiate national chart to track FY % and volume included by mail
class/shape
Increase Mail In MeasurementCommunications, Tools, Efforts, Results

76
®
February 2018
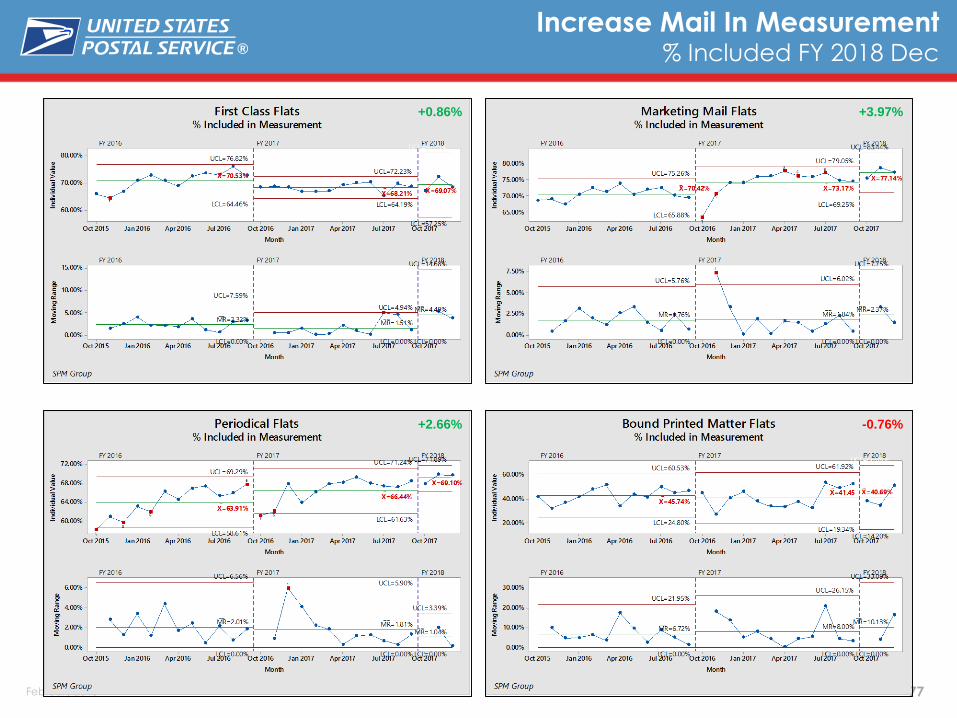
Increase Mail In Measurement% Included FY 2018 Dec
+3.33% +3.59%
+3.62% Acronyms & Symbols
I = Individual Values (top chart)
MR = Moving Range (bottom chart)
X ̅ = average I for the period
M ̅R ̅ = average MR for the period
UCL = upper control limit
LCL = lower control limit
77
®
February 2018
Increase Mail In Measurement% Included FY 2018 Dec
+0.86%
+2.66% -0.76%
+3.97%

78
®
February 2018
Increase Mail In MeasurementResults Update – FY 2018 Dec
District Exclusion Results (YTD Dec) FY 2017
AREA DISTRICT 07/08-09/30 YTD Oct 2017 Nov 2017 Dec 2017 Jan 2018 Feb 2018 Mar 2018 Apr 2018 May 2018 Jun 2018 Jul 2018 Aug 2018 Sep 2018
NATIONAL 23.89% 21.98% 22.59% 21.22% 22.14%
CAPITAL METRO 24.07% 22.54% 22.52% 21.96% 23.31%
EASTERN 22.90% 21.96% 21.00% 20.72% 24.84%
GREAT LAKES 26.64% 25.56% 26.45% 23.47% 27.02%
NORTHEAST 25.74% 22.87% 24.79% 20.65% 23.16%
PACIFIC 21.12% 18.24% 20.88% 16.93% 16.54%
SOUTHERN 27.35% 22.46% 23.25% 22.19% 21.83%
WESTERN 19.39% 19.95% 19.91% 21.43% 18.18%
FY 2018
FY Trends – National (YTD Dec)

79
®
February 2018
Service Diagnostics
80
®
February 2018
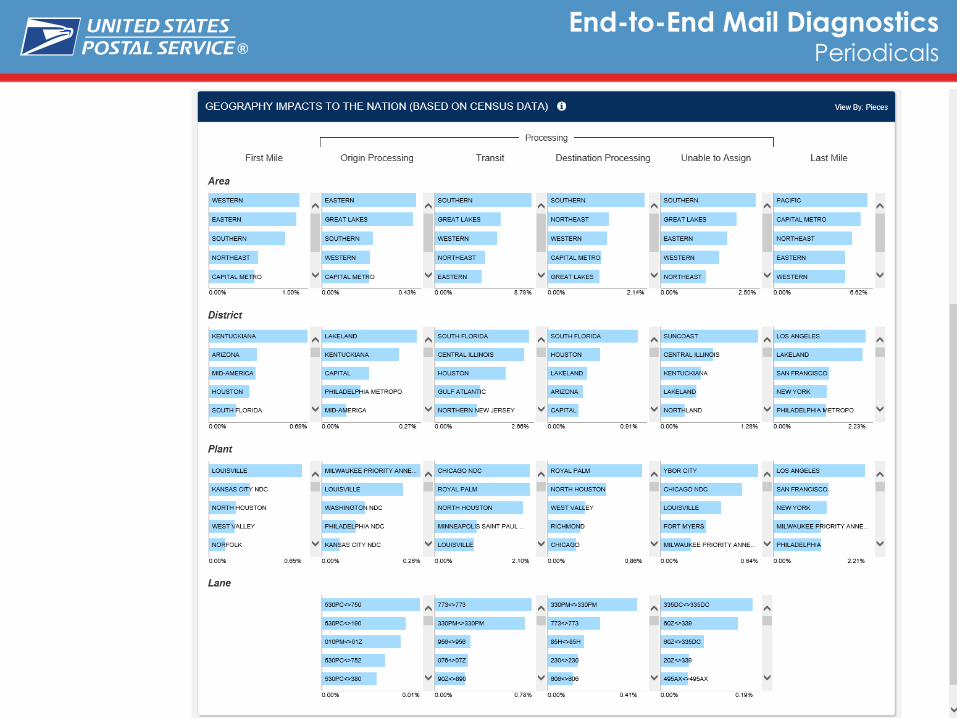
End-to-End Mail DiagnosticsPeriodicals

81
®
February 2018
Enterprise Analytics Service Performance
First-Class Mail

82
®
February 2018
Commercial First-Class Mail®
Performance by Quarter
Commercial First-Class Mail® FY13 thru FY18 PerformanceBy Quarter
Note: Preliminary FY18 Q2 through 1/26/18. Results starting FY17 Q1 are based on Days Left Group (DLG) approach, whereas all prior quarters’ results are based on Last Processing
Operation (LPO) approach. Service performance measurement was suspended for mail originating from or destined to Caribbean District starting 9/16/17 due to the devastating impacts of
Hurricanes Irma and Maria.
94.9
92.4
86.4
70
75
80
85
90
95
100
Q1 Q2 Q3 Q4 Q1 Q2 Q3 Q4 Q1 Q2 Q3 Q4 Q1 Q2 Q3 Q4 Q1 Q2 Q3 Q4 Q1 Q2
FY13 FY14 FY15 FY16 FY17 FY18
Pe
rcen
t O
n T
ime
Postal Quarter
Overnight Two-Day Three-to-Five-Day
California
Wildfire; Winter
Storm Chloe
Hurricane
Sandy
Hurricanes Harvey,
Irma, Jose and
Maria; No FedEx
air lift on July 3
Winter Storm
StellaWinter Storm
Jonas
Operation
Window Change
Winter storms
Grayson, Inga and
Jaxon; California
mudslides

83
®
February 2018
Enterprise Analytics Service Performance
First-Class Mail
Letters

84
®
February 2018
First-Class Mail® (Letters)
Score Trend
Service performance measurement was suspended for mail originating from or destined to Caribbean District in FY18 Q2 due to the devastating impacts of Hurricanes Irma and Maria.
98.03% 98.07% 98.67%97.04% 97.53% 97.49%
94.91%96.26%
97.67%
94.02%95.36% 94.68%
89.95% 88.75%
93.41%
86.71%
90.98%
87.14%
0
50
100
150
200
250
300
350
400
450
500
60%
65%
70%
75%
80%
85%
90%
95%
100%
12/16/17 12/23/17 12/30/17 1/6/18 1/13/18 1/20/18
Volu
me in
Millio
nsS
core
Pri
or
to L
ast M
ile
SPLY - Volume Overnight - Volume 2-Day - Volume 3-To-5-Day - Volume
Overnight 2-Day 3-To-5-Day
Q2TD thru 1/26/18Total Pieces
Measured
Processing
On-Time
Last Mile
Impact
Overall
Score
Target
Score
SPLY Pieces
Measured
Volume
Change
SPLY
Overall
QTD Score
SPLY
Change
Presort Overnight 214,684,469 97.59% -2.43% 95.16% 96.80% 217,477,591 -1.28% 96.06% -0.90%
Presort 2-Day 421,620,516 95.16% -2.48% 92.68% 96.50% 399,218,500 5.61% 95.01% -2.33%
Presort 3-to-5-Day 1,518,700,548 89.00% -2.36% 86.64% 95.25% 1,393,810,826 8.96% 91.00% -4.36%
3-Day 1,510,592,823 88.98% -2.36% 86.62% 95.25% 1,385,423,086 9.03% 91.00% -4.37%
4-Day 7,759,516 93.02% -1.68% 91.34% 95.25% 8,004,002 -3.05% 92.78% -1.44%
5-Day 348,209 75.26% -1.80% 73.46% 95.25% 383,738 -9.26% 84.07% -10.61%
Presort Total 2,155,005,533 88.67% 96.00% 2,010,506,917 7.19% 92.35% -3.68%

85
®
February 2018
Last Mile Impact Trend
First-Class Mail® (Letters) Last Mile Impact Trend
Note: Commercial mail results starting week ending 10/28/16 are based on Days Left Group (DLG) approach, whereas all prior weeks’ results are based on Last Processing
Operation (LPO) approach. Service performance measurement was suspended for mail originating from or destined to Caribbean District starting 9/16/17 due to the devastating
impacts of Hurricanes Irma and Maria.
0.0%
0.5%
1.0%
1.5%
2.0%
2.5%
3.0%
La
st M
ile I
mpact
Postal Week
FCM Overnight FCM 2-Day FCM 3-To-5-Day
Hurricanes
Irma and Maria

86
®
February 2018Note: Service performance results before Last Mile. Q2TD Scores through 1/26/18. Service performance measurement was suspended for mail originating from or destined to Caribbean
District in FY18 Q2 due to the devastating impacts of Hurricanes Irma and Maria.
All Q2TD FCM Letters scores would be above 96.94% (prior to last mile), if pieces that failed by 1 day passed
First-Class Mail® (Letters) Service Variance
97.59%
95.16%
89.00%
99.50% 98.85%
96.94%
99.77% 99.61% 98.98%99.86% 99.80% 99.57%
60%
65%
70%
75%
80%
85%
90%
95%
100%
Overnight 2-Day 3-To-5-Day
QTD Score If Service Variance +1 If Service Variance +2 If Service Variance +3

87
®
February 2018
Enterprise Analytics Service Performance
First-Class Mail
Flats

88
®
February 2018
First-Class Mail® (Flats)
Score Trend
Service performance measurement was suspended for mail originating from or destined to Caribbean District in FY18 Q2 due to the devastating impacts of Hurricanes Irma and Maria.
86.64%89.60%
91.01%84.56%
88.09% 87.30%
88.57%88.27%
91.97%
81.42% 86.45% 85.52%80.42% 80.75%
83.91%
77.54% 82.52%73.74%
0
1
2
3
4
5
6
7
60%
65%
70%
75%
80%
85%
90%
95%
100%
12/16/17 12/23/17 12/30/17 1/6/18 1/13/18 1/20/18
Volu
me in
Millio
ns
Sco
re P
rio
r to
La
st M
ile
SPLY - Volume Overnight - Volume 2-Day - Volume 3-To-5-Day - Volume
Overnight 2-Day 3-To-5-Day
Q2TD thru
1/26/18
Total Pieces
Measured
Processing
On-Time
Last Mile
Impact
Overall
Score
Target
Score
SPLY Pieces
Measured
Volume
Change
SPLY Overall
QTD Score
SPLY
Change
Presort Overnight 1,529,036 87.14% -8.43% 78.71% 96.80% 1,646,100 -7.11% 83.28% -4.57%
Presort 2-Day 5,186,814 85.44% -9.49% 75.95% 96.50% 5,085,167 2.00% 82.25% -6.30%
Presort 3-to-5-Day 17,820,120 78.93% -8.44% 70.49% 95.25% 18,233,208 -2.27% 76.53% -6.04%
3-Day 17,752,746 78.91% -8.44% 70.47% 95.25% 18,152,049 -2.20% 76.50% -6.02%
4-Day 65,219 84.57% -8.00% 76.57% 95.25% 78,445 -16.86% 83.70% -7.13%
5-Day 2,155 84.18% -8.22% 75.96% 95.25% 2,714 -20.60% 82.76% -6.80%
Presort Total 24,535,970 72.16% 96.00% 24,964,475 -1.72% 78.14% -5.98%

89
®
February 2018
Last Mile Impact Trend
First-Class Mail® (Flats) Last Mile Impact Trend
Note: Commercial mail results starting week ending 10/28/16 are based on Days Left Group (DLG) approach, whereas all prior weeks’ results are based on Last Processing
Operation (LPO) approach. Service performance measurement was suspended for mail originating from or destined to Caribbean District starting 9/16/17 due to the devastating
impacts of Hurricanes Irma and Maria.
0.0%
2.0%
4.0%
6.0%
8.0%
10.0%
12.0%
La
st M
ile I
mpact
Postal Week
FCM Overnight FCM 2-Day FCM 3-To-5-Day
90
®
February 2018
0.0%
2.0%
4.0%
6.0%
8.0%
10.0%
12.0%
La
st M
ile I
mpact
Postal Week
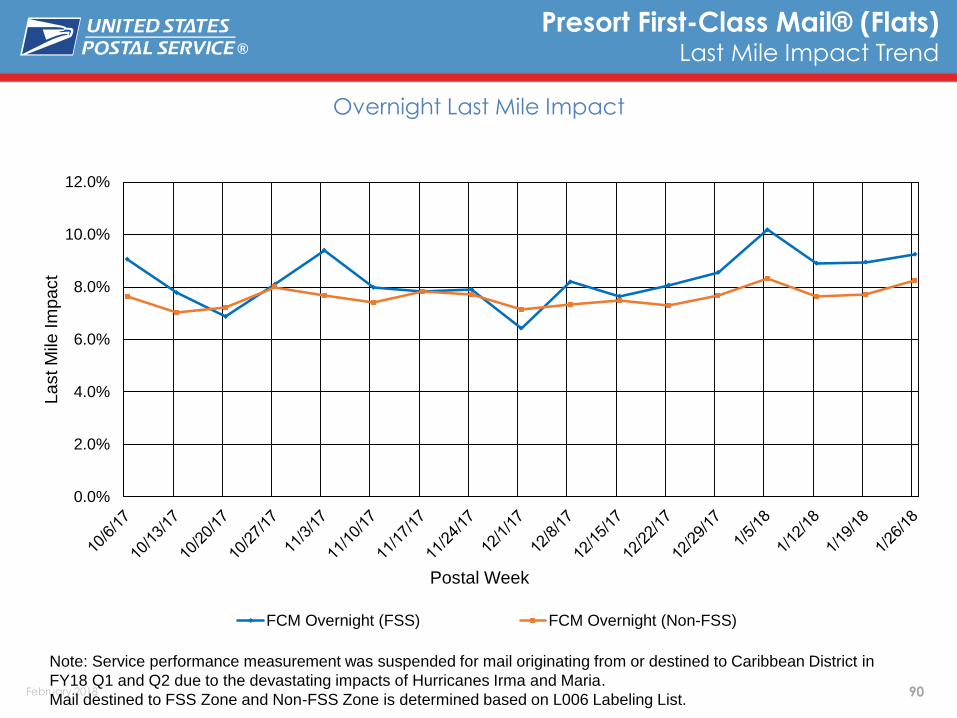
FCM Overnight (FSS) FCM Overnight (Non-FSS)
Note: Service performance measurement was suspended for mail originating from or destined to Caribbean District in
FY18 Q1 and Q2 due to the devastating impacts of Hurricanes Irma and Maria.
Mail destined to FSS Zone and Non-FSS Zone is determined based on L006 Labeling List.
Presort First-Class Mail® (Flats) Last Mile Impact Trend
Overnight Last Mile Impact

91
®
February 2018
0.0%
2.0%
4.0%
6.0%
8.0%
10.0%
12.0%
La
st M
ile I
mpact
Postal Week
FCM 2-Day (FSS) FCM 2-Day (Non-FSS)
Note: Service performance measurement was suspended for mail originating from or destined to Caribbean District in
FY18 Q1 and Q2 due to the devastating impacts of Hurricanes Irma and Maria.
Mail destined to FSS Zone and Non-FSS Zone is determined based on L006 Labeling List.
Presort First-Class Mail® (Flats) Last Mile Impact Trend
Two-Day Last Mile Impact
92
®
February 2018
0.0%
1.0%
2.0%
3.0%
4.0%
5.0%
6.0%
7.0%
8.0%
9.0%
10.0%
La
st M
ile I
mpact
Postal Week
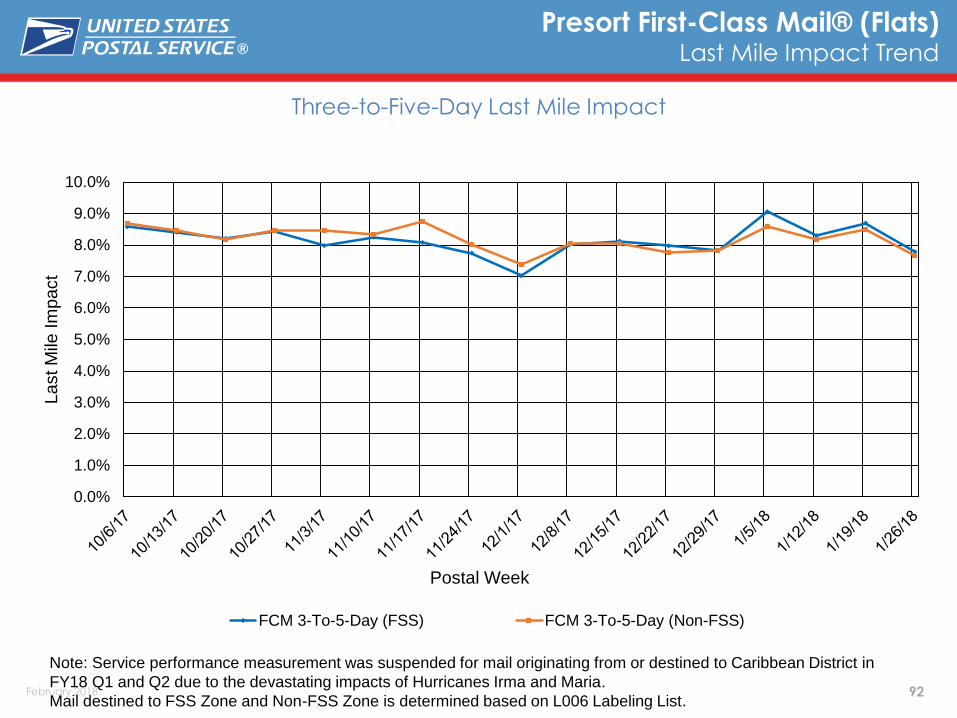
FCM 3-To-5-Day (FSS) FCM 3-To-5-Day (Non-FSS)
Note: Service performance measurement was suspended for mail originating from or destined to Caribbean District in
FY18 Q1 and Q2 due to the devastating impacts of Hurricanes Irma and Maria.
Mail destined to FSS Zone and Non-FSS Zone is determined based on L006 Labeling List.
Presort First-Class Mail® (Flats) Last Mile Impact Trend
Three-to-Five-Day Last Mile Impact
93
®
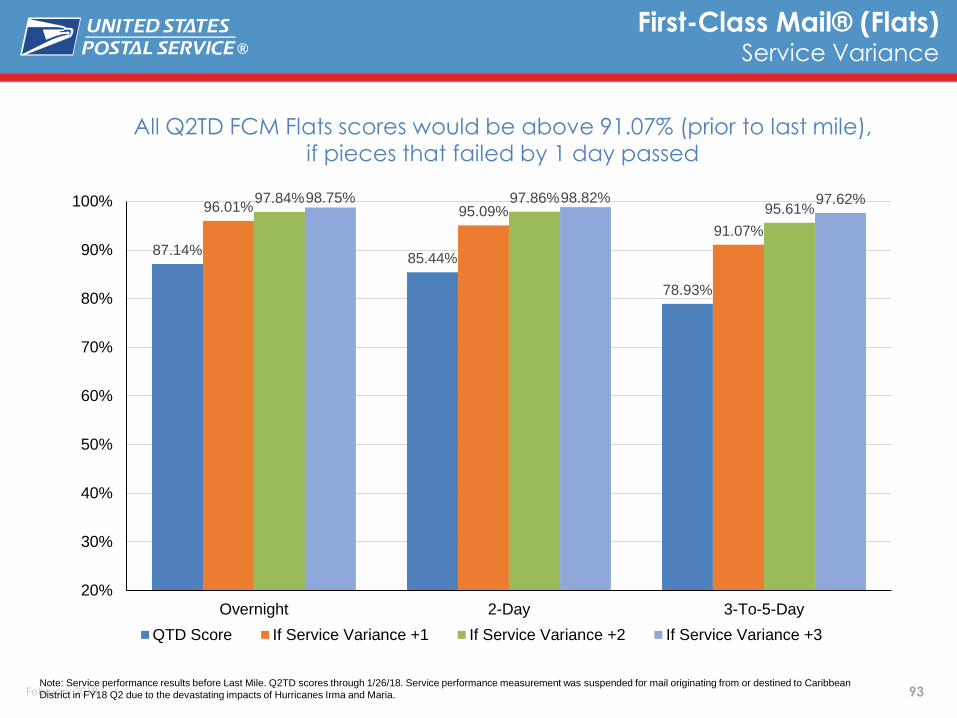
February 2018Note: Service performance results before Last Mile. Q2TD scores through 1/26/18. Service performance measurement was suspended for mail originating from or destined to Caribbean
District in FY18 Q2 due to the devastating impacts of Hurricanes Irma and Maria.
All Q2TD FCM Flats scores would be above 91.07% (prior to last mile), if pieces that failed by 1 day passed
First-Class Mail® (Flats) Service Variance
87.14%85.44%
78.93%
96.01% 95.09%
91.07%
97.84% 97.86%95.61%
98.75% 98.82% 97.62%
20%
30%
40%
50%
60%
70%
80%
90%
100%
Overnight 2-Day 3-To-5-Day
QTD Score If Service Variance +1 If Service Variance +2 If Service Variance +3

94
®
February 2018
Thank You!

95
®
February 2018
Appendix

96
®
February 2018
IMpb Compliance Visualization
Dashboard Demo
Explore the possibility of providing a way for mailers to see quality metrics through a D3?
Visualization:
The current visualization will display a summary of the monthly IMpb Compliance Indicators (AQ, MQ, & BQ)
Mailers will be able to drill down to view compliance data at a state level which highlights IMpb compliance
issues by geographic location
http://56.72.7.32:9100/YK/Project_VII/versio
n_20180222/app/
IMPB DASHBOARD DEMO

97
®
February 2018
MTAC
February 2018
Periodicals

98
®
February 2018
MTAC Discussion Topics
All Classes
Bundle breakage data
Two sets of service data for disasters
Report that shows volume of automation flats in manual
The Future of Informed Visibility
Mail in Measurement Scorecard

99
®
February 2018
Informed Visibility Update

100
®
February 2018
Informed Visibility® Update
IV – our single source for near real-time data
Over 1,138 new mailers joined IV
since July 1, 2017!
+250 Million daily Logical Delivery
Events provided daily through IV-MTR
data feeds
1.1 Billion scan records processed
daily by IV
THANK YOU to industry partners!

101
®
February 2018
Informed Visibility Roadmap
Proposed Cadence of Application
Scope Review will be provided 4 weeks prior and will include:
Web changes – review wireframes
Data changes – review new fields that will be available
Demo and Documentation Preview will provided 1 - 2 weeks prior and
include:
Updates to User Guide
Updates to Data Feed
Specifications:
• Data Dictionary
• Sample Files /
xml Messages,
• any new Op Codes
Scope Review
Demo &
Documentation
Preview
Release Date
1/19/18 2/2/18 2/17/18
3/2/18 3/16/18 4/1/18
4/13/18 4/27/18 5/12/18
5/25/18 6/8/18 6/23/18

102
®
February 2018
No Piece Scan
103
®
February 2018
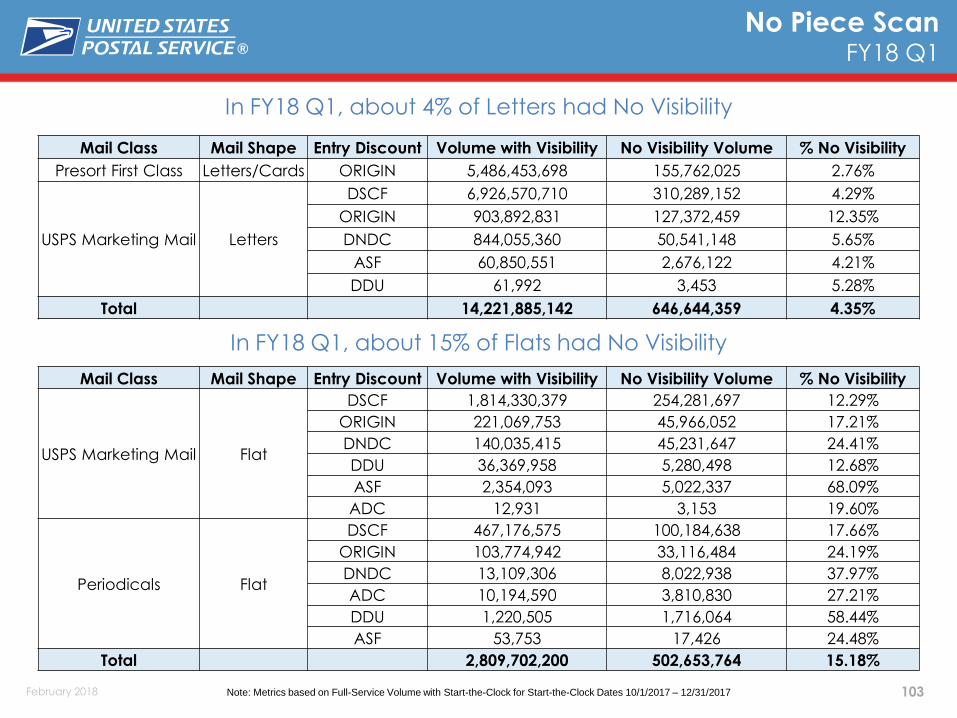
No Piece ScanFY18 Q1
In FY18 Q1, about 4% of Letters had No Visibility
Note: Metrics based on Full-Service Volume with Start-the-Clock for Start-the-Clock Dates 10/1/2017 – 12/31/2017
Mail Class Mail Shape Entry Discount Volume with Visibility No Visibility Volume % No Visibility
Presort First Class Letters/Cards ORIGIN 5,486,453,698 155,762,025 2.76%
USPS Marketing Mail Letters
DSCF 6,926,570,710 310,289,152 4.29%
ORIGIN 903,892,831 127,372,459 12.35%
DNDC 844,055,360 50,541,148 5.65%
ASF 60,850,551 2,676,122 4.21%
DDU 61,992 3,453 5.28%
Total 14,221,885,142 646,644,359 4.35%
Mail Class Mail Shape Entry Discount Volume with Visibility No Visibility Volume % No Visibility
USPS Marketing Mail Flat
DSCF 1,814,330,379 254,281,697 12.29%
ORIGIN 221,069,753 45,966,052 17.21%
DNDC 140,035,415 45,231,647 24.41%
DDU 36,369,958 5,280,498 12.68%
ASF 2,354,093 5,022,337 68.09%
ADC 12,931 3,153 19.60%
Periodicals Flat
DSCF 467,176,575 100,184,638 17.66%
ORIGIN 103,774,942 33,116,484 24.19%
DNDC 13,109,306 8,022,938 37.97%
ADC 10,194,590 3,810,830 27.21%
DDU 1,220,505 1,716,064 58.44%
ASF 53,753 17,426 24.48%
Total 2,809,702,200 502,653,764 15.18%
In FY18 Q1, about 15% of Flats had No Visibility

104
®
February 2018
Periodicals
Deep Dive on No Piece Scan by Entry Type

105
®
February 2018
FY18 Q1 Periodicals Visibility FlowsMetrics by Entry Discount Type
Note: Metrics based on Full-Service Volume with Start-the-Clock for Start-the-Clock Dates 10/1/2017 – 12/31/2017
In FY18 Q1, about 20% of Periodicals did not have any visibility at the
piece level
DDU Entry had the highest % of Periodicals which did not have any
piece level visibility
Breakdown by Entry Type:
Entry Discount Type
% withNo Visibility
% withBundle Visibility
% withFSS Visibility
% withAFSM Visibility
% withOther Visibility
DSCF 17.66% 46.21% 18.64% 17.37% 0.13%
ORIGIN 24.19% 28.46% 10.97% 35.75% 0.62%
DNDC 37.97% 35.68% 7.05% 19.20% 0.10%
ADC 27.21% 28.77% 6.51% 37.39% 0.12%
DDU 58.44% 33.87% 0.04% 0.07% 7.58%
ASF 24.48% 20.25% 1.43% 53.66% 0.18%
Total 19.78% 42.26% 16.59% 21.12% 0.25%
106
®
February 2018
Manual Bullpen Scanning
Mail & Package Visibility

107
®
February 2018
Operation 110 – Initial Breakdown
Operation 126 – Dispatch
Manual Bullpen Visibility
Manual Operation Numbers
Nesting and Visibility
Proof-Of-Concept testing underway in two plants (Two scanner solutions)
Scanning Container Placards or Tray/Sack Labels > Nesting
Dependencies:
Full Service Mailings
eDoc Accuracy and Barcode Readability
Challenges relative to “Turnaround” Mail – Mailer is dropping Handling Units from eDoc at Delivery Units as well as origin plant

108
®
February 2018
Mail Visibility Applications (MVA)

109
®
February 2018
Mail Visibility Applications (MVA)
Two internal mobile applications launched in September 2017:
• Mail History Application
• Employees can use their USPS mobile devices to retrieve near real-time delivery information by scanning barcodes for containers, mail handling units, and single mail pieces
• Enhanced Barcode Diagnostics Application
• Employees can use their USPS mobile devices to scan barcodes to retrieve diagnostic data of the visible elements of the barcodes scanned and highlight invalid data elements
USPS is currently considering how to address long hauls.

110
®
February 2018
Addressing & Geospatial Technology

111
®
February 2018
CASS / MASS Cycle O
Informed Delivery
Address Authority Data Exchange
Periodicals

112
®
February 2018
Cycle O Highlights

113
®
February 2018
Enhanced Identification of:
PO Box only delivery ZIP Codes
R777 phantom route & “No-Stat” addresses
Door Not Accessible, No Secure Location, & Non-Delivery Days
Standardization & DPV® confirmation of:
PBSA – PO Box street address
CMRA – PMB identifier & DPV confirmation
Single trailing alpha on a primary number
New military addresses “OMC” & “UMR”
CASS™/MASS™ Cycle O
Cycle O – Highlights
114
®
February 2018
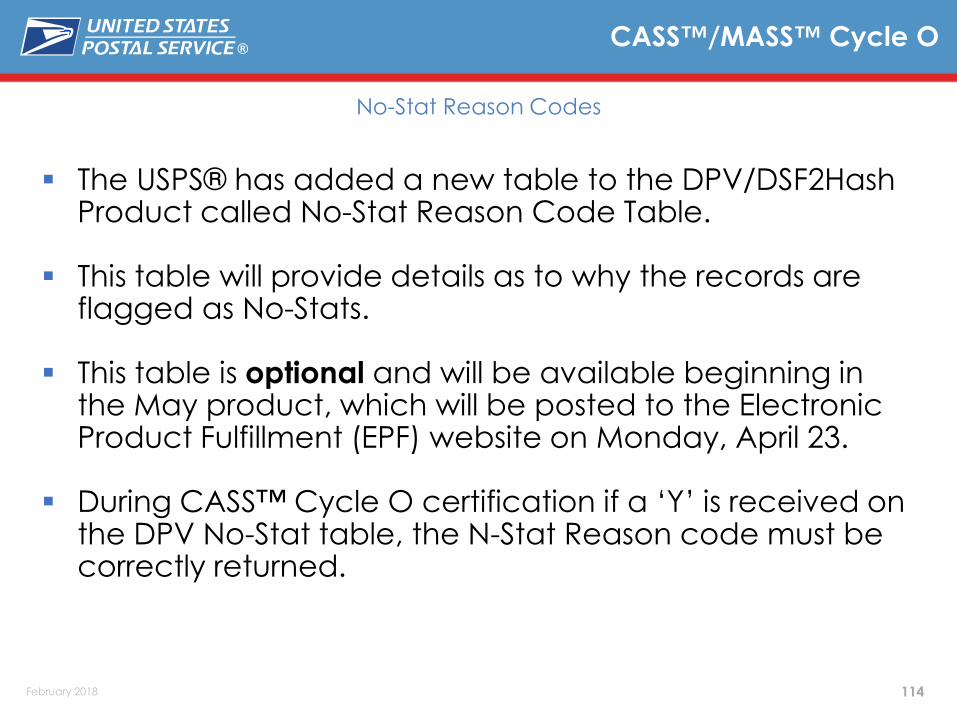
The USPS® has added a new table to the DPV/DSF2Hash Product called No-Stat Reason Code Table.
This table will provide details as to why the records are flagged as No-Stats.
This table is optional and will be available beginning in the May product, which will be posted to the Electronic Product Fulfillment (EPF) website on Monday, April 23.
During CASS™ Cycle O certification if a ‘Y’ is received on the DPV No-Stat table, the N-Stat Reason code must be correctly returned.
CASS™/MASS™ Cycle O
No-Stat Reason Codes

115
®
February 2018
CASS™/MASS™ Cycle O
No-Stat Reason Code Definitions
Reason Code Code Description
0 – Regular No-StatIndicates addresses not receiving delivery and the addresses are not
counted as possible deliveries.
1 – IDA (Internal Drop Address)These are addresses that do not receive mail delivery directly from the
USPS, but are delivered to a drop address that services them.
2 – CDS No-Stat
These are addresses that have not yet become deliverable. For
example, a new subdivision where lots and primary numbers have
been determined, but no structure exists yet for occupancy.
3 – Collision
These addresses do not actually DPV confirm. In this case, the ‘Y’
should be set to an ‘N’ on the DPV ‘A’ table and all other table values
should be blank.
4 – CMZ (College, Military
and other types)
These are ZIP + 4® records USPS has incorporated into the data as
logical delivery points but not serviced directly by USPS.

116
®
February 2018
Redefine DPV Codes to better indicate the reason an address did not produce a “Y” return code.
Current Definitions:
“Y” – Address was DPV confirmed for both primary and (if present) secondary numbers
“D” – Address was DPV confirmed for the primary number only and the secondary number is required but missing.
“S” – Address was DPV confirmed for the primary number. A secondary number was present but unconfirmed.
• (This led to confusion as whether a secondary was required or not.)
New Definitions: (Codes to be determined)
“S” – Address had a secondary number that was not confirmed and was not needed with the primary address number.
“New1” – Address had a secondary number that was not confirmed but a valid secondary number was needed with the primary address number.
“New2 ” – Address was confirmed (ex: R777) but USPS mail delivery is not made to this address.
CASS™/MASS™ Cycle O
DPV® Return Code Enhancements

117
®
February 2018
CASS™/MASS™ Cycle O
Tentative Schedule
CASS Cycle “O” Pre-Meeting February 23 2018
Partnership In Tomorrow (PIT) Meeting May 1 2018
NCOALink® PIT May 8 2018
Official Rules Release June 1 2018
Send Static Data September 30 2018
CASS & NCOALink Stage I Release October 31 2018
CASS & NCOALink Stage II Release February 28 2019
MASS Test Decks Available September 30 2019
CASS Developers Certification Completed December 31 2019
MASS Manufacturers Certification Completed January 31 2020
Software Released to End-users NLT March 31 2020
Expiration of CASS™ Cycle N July 31 2020
Implementation of CASS Cycle O August 1 2020

118
®
February 2018
Informed Delivery

119
®
February 2018
Definition
Address records that are currently coded in the AMS database that share the same 11-digit delivery point. These addresses are currently ineligible for participation in the Informed Delivery program.
Objective
Resolve the 11-digit conflicts to allow address records to become eligible to participate in the Informed Delivery program.
Informed Delivery 11-Digit Conflicts
11-Digit De-conflicts
2,354,501
5,213,346
TOTAL DP CONFLICTS TOTAL ADDRESS RECORDS
120
®
February 2018
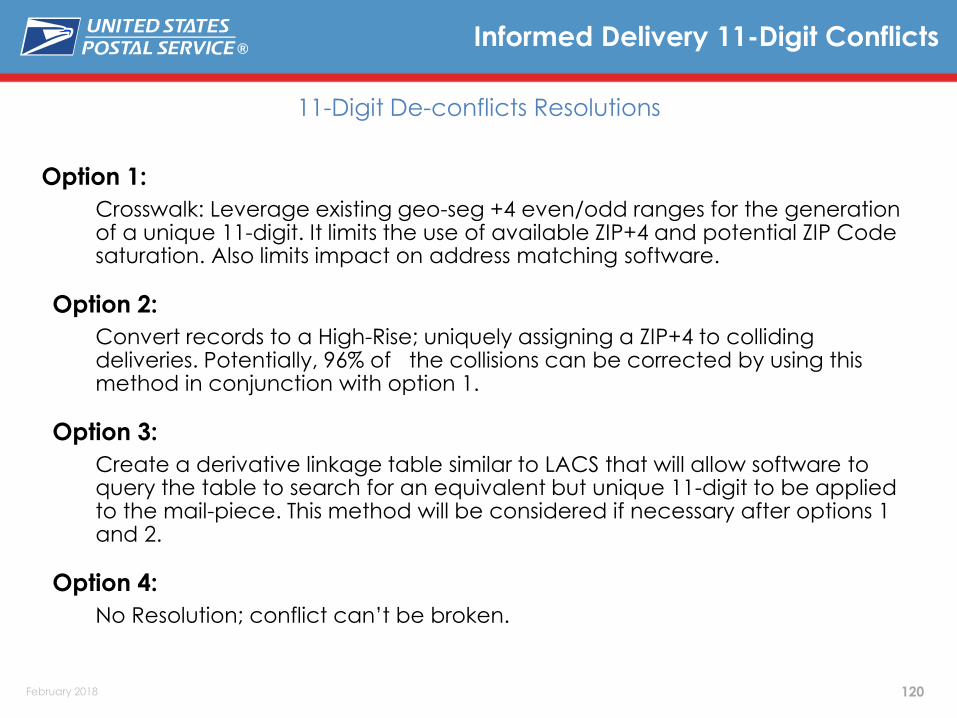
Option 1:
Crosswalk: Leverage existing geo-seg +4 even/odd ranges for the generation of a unique 11-digit. It limits the use of available ZIP+4 and potential ZIP Code saturation. Also limits impact on address matching software.
Option 2:
Convert records to a High-Rise; uniquely assigning a ZIP+4 to colliding deliveries. Potentially, 96% of the collisions can be corrected by using this method in conjunction with option 1.
Option 3:
Create a derivative linkage table similar to LACS that will allow software to query the table to search for an equivalent but unique 11-digit to be applied to the mail-piece. This method will be considered if necessary after options 1 and 2.
Option 4:
No Resolution; conflict can’t be broken.
Informed Delivery 11-Digit Conflicts
11-Digit De-conflicts Resolutions

121
®
February 2018
Informed Delivery 11-Digit De-confliction
11-Digit De-conflicts Resolutions and Breakdown

122
®
February 2018
There are 64 ZIP Codes with 11-Digit Conflicts in the Chicago District. These ZIPs have the highest potential for implementing ZIP splits as a result of the de-conflicting effort if using the unique ZIP+4 assignment effort.
Informed Delivery 11-Digit De-confliction
ZIP Codes with Highest Percentage of Conflicts
ZIP CODETOTAL
CONFLICTS
60618 13,814
60647 11,802
60625 9,632
60629 8,972
60639 8,757
60623 7,844
60619 7,729
Seven largest ZIP Codes with
Conflicts for Chicago District

123
®
February 2018
There are 159 ZIP Codes with 11-Digit Conflicts in the New York Metro Area. These ZIPs have the highest potential for implementing ZIP splits as a result of the de-conflicting effort if using the unique ZIP+4 is assignment effort.
Informed Delivery 11-Digit De-confliction
ZIP Codes with Highest Percentage of Conflicts
ZIP CODETOTAL
CONFLICTS
11236 12,222
11234 9,141
11214 8,768
11221 7,321
11219 6,923
11208 6,575
11233 6,060
Seven Largest ZIP Codes with
Conflicts for New York Metro Area

124
®
February 2018
Address AuthorityData Exchange (AADE)

125
®
February 2018
Partner with the Department of Transportation, and their efforts, to create the National Address Database.
Compare address data received from the DOT National Address Database (NAD) to the USPS® Delivery Point File (DPF) database. Unmatched records will be researched and validated to be potentially added to AMS as a valid delivery point.
Address Authority Data Exchange
Objective

126
®
February 2018
Address Authority Data Exchange
NAD Data Breakdown Currently representing 13 States
Total Addresses Received from NAD 42,281,449
with
DPF
DPF Match before AME and AEC 30,965,575
DPF Match after AME 4,789,352
DPF Match after AEC 949,918
Total DPF 36,704,845
Match w/o
DPF
AME Match w/o DPF match 2,816,331
AEC Match w/o DPF Match 342,078
Total Match w/o DPF 3,158,409
No MatchAEC no match (could not resolve) 2,418,195
Bad Address (Missing ZIP and Address) 956,764

127
®
February 2018
Research and validate records that match a current ZIP + 4 range, but do not match to DPF
Leverage enhanced geo coordinate to determine if an address match can be made.
Unmatched records will be loaded into GMT for verification and acceptance into AMS by the local AMS office.
6 Districts are currently piloting the validation process to ensure records are received and being updated in AMS appropriately.
Status updates will be provided monthly that shows how many records have been successfully added to the AMS database.
Address Authority Data Exchange
Phase I – ZIP + 4® Matches Targeted 80% validation by 9/30
Match w/o DPF:
AME Match w/o DPF match 2,816,331
AEC Match w/o DPF Match 342,078
Total Match w/o DPF 3,158,409

128
®
February 2018
Periodicals
129
®
February 2018
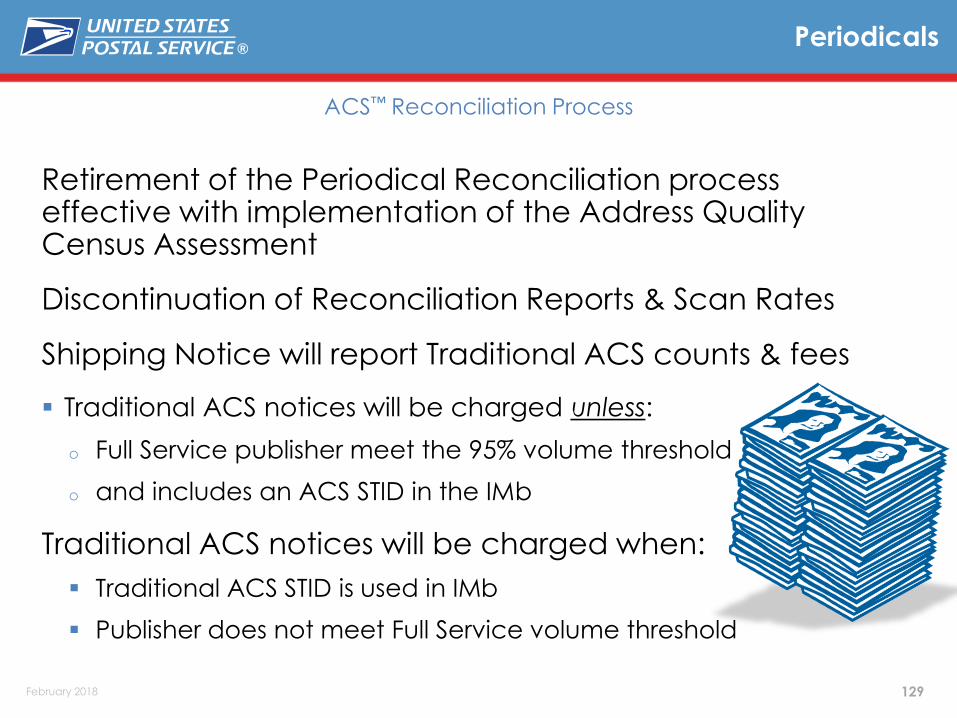
Retirement of the Periodical Reconciliation process effective with implementation of the Address Quality Census Assessment
Discontinuation of Reconciliation Reports & Scan Rates
Shipping Notice will report Traditional ACS counts & fees
Traditional ACS notices will be charged unless:
o Full Service publisher meet the 95% volume threshold
o and includes an ACS STID in the IMb
Traditional ACS notices will be charged when:
Traditional ACS STID is used in IMb
Publisher does not meet Full Service volume threshold
Periodicals
ACS™ Reconciliation Process

130
®
February 2018
Effective with the Address Quality Census Measurement & Assessment Process implementation:
PS Forms 3579 will be charged when Manual Corrections are requested or required
PS Form 3579 notices are generated when:
• IMb™ contains a Manual Corrections Service Type ID (STID)
• Invalid IMb, No IMb, or IMb Unreadable
• IMb contains a Traditional ACS STID but:
• No Participant ID
• Invalid Participant ID &/or Keyline
• Unreadable Participant ID &/or Keyline
The font* used for the Participant ID & Keyline is critical
Periodicals
PS Form 3579
* DMM 507.4.2.5b “non-narrow variant of Helvetica or Arial sans serif font in the range of 10 to 12 points.”
131
®
February 2018
Periodicals
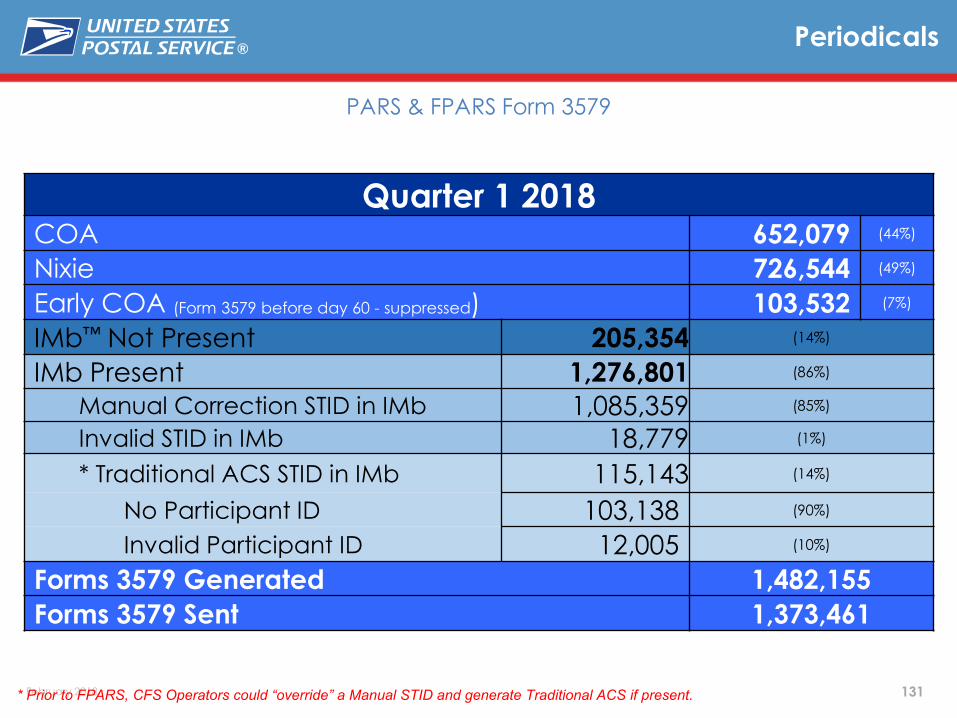
PARS & FPARS Form 3579
Quarter 1 2018COA 652,079 (44%)
Nixie 726,544 (49%)
Early COA (Form 3579 before day 60 - suppressed) 103,532 (7%)
IMb™ Not Present 205,354 (14%)
IMb Present 1,276,801 (86%)
Manual Correction STID in IMb 1,085,359 (85%)
Invalid STID in IMb 18,779 (1%)
* Traditional ACS STID in IMb 115,143 (14%)
No Participant ID 103,138 (90%)
Invalid Participant ID 12,005 (10%)
Forms 3579 Generated 1,482,155
Forms 3579 Sent 1,373,461
* Prior to FPARS, CFS Operators could “override” a Manual STID and generate Traditional ACS if present.

132
®
February 2018
MTAC Pulse of the Industry
Service performance Measurement

133
®
February 2018
Mail In Measurement
Approach to Increasing Mail in Measurement

134
®
February 2018
94%
83%
86%
49% 50% 51% 53%53%
57%60%
64%
69%
74%76%
79%82% 86% 87%
89% 89% 89% 90% 91% 90% 92% 92% 92% 92%
0%
10%
20%
30%
40%
50%
60%
70%
80%
90%
100%
Pe
rce
nta
ge o
f To
tal V
olu
me
th
at is
Fu
ll Se
rvic
e
FCM Letters & Cards FCM Flats MKT Letters MKT Flats PER Flats All Mail Types
Note: Below graph depicts FS Adoption % as an avg. for the quarter; Slide title depicts the % for the latest month.
Full Service Mail Trend
In December 2017, 92% of Commercial mail eligible for Full-Service was Full-Service

135
®
February 2018
FY18 Q1 Commercial Mail VolumeMail In Measurement
In FY18 Q1, over 78% of Full-Service mail was in Measurement
Mail Class Mail Shape CommercialFull-Service
EligibleFull-Service In Measurement
% of Full-Service In Measurement
First Class Presort Letter/Card 9,749,483,116 9,372,407,989 8,977,992,193 6,635,144,431 73.90%
First Class Presort Flat 169,899,657 151,348,578 126,977,479 87,698,212 69.07%
USPS Marketing Letter 14,499,209,464 14,209,168,816 13,338,299,049 11,056,692,101 82.89%
USPS Marketing Flat 5,817,237,048 3,998,819,735 3,566,993,218 2,751,423,015 77.14%
Periodicals Flat 1,250,121,841 1,206,914,247 1,093,896,536 755,828,711 69.10%
Total 31,485,951,126 28,938,659,365 27,104,158,475 21,286,786,470 78.54%
Metrics are for Mailing Dates 10/1/2017 – 12/31/2017
Commercial and Full-Service Eligible Volumes sourced from PostalOne!
136
®
February 2018
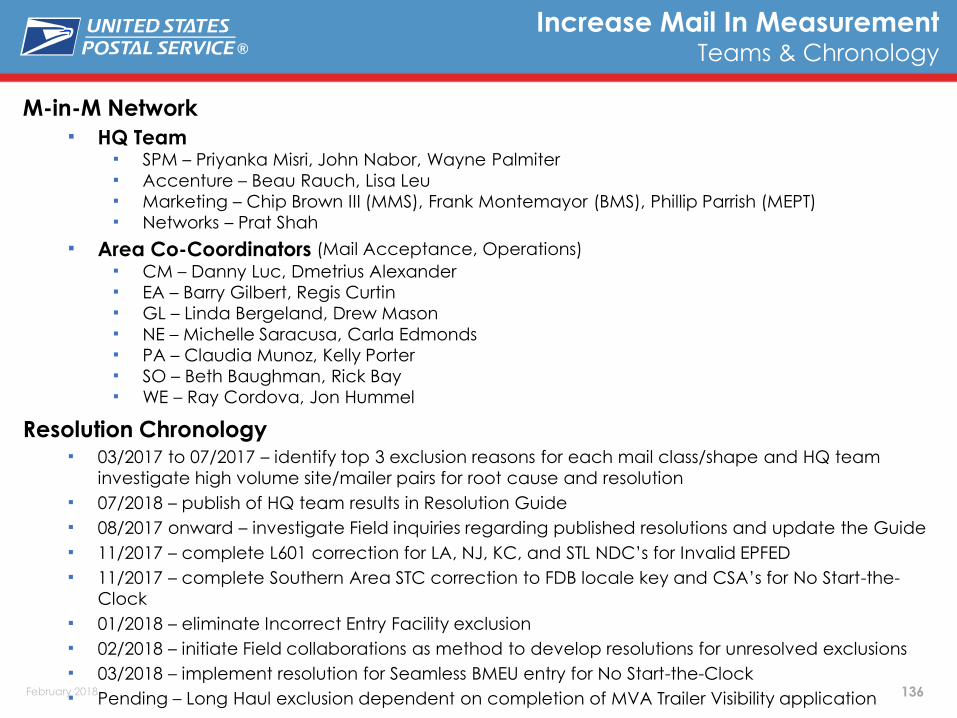
M-in-M Network HQ Team
SPM – Priyanka Misri, John Nabor, Wayne Palmiter Accenture – Beau Rauch, Lisa Leu Marketing – Chip Brown III (MMS), Frank Montemayor (BMS), Phillip Parrish (MEPT) Networks – Prat Shah
Area Co-Coordinators (Mail Acceptance, Operations) CM – Danny Luc, Dmetrius Alexander EA – Barry Gilbert, Regis Curtin GL – Linda Bergeland, Drew Mason NE – Michelle Saracusa, Carla Edmonds PA – Claudia Munoz, Kelly Porter SO – Beth Baughman, Rick Bay WE – Ray Cordova, Jon Hummel
Resolution Chronology 03/2017 to 07/2017 – identify top 3 exclusion reasons for each mail class/shape and HQ team
investigate high volume site/mailer pairs for root cause and resolution
07/2018 – publish of HQ team results in Resolution Guide
08/2017 onward – investigate Field inquiries regarding published resolutions and update the Guide
11/2017 – complete L601 correction for LA, NJ, KC, and STL NDC’s for Invalid EPFED
11/2017 – complete Southern Area STC correction to FDB locale key and CSA’s for No Start-the-
Clock
01/2018 – eliminate Incorrect Entry Facility exclusion
02/2018 – initiate Field collaborations as method to develop resolutions for unresolved exclusions
03/2018 – implement resolution for Seamless BMEU entry for No Start-the-Clock
Pending – Long Haul exclusion dependent on completion of MVA Trailer Visibility application
Increase Mail In MeasurementTeams & Chronology

137
®
February 2018
Field Communications 07/2018 – publish Improved SPM Exclusions webpage
08/2018 onward – initiate and continue national focus on exclusion volume and
resolution efforts through monthly Area Co-Coordinator checkpoints. HQ team
participate in Area facilitated District Co-Coordinator checkpoints.
Field Tools 07/2018 – publish Resolution Guide for Commercial Mail Excluded from Measurement
(on 4th revision)
07/2018 – improve SPM Exclusions by Area analysis files (on 3rd revision)
Current Resolution Efforts Ongoing – Field analysis of exclusions and application of resolutions w/ HQ team
support
02/2018 – Field apply new resolution for SCF entry mail entered at co-located BMEU
02/2018 – HQ/Field collaboration w/ Omaha P&DC and North Texas P&DC to develop
resolutions for Inconsistent SPM Data and No Piece Scan exclusions for letters
02/2018 – initiate investigation into No Piece Scan exclusion for BPM
Results Mail in Measurement by FY: FY16 = 71.73%, FY17 = 74.88%, FY18 YTD = 78.50%
04/2017 – initiate I-MR charts to track monthly % included by mail class/shape
01/2018 – initiate national chart to track FY % and volume included by mail
class/shape
Increase Mail In MeasurementCommunications, Tools, Efforts, Results
138
®
February 2018
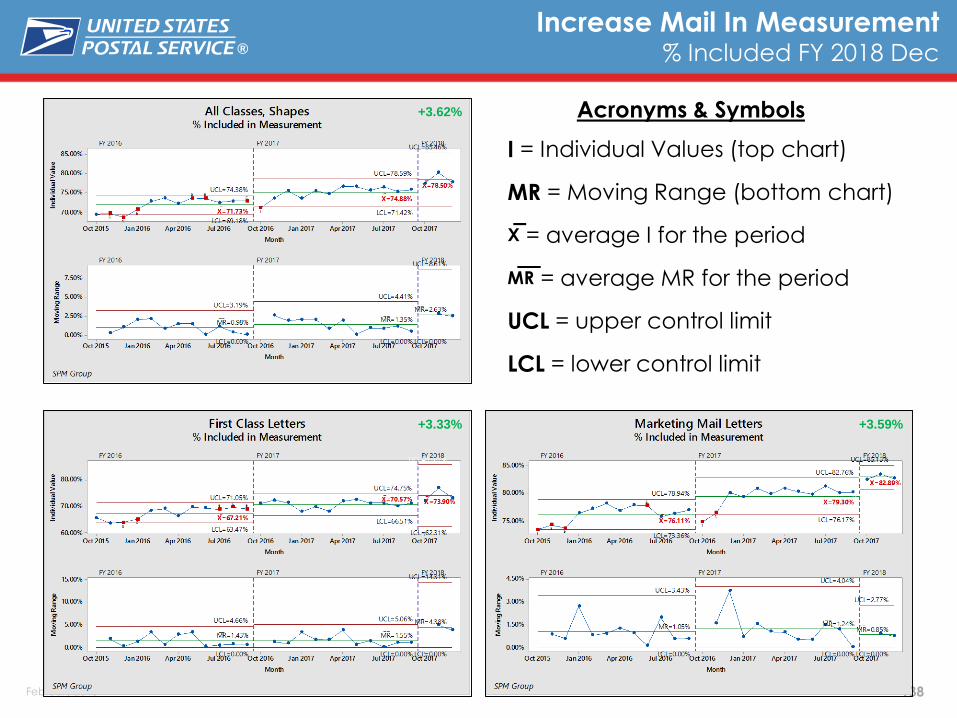
Increase Mail In Measurement% Included FY 2018 Dec
+3.33% +3.59%
+3.62% Acronyms & Symbols
I = Individual Values (top chart)
MR = Moving Range (bottom chart)
X ̅ = average I for the period
M ̅R ̅ = average MR for the period
UCL = upper control limit
LCL = lower control limit

139
®
February 2018
Increase Mail In Measurement% Included FY 2018 Dec
+0.86%
+2.66% -0.76%
+3.97%

140
®
February 2018
Increase Mail In MeasurementResults Update – FY 2018 Dec
District Exclusion Results (YTD Dec) FY 2017
AREA DISTRICT 07/08-09/30 YTD Oct 2017 Nov 2017 Dec 2017 Jan 2018 Feb 2018 Mar 2018 Apr 2018 May 2018 Jun 2018 Jul 2018 Aug 2018 Sep 2018
NATIONAL 23.89% 21.98% 22.59% 21.22% 22.14%
CAPITAL METRO 24.07% 22.54% 22.52% 21.96% 23.31%
EASTERN 22.90% 21.96% 21.00% 20.72% 24.84%
GREAT LAKES 26.64% 25.56% 26.45% 23.47% 27.02%
NORTHEAST 25.74% 22.87% 24.79% 20.65% 23.16%
PACIFIC 21.12% 18.24% 20.88% 16.93% 16.54%
SOUTHERN 27.35% 22.46% 23.25% 22.19% 21.83%
WESTERN 19.39% 19.95% 19.91% 21.43% 18.18%
FY 2018
FY Trends – National (YTD Dec)

141
®
February 2018
Service Diagnostics

142
®
February 2018
End-to-End Mail DiagnosticsPeriodicals

143
®
February 2018
Enterprise Analytics Service Performance
Periodicals
Flats

144
®
February 2018
84.3
86.5
83.5
70
75
80
85
90
95
100
Q1 Q2 Q3 Q4 Q1 Q2 Q3 Q4 Q1 Q2 Q3 Q4 Q1 Q2 Q3 Q4 Q1 Q2 Q3 Q4 Q1 Q2
FY13 FY14 FY15 FY16 FY17 FY18
Pe
rcen
t O
n T
ime
Postal Quarter
DSCF DADC DNDC
Destination Entry IMB® Periodicals FY13 thru FY18 PerformanceBy Quarter
IMB® Periodicals Performance by Quarter
Note: Preliminary FY18 Q2 through 1/26/18. Results starting FY17 Q1 are based on Days Left Group (DLG) approach, whereas all prior quarters’ results are based on Last Processing
Operation (LPO) approach. Service performance measurement was suspended for mail originating from or destined to Caribbean District starting 9/16/17 due to the devastating impacts
of Hurricanes Irma and Maria.
California
Wildfire; Winter
Storm ChloeHurricane
Sandy
Hurricanes Harvey,
Irma, Jose and
Maria; No FedEx
air lift on July 3
Winter Storm
Stella
Winter Storm
Jonas
Operation
Window Change Winter storms
Grayson, Inga and
Jaxon; California
mudslides

145
®
February 2018
Q2TD thru
1/26/18
Total Pieces
Measured
Processing
On-Time
Last Mile
Impact
Overall
Score
Target
Score
SPLY Pieces
Measured
Volume
Change
SPLY Overall
QTD Score
SPLY
Change
SCF Flats 162,691,105 93.07% -8.75% 84.32% 91.80% 173,208,597 -6.07% 86.59% -2.27%
ADC Flats 3,604,967 93.82% -7.36% 86.46% 91.80% 3,662,792 -1.58% 88.49% -2.03%
E2E Flats 29,542,544 71.64% -4.68% 66.96% 91.80% 32,942,683 -10.32% 68.87% -1.91%
2-Day N/A N/A N/A N/A N/A N/A N/A N/A N/A
3-Day 8,531,085 84.66% -5.12% 79.54% 91.80% 11,509,381 -25.88% 84.16% -4.63%
4-Day 13,688,668 69.98% -4.88% 65.10% 91.80% 12,695,526 7.82% 67.66% -2.56%
5-Day 277,773 64.53% -4.90% 59.63% 91.80% 656,393 -57.68% 57.18% 2.45%
6+ Day 7,045,018 59.38% -3.77% 55.61% 91.80% 8,081,383 -12.82% 49.93% 5.68%
Total 195,838,616 80.56% 91.80% 209,814,072 -6.66% 82.31% -1.75%
Periodicals
Score Trend
Service performance measurement was suspended for mail originating from or destined to Caribbean District in FY18 Q2 due to the devastating impacts of Hurricanes Irma and Maria.
94.19%
91.71% 94.26% 93.34% 93.46% 91.71%93.28%
93.77% 94.47% 94.28% 93.95% 92.91%
76.23%
70.01%
71.72%
72.29% 71.24%
72.98%
0
10
20
30
40
50
60
20%
30%
40%
50%
60%
70%
80%
90%
100%
12/16/17 12/23/17 12/30/17 1/6/18 1/13/18 1/20/18
Volu
me in
Millio
nsS
core
Pri
or
to L
ast M
ile
SPLY - Volume DSCF - Volume DADC - Volume End-to-End - Volume
DSCF DADC End-to-End

146
®
February 2018
Last Mile Impact Trend
PeriodicalsLast Mile Impact Trend
Note: Results starting week ending 10/28/16 are based on Days Left Group (DLG) approach, whereas all prior weeks’ results are based on Last Processing Operation (LPO)
approach. Service performance measurement was suspended for mail originating from or destined to Caribbean District starting 9/16/17 due to the devastating impacts of Hurricanes
Irma and Maria.
0.0%
2.0%
4.0%
6.0%
8.0%
10.0%
12.0%
La
st M
ile I
mpact
Postal Week
Destination End-to-End
147
®
February 2018
0.0%
1.0%
2.0%
3.0%
4.0%
5.0%
6.0%
7.0%
8.0%
9.0%
10.0%
La
st M
ile I
mpact
Postal Week
Destination (FSS) Destination (Non-FSS)
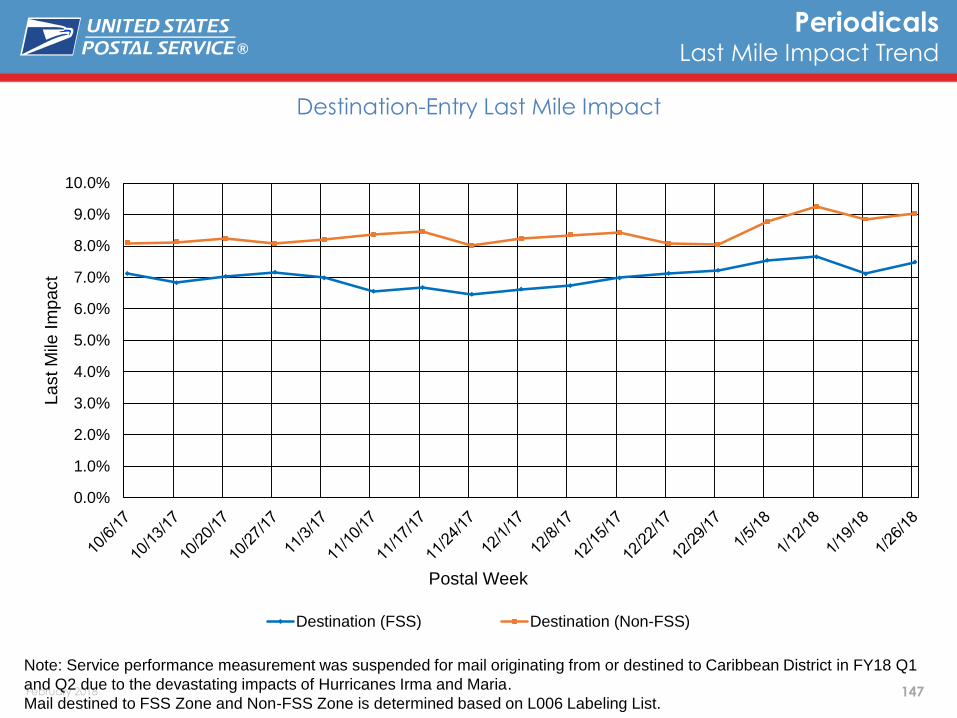
Note: Service performance measurement was suspended for mail originating from or destined to Caribbean District in FY18 Q1
and Q2 due to the devastating impacts of Hurricanes Irma and Maria.
Mail destined to FSS Zone and Non-FSS Zone is determined based on L006 Labeling List.
PeriodicalsLast Mile Impact Trend
Destination-Entry Last Mile Impact
148
®
February 2018
0.0%
1.0%
2.0%
3.0%
4.0%
5.0%
6.0%
La
st M
ile I
mpact
Postal Week
End-to-End (FSS) End-to-End (Non-FSS)
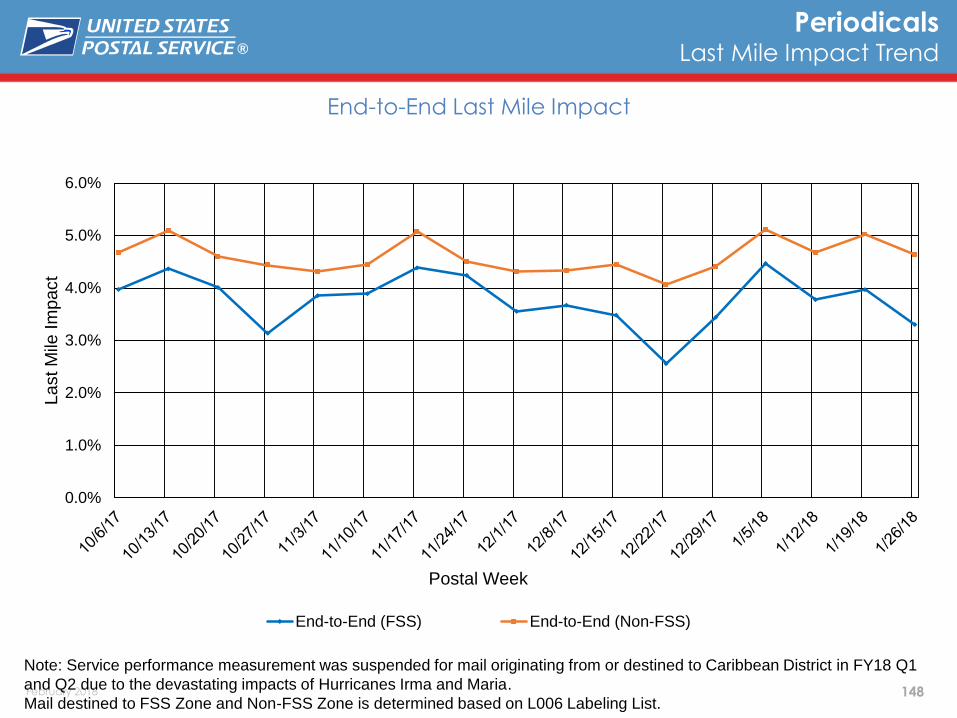
Note: Service performance measurement was suspended for mail originating from or destined to Caribbean District in FY18 Q1
and Q2 due to the devastating impacts of Hurricanes Irma and Maria.
Mail destined to FSS Zone and Non-FSS Zone is determined based on L006 Labeling List.
PeriodicalsLast Mile Impact Trend
End-to-End Last Mile Impact

149
®
February 2018
0.0%
1.0%
2.0%
3.0%
4.0%
5.0%
6.0%
7.0%
8.0%
9.0%
La
st M
ile I
mpact
Postal Week
Overall (FSS) Overall (Non-FSS)
Note: Service performance measurement was suspended for mail originating from or destined to Caribbean District in FY18 Q1
and Q2 due to the devastating impacts of Hurricanes Irma and Maria.
Mail destined to FSS Zone and Non-FSS Zone is determined based on L006 Labeling List.
PeriodicalsLast Mile Impact Trend
Overall Last Mile Impact

150
®
February 2018Note: Service performance results before Last Mile. Q2TD scores through 1/26/18. Service performance measurement was suspended for mail originating from or destined to Caribbean
District in FY18 Q2 due to the devastating impacts of Hurricanes Irma and Maria.
Q2TD DSCF and DADC Periodicals scores would be above 97.76% (prior to last mile), if pieces that failed by 1 day passed
PeriodicalsService Variance
93.07% 93.82%
71.64%
97.76% 97.91%
81.69%
98.89% 98.89%
87.76%
99.30% 99.31%
91.53%
20%
30%
40%
50%
60%
70%
80%
90%
100%
DSCF DADC End-to-End
QTD Score If Service Variance +1 If Service Variance +2 If Service Variance +3

151
®
February 2018
Thank You!

152
®
February 2018
Appendix

153
®
February 2018
IMpb Compliance Visualization
Dashboard Demo
Explore the possibility of providing a way for mailers to see quality metrics through a D3?
Visualization:
The current visualization will display a summary of the monthly IMpb Compliance Indicators (AQ, MQ, & BQ)
Mailers will be able to drill down to view compliance data at a state level which highlights IMpb compliance
issues by geographic location
http://56.72.7.32:9100/YK/Project_VII/versio
n_20180222/app/
IMPB DASHBOARD DEMO

154
®
February 2018
MTAC
February 2018
Marketing Mail

155
®
February 2018
MTAC Discussion Topics
All Classes
Bundle breakage data
Two sets of service data for disasters
Report that shows volume of automation flats in manual
The Future of Informed Visibility
Mail in Measurement Scorecard

156
®
February 2018
Informed Visibility Update

157
®
February 2018
Informed Visibility® Update
IV – our single source for near real-time data
Over 1,138 new mailers joined IV
since July 1, 2017!
+250 Million daily Logical Delivery
Events provided daily through IV-MTR
data feeds
1.1 Billion scan records processed
daily by IV
THANK YOU to industry partners!

158
®
February 2018
Informed Visibility Roadmap
Proposed Cadence of Application
Scope Review will be provided 4 weeks prior and will include:
Web changes – review wireframes
Data changes – review new fields that will be available
Demo and Documentation Preview will provided 1 - 2 weeks prior and
include:
Updates to User Guide
Updates to Data Feed
Specifications:
• Data Dictionary
• Sample Files /
xml Messages,
• any new Op Codes
Scope Review
Demo &
Documentation
Preview
Release Date
1/19/18 2/2/18 2/17/18
3/2/18 3/16/18 4/1/18
4/13/18 4/27/18 5/12/18
5/25/18 6/8/18 6/23/18

159
®
February 2018
No Piece Scan

160
®
February 2018
No Piece ScanFY18 Q1
In FY18 Q1, about 4% of Letters had No Visibility
Note: Metrics based on Full-Service Volume with Start-the-Clock for Start-the-Clock Dates 10/1/2017 – 12/31/2017
Mail Class Mail Shape Entry Discount Volume with Visibility No Visibility Volume % No Visibility
Presort First Class Letters/Cards ORIGIN 5,486,453,698 155,762,025 2.76%
USPS Marketing Mail Letters
DSCF 6,926,570,710 310,289,152 4.29%
ORIGIN 903,892,831 127,372,459 12.35%
DNDC 844,055,360 50,541,148 5.65%
ASF 60,850,551 2,676,122 4.21%
DDU 61,992 3,453 5.28%
Total 14,221,885,142 646,644,359 4.35%
Mail Class Mail Shape Entry Discount Volume with Visibility No Visibility Volume % No Visibility
USPS Marketing Mail Flat
DSCF 1,814,330,379 254,281,697 12.29%
ORIGIN 221,069,753 45,966,052 17.21%
DNDC 140,035,415 45,231,647 24.41%
DDU 36,369,958 5,280,498 12.68%
ASF 2,354,093 5,022,337 68.09%
ADC 12,931 3,153 19.60%
Periodicals Flat
DSCF 467,176,575 100,184,638 17.66%
ORIGIN 103,774,942 33,116,484 24.19%
DNDC 13,109,306 8,022,938 37.97%
ADC 10,194,590 3,810,830 27.21%
DDU 1,220,505 1,716,064 58.44%
ASF 53,753 17,426 24.48%
Total 2,809,702,200 502,653,764 15.18%
In FY18 Q1, about 15% of Flats had No Visibility

161
®
February 2018
Periodicals
Deep Dive on No Piece Scan by Entry Type
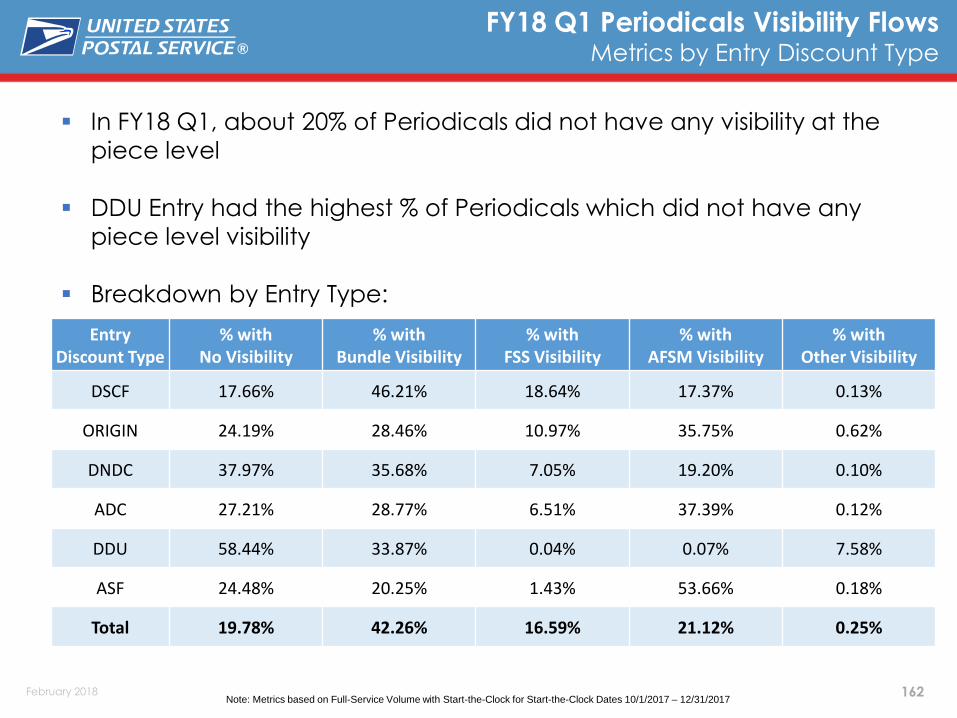
162
®
February 2018
FY18 Q1 Periodicals Visibility FlowsMetrics by Entry Discount Type
Note: Metrics based on Full-Service Volume with Start-the-Clock for Start-the-Clock Dates 10/1/2017 – 12/31/2017
In FY18 Q1, about 20% of Periodicals did not have any visibility at the
piece level
DDU Entry had the highest % of Periodicals which did not have any
piece level visibility
Breakdown by Entry Type:
Entry Discount Type
% withNo Visibility
% withBundle Visibility
% withFSS Visibility
% withAFSM Visibility
% withOther Visibility
DSCF 17.66% 46.21% 18.64% 17.37% 0.13%
ORIGIN 24.19% 28.46% 10.97% 35.75% 0.62%
DNDC 37.97% 35.68% 7.05% 19.20% 0.10%
ADC 27.21% 28.77% 6.51% 37.39% 0.12%
DDU 58.44% 33.87% 0.04% 0.07% 7.58%
ASF 24.48% 20.25% 1.43% 53.66% 0.18%
Total 19.78% 42.26% 16.59% 21.12% 0.25%

163
®
February 2018
Manual Bullpen Scanning
Mail & Package Visibility
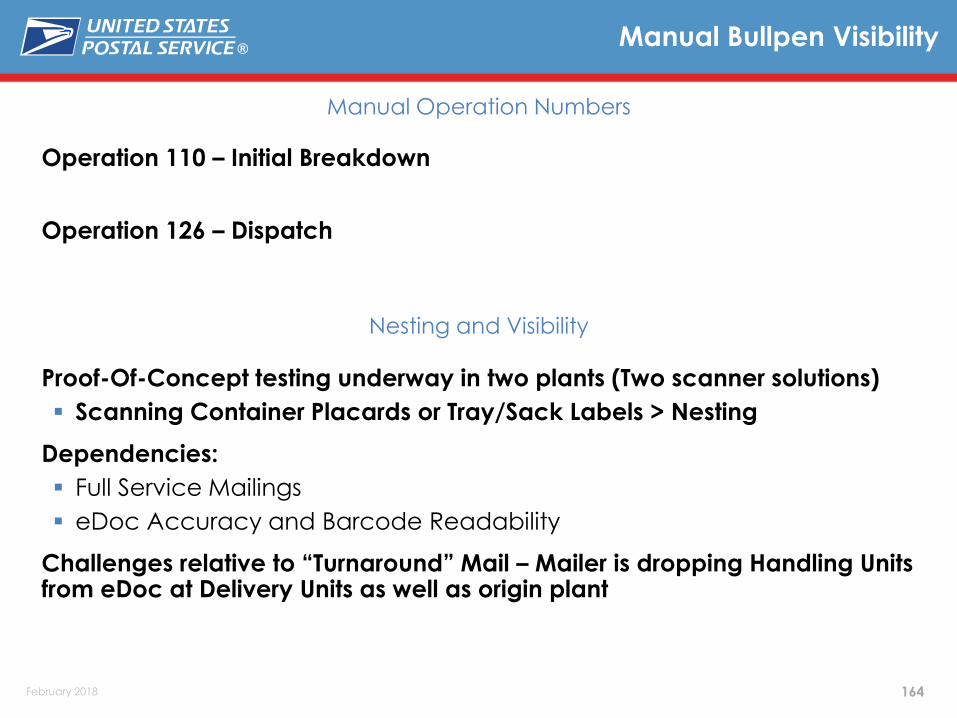
164
®
February 2018
Operation 110 – Initial Breakdown
Operation 126 – Dispatch
Manual Bullpen Visibility
Manual Operation Numbers
Nesting and Visibility
Proof-Of-Concept testing underway in two plants (Two scanner solutions)
Scanning Container Placards or Tray/Sack Labels > Nesting
Dependencies:
Full Service Mailings
eDoc Accuracy and Barcode Readability
Challenges relative to “Turnaround” Mail – Mailer is dropping Handling Units from eDoc at Delivery Units as well as origin plant

165
®
February 2018
Mail Visibility Applications (MVA)
166
®
February 2018
Mail Visibility Applications (MVA)
Two internal mobile applications launched in September 2017:
• Mail History Application
• Employees can use their USPS mobile devices to retrieve near real-time delivery information by scanning barcodes for containers, mail handling units, and single mail pieces
• Enhanced Barcode Diagnostics Application
• Employees can use their USPS mobile devices to scan barcodes to retrieve diagnostic data of the visible elements of the barcodes scanned and highlight invalid data elements
USPS is currently considering how to address long hauls.

167
®
February 2018
Addressing & Geospatial Technology

168
®
February 2018
CASS / MASS Cycle O
Green & Secure
Informed Delivery
Address Authority Data Exchange

169
®
February 2018
Cycle O Highlights

170
®
February 2018
Enhanced Identification of:
PO Box only delivery ZIP Codes
R777 phantom route & “No-Stat” addresses
Door Not Accessible, No Secure Location, & Non-Delivery Days
Standardization & DPV® confirmation of:
PBSA – PO Box street address
CMRA – PMB identifier & DPV confirmation
Single trailing alpha on a primary number
New military addresses “OMC” & “UMR”
CASS™/MASS™ Cycle O
Cycle O – Highlights

171
®
February 2018
The USPS® has added a new table to the DPV/DSF2Hash Product called No-Stat Reason Code Table.
This table will provide details as to why the records are flagged as No-Stats.
This table is optional and will be available beginning in the May product, which will be posted to the Electronic Product Fulfillment (EPF) website on Monday, April 23.
During CASS™ Cycle O certification if a ‘Y’ is received on the DPV No-Stat table, the N-Stat Reason code must be correctly returned.
CASS™/MASS™ Cycle O
No-Stat Reason Codes

172
®
February 2018
CASS™/MASS™ Cycle O
No-Stat Reason Code Definitions
Reason Code Code Description
0 – Regular No-StatIndicates addresses not receiving delivery and the addresses are not
counted as possible deliveries.
1 – IDA (Internal Drop Address)These are addresses that do not receive mail delivery directly from the
USPS, but are delivered to a drop address that services them.
2 – CDS No-Stat
These are addresses that have not yet become deliverable. For
example, a new subdivision where lots and primary numbers have
been determined, but no structure exists yet for occupancy.
3 – Collision
These addresses do not actually DPV confirm. In this case, the ‘Y’
should be set to an ‘N’ on the DPV ‘A’ table and all other table values
should be blank.
4 – CMZ (College, Military
and other types)
These are ZIP + 4® records USPS has incorporated into the data as
logical delivery points but not serviced directly by USPS.

173
®
February 2018
Redefine DPV Codes to better indicate the reason an address did not produce a “Y” return code.
Current Definitions:
“Y” – Address was DPV confirmed for both primary and (if present) secondary numbers
“D” – Address was DPV confirmed for the primary number only and the secondary number is required but missing.
“S” – Address was DPV confirmed for the primary number. A secondary number was present but unconfirmed.
• (This led to confusion as whether a secondary was required or not.)
New Definitions: (Codes to be determined)
“S” – Address had a secondary number that was not confirmed and was not needed with the primary address number.
“New1” – Address had a secondary number that was not confirmed but a valid secondary number was needed with the primary address number.
“New2 ” – Address was confirmed (ex: R777) but USPS mail delivery is not made to this address.
CASS™/MASS™ Cycle O
DPV® Return Code Enhancements

174
®
February 2018
CASS™/MASS™ Cycle O
Tentative Schedule
CASS Cycle “O” Pre-Meeting February 23 2018
Partnership In Tomorrow (PIT) Meeting May 1 2018
NCOALink® PIT May 8 2018
Official Rules Release June 1 2018
Send Static Data September 30 2018
CASS & NCOALink Stage I Release October 31 2018
CASS & NCOALink Stage II Release February 28 2019
MASS Test Decks Available September 30 2019
CASS Developers Certification Completed December 31 2019
MASS Manufacturers Certification Completed January 31 2020
Software Released to End-users NLT March 31 2020
Expiration of CASS™ Cycle N July 31 2020
Implementation of CASS Cycle O August 1 2020

175
®
February 2018
Green & Secure
176
®
February 2018
Intelligent Mail barcode is REQUIRED!
First-Class Mail®
Change Service Requested Option 1
Change Service Requested Option 2
Secure Destruction Service Option 1
Secure Destruction Service Option 2
USPS Marketing Mail®
Change Service Requested Option 1
Change Service Requested Option 2
(Forwarded USPS Marketing Mail Fees are charged for forwarded pieces)
Option 1 recycles ALL UAA
Option 2 forwards if possible, recycles the rest
Secure Destruction shreds before recycling
Green & Secure
Green & Secure – Mail Disposition Options

177
®
February 2018
Informed Delivery
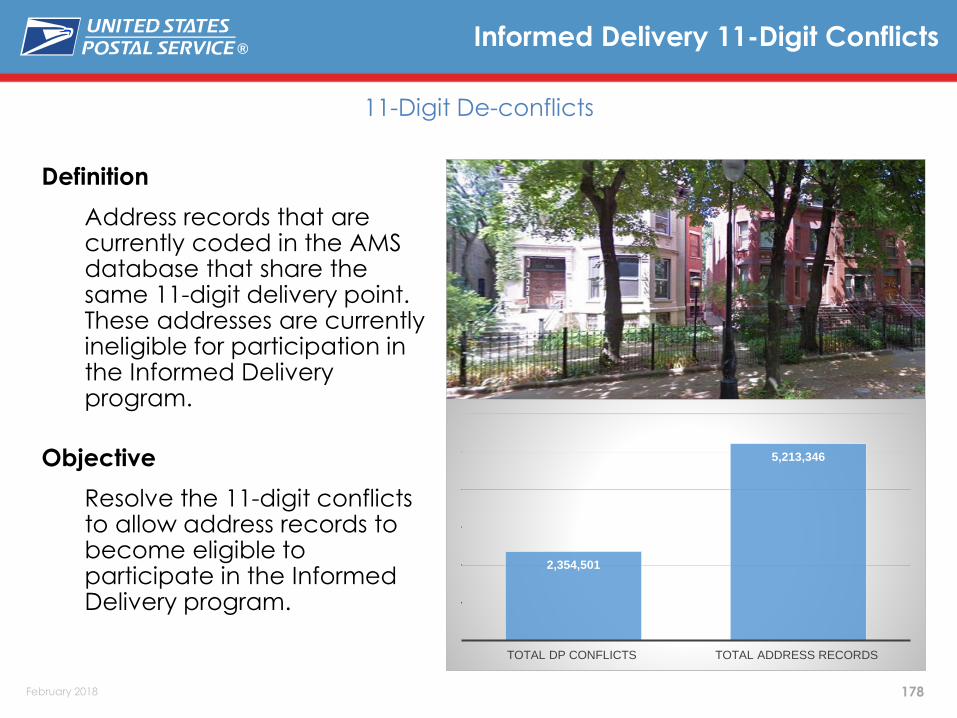
178
®
February 2018
Definition
Address records that are currently coded in the AMS database that share the same 11-digit delivery point. These addresses are currently ineligible for participation in the Informed Delivery program.
Objective
Resolve the 11-digit conflicts to allow address records to become eligible to participate in the Informed Delivery program.
Informed Delivery 11-Digit Conflicts
11-Digit De-conflicts
2,354,501
5,213,346
TOTAL DP CONFLICTS TOTAL ADDRESS RECORDS

179
®
February 2018
Option 1:
Crosswalk: Leverage existing geo-seg +4 even/odd ranges for the generation of a unique 11-digit. It limits the use of available ZIP+4 and potential ZIP Code saturation. Also limits impact on address matching software.
Option 2:
Convert records to a High-Rise; uniquely assigning a ZIP+4 to colliding deliveries. Potentially, 96% of the collisions can be corrected by using this method in conjunction with option 1.
Option 3:
Create a derivative linkage table similar to LACS that will allow software to query the table to search for an equivalent but unique 11-digit to be applied to the mail-piece. This method will be considered if necessary after options 1 and 2.
Option 4:
No Resolution; conflict can’t be broken.
Informed Delivery 11-Digit Conflicts
11-Digit De-conflicts Resolutions

180
®
February 2018
Informed Delivery 11-Digit De-confliction
11-Digit De-conflicts Resolutions and Breakdown

181
®
February 2018
There are 64 ZIP Codes with 11-Digit Conflicts in the Chicago District. These ZIPs have the highest potential for implementing ZIP splits as a result of the de-conflicting effort if using the unique ZIP+4 assignment effort.
Informed Delivery 11-Digit De-confliction
ZIP Codes with Highest Percentage of Conflicts
ZIP CODETOTAL
CONFLICTS
60618 13,814
60647 11,802
60625 9,632
60629 8,972
60639 8,757
60623 7,844
60619 7,729
Seven largest ZIP Codes with
Conflicts for Chicago District

182
®
February 2018
There are 159 ZIP Codes with 11-Digit Conflicts in the New York Metro Area. These ZIPs have the highest potential for implementing ZIP splits as a result of the de-conflicting effort if using the unique ZIP+4 is assignment effort.
Informed Delivery 11-Digit De-confliction
ZIP Codes with Highest Percentage of Conflicts
ZIP CODETOTAL
CONFLICTS
11236 12,222
11234 9,141
11214 8,768
11221 7,321
11219 6,923
11208 6,575
11233 6,060
Seven Largest ZIP Codes with
Conflicts for New York Metro Area

183
®
February 2018
Address AuthorityData Exchange (AADE)

184
®
February 2018
Partner with the Department of Transportation, and their efforts, to create the National Address Database.
Compare address data received from the DOT National Address Database (NAD) to the USPS® Delivery Point File (DPF) database. Unmatched records will be researched and validated to be potentially added to AMS as a valid delivery point.
Address Authority Data Exchange
Objective

185
®
February 2018
Address Authority Data Exchange
NAD Data Breakdown Currently representing 13 States
Total Addresses Received from NAD 42,281,449
with
DPF
DPF Match before AME and AEC 30,965,575
DPF Match after AME 4,789,352
DPF Match after AEC 949,918
Total DPF 36,704,845
Match w/o
DPF
AME Match w/o DPF match 2,816,331
AEC Match w/o DPF Match 342,078
Total Match w/o DPF 3,158,409
No MatchAEC no match (could not resolve) 2,418,195
Bad Address (Missing ZIP and Address) 956,764

186
®
February 2018
Research and validate records that match a current ZIP + 4 range, but do not match to DPF
Leverage enhanced geo coordinate to determine if an address match can be made.
Unmatched records will be loaded into GMT for verification and acceptance into AMS by the local AMS office.
6 Districts are currently piloting the validation process to ensure records are received and being updated in AMS appropriately.
Status updates will be provided monthly that shows how many records have been successfully added to the AMS database.
Address Authority Data Exchange
Phase I – ZIP + 4® Matches Targeted 80% validation by 9/30
Match w/o DPF:
AME Match w/o DPF match 2,816,331
AEC Match w/o DPF Match 342,078
Total Match w/o DPF 3,158,409

187
®
February 2018
MTAC Pulse of the Industry
Service performance Measurement

188
®
February 2018
Mail In Measurement
Approach to Increasing Mail in Measurement

189
®
February 2018
94%
83%
86%
49% 50% 51% 53%53%
57%60%
64%
69%
74%76%
79%82% 86% 87%
89% 89% 89% 90% 91% 90% 92% 92% 92% 92%
0%
10%
20%
30%
40%
50%
60%
70%
80%
90%
100%
Pe
rce
nta
ge o
f To
tal V
olu
me
th
at is
Fu
ll Se
rvic
e
FCM Letters & Cards FCM Flats MKT Letters MKT Flats PER Flats All Mail Types
Note: Below graph depicts FS Adoption % as an avg. for the quarter; Slide title depicts the % for the latest month.
Full Service Mail Trend
In December 2017, 92% of Commercial mail eligible for Full-Service was Full-Service

190
®
February 2018
FY18 Q1 Commercial Mail VolumeMail In Measurement
In FY18 Q1, over 78% of Full-Service mail was in Measurement
Mail Class Mail Shape CommercialFull-Service
EligibleFull-Service In Measurement
% of Full-Service In Measurement
First Class Presort Letter/Card 9,749,483,116 9,372,407,989 8,977,992,193 6,635,144,431 73.90%
First Class Presort Flat 169,899,657 151,348,578 126,977,479 87,698,212 69.07%
USPS Marketing Letter 14,499,209,464 14,209,168,816 13,338,299,049 11,056,692,101 82.89%
USPS Marketing Flat 5,817,237,048 3,998,819,735 3,566,993,218 2,751,423,015 77.14%
Periodicals Flat 1,250,121,841 1,206,914,247 1,093,896,536 755,828,711 69.10%
Total 31,485,951,126 28,938,659,365 27,104,158,475 21,286,786,470 78.54%
Metrics are for Mailing Dates 10/1/2017 – 12/31/2017
Commercial and Full-Service Eligible Volumes sourced from PostalOne!

191
®
February 2018
M-in-M Network HQ Team
SPM – Priyanka Misri, John Nabor, Wayne Palmiter Accenture – Beau Rauch, Lisa Leu Marketing – Chip Brown III (MMS), Frank Montemayor (BMS), Phillip Parrish (MEPT) Networks – Prat Shah
Area Co-Coordinators (Mail Acceptance, Operations) CM – Danny Luc, Dmetrius Alexander EA – Barry Gilbert, Regis Curtin GL – Linda Bergeland, Drew Mason NE – Michelle Saracusa, Carla Edmonds PA – Claudia Munoz, Kelly Porter SO – Beth Baughman, Rick Bay WE – Ray Cordova, Jon Hummel
Resolution Chronology 03/2017 to 07/2017 – identify top 3 exclusion reasons for each mail class/shape and HQ team
investigate high volume site/mailer pairs for root cause and resolution
07/2018 – publish of HQ team results in Resolution Guide
08/2017 onward – investigate Field inquiries regarding published resolutions and update the Guide
11/2017 – complete L601 correction for LA, NJ, KC, and STL NDC’s for Invalid EPFED
11/2017 – complete Southern Area STC correction to FDB locale key and CSA’s for No Start-the-
Clock
01/2018 – eliminate Incorrect Entry Facility exclusion
02/2018 – initiate Field collaborations as method to develop resolutions for unresolved exclusions
03/2018 – implement resolution for Seamless BMEU entry for No Start-the-Clock
Pending – Long Haul exclusion dependent on completion of MVA Trailer Visibility application
Increase Mail In MeasurementTeams & Chronology
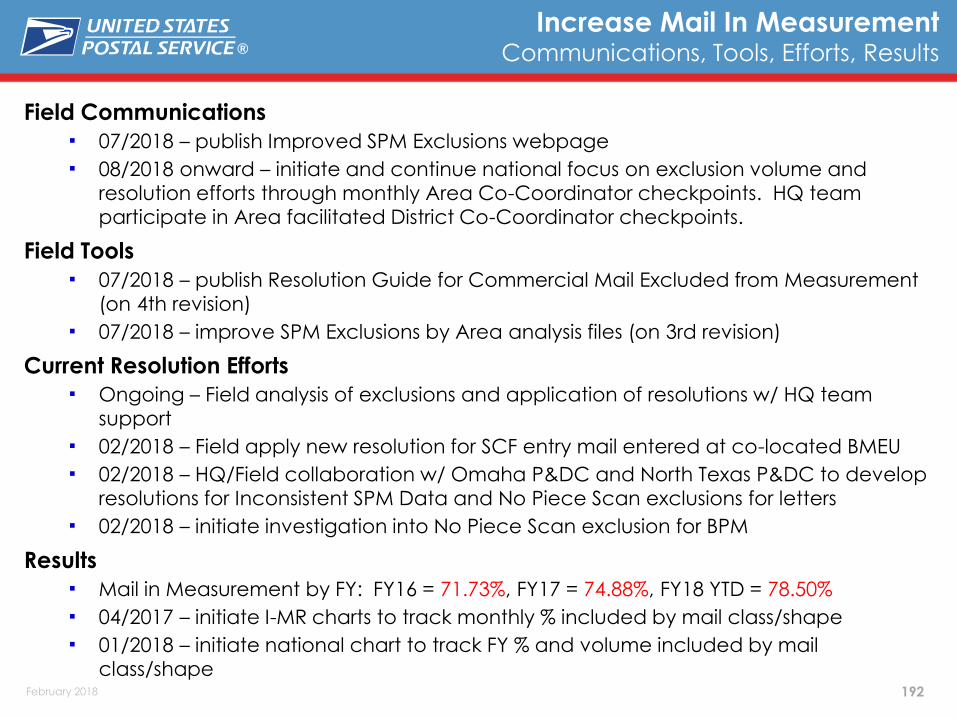
192
®
February 2018
Field Communications 07/2018 – publish Improved SPM Exclusions webpage
08/2018 onward – initiate and continue national focus on exclusion volume and
resolution efforts through monthly Area Co-Coordinator checkpoints. HQ team
participate in Area facilitated District Co-Coordinator checkpoints.
Field Tools 07/2018 – publish Resolution Guide for Commercial Mail Excluded from Measurement
(on 4th revision)
07/2018 – improve SPM Exclusions by Area analysis files (on 3rd revision)
Current Resolution Efforts Ongoing – Field analysis of exclusions and application of resolutions w/ HQ team
support
02/2018 – Field apply new resolution for SCF entry mail entered at co-located BMEU
02/2018 – HQ/Field collaboration w/ Omaha P&DC and North Texas P&DC to develop
resolutions for Inconsistent SPM Data and No Piece Scan exclusions for letters
02/2018 – initiate investigation into No Piece Scan exclusion for BPM
Results Mail in Measurement by FY: FY16 = 71.73%, FY17 = 74.88%, FY18 YTD = 78.50%
04/2017 – initiate I-MR charts to track monthly % included by mail class/shape
01/2018 – initiate national chart to track FY % and volume included by mail
class/shape
Increase Mail In MeasurementCommunications, Tools, Efforts, Results

193
®
February 2018
Increase Mail In Measurement% Included FY 2018 Dec
+3.33% +3.59%
+3.62% Acronyms & Symbols
I = Individual Values (top chart)
MR = Moving Range (bottom chart)
X ̅ = average I for the period
M ̅R ̅ = average MR for the period
UCL = upper control limit
LCL = lower control limit

194
®
February 2018
Increase Mail In Measurement% Included FY 2018 Dec
+0.86%
+2.66% -0.76%
+3.97%
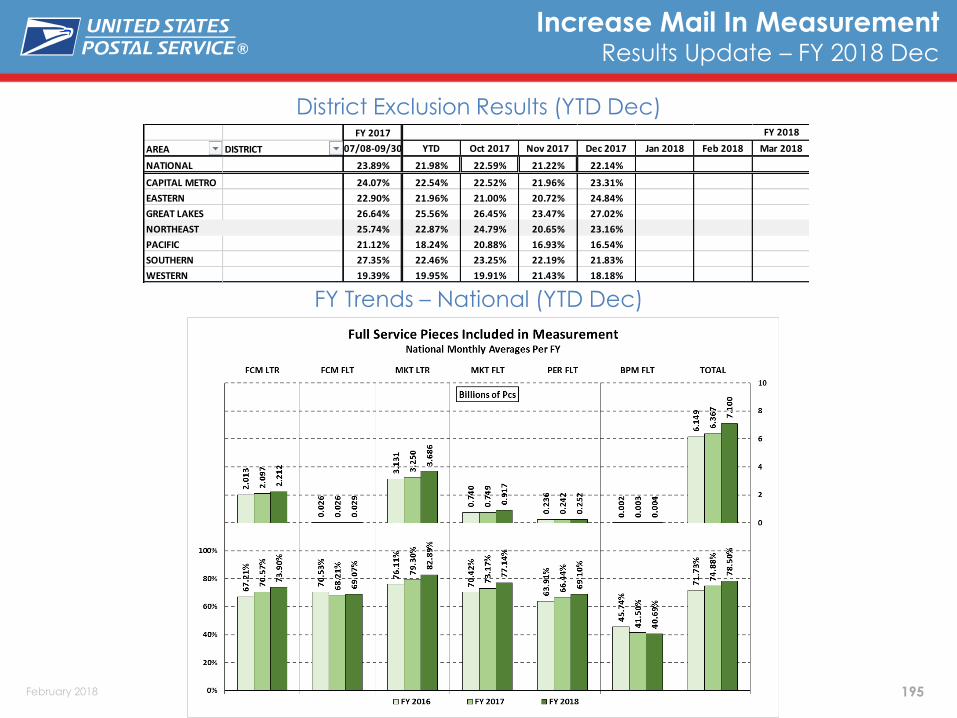
195
®
February 2018
Increase Mail In MeasurementResults Update – FY 2018 Dec
District Exclusion Results (YTD Dec) FY 2017
AREA DISTRICT 07/08-09/30 YTD Oct 2017 Nov 2017 Dec 2017 Jan 2018 Feb 2018 Mar 2018 Apr 2018 May 2018 Jun 2018 Jul 2018 Aug 2018 Sep 2018
NATIONAL 23.89% 21.98% 22.59% 21.22% 22.14%
CAPITAL METRO 24.07% 22.54% 22.52% 21.96% 23.31%
EASTERN 22.90% 21.96% 21.00% 20.72% 24.84%
GREAT LAKES 26.64% 25.56% 26.45% 23.47% 27.02%
NORTHEAST 25.74% 22.87% 24.79% 20.65% 23.16%
PACIFIC 21.12% 18.24% 20.88% 16.93% 16.54%
SOUTHERN 27.35% 22.46% 23.25% 22.19% 21.83%
WESTERN 19.39% 19.95% 19.91% 21.43% 18.18%
FY 2018
FY Trends – National (YTD Dec)

196
®
February 2018
Service Diagnostics

197
®
February 2018
End-to-End Mail DiagnosticsPeriodicals

198
®
February 2018
Enterprise Analytics Service Performance
USPS Marketing Mail®
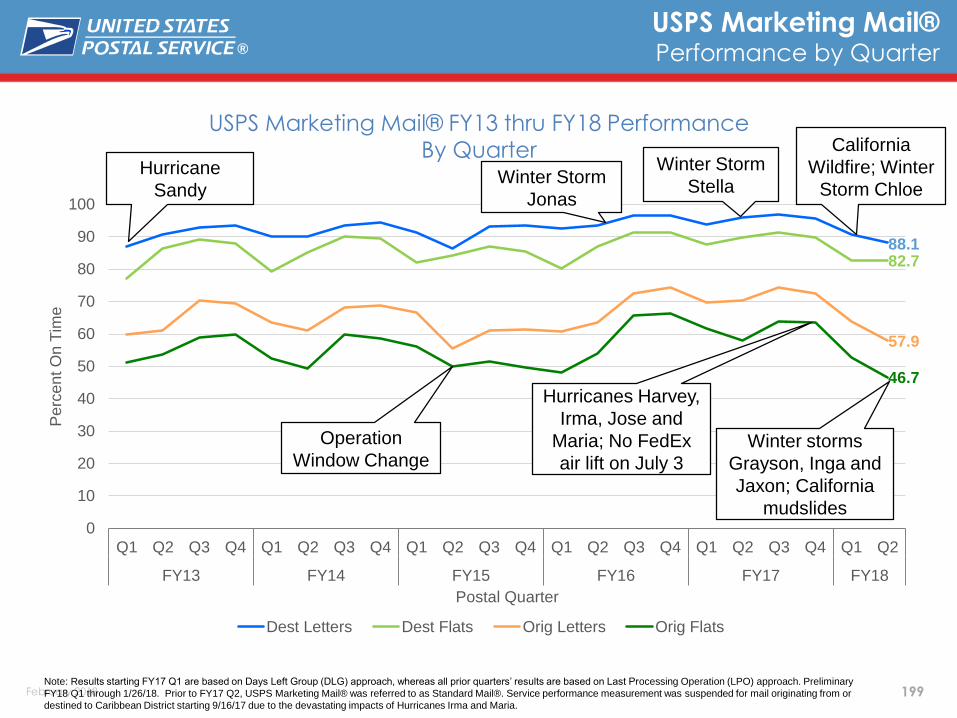
199
®
February 2018
USPS Marketing Mail® FY13 thru FY18 PerformanceBy Quarter
USPS Marketing Mail®Performance by Quarter
88.182.7
57.9
46.7
0
10
20
30
40
50
60
70
80
90
100
Q1 Q2 Q3 Q4 Q1 Q2 Q3 Q4 Q1 Q2 Q3 Q4 Q1 Q2 Q3 Q4 Q1 Q2 Q3 Q4 Q1 Q2
FY13 FY14 FY15 FY16 FY17 FY18
Pe
rcen
t O
n T
ime
Postal Quarter
Dest Letters Dest Flats Orig Letters Orig Flats
Note: Results starting FY17 Q1 are based on Days Left Group (DLG) approach, whereas all prior quarters’ results are based on Last Processing Operation (LPO) approach. Preliminary
FY18 Q1 through 1/26/18. Prior to FY17 Q2, USPS Marketing Mail® was referred to as Standard Mail®. Service performance measurement was suspended for mail originating from or
destined to Caribbean District starting 9/16/17 due to the devastating impacts of Hurricanes Irma and Maria.
California
Wildfire; Winter
Storm ChloeHurricane
Sandy
Hurricanes Harvey,
Irma, Jose and
Maria; No FedEx
air lift on July 3
Winter Storm
StellaWinter Storm
Jonas
Operation
Window ChangeWinter storms
Grayson, Inga and
Jaxon; California
mudslides

200
®
February 2018
USPS Marketing Mail®Performance by Quarter
Note: DDU-Entry = Two Day, DSCF = Three-To-Five-Day, DNDC = Five-Day-And-Above
USPS Marketing Mail® Destination Entry FY13 to FY18 PerformanceBy Quarter
87.0
88.1
70
75
80
85
90
95
100
Q1 Q2 Q3 Q4 Q1 Q2 Q3 Q4 Q1 Q2 Q3 Q4 Q1 Q2 Q3 Q4 Q1 Q2 Q3 Q4 Q1 Q2
FY13 FY14 FY15 FY16 FY17 FY18
Pe
rcen
t O
n T
ime
Postal Quarter
DSCF DNDC
Note: Results starting FY17 Q1 are based on Days Left Group (DLG) approach, whereas all prior quarters’ results are based on Last Processing Operation (LPO) approach. Preliminary
FY18 Q1 through 1/26/18. Prior to FY17 Q2, USPS Marketing Mail® was referred to as Standard Mail®. Service performance measurement was suspended for mail originating from or
destined to Caribbean District starting 9/16/17 due to the devastating impacts of Hurricanes Irma and Maria.
California
Wildfire; Winter
Storm ChloeHurricane
Sandy
Hurricanes Harvey,
Irma, Jose and
Maria; No FedEx
air lift on July 3
Winter Storm
StellaWinter Storm
Jonas
Operation
Window Change Winter storms
Grayson, Inga and
Jaxon; California
mudslides

201
®
February 2018
Enterprise Analytics Service Performance
USPS Marketing Mail®
Letters

202
®
February 2018
USPS Marketing Mail® FY13 to FY18 PerformanceBy Quarter
USPS Marketing Mail® (Letters)Performance by Quarter
88.1
57.9
0
10
20
30
40
50
60
70
80
90
100
Q1 Q2 Q3 Q4 Q1 Q2 Q3 Q4 Q1 Q2 Q3 Q4 Q1 Q2 Q3 Q4 Q1 Q2 Q3 Q4 Q1 Q2
FY13 FY14 FY15 FY16 FY17 FY18
Pe
rcen
t O
n T
ime
Postal Quarter
Dest Letters Orig Letters
Note: Results starting FY17 Q1 are based on Days Left Group (DLG) approach, whereas all prior quarters’ results are based on Last Processing Operation (LPO) approach. Preliminary
FY18 Q2 through 1/26/18. Prior to FY17 Q2, USPS Marketing Mail® was referred to as Standard Mail®. Service performance measurement was suspended for mail originating from or
destined to Caribbean District starting 9/16/17 due to the devastating impacts of Hurricanes Irma and Maria.
California
Wildfire; Winter
Storm ChloeHurricane
Sandy
Hurricanes Harvey,
Irma, Jose and
Maria; No FedEx
air lift on July 3
Winter Storm
Stella
Winter Storm
Jonas
Operation
Window Change
Winter storms
Grayson, Inga and
Jaxon; California
mudslides

203
®
February 2018
Q2TD thru
1/26/18
Total Pieces
Measured
Processing
On-Time
Last Mile
Impact
Overall
Score
Target
Score
SPLY Pieces
Measured
Volume
Change
SPLY Overall
QTD Score
SPLY
Change
SCF Letters 2,240,565,374 90.27% -2.25% 88.02% 91.80% 2,248,485,390 -0.35% 94.82% -6.80%
NDC Letters 317,843,276 90.59% -1.57% 89.02% 91.80% 294,884,613 7.79% 94.26% -5.24%
E2E Letters 285,617,632 59.03% -1.08% 57.95% 91.80% 274,037,583 4.23% 64.49% -6.54%
3-Day 52,631,343 82.16% -1.43% 80.73% 91.80% 55,207,392 -4.67% 87.29% -6.57%
4-Day 2,126,281 88.85% -1.03% 87.82% 91.80% 1,704,928 24.71% 87.29% 0.53%
5-Day 41,169,885 78.37% -1.23% 77.14% 91.80% 36,199,401 13.73% 81.48% -4.34%
6-10 Day 182,490,480 47.33% -0.96% 46.37% 91.80% 173,683,027 5.07% 53.40% -7.02%
11+ Day 7,199,643 67.04% -0.86% 66.18% 91.80% 7,242,835 -0.60% 66.53% -0.35%
Total 2,844,026,282 83.99% 91.80% 2,817,407,586 0.94% 90.85% -6.86%
USPS Marketing Mail® (Letters)Score Trend
Service performance measurement was suspended for mail originating from or destined to Caribbean District in FY18 Q2 due to the devastating impacts of Hurricanes Irma and Maria.
91.69%
93.48%96.27%
92.52%
86.22% 88.31%
92.18%
92.06%95.22%
91.88%
87.50% 89.86%
65.03%61.70%
67.74%
61.08%
53.30% 56.49%
0
100
200
300
400
500
600
700
800
20%
30%
40%
50%
60%
70%
80%
90%
100%
12/16/17 12/23/17 12/30/17 1/6/18 1/13/18 1/20/18
Volu
me in
Millio
ns
Score
Pri
or
to L
ast M
ile
SPLY - Volume DSCF - Volume DNDC - Volume End-to-End - Volume
DSCF DNDC End-to-End

204
®
February 2018
Last Mile Impact Trend
USPS Marketing Mail® (Letters)Last Mile Impact Trend
Note: Results starting week ending 10/28/16 are based on Days Left Group (DLG) approach, whereas all prior weeks’ results are based on Last Processing Operation (LPO)
approach. Prior to FY17 Q2, USPS Marketing Mail® was referred to as Standard Mail®. Service performance measurement was suspended for mail originating from or destined to
Caribbean District starting 9/16/17 due to the devastating impacts of Hurricanes Irma and Maria.
0.0%
0.5%
1.0%
1.5%
2.0%
2.5%
La
st M
ile I
mpact
Postal Week
Destination End-to-End

205
®
February 2018
Q2TD DSCF and DNDC Marketing Letters scores would be above 97.06% (prior to last mile), if pieces that failed by 1 day passed
USPS Marketing Mail® (Letters)Service Variance
Note: Service performance results including Last Mile. Q2TD scores through 1/26/18. Service performance measurement was suspended for mail originating from or destined to Caribbean
District in FY18 Q2 due to the devastating impacts of Hurricanes Irma and Maria.
90.27% 90.59%
59.03%
97.65% 97.06%
74.07%
99.16% 98.67%
83.58%
99.57% 99.27%
89.90%
20%
30%
40%
50%
60%
70%
80%
90%
100%
DSCF DNDC End-to-End
QTD Score If Service Variance +1 If Service Variance +2 If Service Variance +3

206
®
February 2018
Enterprise Analytics Service Performance
USPS Marketing Mail®
Flats

207
®
February 2018
USPS Marketing Mail® FY13 to FY18 PerformanceBy Quarter
USPS Marketing Mail® (Flats)Performance by Quarter
82.7
46.7
0
10
20
30
40
50
60
70
80
90
100
Q1 Q2 Q3 Q4 Q1 Q2 Q3 Q4 Q1 Q2 Q3 Q4 Q1 Q2 Q3 Q4 Q1 Q2 Q3 Q4 Q1 Q2
FY13 FY14 FY15 FY16 FY17 FY18
Pe
rcen
t O
n T
ime
Postal Quarter
Dest Flats Orig Flats
Note: Results starting FY17 Q1 are based on Days Left Group (DLG) approach, whereas all prior quarters’ results are based on Last Processing Operation (LPO) approach. Preliminary
FY18 Q2 through 1/26/18. Prior to FY17 Q2, USPS Marketing Mail® was referred to as Standard Mail®. Service performance measurement was suspended for mail originating from or
destined to Caribbean District starting 9/16/17 due to the devastating impacts of Hurricanes Irma and Maria.
California
Wildfire; Winter
Storm Chloe
Hurricane
Sandy
Hurricanes Harvey,
Irma, Jose and
Maria; No FedEx
air lift on July 3
Winter Storm
StellaWinter Storm
Jonas
Operation
Window ChangeWinter storms
Grayson, Inga and
Jaxon; California
mudslides

208
®
February 2018
USPS Marketing Mail® (Flats)
Score Trend
Service performance measurement was suspended for mail originating from or destined to Caribbean District in FY18 Q2 due to the devastating impacts of Hurricanes Irma and Maria.
* Mail destined to FSS Zone and Non-FSS Zone is determined based on L006 Labeling List, excluding EDDM and Saturation Mail. SPLY FSS and Non-FSS Zone scores and volumes
are calculated using cleansed end of quarter data, while rest of SPLY data was based on pre-cleansed data.
96.81% 92.81% 95.37% 94.63% 92.56% 91.85%
92.47%88.77%
92.96% 92.81% 90.67% 90.32%
58.94%54.34% 56.05% 55.19%
50.61%45.98%
0
50
100
150
200
20%
40%
60%
80%
100%
12/16/17 12/23/17 12/30/17 1/6/18 1/13/18 1/20/18
Volu
me in
Millio
ns
Score
Pri
or
to L
ast M
ile
SPLY - Volume DSCF - Volume DNDC - Volume End-to-End - Volume
DSCF DNDC End-to-End
Q2TD thru
1/26/18
Total Pieces
Measured
Processing
On-Time
Last Mile
Impact
Overall
Score
Target
Score
SPLY Pieces
Measured
Volume
Change
SPLY Overall
QTD Score
SPLY
Change
SCF Flats 476,645,768 93.57% -9.80% 83.77% 91.80% 488,176,337 -2.36% 89.25% -5.48%
NDC Flats 82,583,390 91.61% -7.32% 84.29% 91.80% 64,774,274 27.49% 89.36% -5.07%
E2E Flats 49,368,283 51.93% -5.18% 46.75% 91.80% 44,593,878 10.71% 53.70% -6.95%
3-Day 6,425,074 75.64% -8.06% 67.58% 91.80% 5,457,800 17.72% 69.30% -1.72%
4-Day 166,982 77.08% -5.63% 71.45% 91.80% 208,423 -19.88% 78.34% -6.89%
5-Day 5,436,981 65.34% -6.18% 59.16% 91.80% 4,995,016 8.85% 66.21% -7.05%
6-10 Day 35,781,475 44.86% -4.48% 40.38% 91.80% 32,110,235 11.43% 47.78% -7.40%
11+ Day 1,557,771 67.17% -6.24% 60.93% 91.80% 1,822,404 -14.52% 74.28% -13.36%
Total 608,597,441 80.06% 91.80% 597,544,489 1.85% 85.62% -5.56%
FSS Zone* 129,477,600 86.07% -4.95% 81.12% 91.80% 122,970,736 5.29% 86.22% -5.11%
Non-FSS Zone* 479,119,841 90.01% -10.04% 79.97% 91.80% 466,466,195 2.71% 85.47% -5.50%
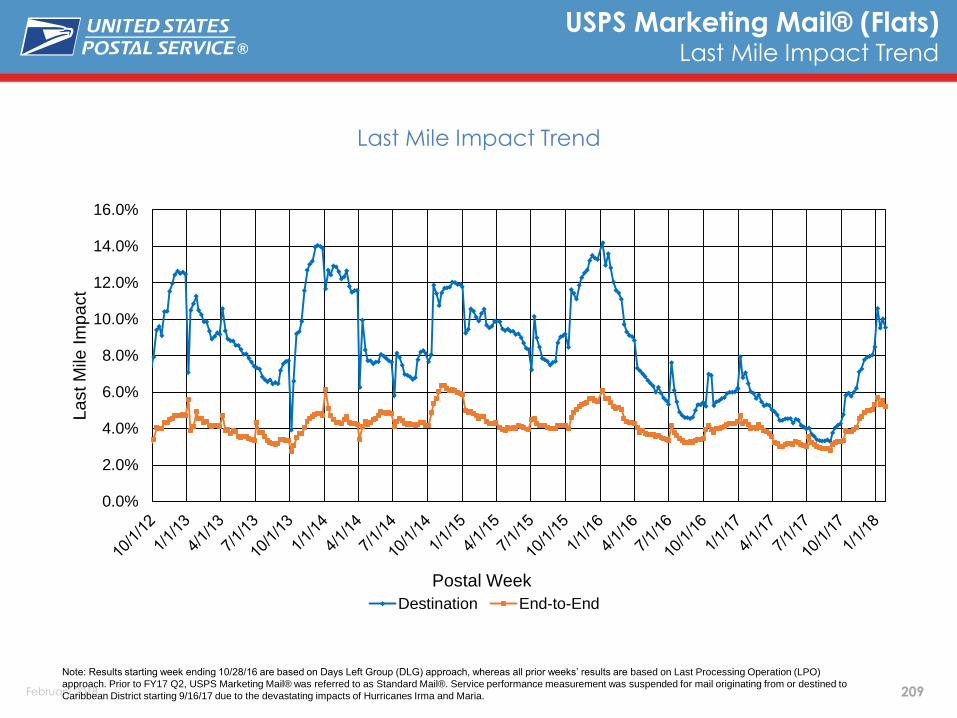
209
®
February 2018
Last Mile Impact Trend
USPS Marketing Mail® (Flats)Last Mile Impact Trend
Note: Results starting week ending 10/28/16 are based on Days Left Group (DLG) approach, whereas all prior weeks’ results are based on Last Processing Operation (LPO)
approach. Prior to FY17 Q2, USPS Marketing Mail® was referred to as Standard Mail®. Service performance measurement was suspended for mail originating from or destined to
Caribbean District starting 9/16/17 due to the devastating impacts of Hurricanes Irma and Maria.
0.0%
2.0%
4.0%
6.0%
8.0%
10.0%
12.0%
14.0%
16.0%
La
st M
ile I
mpact
Postal Week
Destination End-to-End
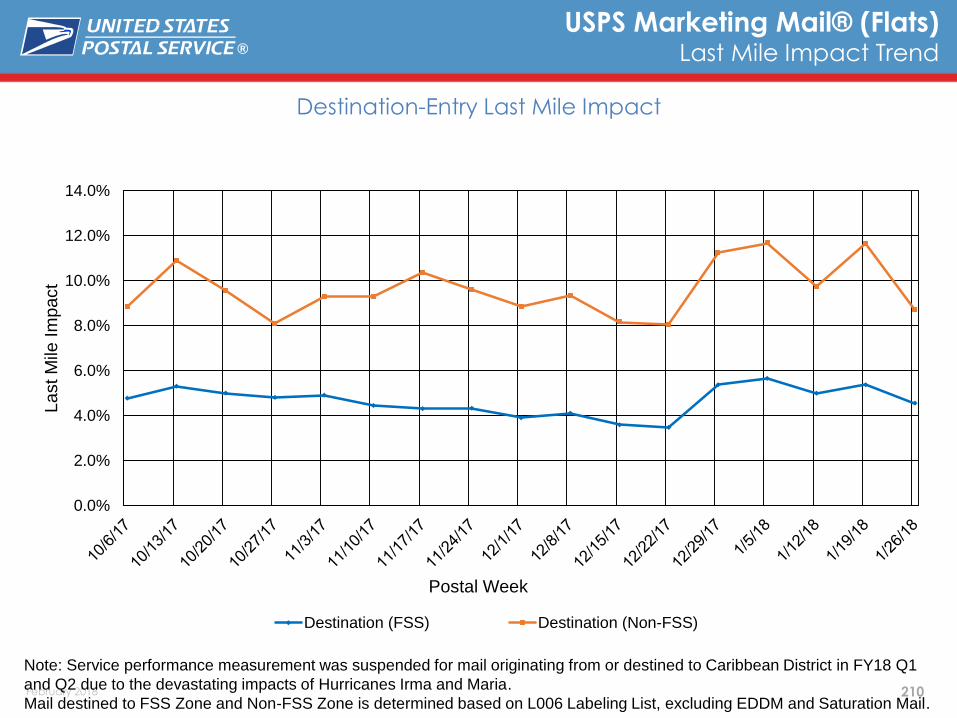
210
®
February 2018
0.0%
2.0%
4.0%
6.0%
8.0%
10.0%
12.0%
14.0%
La
st M
ile I
mpact
Postal Week
Destination (FSS) Destination (Non-FSS)
Note: Service performance measurement was suspended for mail originating from or destined to Caribbean District in FY18 Q1
and Q2 due to the devastating impacts of Hurricanes Irma and Maria.
Mail destined to FSS Zone and Non-FSS Zone is determined based on L006 Labeling List, excluding EDDM and Saturation Mail.
USPS Marketing Mail® (Flats)Last Mile Impact Trend
Destination-Entry Last Mile Impact
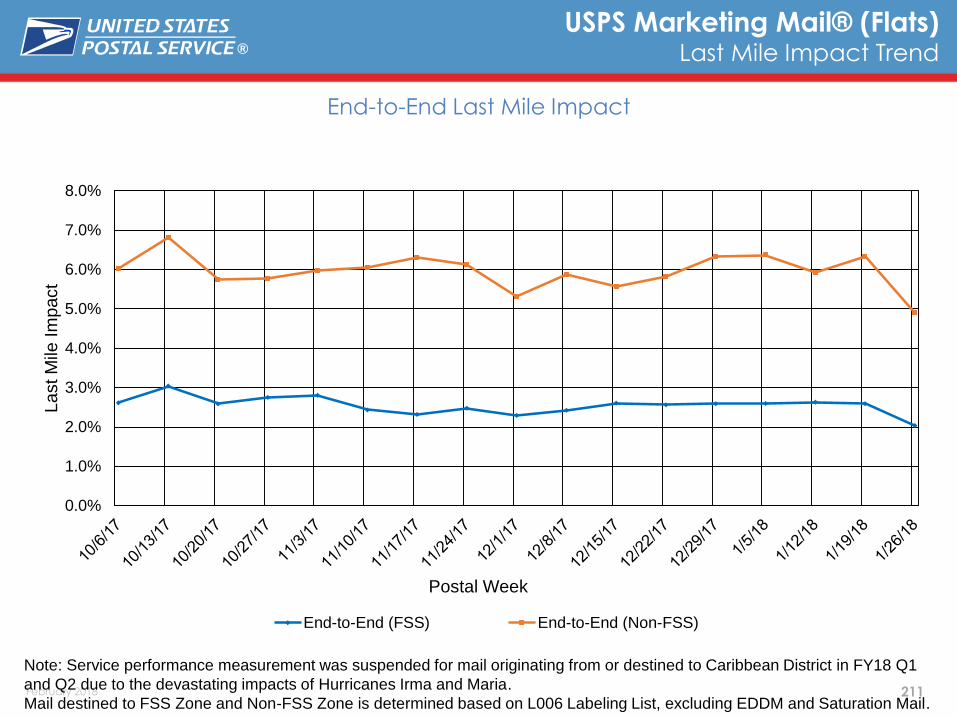
211
®
February 2018
0.0%
1.0%
2.0%
3.0%
4.0%
5.0%
6.0%
7.0%
8.0%
La
st M
ile I
mpact
Postal Week
End-to-End (FSS) End-to-End (Non-FSS)
Note: Service performance measurement was suspended for mail originating from or destined to Caribbean District in FY18 Q1
and Q2 due to the devastating impacts of Hurricanes Irma and Maria.
Mail destined to FSS Zone and Non-FSS Zone is determined based on L006 Labeling List, excluding EDDM and Saturation Mail.
USPS Marketing Mail® (Flats)Last Mile Impact Trend
End-to-End Last Mile Impact
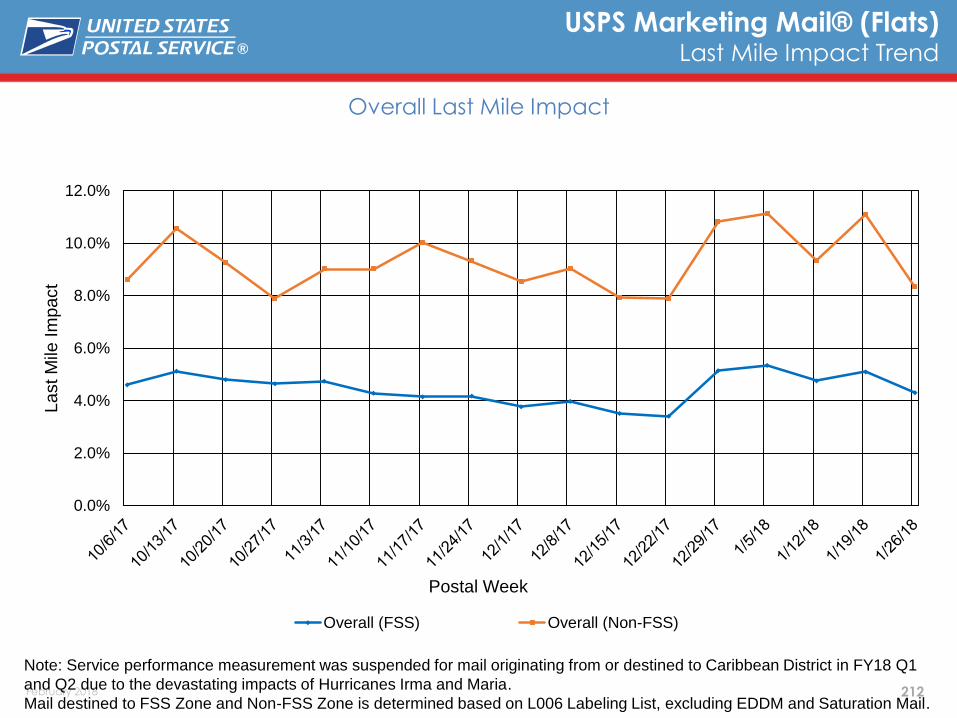
212
®
February 2018
0.0%
2.0%
4.0%
6.0%
8.0%
10.0%
12.0%
La
st M
ile I
mpact
Postal Week
Overall (FSS) Overall (Non-FSS)
Note: Service performance measurement was suspended for mail originating from or destined to Caribbean District in FY18 Q1
and Q2 due to the devastating impacts of Hurricanes Irma and Maria.
Mail destined to FSS Zone and Non-FSS Zone is determined based on L006 Labeling List, excluding EDDM and Saturation Mail.
USPS Marketing Mail® (Flats)Last Mile Impact Trend
Overall Last Mile Impact

213
®
February 2018
Note: Service performance results before Last Mile. Q2TD scores through 1/26/18. Service performance measurement was suspended for mail originating from or destined to
Caribbean District in FY18 Q2 due to the devastating impacts of Hurricanes Irma and Maria.
Q2TD DSCF and DNDC Marketing Flats scores would be above 95.84% (prior to last mile), if pieces that failed by 1 day passed
USPS Marketing Mail® (Flats)Service Variance
93.57%91.61%
51.93%
97.77%95.84%
65.24%
98.99% 97.56%
75.07%
99.40% 98.49%
82.33%
20%
30%
40%
50%
60%
70%
80%
90%
100%
DSCF DNDC End-to-End
QTD Score If Service Variance +1 If Service Variance +2 If Service Variance +3

214
®
February 2018
Thank You!

215
®
February 2018
Appendix

216
®
February 2018
IMpb Compliance Visualization
Dashboard Demo
Explore the possibility of providing a way for mailers to see quality metrics through a D3?
Visualization:
The current visualization will display a summary of the monthly IMpb Compliance Indicators (AQ, MQ, & BQ)
Mailers will be able to drill down to view compliance data at a state level which highlights IMpb compliance
issues by geographic location
http://56.72.7.32:9100/YK/Project_VII/versio
n_20180222/app/
IMPB DASHBOARD DEMO