chicagobta allied member hotel industry update john hach senior vice president travelclick august 2...
TRANSCRIPT
ChicagoBTAAllied Member Hotel Industry Update
John Hach Senior Vice President TravelClick August 2nd, 2012
1
Agenda:
Global hotel performance Global hotel performance
Regional analysis of key North American markets Regional analysis of key North American markets
Local Chicago market perspectiveLocal Chicago market perspective
2012 / 2013 Outlook2012 / 2013 Outlook
Corporate, consortia, BAR research findingsCorporate, consortia, BAR research findings
2

At-A-Glance | Global Trends
Source: Smith Travel Research Note: Europe based on Euro, all other regions in USD. Q1 2012.
3
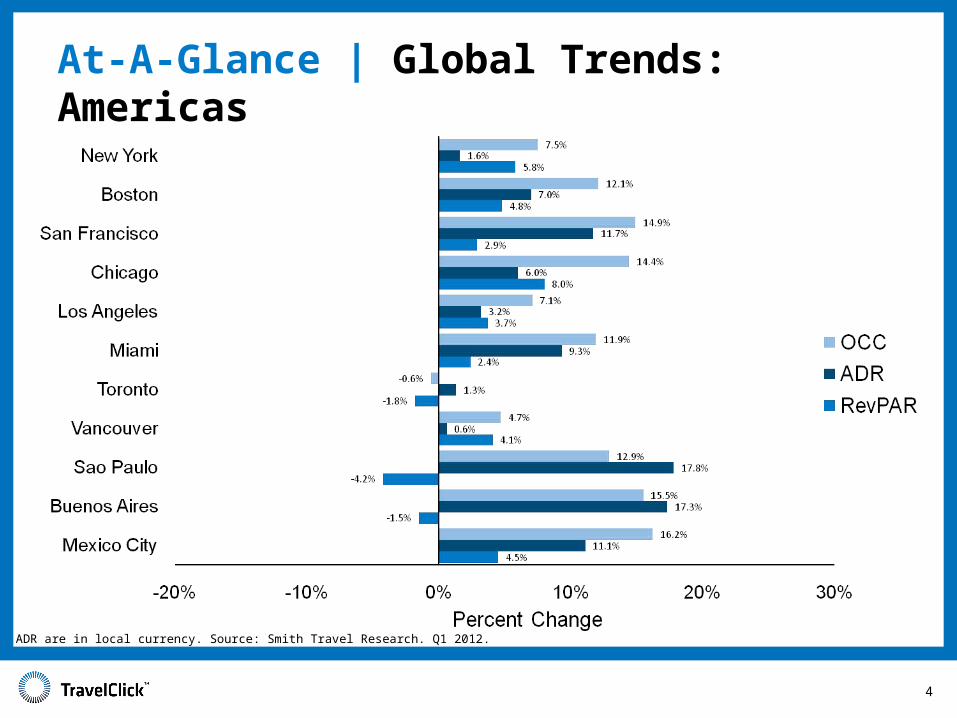
At-A-Glance | Global Trends: Americas
ADR are in local currency. Source: Smith Travel Research. Q1 2012.
4
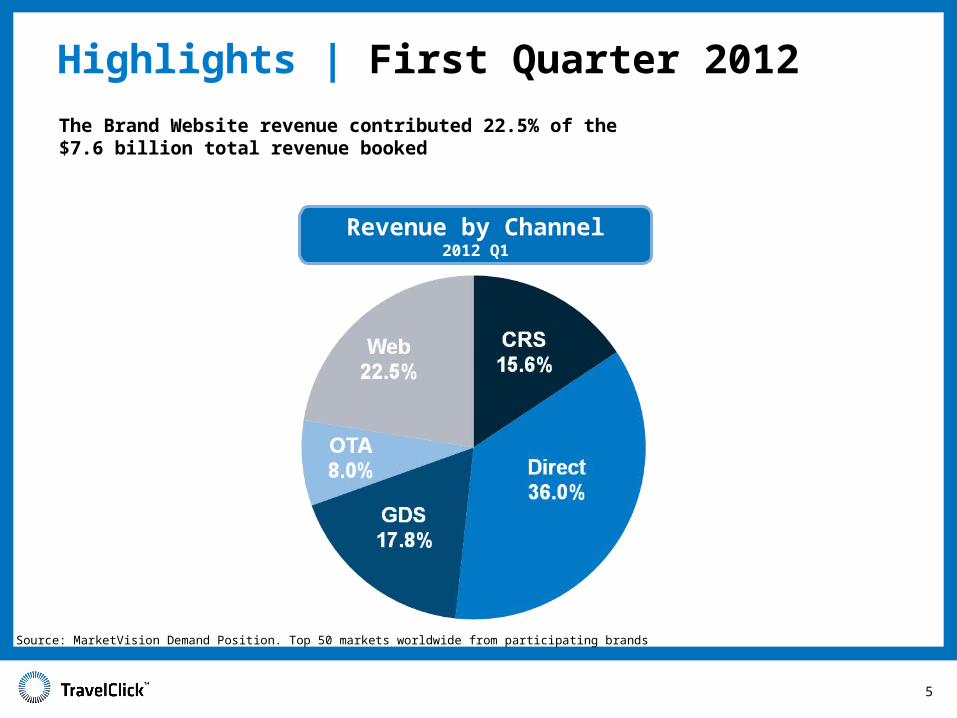
The Brand Website revenue contributed 22.5% of the $7.6 billion total revenue booked
Highlights | First Quarter 2012
Revenue by Channel2012 Q1
5
Source: MarketVision Demand Position. Top 50 markets worldwide from participating brands

Shifting Reservations First Quarter Comparison
6
2012 Q12012 Q1 2011 Q12011 Q1
Source: MarketVision Demand Position. Top 50 markets worldwide from participating brands

Third Party Internet Reservations
7
Source: MarketVision Demand Position. Top 50 markets worldwide from participating brands
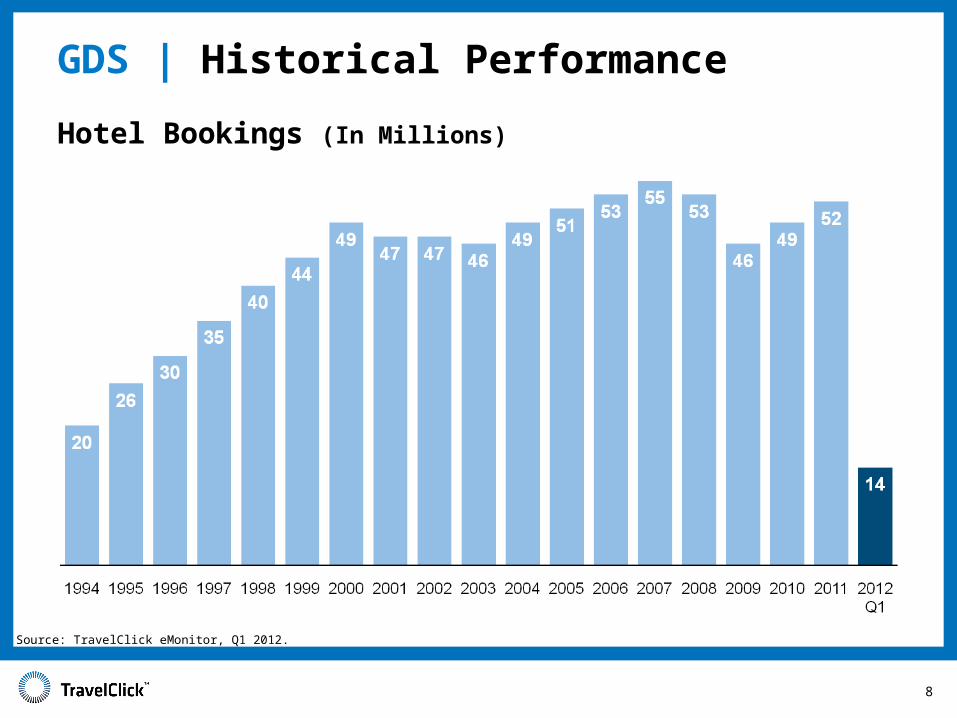
Hotel Bookings (In Millions)
GDS | Historical Performance
Source: TravelClick eMonitor, Q1 2012.
8

ADR by Channel
9
Source: MarketVision Demand Position. Top 50 markets worldwide from participating brands

• For the third quarter of 2012, overall committed occupancy is up 6.8% year-over-year for the top 25 markets.
• Committed occupancy for the group segment is up 5.6% and the transient segment is up 9.9% compared to a year ago.
• ADR for the second quarter is 7.0% ahead compared to the same time last year.
• The group segment ADR is up 6.0% and the transient segment ADR is up 7.5% compared to a year ago.
Emerging Trends / Third Quarter 2012
10
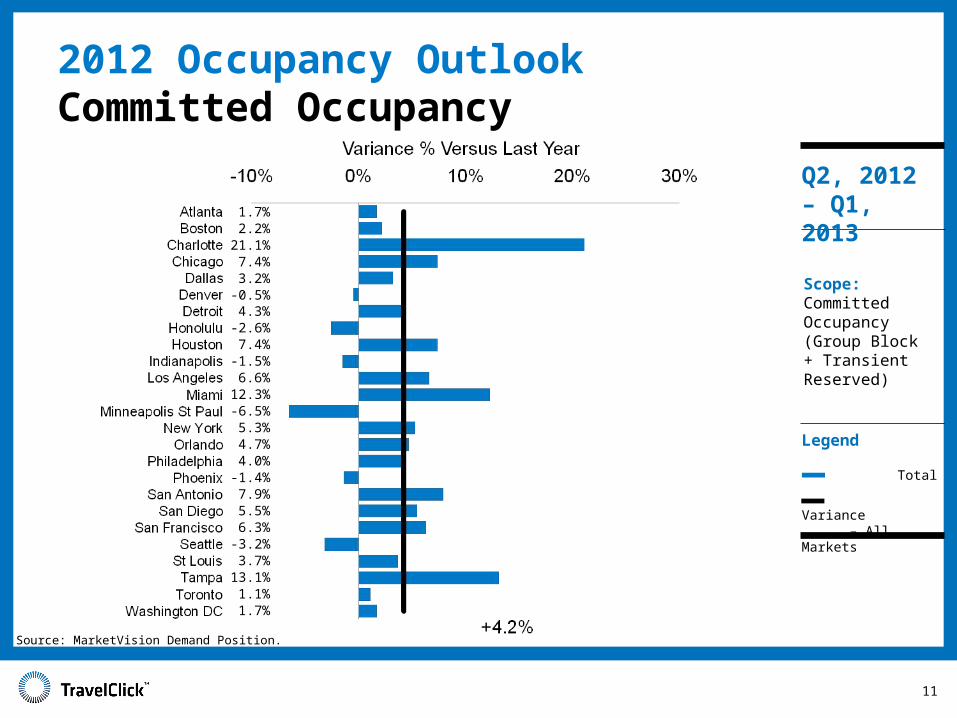
2012 Occupancy OutlookCommitted Occupancy
11
Legend
Total
Variance – All Markets
Scope:Committed Occupancy (Group Block + Transient Reserved)
Q2, 2012 – Q1, 20131.7%
2.2%21.1%7.4%3.2%
-0.5%4.3%
-2.6%7.4%
-1.5%6.6%
12.3%-6.5%5.3%4.7%4.0%
-1.4%7.9%5.5%6.3%
-3.2%3.7%
13.1%1.1%1.7%
Source: MarketVision Demand Position.

3.4%9.4%7.7%8.9%5.3%4.8%8.3%
10.8%5.2%3.2%6.1%4.1%7.4%6.7%5.9%9.9%5.3%6.2%7.3%9.3%7.1%5.3%9.6%
-0.1%1.2%
2012 Average Daily Rate Outlook
12
Note: CAD has depreciated versus the USD by 4% year over year
Legend Total
Variance – All Markets
Scope:ADR (Group Reserved, Transient Reserved)
Q2, 2012 – Q1, 2013
Source: MarketVision Demand Position+6.1%
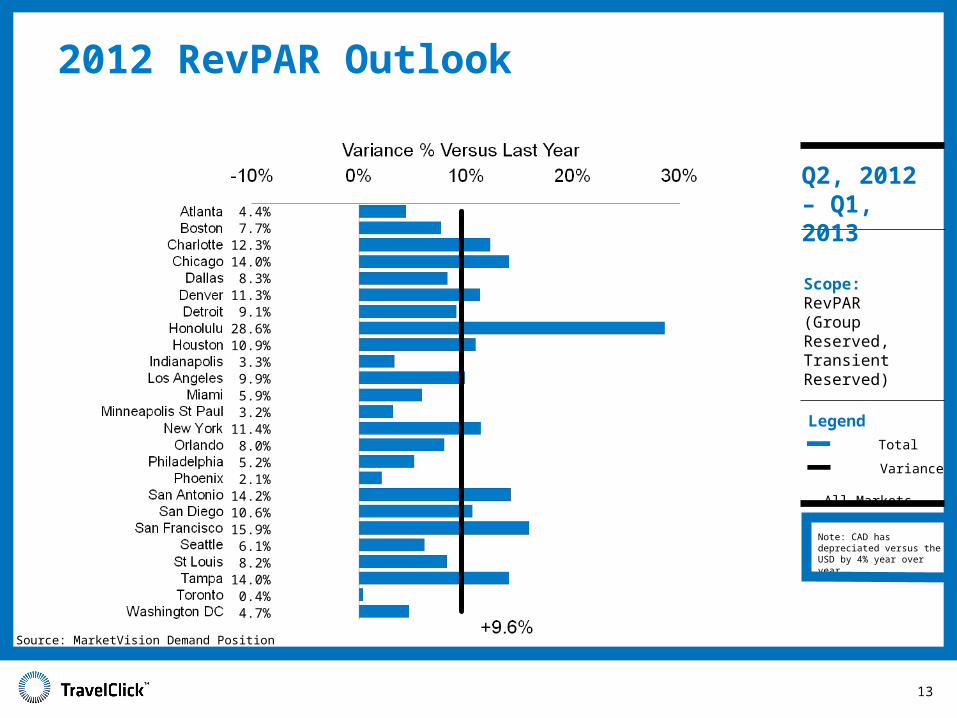
2012 RevPAR Outlook
13
Note: CAD has depreciated versus the USD by 4% year over year
Scope:RevPAR (Group Reserved, Transient Reserved)
4.4%7.7%
12.3%14.0%8.3%
11.3%9.1%
28.6%10.9%3.3%9.9%5.9%3.2%
11.4%8.0%5.2%2.1%
14.2%10.6%15.9%6.1%8.2%
14.0%0.4%4.7%
Legend
Total
Variance – All Markets
Q2, 2012 – Q1, 2013
Source: MarketVision Demand Position
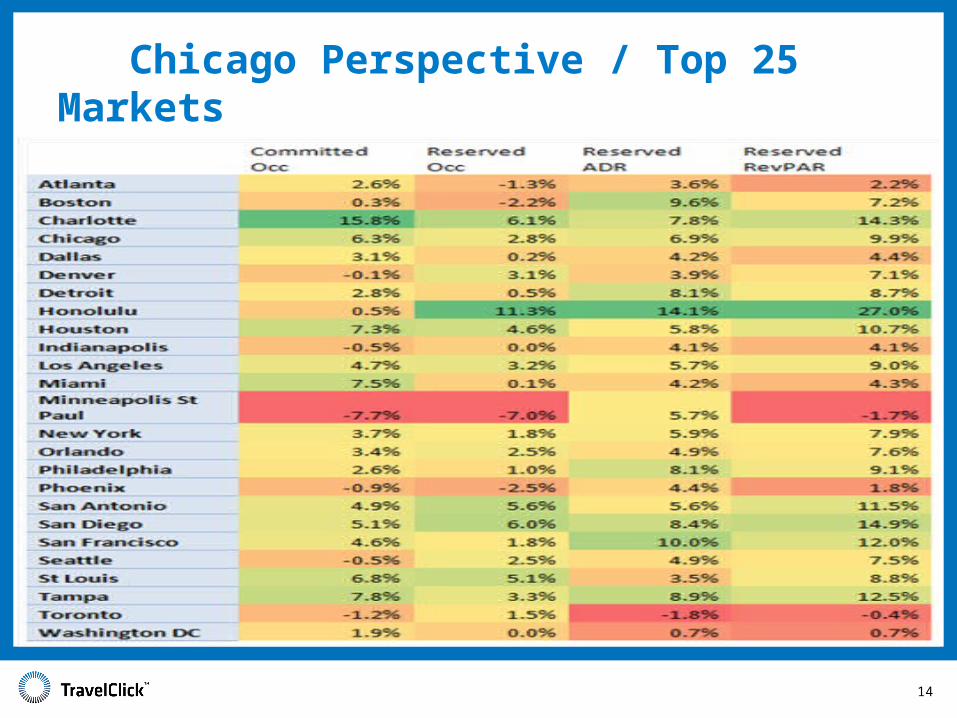
Chicago Perspective / Top 25 Markets June 2012 Through May 2013
14
Corporate / Consortia / BAR
Research Project
15

Corporate Negotiated Rate Disbursement
16

Consortia / BAR Rate Disbursement
17
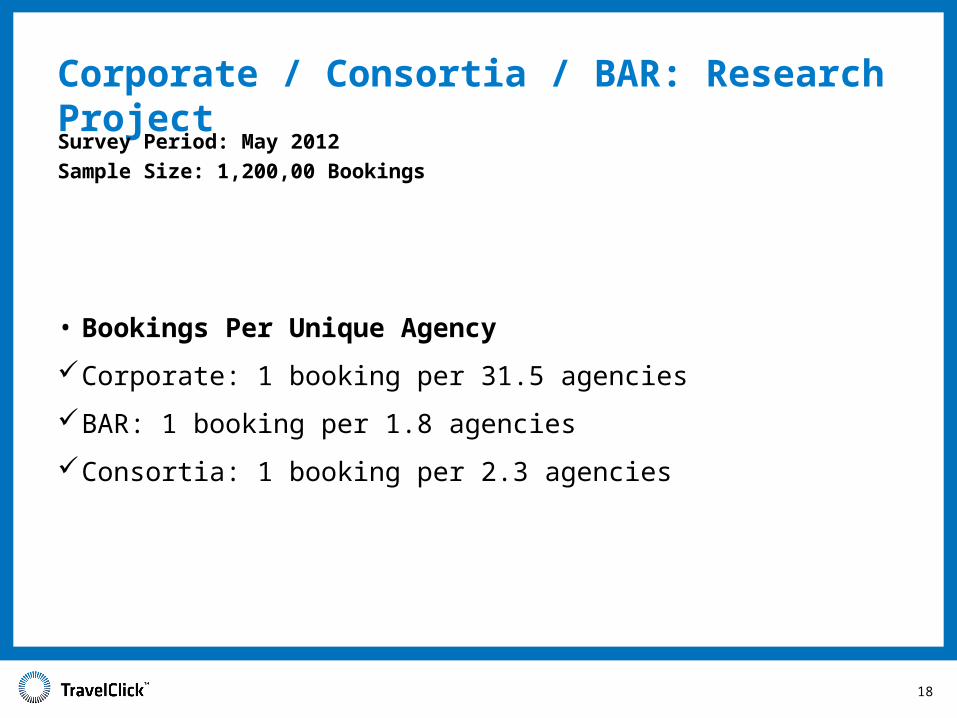
• Bookings Per Unique Agency
Corporate: 1 booking per 31.5 agencies
BAR: 1 booking per 1.8 agencies
Consortia: 1 booking per 2.3 agencies
Corporate / Consortia / BAR: Research Project
Survey Period: May 2012
Sample Size: 1,200,00 Bookings
18
