chicago area waterway system dredged material management
TRANSCRIPT
Chicago Area Waterway System
Dredged Material Management Plan & Integrated Environmental Assessment
APPENDIX D: GEOTECHNICAL ANALYSIS DRAFT
Prepared By:
Chicago District and Rock Island District
June 2015

16 January 2015 D-2
APPENDIX D – GEOTECHNICAL ANALYSIS
TABLE OF CONTENTS
I. INTRODUCTION .........................................................................................................5
II. REGIONAL GEOLOGY AND HYDROGEOLOGY ...............................................7 TOPOGRAPHIC FEATURES ..................................................................................................8 OVERBURDEN GEOLOGY .................................................................................................10 BEDROCK GEOLOGY ....................................................................................................... 11 HYDROGEOLOGY ............................................................................................................12
III. EXISTING CHICAGO AREA CDF ........................................................................15 SITE GEOLOGY ................................................................................................................15 DREDGE MATERIAL PROPERTIES .....................................................................................15
IV. UPLAND ALTERNATIVES .....................................................................................18 333R-B & 333R-A (U01 & U05) - FORMER U.S. STEEL & FORMER U.S STEEL SOUTH
WORKS SITE ....................................................................................................................18 Site Geology...............................................................................................................18 Subsurface Investigations (G-3) ................................................................................18 Hydrogeology ............................................................................................................19 Design Considerations ...............................................................................................19
333L-B (U04) - IROQUOIS LANDING SITE .......................................................................19 Site Geology...............................................................................................................19 Subsurface Investigations (G-3) ................................................................................20 Hydrogeology ............................................................................................................21 Design Considerations ...............................................................................................21
331R (U07) –FORMER WISCONSIN STEEL ......................................................................22 SITE GEOLOGY ...................................................................................................................22
Subsurface Investigations (G-4) ................................................................................22 Hydrogeology ............................................................................................................23 Design Considerations ...............................................................................................23
330L, 330L-C, & 329L-B (U12, U13, & U16) –FORMER INDUSTRIAL SITES .................24 Site Geology...............................................................................................................24 Subsurface Investigations (G-5) ................................................................................24 Hydrogeology ............................................................................................................25 Design Considerations ...............................................................................................25
328R (U08) – STONY ISLAND SOLIDS MANAGEMENT AREA ...........................................26 SITE GEOLOGY ...................................................................................................................26
Subsurface Investigations (G-6) ................................................................................26 Hydrogeology ............................................................................................................27 Design Considerations ...............................................................................................27
331R-A (R01) - LUCAS-BERG CDF ................................................................................28 SITE DEVELOPMENT ...........................................................................................................28
Subsurface Investigations (G-9) ................................................................................29 Hydrogeology ............................................................................................................29 Design Considerations ...............................................................................................30
313R (R02) - RIDGELAND MWRD FORMER DRYING BEDS ............................................30 SITE GEOLOGY ...................................................................................................................30

16 January 2015 D-3
Subsurface Investigations ..........................................................................................31 Hydrogeology ............................................................................................................32 Design Considerations ...............................................................................................32
V. AQUATIC ALTERNATIVE .......................................................................................34 CH02, CH03 & CH01 (A01, A02, A03) – LAKE-FILL SOUTH, LAKE-FILL NORTH, AND
EXPANSION OF EXISTING CDF ........................................................................................34 Design Considerations ...............................................................................................36 Site Geology...............................................................................................................37 Subsurface Investigations (G-5) ................................................................................37 Hydrology ..................................................................................................................37 Design Considerations ...............................................................................................37
333L-A (A10) – TURNING BASIN 1 .................................................................................38 Site Geology...............................................................................................................38 Subsurface Investigations (G-3) ................................................................................38 Hydrology ..................................................................................................................39 Design Considerations ...............................................................................................39
324L (A11) – MARINA ....................................................................................................40 Site Geology...............................................................................................................40 Subsurface Investigations (G-7) ................................................................................40 Hydrology ..................................................................................................................40 Design Considerations ...............................................................................................41
VI. SUMMARY ................................................................................................................41 Existing Ground Considerations ................................................................................41 Two-Stage Berm ........................................................................................................42 Construction Material ................................................................................................43
LIST OF FIGURES Figure 1. Existing CDF Site............................................................................................. 5 Figure 2. Project Site Alternatives (East) ...................................................................... 6 Figure 3. Project Site Alternatives (West) ..................................................................... 6 Figure 4. Formation of Waterway systems across Chicago Region Moraines (Willman, 1971) ................................................................................................................. 9 Figure 5: Bedrock Geological Stratigraphy ................................................................. 14 Figure 6: Approximate Locations of 333R-B, 333L-B, and 333R-A, and Neighboring Sites................................................................................................................................... 18 Figure 7: Approximate Locations of 331R, 330L, 329L-C, & 329L-B ....................... 22 Figure 8: Approximate Location of 328R ..................................................................... 26 Figure 9: Approximate Location of Lucas-Berg (South Cell Outlined) .................... 28 Figure 10: Approximate Location of Ridgeland .......................................................... 30 Figure 11: Cross section of existing MWRD drying bed ............................................. 33 Figure 12: Approximate Locations of CH02, CH03, CH01 ........................................ 34 Figure 13: Approximate Locations of 329L-A ............................................................. 37 Figure 14: Approximate Locations of 333L-A ............................................................. 38 Figure 15: Approximate Locations of 324L.................................................................. 40 Figure 16: Two-stage berm conceptual cross section .................................................. 42

16 January 2015 D-4
LIST OF TABLES
Table 1: Naming of Sites.................................................................................................. 7 Table 2: CDF Material Properties ................................................................................ 16 Table 3: Harbor Material Properties ........................................................................... 17 LIST OF ATTACHMENTS Attachment 1: Soil Maps & Historical Boring Logs
G-1 - Generalized Mapping of the Regional Surficial Geology and Bedrock Topography (U and A Sites)
G-2 - Generalized Mapping of the Regional Surficial Geology and Bedrock Topography (R Sites)
G-3 - Proposed Sites U01, U04, U05, A01, A02, A03, A10 Existing Boring Locations
G-3a - Proposed Site U04 Close-Up Existing Boring Locations G-4 - Proposed Site U07 Existing Boring Locations G-5 - Proposed Sites U12, U13, U16, A08 Existing Boring Locations G-6 - Proposed Site U08 Existing Boring Locations G-7 - Proposed Site A11 Existing Boring Locations G-8 - Proposed Site R02 Existing Boring Locations G-8a - Proposed Site R02 Existing Boring Locations (Northwest Locations) G-8b - Proposed Site R02 Existing Boring Locations (Southeast Locations) G-9 - Proposed Site R01 Existing Boring Locations
Attachment 2: Beneficial Use Investigation
Harbor Sampling Results Memo AECOM Laboratory Testing Report Preliminary Use of Harbor Soils for Fill Memo
Attachment 3: Ridgeland Calumet DMMP Subsurface Investigation Report (313R)

16 January 2015 D-5
I. Introduction 1. The Chicago Area Confined Disposal Facility (CDF) is an approximately 43-acre,
triangular-shaped area that contains disposed dredge sediments from the Calumet Harbor and River. It is located on the southern corner of the intersection of Lake Michigan and the Calumet River. A dike constructed out of prepared limestone and graded armor stone on the exterior borders the site on the north and east site for approximately 4,000 feet. The southwest side was the old coastline and is approximately 3,200 feet long and borders the Illinois Port Authority offloading site and the Chicago Fire Department Helipad. The Port Authority site has since expanded farther south than what is shown in the aerial below.
Figure 1. Existing CDF Site
2. Efforts have been implemented to increase the current capacity of the CDF, such as
increasing perimeter elevations and utilizing mounding and trenching techniques to dewater material as short term material management solutions. However, a long term solution needs to be implemented. Many sites were initially identified, as shown in the figure below.
Existing CDF
Port Authority
CFD Helipad

16 January 2015 D-6
Figure 2. Project Site Alternatives (East)
Figure 3. Project Site Alternatives (West)
3. Of the sites shown in the above maps, many were eliminated for various reasons prior
to the analysis completed in this appendix. Therefore, many of the sites shown above are not discussed.
16 January 2015 D-7
4. All upland and aquatic proposed site alternatives in the eastern area are within the same regional geology as the Chicago Area CDF. Thus, an overview of the regional geology and hydrogeology is presented in Section II is focused on this area, but also mentions the western area with regard to sites that have not been eliminated at this time. Section III includes a description of Chicago Area CDF local geology as well as material properties of the confined materials. Section IV and V include discussions of the regional geology and site specific geology of alternative upland and aquatic sites not yet eliminated or recently eliminated, and their geotechnical design considerations, while Section VI includes a brief summary. Attachments include Maps of the areas proposed and their surficial Geology as well as Aerials of the proposed locations and neighboring boring logs.
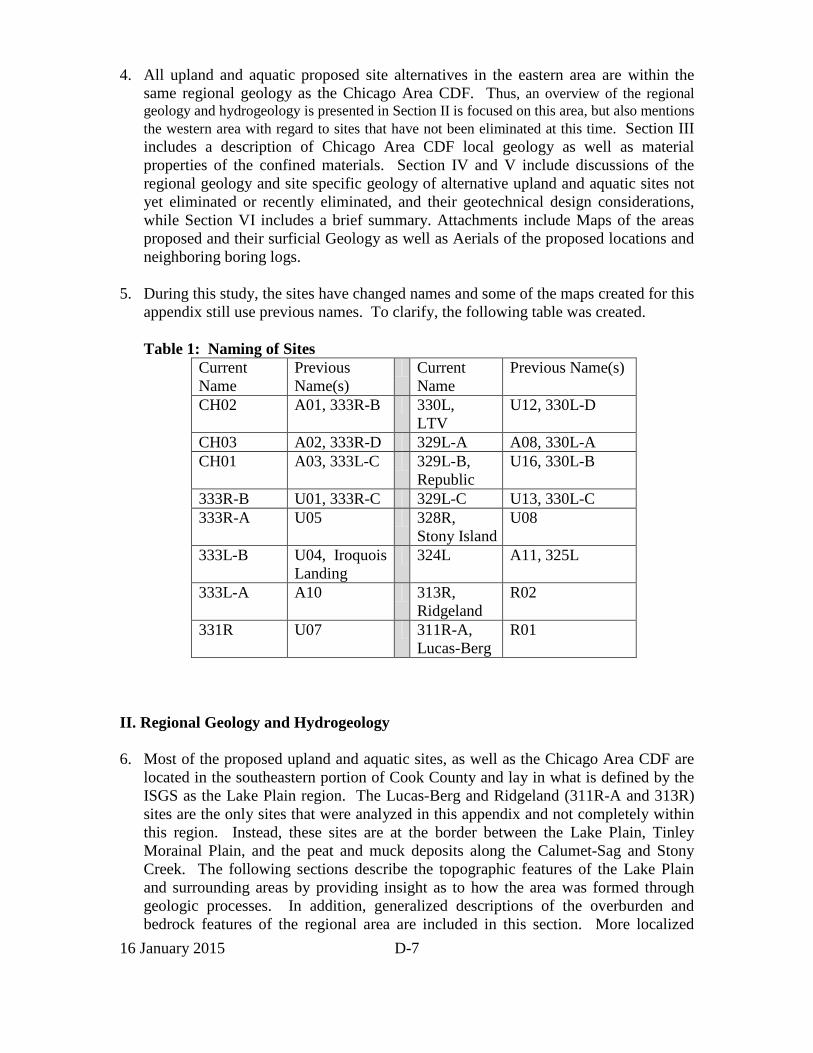
5. During this study, the sites have changed names and some of the maps created for this appendix still use previous names. To clarify, the following table was created.
Table 1: Naming of Sites
Current Name
Previous Name(s)
Current Name
Previous Name(s)
CH02 A01, 333R-B 330L, LTV
U12, 330L-D
CH03 A02, 333R-D 329L-A A08, 330L-A CH01 A03, 333L-C 329L-B,
Republic U16, 330L-B
333R-B U01, 333R-C 329L-C U13, 330L-C 333R-A U05 328R,
Stony Island U08
333L-B U04, Iroquois Landing
324L A11, 325L
333L-A A10 313R, Ridgeland
R02
331R U07 311R-A, Lucas-Berg
R01
II. Regional Geology and Hydrogeology
6. Most of the proposed upland and aquatic sites, as well as the Chicago Area CDF are located in the southeastern portion of Cook County and lay in what is defined by the ISGS as the Lake Plain region. The Lucas-Berg and Ridgeland (311R-A and 313R) sites are the only sites that were analyzed in this appendix and not completely within this region. Instead, these sites are at the border between the Lake Plain, Tinley Morainal Plain, and the peat and muck deposits along the Calumet-Sag and Stony Creek. The following sections describe the topographic features of the Lake Plain and surrounding areas by providing insight as to how the area was formed through geologic processes. In addition, generalized descriptions of the overburden and bedrock features of the regional area are included in this section. More localized

16 January 2015 D-8
information, based primarily on neighboring boring logs, is provided in Sections III through V for each site.
Topographic Features
7. Today’s Chicagoland topography was formed through repeated glaciation processes during the Pleistocene period and subsequently by erosion and man-made alterations. At least three major glaciation events covered the Chicago region in thousands of feet of glacial ice prior to the Wisconsinan Age. During the Wisconsinan Age, several glaciation events spread over the Chicagoland region forming four types of topographic features: the Morainic Uplands, the Lake Plain, the Shore Deposits, and the Stream-Occupied Valleys (Bretz, 1955).
8. As glaciers advanced, soils were transported radially west. As each glacial event receded, materials were deposited at the forefront of the glacier creating the Morainic Uplands. The Morainic Uplands regions include the Valparaiso (Wheaton) Moraine and the Tinley Moraine, which lay west of The Lake Border Moraines. The glacier that built the Lake Border Morainic System did so while the ice front was relatively near the lake front. Drainage from the glacier melt flowed through the current Des Plaines Valley location, depositing sand and gravel along the way. As the glacier receded, Lake Chicago (the ancestor of Lake Michigan) continued to drain lowering its level below current Lake Michigan levels, ending the Woodfordian glaciation period. These periods of previous drainage both into and out of what is now Lake Michigan have made the physiography of the area more amenable to the man-made alterations in river and canal courses over the past 110 years.
9. Additional glaciation and flooding events continued over time as lake levels fluctuated. The Chicago Outlet River continued to form, deepening erosion through bedrock and splitting at its origin from the lake forming today’s two Lake Michigan outlets, the Des Plaines Channel and the Sag Channel (items b,c,d, Figure 4). These outlets eroded over time, leaving soils such as sands, gravels, and organics behind in their channels.

16 January 2015 D-9
Figure 4. Formation of Waterway systems across Chicago Region Moraines
(Willman, 1971)
10. As the Lake Chicago elevation decreased, ultimately becoming what is now known as
Lake Michigan, much of the drift materials were washed away leaving what is known as the Lake Plain; which is found throughout the majority of Cook County. Just as the Lake Plain was the bottom of glacial Lake Chicago, areas closest to today’s Lake Michigan were also once under subsequent Lakes Algonquin, Nippissing, and Algoma, as well (Refer to Figure 4).
11. The Lake Plain area is bound by Lake Michigan to the east and the Tinley Moraine to the west, extending approximately 45 miles in the north-south direction and 15 miles wide at its center. The western boundary of the Lake Plain is defined by any area east of the Tinley Moraine with an elevation below 640 ft, as this is the highest level of Lake Chicago (refer to item a, of Figure 4). The Lake Plain elevation lowers in two distinct steps, each approximately 20 ft, before approaching the eastern boundary elevation, which is equal to that of Lake Michigan, 580 ft. The first step is located at the shorelines of the Calumet stage of Lake Chicago, which brings the Lake Plain Elevation to 620 ft (Refer to Item b of Figure 4). The second major step located along the shorelines of the Tolston stage of Lake Chicago, where the Lake Plain Elevation is 600 ft (Refer to Item b of Figure 4). It is noted that these distinct elevation changes are not as prominent in the northern region of the lake plain between the Lake Boarder Moraines where branches of the lake extend to Des Plaines and Chicago Rivers (Willman, 1971).
12. In general, other than the major stage elevation changes, the Lake Plain area has been relatively flattened over time by wave erosion and by minor depositions in low areas and has remained relatively uneroded by modern streams and rivers that flow above. However, there are low, gently sloping ridges in the area that were once spits and bars in the lake, usually less than 10 ft, which are not immediately obvious, especially in areas that have been developed by man. The major ridges are defined as the Dolton Member of the Equality formation as they have a different soil composition than the
a b c d

16 January 2015 D-10
remaining adjacent material, known as the Carmi Member of the Equality Formation. In addition, there are a few areas within the Lake Plain (such as Thornton and Stony Island) where oval mounds of Silurian bedrock extend above the Lake Plain. This bedrock formation is composed of Silurian reefs that were once a part of the floor of the Silurian seas. Over time they were buried by younger bedrock (limestone). As the glaciation events occurred, the reefs proved to be a more weather-resistant material and did not erode to the extent of the adjacent limestone. The slope of the reefs falls downward beneath the glacial deposits to the generally level bedrock surface. (Willman, 1971).
Overburden Geology
13. As discussed in the previous section, the proposed Chicagoland area underwent many glaciation events and lake elevation changes that formed the various topographic features that are identifiable today. The proposed upland and aquatic sites lay in the regional feature known as the Lake Plain and Tinley Moraine. In general, the Lake Plain region is composed of the Equality Formation materials, deposits that had accumulated in the glacial lakes over time, consisting of silt, sand, gravel, and clay. The Equality Formation is subdivided into two members; the Dolton Member and the Carmi Member. Generally, the Tinley Moraine region is composed of the Wadsworth Formation. Grayslake Peat is another region nearby the Lucas-Berg and Ridgeland sites.
14. The Dolton member is primarily sand material with beds of silt, pebbly sand, and gravel. The Dolton member materials are found in ridged areas, generally less than 10 ft, that were once spits, beaches, or bars of the historic Lakes. Pebbles and gravels are mostly found in narrow belts along shorelines where till, silt, and clay materials were eroded away.
15. The Carmi Member is primarily composed of silt with well-bedded fine sand and clay. The thickness of this material is generally a few feet, but has been found in areas to be as thick as 20 feet.
16. The central concepts of the Wadsworth Formation are its high silt content, moderately
high clay content, gray color, inter-beds of silt and silty clay, and lithologic variability. Some areas of this formation can be more than 40 ft thick, but their areal extent is irregular and difficult to delineate.
17. Grayslake Peat is present on morainal uplands adjacent to current and former lakes
where sediment and organic materials have accumulated. These areas generally contain interbeds of silt, clay and some fine sand. They are generally black to dark brown, soft to firm, can contain shells, and have a thickness varying from around 5 to 20 ft.
18. Overlaying the Equality Formation is generally Richland Loess or Modern Soil. It is noted that there are some locations were Wisconsonian-Holocene formations overlay
16 January 2015 D-11
the Equality formation, however, this formation is not found in the general vicinity of the proposed sites and thus is not further discussed in this report.
19. The Richland Loess is a thin deposit of silt that mantled the Chicago area after glacial melting, however much of it has been transported by run-off into valleys. It is a fine-grained, clayey silt distinguished from the till below by much better sorting, lower clay content, and the absence of pebbles. The thickness of this material in this region is likely less than a foot, and often absent. The material was derived from calcerous silt deposited on the floodplains of major rivers, however it is not calcerous, as carbonates were likely removed from the loess over time as the material was transported through erosion processes.
20. The locations of the Dolton, Wadsworth, Grayslake, and Carmi members of the formation are mapped in Attachments G-1 and G-2. The Richland Loess is not mapped, as it is a relatively thin layer with irregular distribution.
21. In general, bedrock is found between EL 500 and 550 ft, approximately 50 to 100 ft
below overburden materials. The bedrock topography has also been mapped in the Attachments G-1 and G-2.
Bedrock Geology
22. Bedrock in the southern Cook County area consists of over 4,000 feet of sedimentary rock deposited in shallow, epicontinental seas. The rock was deposited during the Cambrian to Pennsylvanian eras and overly Precambrian crystalline rock. The sedimentary rocks generally have very gentle dips and have been subject to periods of uplift, tilting, and erosion resulting in several unconformities. The Kankakee Arch, a broad anticlinal structure trending northwest to southeast across the southern half of the Chicago area, is the major bedrock structure. The sedimentary rocks generally dip gently to the east off the Arch toward the Michigan Basin. This structure is made complicated by the Sandwich Fault Zone, southwest of Joliet, and the Des Plaines Disturbance, a roughly circular down faulted area in northeastern Cook County thought to be a meteorite impact structure. Devonian rocks can be found beneath Lake Michigan while Mississippian rocks have been removed by erosion from the entire area except in the Des Plaines disturbance where they have been preserved by down faulting. Pennsylvanian rocks are found only in the southwest part of the area where they are preserved by down faulting on the Sandwich Fault Zone. Figure 5 represents the geologic stratigraphy of the area.
23. Reef structures are common to the Upper Silurian rocks of northwest Illinois and southwest Wisconsin (Bretz, 1939). These are seen in the local Chicago area quarries. The reef structures consist of domes of massive, unusually coarse grained, vuggy, and fossiliferous dolomite with finer grained, less fossiliferous, dense and well-bedded dolomite dipping radially off the flanks. Horizontal, inter-reef strata separate the reefs. The reef domes sometimes depress the underlying beds, and

16 January 2015 D-12
because of a greater resistance to erosion, sometimes form bedrock highs beneath the glacial drift.
24. The dolomite beds in each formation are strong, hard, brittle, and not affected by desiccation. The primarily dolomitic Silurian formations stand in vertical walls in local quarries where they are mined to produce crushed rock products. They part easily along the argillaceous laminations that occur along the bedding planes. The dolomite beds are also subject to solution by groundwater. This is especially true along joints intersecting the bedrock surface. The solution process produces openings in the rock and increased permeability.
25. Porous, white masses, generally the size of pebbles are common in many of the Silurian dolomite formations (Bretz, 1939). The occurrence or absence is often a criterion for recognizing the formation contacts. They often form an irregular branching of anatomizing pattern. They are often referred to as chert nodules, but usually only consist partly of dense, hard chert that forms light gray cores surrounded by the white, porous material that is a mixture of microcrystalline chert and dolomite.
26. The shale beds are only moderately strong, moderately hard, and slake when exposed. Cores from the shale Maquoketa group begin to split into chips soon after recovery. The shale beds are generally less fractured, not subject to solution by groundwater, and less permeable than the dolomite beds.
Hydrogeology
27. There are four major aquifers in the Chicago area: glacial drift, shallow bedrock consisting of Silurian dolomites, and two deep bedrock aquifers, the Cambrian-Ordovician and the Mount Simon aquifers (Hughes et al., 1966). The shallow bedrock aquifer directly underlies the glacial drift in the Chicago area. The glacial drift contains clayey layers that locally act as a confining layer on top of the upper bedrock aquifer and produce perched water tables. However, the upper bedrock aquifer is locally in hydraulic contact with the drift, particularly where the overburden is relatively thin and/or granular in nature, receiving recharge from precipitation percolating down through the drift. Shale from the Maquoketa Group forms an aquitard separating the shallow bedrock aquifer from the deep bedrock aquifer system.
28. Many studies (Hughes et al., 1966) suggest that the productivity of the shallow bedrock aquifer is primarily through “solution openings in the upper part of the aquifer” developed on the vertical jointing. Most of the wells in the upper bedrock aquifer are completed in the upper 75 feet of rock because solution channels are concentrated there (Suter at al., 1959). However, aquifer testing for the TARP (U.S. Environmental Protection Agency, 1977) indicated that the horizontal permeability along bedding planes is higher than the vertical, joint controlled permeability. It is likely that both types of structures contribute to permeability in the upper bedrock aquifer with the relative importance varying with depth. Near the bedrock surface

16 January 2015 D-13
where the solution process is most active and has the best access to the vertical joint sets, permeability is primarily along these joints. Deeper in the rock column, it appears that bedding is the controlling structure.

16 January 2015 D-14
Figure 5: Bedrock Geological Stratigraphy

16 January 2015 D-15
III. Existing Chicago Area CDF Site Geology
29. The Calumet Harbor is located on a broad arch of Paleozoic bedrock formations which slope gently east below the harbor area at depths of -70 LWD and greater. The arch separates the Michigan and Illinois Basins and is called the Kankakee Arch. It has older Silurian rocks exposed along its crest and younger formations outcropping eastward from the arch which was translated by erosion long ago to a general peneplain surface. Bedrock underlying the project area includes the upper members of the Racine Dolomite of the upper Silurian Niagaran Formation. This is a reef formation of vuggy to dense thin to massive bedded, generally fine grained dolomitized coral rock with many facies changes about 300 feet thick here. The sedimentary rock column is about 5,000 ft thick above the Pre-Cambrian basement rocks. An outcrop of Racine Dolomite occurs at an elevation of around 550 ft about 2 miles due west of the harbor and a small quarry was developed on this outcrop but required overburden stripping and pumping to quarry.
30. A mantle of glacial drift and lacustrine sediments covers the bedrock to depths of
from 50 to 100 ft in the immediate area. Prior to glaciation, an upland plain with thick soils and a regional slope towards a major river flowing northerly along the Axis of modern Lake Michigan characterized the general area then. Bedrock valleys slope easterly towards this major drainage feature. One such valley underlies the existing Calumet River. The first three glacial advances probably covered this area but subsequent severe Wisconsin Stage erosion removed all but remnants in the Calumet Harbor Vicinity. A complex 12 stage sequence of glacial advances and retreats occurred in this immediate area which is briefly discussed in Section II. The till deposited in this area is a Woodfordian substage which, due to shifting lake levels and glacial advances and retreats, can be subdivided into from 11 to 40 lithologic till members.
31. The underlying bedrock can support almost any engineering structure. The hard sandy
clay till w/gravel can readily support rubble mound dikes. The loose sands, silts, soft clay and sludge above the till are of unsuitable to dubious quality but range downward and improve with depth from marginal to satisfactory support material. However, it is noted that driving piles into the hard material becomes increasingly difficult with depth.
Dredge Material Properties
32. Two separate investigations were completed in the existing CDF; one by CDM in July 2006 and one by AECOM in September 2009. The investigation by CDM involved taking twelve soil borings to depths between 16 and 31.5 feet below grade and three grab samples in the area covered by water. CDM described the dredged materials disposed in the CDF as generally consisting of 15 to 20 ft of silt and clay
16 January 2015 D-16
overlying native fine to medium grained sands. The coarse sand fraction accounted for between 20% and 59% of the sample volume in the 12 samples collected.
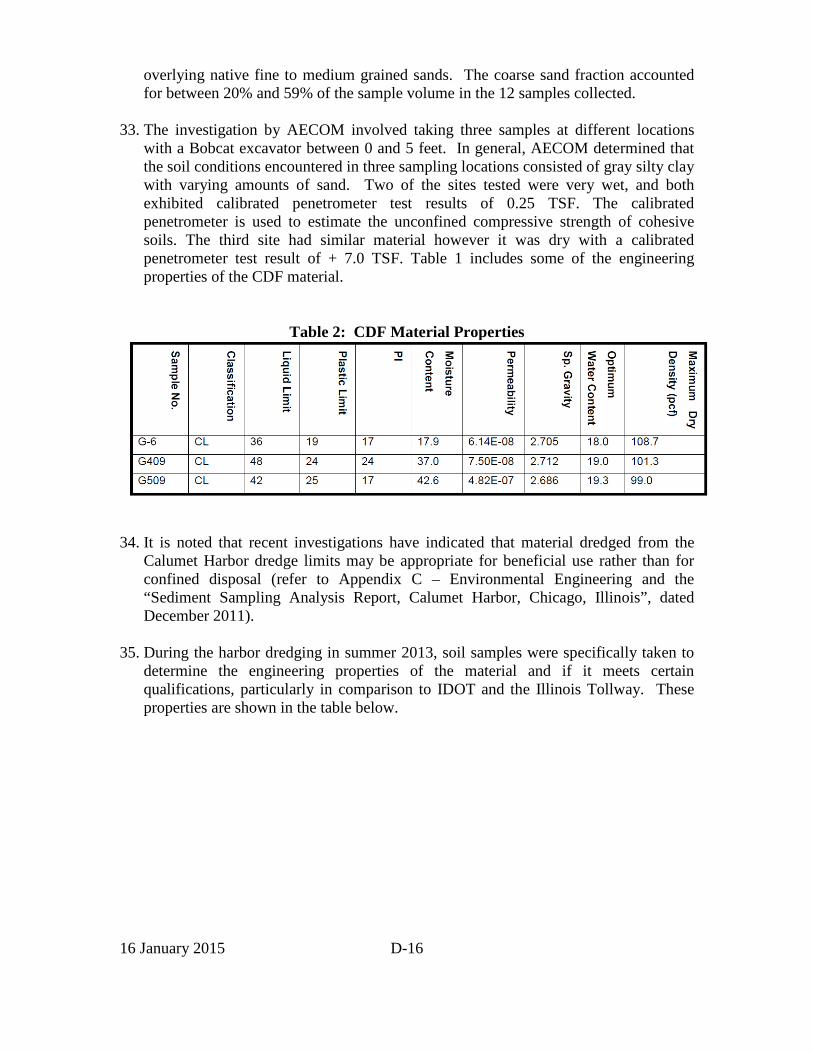
33. The investigation by AECOM involved taking three samples at different locations
with a Bobcat excavator between 0 and 5 feet. In general, AECOM determined that the soil conditions encountered in three sampling locations consisted of gray silty clay with varying amounts of sand. Two of the sites tested were very wet, and both exhibited calibrated penetrometer test results of 0.25 TSF. The calibrated penetrometer is used to estimate the unconfined compressive strength of cohesive soils. The third site had similar material however it was dry with a calibrated penetrometer test result of + 7.0 TSF. Table 1 includes some of the engineering properties of the CDF material.
Table 2: CDF Material Properties
34. It is noted that recent investigations have indicated that material dredged from the
Calumet Harbor dredge limits may be appropriate for beneficial use rather than for confined disposal (refer to Appendix C – Environmental Engineering and the “Sediment Sampling Analysis Report, Calumet Harbor, Chicago, Illinois”, dated December 2011).
35. During the harbor dredging in summer 2013, soil samples were specifically taken to determine the engineering properties of the material and if it meets certain qualifications, particularly in comparison to IDOT and the Illinois Tollway. These properties are shown in the table below.

16 January 2015 D-17
Table 3: Harbor Material Properties
36. For more information on the beneficial use, refer to Attachment 2 which includes a memo describing the sampling and testing procedure, the AECOM testing report, and a memo comparing the existing test data with the Illinois Tollway specifications. The soil is predominantly silt with clay and fine sand. It was determined that the material exceeds the minimum unit weight for both IDOT (90 pcf) and Illinois Tollway (98 pcf) specifications. Additionally, the organic content of the harbor materials was less than 2%, which is below the maximum 10% according to IDOT. The Tollway does not have a specific cutoff and just states that organic soils shouldn’t be used.
37. As a result of these and other previous tests, this material is considered geotechnically suitable for reuse. However, significant drying is required, as the natural water content at the bottom of the lake is around 40 to 50% while the optimum is 15.6 to 18.1%. To use the dredged material beneficially, the water content should be within 3% of the optimum. With the large amount of fine-grained soils, drying will take several weeks to months depending on the thickness of the layer, number of times handled, weather, application of lime, etc.

16 January 2015 D-18
IV. Upland Alternatives
Figure 6: Approximate Locations of 333R-B, 333L-B, and 333R-A, and Neighboring
Sites
333R-B & 333R-A (U01 & U05) - Former U.S. Steel & Former U.S Steel South works Site
Site Geology 38. 333R-B and 333R-A are adjacent properties separated by a narrow strip of land.
These sites were combined in this report due to their close proximities and similar histories as former Steel plants (Refer to Figure 6). These sites are located in an area identified by the Illinois State Geologic Survey as being man-made land consisting of fill. At one time, the area was covered by Lake Michigan and Lake Calumet and was largely composed of sand. Given the history of the sites as steel plants, and the knowledge of neighboring Calumet Harbor, the site is likely filled with slag, gravel, crushed limestone, and manufacturing debris to a depth at least 20 ft, with the exception of a portion of the South works site near the lake front which has reportedly had more recent fill placement utilizing Lake Peoria dredged materials.
Subsurface Investigations (G-3) 39. No known subsurface investigations were performed within the local vicinity of the
proposed Former U.S. Steel Site locations. The nearest borings were taken as part of the Calumet Harbor Subsurface Investigation in 1979 and as part of a 2001 Air and Sea CFD rescue facility subsurface investigation located approximately 5,000 to 8,000 ft from the 333R-B site and less than 3,000 ft from the 333R-A site. These historical borings indicate that the adjacent Calumet and nearby CFD sites are filled with slag, cinders, glass, sand, silt, gravel, and crushed limestone to approximately 20 to 25 ft below ground surface, before encountering a layer of medium to dense sand of approximate 20 ft thickness overlaying clayey silt with traces of gravel near 40-50 ft below ground surface.
333R-B 333R-A
333L-B
Chicago Area CDF
Port Authority Land
CFD N

16 January 2015 D-19
40. The historical subsurface investigations at the Calumet Harbor and the CFD Sites may not be representative of the soil conditions at the proposed former U.S. Steel sites. In addition, material property information is not available. Geotechnical Investigations are required to determine the stratigraphy and physical properties of the material at the proposed sites.
Hydrogeology 41. A local well search in the area indicated that there are no active pumping wells,
however, according to ISGS Aquifer mapping, there is likely a shallow aquifer present in the area less than 50 ft below ground surface. There is also likely a major rock aquifer within 300 ft of ground surface.
Design Considerations 42. The proposed locations will require local subsurface investigations to identify the
local soil stratigraphy and material properties both along the perimeters and within the site. It is likely that a dike will need to be built to function as the perimeter confinement and drainage will be required. In particular, existing material strength parameters and hydraulic conductivity parameters will be required to perform stability and seepage analyses.
333L-B (U04) - Iroquois Landing Site
Site Geology 43. 333L-B is positioned adjacent and westward of the current CDF (Refer to Figure 6).
This area is public lands belonging to the Chicago Regional Port District Iroquois Landing - Lake Front Terminus. The Port Authority's Lands are separated into two areas. The North half of the area is the actual Port Facility while the south half is an ongoing landfill area incorporating municipal and steel mill industrial solid wastes. The entire area including Calumet Park which lies south and east of the proposed Lacustrine Disposal area is assumed to be underlain by fill. Prior to 1869, U.S. 41 and the E. J. and E. Railroad paralleled the Lake Michigan shoreline on road right of ways which have not changed significantly since that date. Wharfs and slips had been constructed along the beach. Initial improvement consisted of landfills immediately north and south of the mouth of the Calumet River prior to 1882. These fills consisted of earth fill chiefly sands and clays with some intermingled municipal and industrial wastes plus harbor and Calumet River dredging. The shoreline was extended by the dumping of industrial steel mill wastes from Illinois Steel Co., "Iroquois" plant, now the property of U.S. Steel, both north and south of the river. During World War I, a major steel mill expansion was constructed by U.S. Steel, while Youngstown Sheet and Tube Steel Co. purchased and established blast furnaces, foundries and other facilities on the fill lands created by massive dumping of slag, ash, foundry sand, cinders, etc. lakeward into Lake Michigan. This operation was discontinued after World War II and replaced by the present Chicago Port
16 January 2015 D-20
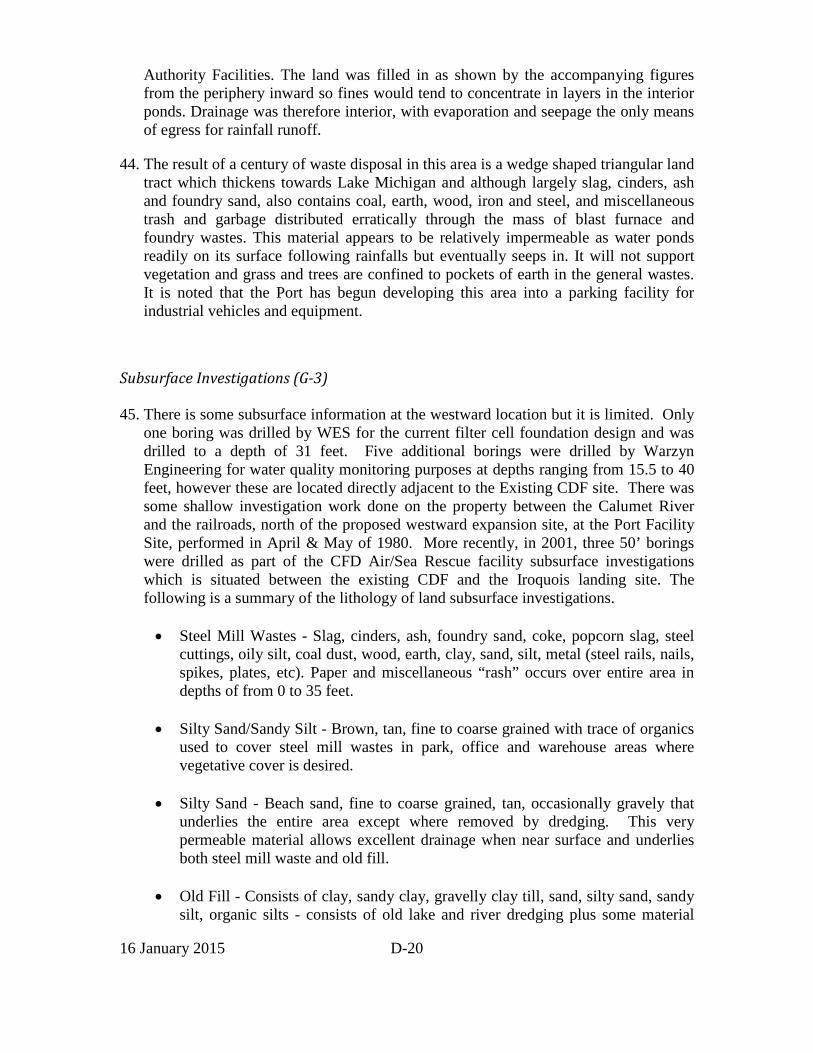
Authority Facilities. The land was filled in as shown by the accompanying figures from the periphery inward so fines would tend to concentrate in layers in the interior ponds. Drainage was therefore interior, with evaporation and seepage the only means of egress for rainfall runoff.
44. The result of a century of waste disposal in this area is a wedge shaped triangular land tract which thickens towards Lake Michigan and although largely slag, cinders, ash and foundry sand, also contains coal, earth, wood, iron and steel, and miscellaneous trash and garbage distributed erratically through the mass of blast furnace and foundry wastes. This material appears to be relatively impermeable as water ponds readily on its surface following rainfalls but eventually seeps in. It will not support vegetation and grass and trees are confined to pockets of earth in the general wastes. It is noted that the Port has begun developing this area into a parking facility for industrial vehicles and equipment.
Subsurface Investigations (G-3) 45. There is some subsurface information at the westward location but it is limited. Only
one boring was drilled by WES for the current filter cell foundation design and was drilled to a depth of 31 feet. Five additional borings were drilled by Warzyn Engineering for water quality monitoring purposes at depths ranging from 15.5 to 40 feet, however these are located directly adjacent to the Existing CDF site. There was some shallow investigation work done on the property between the Calumet River and the railroads, north of the proposed westward expansion site, at the Port Facility Site, performed in April & May of 1980. More recently, in 2001, three 50’ borings were drilled as part of the CFD Air/Sea Rescue facility subsurface investigations which is situated between the existing CDF and the Iroquois landing site. The following is a summary of the lithology of land subsurface investigations.
• Steel Mill Wastes - Slag, cinders, ash, foundry sand, coke, popcorn slag, steel
cuttings, oily silt, coal dust, wood, earth, clay, sand, silt, metal (steel rails, nails, spikes, plates, etc). Paper and miscellaneous “rash” occurs over entire area in depths of from 0 to 35 feet.
• Silty Sand/Sandy Silt - Brown, tan, fine to coarse grained with trace of organics
used to cover steel mill wastes in park, office and warehouse areas where vegetative cover is desired.
• Silty Sand - Beach sand, fine to coarse grained, tan, occasionally gravely that
underlies the entire area except where removed by dredging. This very permeable material allows excellent drainage when near surface and underlies both steel mill waste and old fill.
• Old Fill - Consists of clay, sandy clay, gravelly clay till, sand, silty sand, sandy
silt, organic silts - consists of old lake and river dredging plus some material
16 January 2015 D-21
excavated locally generally morainic materials such as sands and clays. Underlies steel mill wastes particularly in older fill areas.
• Natural Ground - Undisturbed Lacustrine soft to stiff clays and silts beneath
beach sands and overlying stiff to hard sandy gravelly silty clay till. Present at depth over the entire area and also underlies confined disposal area.
46. The historical data gives us an idea of what may be present at the Iroquois landings
site, however, there currently are no known borings taken beyond the west limits of the current CDF and Air/Sea Rescue site, nor beyond the south limits of the existing Port Facility Property. It is highly recommended that a geotechnical investigation and analysis be performed at the proposed westward expansion area as this expansive area may substantially differ from the locations previously studied.
Hydrogeology 47. A local well search in the area indicated that there are no active pumping wells,
however, according to ISGS Aquifer mapping, there is likely a shallow aquifer present in the area less than 50 ft below ground surface. There is also likely a major rock aquifer within 300 ft of ground surface. The area currently drains toward Lake Michigan to the east; however the existing Chicago Area CDF provides a barrier to the lake making flow difficult to enter into the lake through low permeability materials.
Design Considerations 48. The proposed location will require local subsurface investigations to identify the local
soil stratigraphy and material properties both along the perimeters and within the site. It is likely that an embankment will need to be built to function as the perimeter confinement and drainage will be required. There is an existing embankment around the perimeter that may need to be increased in elevations at some portions and decreased in others in order to meet design criteria. The existing material within these embankments is unknown. Existing material strength parameters and hydraulic conductivity parameters will be required to perform stability and seepage analyses at the site.
16 January 2015 D-22
Sites 331R, 330L, 329L-C, 329L-B (U07, U12, U13, & U16)
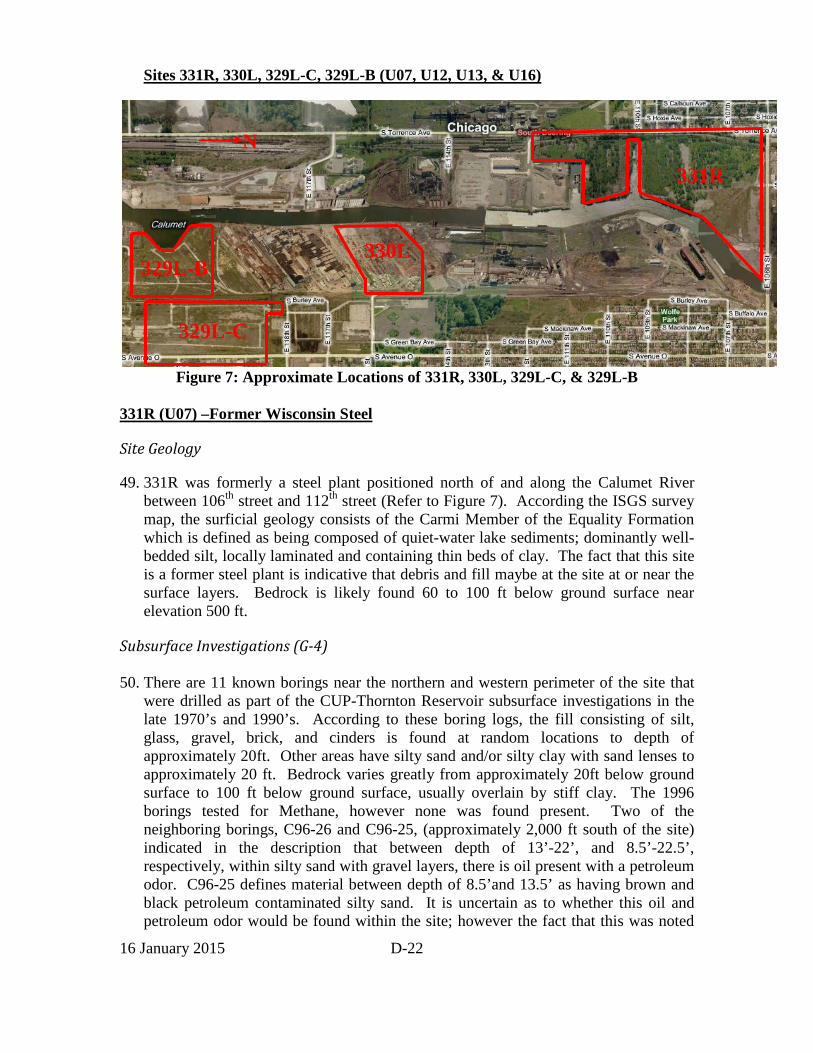
Figure 7: Approximate Locations of 331R, 330L, 329L-C, & 329L-B
331R (U07) –Former Wisconsin Steel
Site Geology
49. 331R was formerly a steel plant positioned north of and along the Calumet River between 106th street and 112th street (Refer to Figure 7). According the ISGS survey map, the surficial geology consists of the Carmi Member of the Equality Formation which is defined as being composed of quiet-water lake sediments; dominantly well-bedded silt, locally laminated and containing thin beds of clay. The fact that this site is a former steel plant is indicative that debris and fill maybe at the site at or near the surface layers. Bedrock is likely found 60 to 100 ft below ground surface near elevation 500 ft.
Subsurface Investigations (G-4) 50. There are 11 known borings near the northern and western perimeter of the site that
were drilled as part of the CUP-Thornton Reservoir subsurface investigations in the late 1970’s and 1990’s. According to these boring logs, the fill consisting of silt, glass, gravel, brick, and cinders is found at random locations to depth of approximately 20ft. Other areas have silty sand and/or silty clay with sand lenses to approximately 20 ft. Bedrock varies greatly from approximately 20ft below ground surface to 100 ft below ground surface, usually overlain by stiff clay. The 1996 borings tested for Methane, however none was found present. Two of the neighboring borings, C96-26 and C96-25, (approximately 2,000 ft south of the site) indicated in the description that between depth of 13’-22’, and 8.5’-22.5’, respectively, within silty sand with gravel layers, there is oil present with a petroleum odor. C96-25 defines material between depth of 8.5’and 13.5’ as having brown and black petroleum contaminated silty sand. It is uncertain as to whether this oil and petroleum odor would be found within the site; however the fact that this was noted
330L
329L-C
329L-B
331R
N

16 January 2015 D-23
to be found in a relatively permeable sand layer, it is likely to be located in more locations around the site.
51. The ISGS Survey of Water and Related wells indicated that 5 wells have been drilled at or near the site. These drilling records agree with boring information in that there is random fill in some location, Carmi member sand layers in some locations, and clay till in others.
52. The historical data gives us an idea of what may be present at the 331R site, however, there currently are no known borings taken within the limits of the 331R site. It is highly recommended that a geotechnical investigation and analysis be performed at the proposed site as this area may differ from the locations previously studied.
Hydrogeology 53. A local well search in the area indicated that there are no active pumping wells,
however. According to ISGS Aquifer mapping, there is not shallow aquifer present in the area less than 50 ft below ground surface, however, there likely a major rock aquifer within 300 ft of ground surface.
Design Considerations 54. Due to the great variation in overburden thickness and materials present in
neighboring borings, and the lack of subsurface information anywhere within the proposed site location, local subsurface investigations are required to identify the local soil stratigraphy and material properties both along the perimeters and within the site. It is likely that an embankment will need to be built to function as the perimeter confinement and drainage will be required. In particular, existing material strength parameters and hydraulic conductivity parameters will be required to perform stability and seepage analyses.
55. It is noted that there is a concern of contamination at the site within the relatively shallow permeable sand layer (13 to 22 ft below ground surface). This contaminant may have travelled through the permeable material and may be present throughout the site. The indication that there is fill and debris at or near the surface randomly throughout the site also raises some concerns especially since this location is directly adjacent to a waterway. Although this site will likely be capped, the question of seepage through the permeable subsurface layers that drains into the river may need to be addressed. A cutoff wall may need to be considered to contain in place contaminants and prevent further contaminant transport through the sandy and likely permeable materials.

16 January 2015 D-24
330L, 330L-C, & 329L-B (U12, U13, & U16) –Former Industrial Sites
Site Geology 56. 330L (LTV), 329L-C, and 329L-B (Republic), former industrial sites, are all located
within close proximity of each other south of the Calumet River between 114th street and 122nd street and north of Avenue O (Refer to Figure 7). The three sites lay in a region that is predominantly composed of Carmi Member materials of the Equality formation; however there is a long narrow bar of Dolton Member material that cuts through the center of the three sites. The Carmi Member materials are primarily composed of quiet-water lake sediments, dominantly well-bedded silt, locally laminated and containing thin beds of clay. The Dolton Member is primarily shallow-water, near-shore lake sediments dominantly medium-grained sand containing beds of silt where gradational to Carmi Member materials.
57. According to ISGS surficial geology mapping, site 330L (LTV), the northern most of the three sites, straddles the two surficial geology formations, the Carmi Member to the west and the Dolton Member to the east; site 329L-B (Republic) lays entirely within the Dolton Member, while 329L-C straddles the Dolton Member to the West and the Carmi Member to the East.
Subsurface Investigations (G-5) 58. There is some subsurface information available in the vicinity of the three sites.
Several borings are located west of the Calumet River that may give some indication of what may be present on the east side of the river. In addition, there are a few borings that were taken just south of the 329L-C site and 1 boring at the southeastern tip of the 329L-B site. All borings were taken as part of the TARP-Calumet Tunnel, Torrence Avenue investigation in the late 1970’s and 1990’s.
59. Additional borings were available from Site 329L-B (Republic) that were completed in 2004. They encountered about 4 to 15 feet of fill materials consisting of gravel, sand, slag, silt, organics, coal, and bricks. Beneath the fill, native soils include sand, silt, clay, and peat to the termination depth of 8 to 16 ft below grade.
60. The borings that were taken on the west side of the Calumet River, indicate that there is a shallow layer of fill and debris to depth of approximately 5 to ten ft followed by an approximate 20 ft sand layer before encountering a thick layer of silty clay with sand lenses to the depth of bedrock. Bedrock in this area is approximately 60 ft to 70 ft below ground surface. The 1996 borings tested for Methane, however none was found present. Two of the neighboring borings, C96-26 and C96-25, indicated that between depths of 8.5’-22’, within the silty sand layer, there is oil sheen present with a petroleum odor. C96-25 defines material between depth of 8.5’and 13.5’ as having brown and black petroleum contaminated silty sand. It is noted that the borings are located across the river from the 330L (LTV) site near a former steel plant. Although 330L is located on the opposite side of the river, it is also a former steel plant and

16 January 2015 D-25
may have similar contamination, however, this is not known due to limited information at the 330L (LTV) site.
61. The borings taken at the south end of the 329L-C and 329L-B site indicate that there is a shallow layer of fill near the ground surface, approximately 10 ft thick followed by approximately 20 ft of sand layer before encountering hard silty clay to the depth of bedrock with thin layers of sand. Bedrock at the southern end of the sites is approximately 100 ft below ground surface.
62. While there are borings located at 329L-B (Republic), they do not include any
laboratory data on the materials which would be used in designing the CDF. Additionally, there are no known subsurface investigations on the other two sites. It is highly recommended that a geotechnical investigation and analysis be performed at the proposed sites as to better define and understand the subsurface conditions.
Hydrogeology 63. A local well search in the area indicated that there are no active pumping wells,
however, according to ISGS Aquifer mapping, there is likely a shallow aquifer present in the area less than 50 ft below ground surface. There is also likely a major rock aquifer within 300 ft of ground surface.
64. Local boring searches have identified that there is water present at vary shallow depths below ground surface at depths of 5 to 10 ft. The sandy materials to depths of at least 20ft are described in the boring logs to be either wet or moist through to clay confining layers. It is likely that the shallow aquifer flows into the Calumet River.
Design Considerations 65. The existing boring logs from 329L-B (Republic) do not include any testing data, and
the other sites do not have any subsurface information onsite. Therefore, local subsurface investigations are required to identify the local soil stratigraphy and material properties both along the perimeters and within every one of these sites. It is likely that an embankment will need to be built to function as the perimeter confinement and drainage will be required. In particular, existing material strength parameters and hydraulic conductivity parameters will be required to perform stability and seepage analyses for the embankment, as well as, for foundations of structures that are required for a CDF.
66. With the predominantly coarse-grained subsurface, seepage control would be necessary. Depth to a clay layer on site could not be determined, other than it is greater than 15 ft below grade. Nearby borings indicate the clay could be anywhere between 15 and 40 ft below grade. A cutoff wall would have to extend a few feet into the clay layer. Alternatively, a clay blanket can be constructed across the entire bottom of the site.
67. It is assumed this site would use compacted berms to contain the material. The existing site material unlikely to be suitable for use as berm material, based on the
16 January 2015 D-26
amount of deleterious materials including slag, brick, coal, wood, etc that was encountered. Additionally, the likelihood of contamination of the existing soil is increased based on the previous use of the sites. Peat encountered is several feet below grade and should be analyzed to determine if it contributes to an increased settlement rate.
328R (U08) – Stony Island Solids Management Area
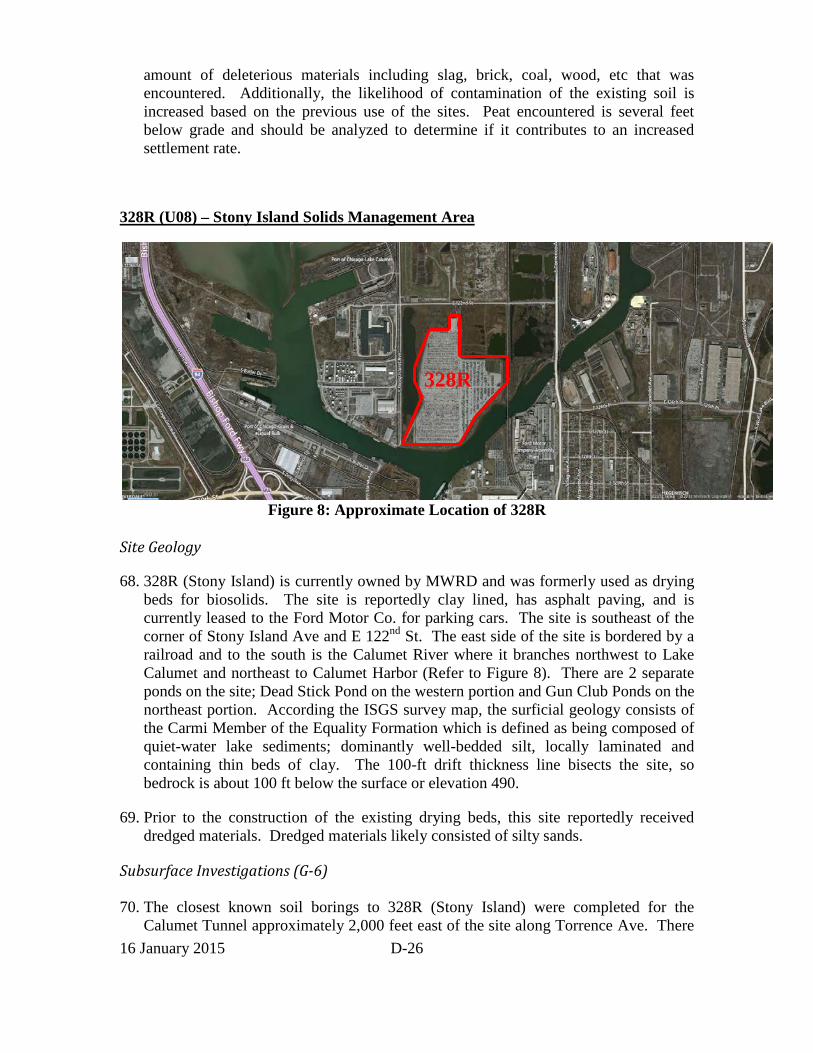
Figure 8: Approximate Location of 328R
Site Geology
68. 328R (Stony Island) is currently owned by MWRD and was formerly used as drying beds for biosolids. The site is reportedly clay lined, has asphalt paving, and is currently leased to the Ford Motor Co. for parking cars. The site is southeast of the corner of Stony Island Ave and E 122nd St. The east side of the site is bordered by a railroad and to the south is the Calumet River where it branches northwest to Lake Calumet and northeast to Calumet Harbor (Refer to Figure 8). There are 2 separate ponds on the site; Dead Stick Pond on the western portion and Gun Club Ponds on the northeast portion. According the ISGS survey map, the surficial geology consists of the Carmi Member of the Equality Formation which is defined as being composed of quiet-water lake sediments; dominantly well-bedded silt, locally laminated and containing thin beds of clay. The 100-ft drift thickness line bisects the site, so bedrock is about 100 ft below the surface or elevation 490.
69. Prior to the construction of the existing drying beds, this site reportedly received dredged materials. Dredged materials likely consisted of silty sands.
Subsurface Investigations (G-6) 70. The closest known soil borings to 328R (Stony Island) were completed for the
Calumet Tunnel approximately 2,000 feet east of the site along Torrence Ave. There
328R
16 January 2015 D-27
are three separate clusters of existing soil borings close to the site. There is a northernmost cluster of 4 borings at E 122nd St (C-41, C96-19, C96-19A, and CDS-29), middle cluster of 4 borings at E 126th St (C-39, C96-18, C96-18A, and CDS-27), and southernmost cluster of 6 borings at E 130th St (C-11, C96-16, C96-16A, C96-17, CDS-26, and CDS-26A). Each cluster had one boring completed in 1974, but these logs (C-11, C-39, and C-41) blind drilled to bedrock and just sampled the bedrock from about 80 to 480 ft below grade. These samples included various formations of dolomite, with the last 5 or so feet into the underlying shale. The remaining soil borings were completed in 1976 and 1996 and extended at least 25 feet below grade, with each cluster having at least one boring extend 90+ ft.
71. The soil borings all encountered varying amounts of fill consisting of sand, gravel, sandy slag, crushed stone, and cinders within the top 2 to 20 feet. Beneath the fill, generally coarse grained materials consisting of silty sand and sand were encountered. Clay interbedded with silt was encountered between 9 and 29 feet below grade, underneath the coarser grained layer. The clay and silt continued to the termination depths of each boring, other than the ones that extended to bedrock, about 80 to 90 ft below grade.
72. The ISGS Survey of Water and Related wells indicated that 3 wells have been drilled at the southern border of the site. The one that recorded soil types agrees with the borehole findings of miscellaneous fill underlain with sand underlain with clay and silt.
73. The historical borings and well log data gives us an idea of what may be present at the 328R (Stony Island) site, however, there currently are no known borings taken within the limits of the 328R site. It is highly recommended that a geotechnical investigation and analysis be performed at the proposed site as this area may differ from the locations previously studied.
Hydrogeology 74. A local well search in the area indicated that there are no active pumping wells,
however, according to ISGS Aquifer mapping, there is likely a shallow aquifer present in the area less than 50 ft below ground surface. There is also likely a major rock aquifer within 300 ft of ground surface.
75. The existing soil borings about 2,000 ft east of the site indicated the ground water was present around 5 to 10 feet below grade. The sandy materials encountered are described in the boring logs to be either wet or moist through to clay confining layers. It is likely that the shallow aquifer flows into the Calumet River, especially since Site 328R is adjacent to the river.
Design Considerations 76. Due to the lack of subsurface information anywhere within the proposed site location,
as well as, the fill and sandy materials encountered in the neighboring borings, local subsurface investigations are required to identify the local soil stratigraphy and

16 January 2015 D-28
material properties both along the perimeters as well as within the site. An embankment will need to be built to function as the perimeter confinement and drainage will be required.
77. Additionally, subsurface investigations would determine if the site indeed does have a clay liner underneath the asphalt pavement, as well as strength properties. If a suitable liner is not found, then additional clay or sheetpile cutoff will be required for seepage reduction. If weak or unsuitable soils are found underneath the drying bed, then additional remediation would be necessary to support the new structures required for a CDF. Data regarding the existing soils including the material strength and hydraulic conductivity will be required to perform stability, settlement, and seepage analyses.
331R-A (R01) - Lucas-Berg CDF
Figure 9: Approximate Location of Lucas-Berg (South Cell Outlined)
Site Development
78. The Lucas Berg Site is generally on a shallow hillside, which slopes south and southwest toward the Calumet-Sag. It is approximately 70 acres, and was first used as a borrow pit for sand and gravel. The pit extended up to 40 feet below grade and has since been developed as a CDF. No dredged material has been placed inside and it is now essentially a pond.
79. The site is located in Worth, Illinois about 2,000 ft north of the Calumet-Sag. It is bounded north by 111th Street, west by Southwest Highway, east by Oketo Street, and south by Norfolk & Western Railroad. It was originally constructed in the early 1980’s to provide a dumping location for dredged materials from the Calumet-Sag. The facility was designed with a five-foot thick clay liner to separate Calumet-Sag sediments from the natural earth. The project also included pumps and sand filters to filter dredge effluent and natural rainwater from the site. When the project was constructed, a 6” perforated subsurface underdrain system was installed on the railroad embankment so the clay liner could be constructed at that location. Also,
311R-A

16 January 2015 D-29
several French drains were installed and connect to the 6” underdrain system, which was then connected to the south intake structure. This connection therefore bypasses the clay liner.
80. The southern section has been constructed with a clay liner and dike, while the northern section has not yet been developed and does not have a clay liner. The southern section was designed to provide a capacity of 580,000 to 1,000,000 cubic yards of material, depending on the compaction and if the dike height is modified. The northern portion, if completed, could more than double this capacity. The southern portion also includes a dredge effluent pump, sub-drain pump, storm drainage pumps, filter cells, and associated electrical and mechanical structures.
Subsurface Investigations (G-9) 81. The original field investigation was completed in 1969-1970 which included 31 soil
borings and 10 well point borings. These soil borings were completed to depths ranging from 10 to 55 ft across the entire site. The wells vary from 20 to 80 ft in depth. The top elevations of the borings and wells varied from around 625 to 585 ft LWD, while the bottom elevations varied from 585 to 528 ft LWD. Of the 41 borings and wells, 29 were terminated in dolomite bedrock which was encountered between elevations 548 and 572 LWD.
82. The soils encountered in these borings were composed mostly of sands and silts, with some gravel. These sands and silts ranged from medium dense to very dense, with the majority being very dense. Only 16 of the 41 borings encountered clay materials which ranged from soft to very tough, with the majority of the clays being tough.
83. Of the original well point borings, most were damaged during the actual construction of the CDF. In 1982, 8 additional monitoring wells were installed, half into rock and half into the overburden. While drilling these wells, the soil was logged and encountered about 40% gravel, 26% sand, and the remaining 34% silts and clays. The clay and silts were tested for permeability, which resulted in values ranging from 2.1e-5 to 2.4e-7 cm/sec. The sands and gravels, however, were much more permeable but no values were obtained.
84. With the amount of existing soil boring data, additional deep investigations may not be required. If the proposed project requires development of other areas not investigated, however, additional borings would be needed. Regardless, additional shallow borings will be required to determine if the constructed 5-ft thick clay liner is still present throughout the site.
Hydrogeology 85. There are two ground water sources at this site; the first being a shallow aquifer
contained in the alluvial sand, silts, and Lemont gravels. The second aquifer is in the Niagaran dolomite bedrock.
86. The eight monitoring wells installed after construction in 1982 recorded groundwater
16 January 2015 D-30
readings between 577 to 582 LWD. These wells were installed two on each side of the CDF.
Design Considerations 87. Since construction in the 1980’s, the CDF has not been used to receive any dredged
material. In 2000, a site visit was completed and identified the site has been overgrown with vegetation including brush and small trees. This vegetation could compromise the integrity of the clay liner by creating a seepage path with their roots, especially since the native ground is known to be composed of mostly coarse-grained materials. The site would need to be dewatered and then investigated to ensure the clay liner still provides a suitable cutoff. Cutoff suitability will be determined by the Illinois EPA after field investigations have been completed. The gap caused by the dewatering pipe mentioned above would also require investigation and remediation. The mechanical and electrical portions would also need to be inspected to determine if they require replacement.
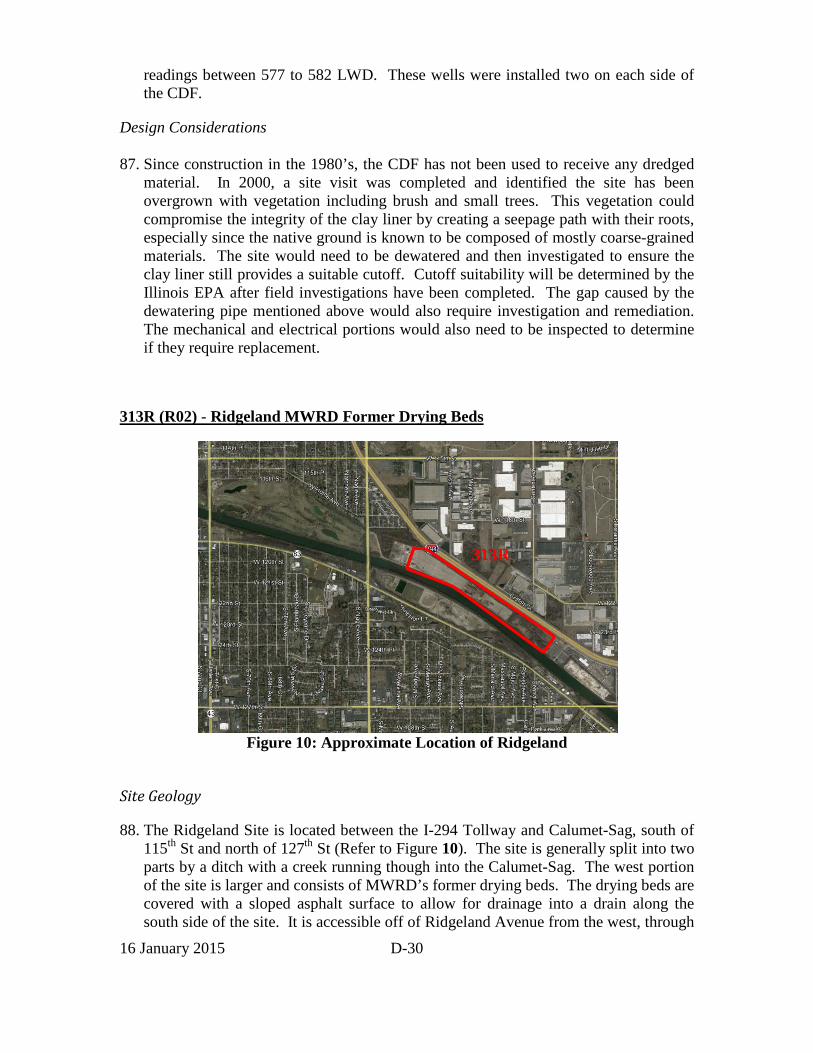
313R (R02) - Ridgeland MWRD Former Drying Beds
Figure 10: Approximate Location of Ridgeland
Site Geology
88. The Ridgeland Site is located between the I-294 Tollway and Calumet-Sag, south of 115th St and north of 127th St (Refer to Figure 10). The site is generally split into two parts by a ditch with a creek running though into the Calumet-Sag. The west portion of the site is larger and consists of MWRD’s former drying beds. The drying beds are covered with a sloped asphalt surface to allow for drainage into a drain along the south side of the site. It is accessible off of Ridgeland Avenue from the west, through
313R
16 January 2015 D-31
MWRD’s gates. The east portion of the site is covered with grass and trees, with several defunct structures from a former defense site that has since been disbanded and reportedly cleaned up. The east portion also includes few hills, presumably left from when the Calumet-Sag was originally excavated.
89. As shown on the surficial geology map in Attachment G-2, the entire site is located in Wadsworth Till which is defined as mostly gray clayey and silty clayey till; relatively low in content of pebbles, cobbles, and boulders; and contains local lenses of silt. Documents provided by MWRD indicate the site was used to dispose materials excavated from the Calumet-Sag construction. Therefore, the hills on the eastern portion of the site are likely to contain fill materials including stone as the channel construction included bedrock excavation. Other portions of the site could contain rocky materials, as well. Based on the bedrock topography, the site is in between the elevations 550 and 600 line. Interpolating linearly between the two lines, the estimated bedrock elevation is around 560 ft.
Subsurface Investigations 90. A subsurface investigation was completed at the Ridgeland site in June 2014 which
included twenty-one (21) borings to depths ranging from 21 to 79 ft below grade. The report is provided in Attachment 3. Generally, the borings encountered about ½ ft of asphalt, ½ to 2 ft of crushed stone base, and silty clay fill which constituted the constructed portion of the drying beds. Beneath the constructed layer, other fill consisting of clays, silts, gravel, sand and organics was encountered to depths of 6 to 23 ft below grade. Several soil borings encountered organic clays and silts, silty clay, silt, sand, gravel, and mixtures of those materials. Bedrock or broken bedrock consisting of limestone was encountered in 6 of the 21 borings between 40 and 55 ft below grade (elevations 558 and 542 ft NAVD88).
91. There are also several subsurface investigations that were completed near the Ridgeland site which are provided in this appendix. Since the I-294 Tollway borders the site on the northeast, they were contacted and provided soil boring logs. The closest logs were a group of 4 about 1,000 ft southeast of the site, RW-21, RW-22, RW-23, and C-3. These were completed in 2002 and 2004 by Patrick Engineering and extended between 26 and 43.5 ft below grade. Silty clay fill under asphalt pavement was encountered in RW-21 and C-3 while the other two were completed in native soils. The native soils generally consisted of mostly very stiff silty clays and silts, with some layers of sand. RW-21 and C-3 were the deepest and encountered gravel and boulders between about 28 and 37 ft below grade, while the others terminated prior to encountering this layer.
92. The Tollway also provided three other groups of boring logs. The closest was about 3,500 ft northwest of the site, centered at the W-115th Street I-294 overpass and consisting of 23 logs. Another group was about 6,500 ft northwest of the site, centered at W 111th St I-294 overpass and consisting of 26 logs. The third was about 9,000 ft southeast of the site, centered near the W 131st intersection with I-294 and consisting of 10 logs. While these logs are relatively far from the site, they provide a general idea of what could be encountered onsite. These borings encountered mostly

16 January 2015 D-32
very stiff to hard clays and silty clays and medium dense to dense sands. Fills soils generally consisting of clayey material was encountered in several borings up to 24 feet thick. This fill was encountered in the embankment to build up the I-294 embankment as it goes over various underpasses. Additional native soils encountered include a few layers of loose sands and soft organic silts. At lower elevations, dense to very dense silts, sands, and gravels were encountered. Additionally, many of the borings either encountered refusal at apparent bedrock or cored into the limestone bedrock up to 10 ft. The deepest of these borings extended 62 ft below grade.
93. MWRD provided soil borings that were completed for a north-south intercepting sewer that extends through the eastern, undeveloped portion of the site. Two of these borings (B-23 and B-24) were completed in 1962 by Illinois Drilling and Testing Co. onsite to 19 and 24 ft below grade, respectively. The soils encountered consisted of silt, sand, clay, gravel and topsoil fill underlain by medium to very dense silts. B-24 also encountered a 5-ft thick layer of loose organic silt about 10 ft below grade. Near the bottom of the borings, very dense gravel with boulders and cobbles are present.
94. MWRD also provided borings completed for another sewer, running generally east-west along the canal. Seven borings were completed in 1957 by Soil Testing Services, Inc to 19.5 to 22.5 f below grade. The soils encountered consisted of silt, clay, and sand in the top 13 to 18 feet below grade. Medium dense to dense gravel and sand were encountered below about 13-18 ft in borings generally on the east side, while borings on the west side of the site encountered some organic material below 9 to 13.5 ft, instead.
95. The ISGS Survey of Water and Related wells indicated that while no water wells were drilled onsite, 17 wells have been drilled within 300 to 3,000 feet of the Ridgeland site. These varied in depth of 16 to 1408 ft. The overburden was described as clay, gravel, and sand. Only one well did not encounter bedrock, while the 16 remaining encountered rock between 15 to 65 feet below grade.
Hydrogeology 96. The ISGS logs provide the water pumping records for the water wells completed near
the Ridgeland site. The logs that reported water elevations state that they pump water from bedrock about 40 to 90 feet below grade. This is generally equivalent to the elevation of the Calumet-Sag that runs adjacent to the site.
Design Considerations 97. The east portion of the site would require extensive regrading and hauling off soil and
debris to create a flat surface to construct the CDF floor. Therefore, the east portion was assumed to be cost prohibitive to build on and not included in the plan.
98. While an earthen berm would likely be a cheaper solution to contain the dredged material, the dimensions of a berm would not be efficient as it would have to be about 20 ft tall with 2 or 3:1 slopes. At those dimensions, the base would be around 100 ft wide, reducing the amount of storage available, especially since portions of the site
16 January 2015 D-33
are only 300 ft wide.
99. Another option considered was to use sheetpile. However, soil borings indicate that dense soils and possibly boulders and cobbles would be encountered around 570 ft NAVD88 and could be found as high as 580 ft NAVD88. The sheetpile was assumed to need to extend at a ratio of 2 ft below ground for every 1 ft above ground. At this ratio, the sheetpile would likely extend to elevation 560 ft NAVD88, which would likely encounter difficult driving conditions. Additional structural analysis should be completed to determine the actual depth required for sheetpile and if it is indeed infeasible.
100. The current assumed design for containing the dredged material is a reinforced cast-in-place concrete T-wall. It would be supported on a shallow foundation, likely in fill material as determined by the soil borings. There would be some organic soils within 5 ft of the foundation which are softer than the surrounding materials. Therefore, the footing will likely have to be wider in these areas to provide acceptable support.
101. As part of the Ridgeland site plan, there would be docks along the Calumet-Sag to unload material from barges into the CDF. It is assumed that these would be constructed by excavating into the existing side slope of the channel and installing sheetpile with a tieback system. During the excavation, boulders and cobbles are likely to be present and would be removed. It is anticipated the tieback anchors would be driven to a depth shallower than the location of the boulders and cobbles. Bedrock is expected around elevation 550 ft NAVD88. The water level of the Calumet-Sag is around 575 ft NAVD88.
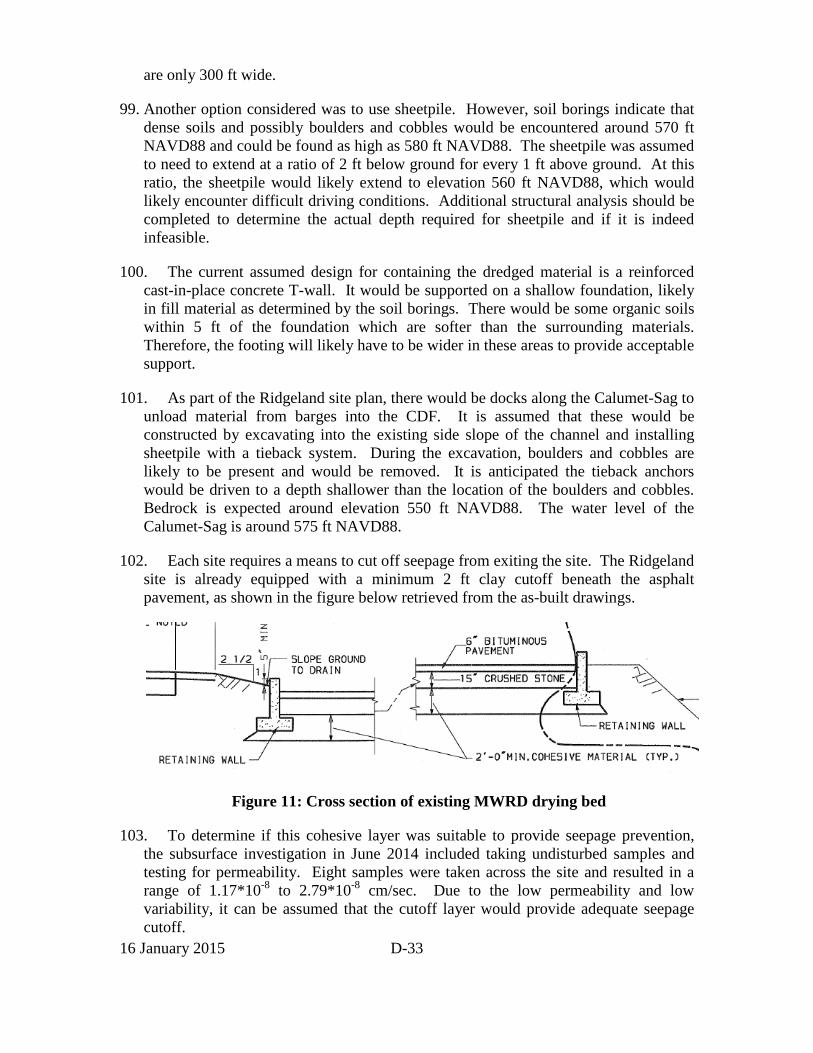
102. Each site requires a means to cut off seepage from exiting the site. The Ridgeland site is already equipped with a minimum 2 ft clay cutoff beneath the asphalt pavement, as shown in the figure below retrieved from the as-built drawings.
Figure 11: Cross section of existing MWRD drying bed
103. To determine if this cohesive layer was suitable to provide seepage prevention, the subsurface investigation in June 2014 included taking undisturbed samples and testing for permeability. Eight samples were taken across the site and resulted in a range of 1.17*10-8 to 2.79*10-8 cm/sec. Due to the low permeability and low variability, it can be assumed that the cutoff layer would provide adequate seepage cutoff.
16 January 2015 D-34
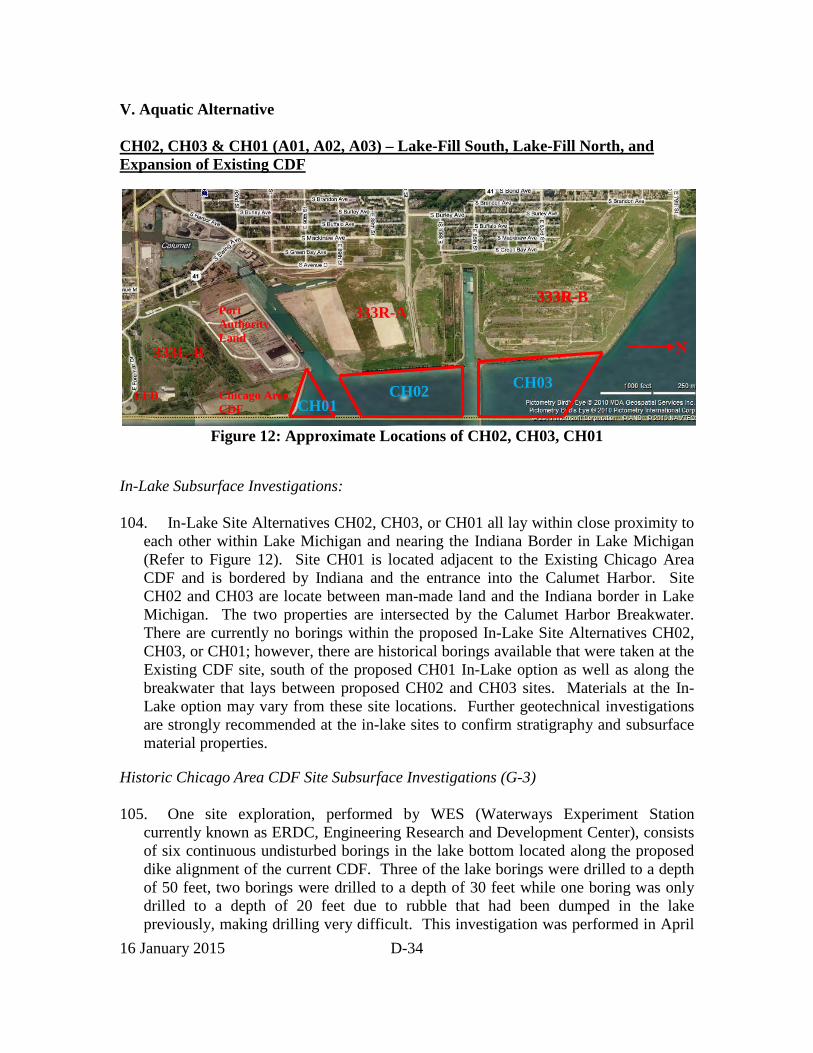
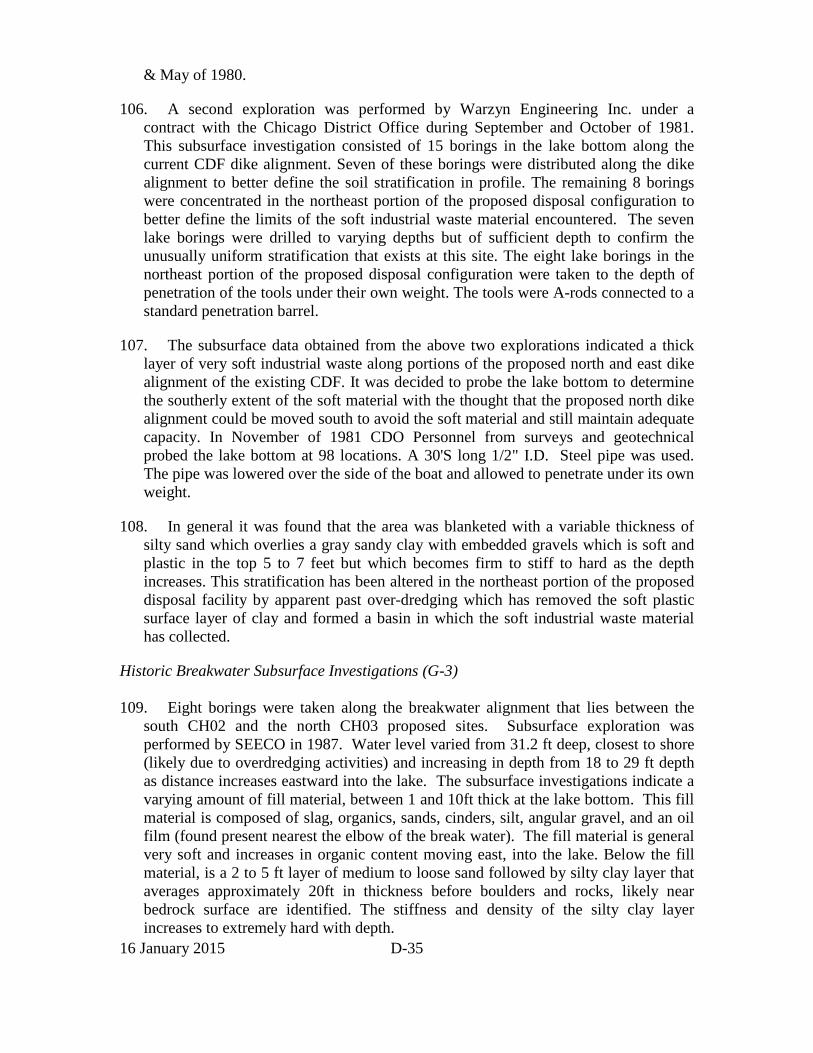
V. Aquatic Alternative CH02, CH03 & CH01 (A01, A02, A03) – Lake-Fill South, Lake-Fill North, and Expansion of Existing CDF
Figure 12: Approximate Locations of CH02, CH03, CH01
In-Lake Subsurface Investigations: 104. In-Lake Site Alternatives CH02, CH03, or CH01 all lay within close proximity to
each other within Lake Michigan and nearing the Indiana Border in Lake Michigan (Refer to Figure 12). Site CH01 is located adjacent to the Existing Chicago Area CDF and is bordered by Indiana and the entrance into the Calumet Harbor. Site CH02 and CH03 are locate between man-made land and the Indiana border in Lake Michigan. The two properties are intersected by the Calumet Harbor Breakwater. There are currently no borings within the proposed In-Lake Site Alternatives CH02, CH03, or CH01; however, there are historical borings available that were taken at the Existing CDF site, south of the proposed CH01 In-Lake option as well as along the breakwater that lays between proposed CH02 and CH03 sites. Materials at the In-Lake option may vary from these site locations. Further geotechnical investigations are strongly recommended at the in-lake sites to confirm stratigraphy and subsurface material properties.
Historic Chicago Area CDF Site Subsurface Investigations (G-3) 105. One site exploration, performed by WES (Waterways Experiment Station
currently known as ERDC, Engineering Research and Development Center), consists of six continuous undisturbed borings in the lake bottom located along the proposed dike alignment of the current CDF. Three of the lake borings were drilled to a depth of 50 feet, two borings were drilled to a depth of 30 feet while one boring was only drilled to a depth of 20 feet due to rubble that had been dumped in the lake previously, making drilling very difficult. This investigation was performed in April
333R- 333R-A
333L-B
Chicago Area CDF
Port Authority Land
CFD CH02 CH03
CH01
333R-B
N
16 January 2015 D-35
& May of 1980.
106. A second exploration was performed by Warzyn Engineering Inc. under a contract with the Chicago District Office during September and October of 1981. This subsurface investigation consisted of 15 borings in the lake bottom along the current CDF dike alignment. Seven of these borings were distributed along the dike alignment to better define the soil stratification in profile. The remaining 8 borings were concentrated in the northeast portion of the proposed disposal configuration to better define the limits of the soft industrial waste material encountered. The seven lake borings were drilled to varying depths but of sufficient depth to confirm the unusually uniform stratification that exists at this site. The eight lake borings in the northeast portion of the proposed disposal configuration were taken to the depth of penetration of the tools under their own weight. The tools were A-rods connected to a standard penetration barrel.
107. The subsurface data obtained from the above two explorations indicated a thick layer of very soft industrial waste along portions of the proposed north and east dike alignment of the existing CDF. It was decided to probe the lake bottom to determine the southerly extent of the soft material with the thought that the proposed north dike alignment could be moved south to avoid the soft material and still maintain adequate capacity. In November of 1981 CDO Personnel from surveys and geotechnical probed the lake bottom at 98 locations. A 30'S long 1/2" I.D. Steel pipe was used. The pipe was lowered over the side of the boat and allowed to penetrate under its own weight.
108. In general it was found that the area was blanketed with a variable thickness of silty sand which overlies a gray sandy clay with embedded gravels which is soft and plastic in the top 5 to 7 feet but which becomes firm to stiff to hard as the depth increases. This stratification has been altered in the northeast portion of the proposed disposal facility by apparent past over-dredging which has removed the soft plastic surface layer of clay and formed a basin in which the soft industrial waste material has collected.
Historic Breakwater Subsurface Investigations (G-3) 109. Eight borings were taken along the breakwater alignment that lies between the
south CH02 and the north CH03 proposed sites. Subsurface exploration was performed by SEECO in 1987. Water level varied from 31.2 ft deep, closest to shore (likely due to overdredging activities) and increasing in depth from 18 to 29 ft depth as distance increases eastward into the lake. The subsurface investigations indicate a varying amount of fill material, between 1 and 10ft thick at the lake bottom. This fill material is composed of slag, organics, sands, cinders, silt, angular gravel, and an oil film (found present nearest the elbow of the break water). The fill material is general very soft and increases in organic content moving east, into the lake. Below the fill material, is a 2 to 5 ft layer of medium to loose sand followed by silty clay layer that averages approximately 20ft in thickness before boulders and rocks, likely near bedrock surface are identified. The stiffness and density of the silty clay layer increases to extremely hard with depth.
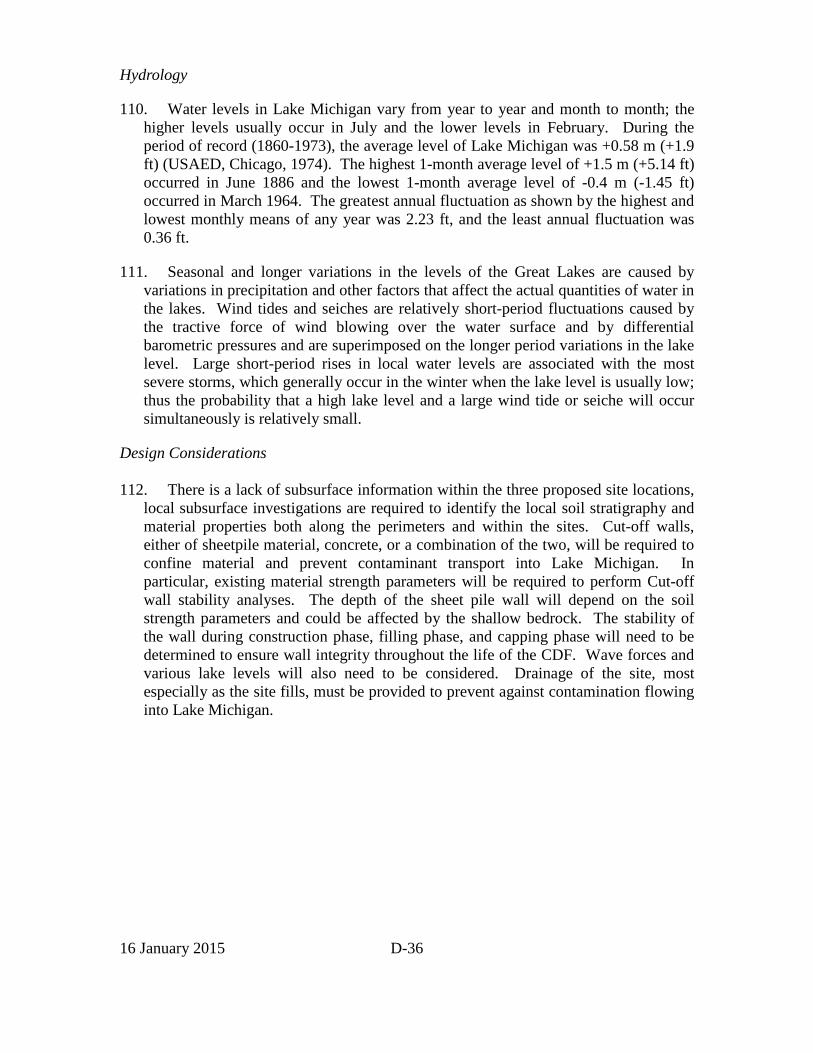
16 January 2015 D-36
Hydrology
110. Water levels in Lake Michigan vary from year to year and month to month; the higher levels usually occur in July and the lower levels in February. During the period of record (1860-1973), the average level of Lake Michigan was +0.58 m (+1.9 ft) (USAED, Chicago, 1974). The highest 1-month average level of +1.5 m (+5.14 ft) occurred in June 1886 and the lowest 1-month average level of -0.4 m (-1.45 ft) occurred in March 1964. The greatest annual fluctuation as shown by the highest and lowest monthly means of any year was 2.23 ft, and the least annual fluctuation was 0.36 ft.
111. Seasonal and longer variations in the levels of the Great Lakes are caused by variations in precipitation and other factors that affect the actual quantities of water in the lakes. Wind tides and seiches are relatively short-period fluctuations caused by the tractive force of wind blowing over the water surface and by differential barometric pressures and are superimposed on the longer period variations in the lake level. Large short-period rises in local water levels are associated with the most severe storms, which generally occur in the winter when the lake level is usually low; thus the probability that a high lake level and a large wind tide or seiche will occur simultaneously is relatively small.
Design Considerations 112. There is a lack of subsurface information within the three proposed site locations,
local subsurface investigations are required to identify the local soil stratigraphy and material properties both along the perimeters and within the sites. Cut-off walls, either of sheetpile material, concrete, or a combination of the two, will be required to confine material and prevent contaminant transport into Lake Michigan. In particular, existing material strength parameters will be required to perform Cut-off wall stability analyses. The depth of the sheet pile wall will depend on the soil strength parameters and could be affected by the shallow bedrock. The stability of the wall during construction phase, filling phase, and capping phase will need to be determined to ensure wall integrity throughout the life of the CDF. Wave forces and various lake levels will also need to be considered. Drainage of the site, most especially as the site fills, must be provided to prevent against contamination flowing into Lake Michigan.

16 January 2015 D-37
329L-A (A08) – Turning Basin 3
Figure 13: Approximate Locations of 329L-A
Site Geology 113. 329L-A, Turning Basin 3, is located on the Calumet River, between 114th street
and 122nd street (Refer to Figure 13). According to ISGS surficial geology mapping, site 329L-A lays within the Dolton Member, which is primarily shallow-water, near-shore lake sediments dominantly medium-grained sand containing beds of silt where gradational to Carmi Member materials.
Subsurface Investigations (G-5) 114. Local borings were taken at the adjacent land indicating that beneath a thin layer
of sediment (regularly dredged) lays a 30 to 70 ft thick layer of silty clay with sand lenses to the depth of bedrock (Refer to 329L-B and 329L-C Subsurface Investigation Studies discussion).
Hydrology 115. Water levels at the 329L-A site are controlled and are approximately at 0 LWD,
but fluctuate depending on precipitation events. The depth of the water at the center of the basin was surveyed to be 27 ft. Nearing the embankment, the depth is approximately 14ft to 18ft deep. The Turning basin is regularly dredged and the water depth generally maintained. A deeper rock aquifer is likely found above 300ft bgs.
Design Considerations 116. There is a lack of subsurface information within the basin, and subsurface
materials are estimated based on adjacent investigation studies. Local subsurface investigations are required to identify the local soil stratigraphy and material
330L
329L-C
329L-B
329L-A
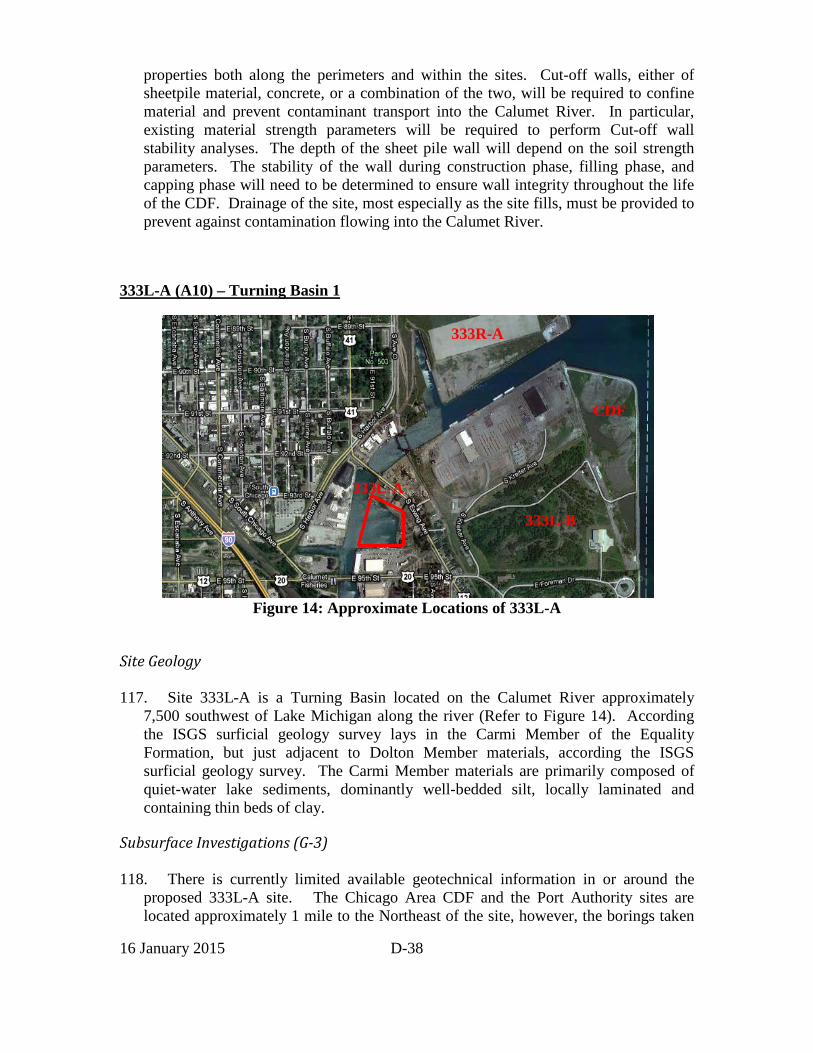
16 January 2015 D-38
properties both along the perimeters and within the sites. Cut-off walls, either of sheetpile material, concrete, or a combination of the two, will be required to confine material and prevent contaminant transport into the Calumet River. In particular, existing material strength parameters will be required to perform Cut-off wall stability analyses. The depth of the sheet pile wall will depend on the soil strength parameters. The stability of the wall during construction phase, filling phase, and capping phase will need to be determined to ensure wall integrity throughout the life of the CDF. Drainage of the site, most especially as the site fills, must be provided to prevent against contamination flowing into the Calumet River.
333L-A (A10) – Turning Basin 1
Figure 14: Approximate Locations of 333L-A
Site Geology 117. Site 333L-A is a Turning Basin located on the Calumet River approximately
7,500 southwest of Lake Michigan along the river (Refer to Figure 14). According the ISGS surficial geology survey lays in the Carmi Member of the Equality Formation, but just adjacent to Dolton Member materials, according the ISGS surficial geology survey. The Carmi Member materials are primarily composed of quiet-water lake sediments, dominantly well-bedded silt, locally laminated and containing thin beds of clay.
Subsurface Investigations (G-3) 118. There is currently limited available geotechnical information in or around the
proposed 333L-A site. The Chicago Area CDF and the Port Authority sites are located approximately 1 mile to the Northeast of the site, however, the borings taken
333L-A
CDF
333L-B
333R-A
16 January 2015 D-39
at those sites are likely not representative as they were taken on man-made land formations. There was one observation well located 1,000 ft south of the basin that was logged and posted in the ISGS Water and Related Wells Survey that indicated the overburden thickness was determined to be drift/fill material to a depth of 10ft, followed by a 28 ft layer of sand and a 35ft layer of bluish grey clay before encountering bedrock at 73 ft below ground surface. The turning basin is dredge to approximately 27 ft below LWD, thus it is likely that there is a shallow layer of sediments before encountering clay at the proposed site.
Hydrology 119. Water levels at the 333L-A site are controlled and are approximately at 0 LWD,
but fluctuate depending on precipitation events. The depth of the water at the center of the basin is regularly dredged to maintain a depth of 27 ft and the water depth generally maintained. The local shallow aquifer and runoff in the area likely outlets into the river. A deeper rock aquifer is likely found above 300 ft bgs. A local well drilled reports water to be present from 0 to 210 ft bgs with available capacity of 70 gpm.
Design Considerations 120. There is a lack of subsurface information within the Turning Basin 1 location.
Local subsurface investigations are required to identify the local soil stratigraphy and material properties both along the perimeters and within the sites. Cut-off walls, either of sheetpile material, concrete, or a combination of the two, will be required to confine material and prevent contaminant transport into the Calumet River. In particular, existing material strength parameters will be required to perform Cut-off wall stability analyses. The depth of the sheet pile wall will depend on the soil strength parameters. The stability of the wall during construction phase, filling phase, and capping phase will need to be determined to ensure wall integrity throughout the life of the CDF. Drainage of the site, most especially as the site fills, must be provided to prevent against contamination flowing into the River.

16 January 2015 D-40
324L (A11) – Marina
Figure 15: Approximate Locations of 324L
Site Geology 121. Site 324L is a Marina located north of east 138th street between the Bishop Ford
Hwy and South Indiana Ave, within the south bank of the Calumet River (Refer to Figure 15). According the ISGS surficial geology survey lays in the Carmi Member of the Equality Formation, according the ISGS surficial geology survey. The Carmi Member materials are primarily composed of quiet-water lake sediments, dominantly well-bedded silt, locally laminated and containing thin beds of clay.
Subsurface Investigations (G-7) 122. There is currently limited available geotechnical information in or around the
proposed 324L site. There was one observation well in the vicinity that was logged in the ISGS Water and Related Wells Survey that indicated the overburden thickness was determined to be 67 ft before encountering Bedrock. Two borings are located 2,000 ft southeast and 3,500 ft southwest of the site, respectively (AS-10 and AS-11) from the Calumet Tunnel System Investigation by Keifer and Associates. Both borings indicate that there is brown sand and gravel followed by firm brown fine to medium sand and firm gray fine sand in the first 18 ft below ground surface before tough grey clay is encountered to a depth of 76 ft below ground surface with a 3ft layer of sand found at 63 to 70 ft below ground surface. Stiffness and density of clay increases with depth and sand pockets are noted. Bedrock was encountered at approximately 66 ft to 76 ft below ground surface.
Hydrology 123. According to the ISGS Water and Related Wells in Illinois Survey, there is likely
a bedrock aquifer around 200 ft below grade. There is no other available information at this time.
324L
16 January 2015 D-41
Design Considerations 124. There is a lack of subsurface information within the Marina. Local subsurface
investigations are required to identify the local soil stratigraphy and material properties both along the perimeters and within the sites. Cut-off walls, either of sheetpile material, concrete, or a combination of the two, will be required to confine material and prevent contaminant transport into the River. In particular, existing material strength parameters will be required to perform Cut-off wall stability analyses. The depth of the sheet pile wall will depend on the soil strength parameters. The stability of the wall during construction phase, filling phase, and capping phase will need to be determined to ensure wall integrity throughout the life of the CDF. Drainage of the site, most especially as the site fills, must be provided to prevent against contamination flowing into the River.
VI. Summary 125. In general, all the proposed sites excluding Ridgeland lack sufficient geotechnical
information to perform detailed design plans and specs. However, there is sufficient information at this stage of the planning process so no additional investigation is anticipated at this time.
126. The aquatic alternatives pose the cost of providing a containment wall such as a sheet pile or a cutoff wall to prevent river and/or lake contamination which may increase the cost of construction.
Existing Ground Considerations 127. Undeveloped upland site alternatives are likely to have permeable sand layers
either at the surface or near the surface. Storage of dredged materials on these undeveloped sites will require either a containment perimeter or clay blanket to prevent migration of contaminants. The only sites identified that would likely not require an engineered cutoff is where an existing structure is already in place. This includes Ridgeland (313R), Stony Island (328R), and Lucas-Berg (311R-A). The clay blanket is shown on the Ridgeland as-built drawings with a minimum thickness of 2 feet. Considering that this thickness is appropriate for the Ridgeland site, it is assumed that it would also be appropriate for sites that require a new clay liner. Additionally, this thickness is required in Title 35, Illinois Administrative Code Part 370 (IL Recommended Standards for Sewage Works), Section 370.930, along with a permeability less than 1E-7 cm/sec.
128. Some of the sites that are currently undeveloped were previously used as industrial sites and were either found to or are likely to have undocumented fill onsite. This fill likely consists of previous construction waste such as bricks, slag, wood, and other debris that would not be suitable for engineered fill soils. Additionally, the soils could consist of contaminated materials which should not be disturbed. Therefore, site plans should build up from the existing ground, rather than

16 January 2015 D-42
trying to regrade. A layer of crushed stone, asphalt millings, etc could be placed on the existing ground to create a visual barrier to prevent excavation into the existing soils.
129. A further consideration for the upland sites is that all, with the exception of 333L-B and Lucas-Berg, are directly adjacent to waterways. Since flow is generally towards the river (331R, 328R, 330L, 329L-C, 329L-B, and 311R-A) or towards the lake (333R-A and 333R-B), there may need to be an additional cutoff wall system to prevent subsurface contaminant transport into adjacent waterways. The Ridgeland (313R) site has existing drainage and seepage protection in place from the MWRD drying beds. If further analysis determines that these are acceptable for reuse, the cost would be substantially reduced.
Two-Stage Berm 130. As opposed to a single stage berm or wall, another option for containment at the
sites is to construct a berm in stages, as shown in the figure below.
Figure 16: Two-stage berm conceptual cross section
131. This configuration would allow for greater storage capacity, smaller berm footprint, and less berm material required. However, the two-stage concept will require additional effort during placement of dredged fill and prior to construction of the second berm, as it is unlikely the second berm can be founded on dredged material without any ground improvements. At this time, it cannot be determined what methods would be most appropriate as it is unknown how quickly and thoroughly the dredged material will dry, the compressive strength the material can achieve, and how much settlement that can be expected.
132. The dredged material will be placed in stage 1 every other year for 8 years. Hopefully, this gradual time period with aggressive sediment management during off years will assist in drying the material as it is placed within the berm. Additional effort to dry the material will be required during each off year, using trenching methods described in Section 5-3 of EM 1110-2-5027. Also, wick drains and a sand blanket may be used to promote drainage and increase the strength of the material. Slow loading can also be implemented to combat settlement. At a similar dredging disposal facility in Cleveland, Ohio, USACE implemented high strength geotextile reinforcement and stability berms.

16 January 2015 D-43
133. The current schedule indicates a dredging event of harbor material in 2035, then construction of the Stage 2 berms in 2036. While these are consecutive years, the proposed schedule will allow for at least a 12 month gap between the dredging and Stage 2 berm construction by completing dredging early in 2035, and starting berm construction late 2036. Additionally, the material to be dredged at this time is harbor material, which could be used beneficially elsewhere so the full amount may not be placed in the DMDF. Once dredging is completed in 2035, samples will be taken from the dredged materials to determine the most effective method to allow the Stage 2 berm to be constructed in late 2036. The berms would be constructed in time to facilitate material acceptance in late 2037.
Construction Material 134. Geotechnical and environmental testing of material present in the Calumet Harbor
indicate that it could be used beneficially in construction without remediation. Whichever site is chosen as the CDF, an area should be set aside to receive harbor materials separate from the rest of the site. These materials could then be dried and then offloaded for beneficial use. This material could also be stockpiled onsite and potentially used as cap material whenever the new CDF is filled.
135. To use this material, a combination of time and effort will be required so that it dries into a workable state. The longer the material has to dry, the less effort needs to be put in. If the material is expected to be used within 1 or 2 months, active disking and lime application would be necessary. If the material will sit for over 6 months, less activity will be required and may only require disking once or twice. Additionally, if the material is spread thin enough, disking may not be needed at all. This can be determined by visiting the site after dredge placement and sampling with a hand auger, shovel, etc.
136. Once dried, the harbor material could also be used to construct berms that would contain the dredged material. At this time, it is assumed that the berm would need a 2-ft thick clay liner on the interior slopes to reduce the chance of seepage. There have not been any permeability tests on the dredged material. However, the material will be tested after the first dredging cycle to determine the permeability. At that time, it could be determined that the 2-ft clay liner would not be required. For now, the estimates should include the liner.
References “Collection and Analysis of Environmental Samples for Calumet Harbor and River Dredged Material Management Plan,” CDM Federal Programs Corporation, July 26, 2006 “Geotechnical Engineering Services for the Indiana Harbor Confined Disposal Facility CDF Borrow Source Material Testing Project”, AECOM, September 30, 2009
16 January 2015 D-44
“Calumet Harbor Illinois, Chicago Area Confined Disposal Facility, Design Analysis, Volume II”, USACE, Chicago District, January, 1982. Bauer, R.A., et. al “Geotechnical Properties of Selected Pleistocene, Silurian, and Ordovician Deposits of Northeastern Illinois” ISGS Environmental Geology Notes 139, 1991 Bretz, J. H., “Geology of the Chicago Region” Part I – General, ISGS Bulletin No. 65, Part II, 1939 Bretz, J. H., “Geology of the Chicago Region” Part II – The Pleistocene, ISGS Bulletin No. 65, Part II, 1955 Hughes, G.M., P. Kraatz, and R.A. Landon. “Bedrock Aquifers of Northeastern Illinois”. ISGS Circular 406, 1996 Willman, H.B. “Summary of the Geology of the Chicago Area”, ISGS Circular 460, 1971. “Sediment Sampling Analysis Report, Calumet Harbor, Chicago, Illinois”, Future Net Group Inc, December 2011. “Water and Related Wells in Illinois” ISGS IL Well Interactive Map viewer, 12/15/2008, http://runoff.isgs.uiuc.edu/website/ilwater/viewer.htm
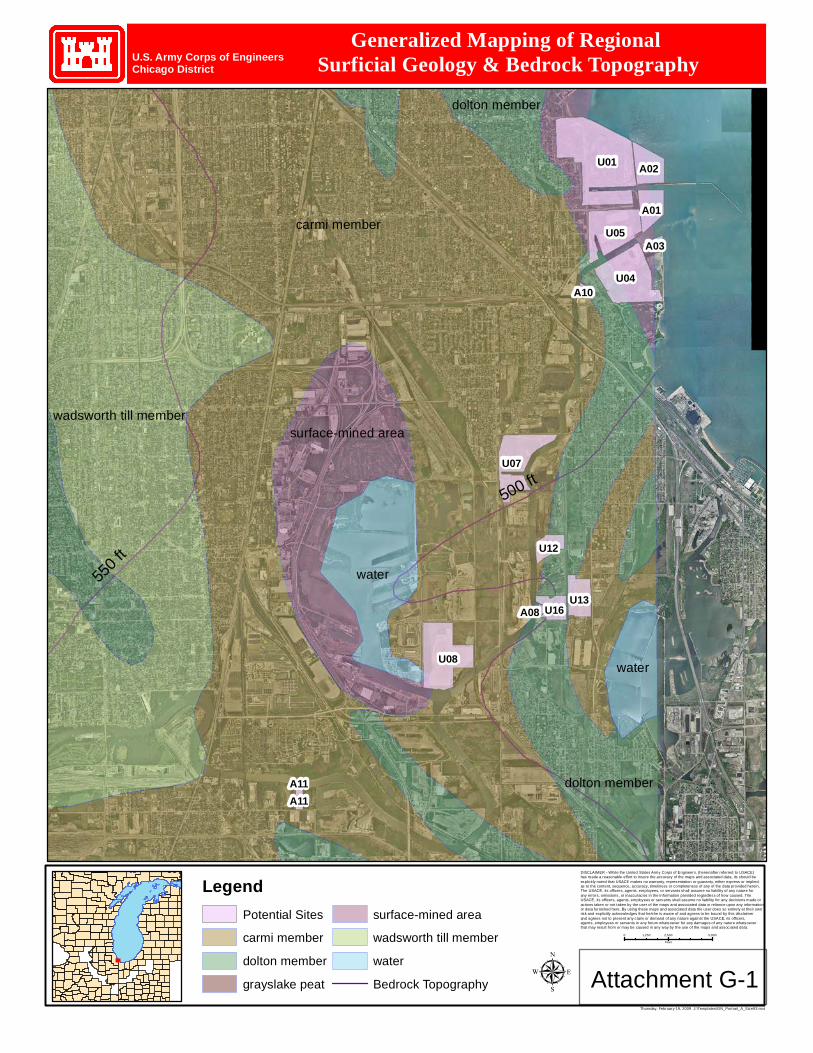
550
ft
500 ft
carmi member
wadsworth till member
dolton member
water
surface-mined area
water
dolton member
U01
U04
U08
U05
U07
A02
U13
A01
U16
U12
A11A11
A03
A10
A08
Generalized Mapping of Regional Surficial Geology & Bedrock Topography
DISCLAIMER - While the United States Army Corps of Engineers, (hereinafter referred to USACE)has made a reasonable effort to insure the accuracy of the maps and associated data, its should beexplicitly noted that USACE makes no warranty, representation or guaranty, either express or implied,as to the content, sequence, accuracy, timeliness or completeness of any of the data provided herein.The USACE, its officers, agents, employees, or servants shall assume no liability of any nature forany errors, omissions, or inaccuracies in the information provided regardless of how caused. The USACE, its officers, agents, employees or servants shall assume no liability for any decisions made or actions taken or not taken by the user of the maps and associated data in reliance upon any informationor data furnished here. By using these maps and associated data the user does so entirely at their ownrisk and explicitly acknowledges that he/she is aware of and agrees to be bound by this disclaimer and agrees not to present any claim or demand of any nature against the USACE, its officers, agents, employees or servants in any forum whatsoever for any damages of any nature whatsoever that may result from or may be caused in any way by the use of the maps and associated data.
0 2,500 5,0001,250
Feet
µ
U.S. Army Corps of EngineersChicago District
Thursday, February 19, 2009 J:\Templates\GN_Portrait_A_Size93.mxt
LegendPotential Sites
carmi member
dolton member
grayslake peat
surface-mined area
wadsworth till member
water
Bedrock Topography Attachment G-1
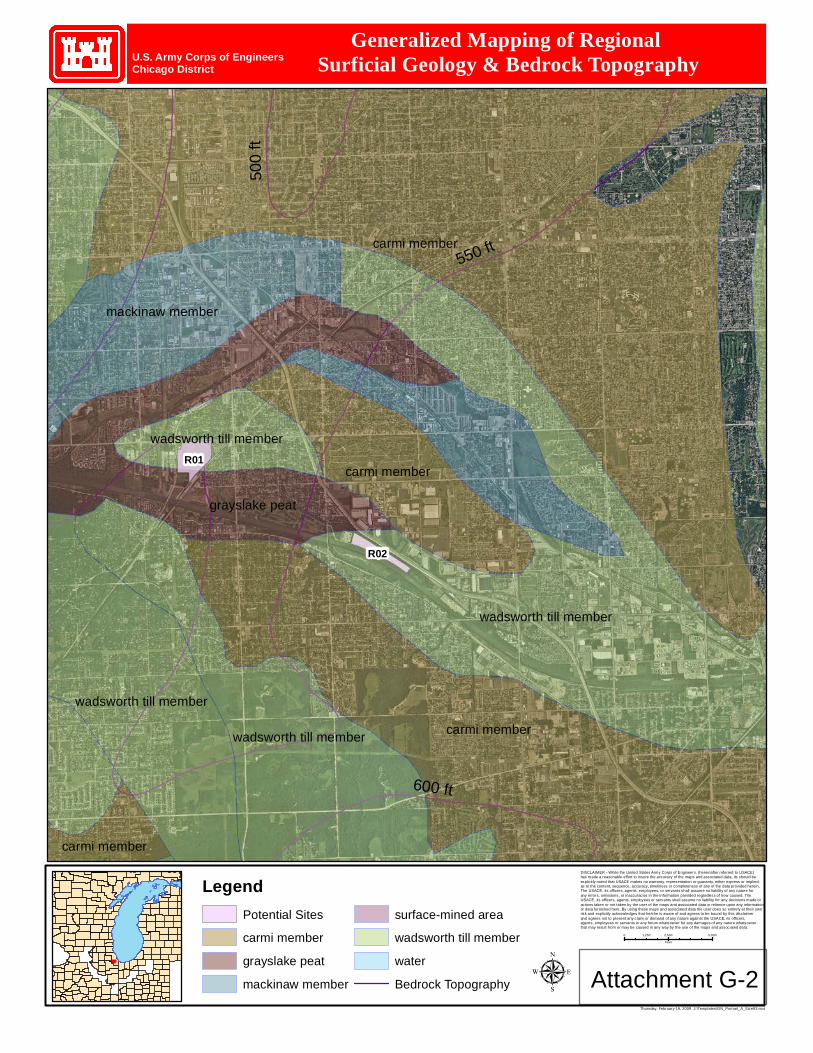
550 ft
600 ft
500
ft
carmi member
carmi member
wadsworth till member
grayslake peat
wadsworth till member
wadsworth till member
carmi member
mackinaw member
wadsworth till member
carmi member
R01
R02
Generalized Mapping of Regional Surficial Geology & Bedrock Topography
DISCLAIMER - While the United States Army Corps of Engineers, (hereinafter referred to USACE)has made a reasonable effort to insure the accuracy of the maps and associated data, its should beexplicitly noted that USACE makes no warranty, representation or guaranty, either express or implied,as to the content, sequence, accuracy, timeliness or completeness of any of the data provided herein.The USACE, its officers, agents, employees, or servants shall assume no liability of any nature forany errors, omissions, or inaccuracies in the information provided regardless of how caused. The USACE, its officers, agents, employees or servants shall assume no liability for any decisions made or actions taken or not taken by the user of the maps and associated data in reliance upon any informationor data furnished here. By using these maps and associated data the user does so entirely at their ownrisk and explicitly acknowledges that he/she is aware of and agrees to be bound by this disclaimer and agrees not to present any claim or demand of any nature against the USACE, its officers, agents, employees or servants in any forum whatsoever for any damages of any nature whatsoever that may result from or may be caused in any way by the use of the maps and associated data.
0 2,500 5,0001,250
Feet
µ
U.S. Army Corps of EngineersChicago District
Thursday, February 19, 2009 J:\Templates\GN_Portrait_A_Size93.mxt
LegendPotential Sites
carmi member
grayslake peat
mackinaw member
surface-mined area
wadsworth till member
water
Bedrock Topography Attachment G-2

Proposed Sites U01, U04, U05, A01, A02, A03, A10Existing Boring Locations
DISCLAIMER - While the United States Army Corps of Engineers, (hereinafter referred to USACE)has made a reasonable effort to insure the accuracy of the maps and associated data, its should beexplicitly noted that USACE makes no warranty, representation or guaranty, either express or implied,as to the content, sequence, accuracy, timeliness or completeness of any of the data provided herein.The USACE, its officers, agents, employees, or servants shall assume no liability of any nature forany errors, omissions, or inaccuracies in the information provided regardless of how caused. The USACE, its officers, agents, employees or servants shall assume no liability for any decisions made or actions taken or not taken by the user of the maps and associated data in reliance upon any informationor data furnished here. By using these maps and associated data the user does so entirely at their ownrisk and explicitly acknowledges that he/she is aware of and agrees to be bound by this disclaimer and agrees not to present any claim or demand of any nature against the USACE, its officers, agents, employees or servants in any forum whatsoever for any damages of any nature whatsoever that may result from or may be caused in any way by the use of the maps and associated data.
0 1,000 2,000500
Feet
µ
U.S. Army Corps of EngineersChicago District
Thursday, February 19, 2009 J:\Templates\GN_Portrait_A_Size93.mxt
LegendPotential Upland Site
Potential Aquatic Site
A Thornton Reservoir Boreholes
A Calumet Tunnel Boreholes
A Calumet Harbor Boreholes Attachment G-3

Proposed Site U04 close-upExisting Boring Locations
DISCLAIMER - While the United States Army Corps of Engineers, (hereinafter referred to USACE)has made a reasonable effort to insure the accuracy of the maps and associated data, its should beexplicitly noted that USACE makes no warranty, representation or guaranty, either express or implied,as to the content, sequence, accuracy, timeliness or completeness of any of the data provided herein.The USACE, its officers, agents, employees, or servants shall assume no liability of any nature forany errors, omissions, or inaccuracies in the information provided regardless of how caused. The USACE, its officers, agents, employees or servants shall assume no liability for any decisions made or actions taken or not taken by the user of the maps and associated data in reliance upon any informationor data furnished here. By using these maps and associated data the user does so entirely at their ownrisk and explicitly acknowledges that he/she is aware of and agrees to be bound by this disclaimer and agrees not to present any claim or demand of any nature against the USACE, its officers, agents, employees or servants in any forum whatsoever for any damages of any nature whatsoever that may result from or may be caused in any way by the use of the maps and associated data.
0 500 1,000250
Feet
µ
U.S. Army Corps of EngineersChicago District
Thursday, February 19, 2009 J:\Templates\GN_Portrait_A_Size93.mxt
LegendPotential Upland Site
Potential Aquatic Site
A Calumet Harbor Boreholes Attachment G-3a

Soil Boring Logs available upon request for U04 and surrounding area

Proposed Site U07Existing Boring Locations
DISCLAIMER - While the United States Army Corps of Engineers, (hereinafter referred to USACE)has made a reasonable effort to insure the accuracy of the maps and associated data, its should beexplicitly noted that USACE makes no warranty, representation or guaranty, either express or implied,as to the content, sequence, accuracy, timeliness or completeness of any of the data provided herein.The USACE, its officers, agents, employees, or servants shall assume no liability of any nature forany errors, omissions, or inaccuracies in the information provided regardless of how caused. The USACE, its officers, agents, employees or servants shall assume no liability for any decisions made or actions taken or not taken by the user of the maps and associated data in reliance upon any informationor data furnished here. By using these maps and associated data the user does so entirely at their ownrisk and explicitly acknowledges that he/she is aware of and agrees to be bound by this disclaimer and agrees not to present any claim or demand of any nature against the USACE, its officers, agents, employees or servants in any forum whatsoever for any damages of any nature whatsoever that may result from or may be caused in any way by the use of the maps and associated data.
0 500 1,000250
Feet
µ
U.S. Army Corps of EngineersChicago District
Thursday, February 19, 2009 J:\Templates\GN_Portrait_A_Size93.mxt
LegendPotential Upland Site
Potential Aquatic Site
A Thornton Reservoir Boreholes
A Calumet Tunnel Boreholes Attachment G-4

Soil Boring Logs available upon request for U07 and surrounding area

AA
A
A
AAA
A
AA
A
AAAA
A AA
AA
AA
AA
AA
A AA
A
A
A
AA
A
A
AA
A A
A
AAA
GP-808GP-804GP-228
GP-904
GP-808GP-227
GP-803GP-222
GP-229
GP-208GP-802 GP-207
GP-208
GP-915
GP-914
GP-913GP-916GP-800
GP-902GP-802
GP-906GP-901
GP-219 GP-221
GP-240 GP-900GP-213
GP-214GP-210
GP-211
GP-212GP-238
GP-236GP-218GP-217 GP-510
GP-1007
GP-1006GP-1005
GP-1004GP-1003
GP-1002
C-63C-62
AS-9
CDS-8A
CDS-36
C96-27
C96-26
C96-27A
Source: Esri, DigitalGlobe, GeoEye, i-cubed, USDA, USGS, AEX,Getmapping, Aerogrid, IGN, IGP, and the GIS User Community
Proposed Sites 330L, 329L-A, 329L-B, 329L-CExisting Boring Locations
DISCLAIMER - While the United States Army Corps of Engineers, (hereinafter referred to USACE)has made a reasonable effort to insure the accuracy of the maps and associated data, its should beexplicitly noted that USACE makes no warranty, representation or guaranty, either express or implied,as to the content, sequence, accuracy, timeliness or completeness of any of the data provided herein.The USACE, its officers, agents, employees, or servants shall assume no liability of any nature forany errors, omissions, or inaccuracies in the information provided regardless of how caused. The USACE, its officers, agents, employees or servants shall assume no liability for any decisions made or actions taken or not taken by the user of the maps and associated data in reliance upon any informationor data furnished here. By using these maps and associated data the user does so entirely at their ownrisk and explicitly acknowledges that he/she is aware of and agrees to be bound by this disclaimer and agrees not to present any claim or demand of any nature against the USACE, its officers, agents, employees or servants in any forum whatsoever for any damages of any nature whatsoever that may result from or may be caused in any way by the use of the maps and associated data.
0 1,000 2,000500Feet
µ
U.S. Army Corps of EngineersChicago District
LegendA Rebublic Steel Boreholes
Potential SiteA Thornton Reservoir Boreholes Attachment G-5
Document Path: G:\Projects_LRC\Calumet Harbor DMMP\MXD\Geotech Attachments\G-5 south river.mxd
330L
329L-A
329L-B
329L-C

Soil Boring Logs available upon request for 330L, 329L‐A, 329L‐B, 329L‐C and surrounding area

Proposed Site U08Existing Boring Locations
DISCLAIMER - While the United States Army Corps of Engineers, (hereinafter referred to USACE)has made a reasonable effort to insure the accuracy of the maps and associated data, its should beexplicitly noted that USACE makes no warranty, representation or guaranty, either express or implied,as to the content, sequence, accuracy, timeliness or completeness of any of the data provided herein.The USACE, its officers, agents, employees, or servants shall assume no liability of any nature forany errors, omissions, or inaccuracies in the information provided regardless of how caused. The USACE, its officers, agents, employees or servants shall assume no liability for any decisions made or actions taken or not taken by the user of the maps and associated data in reliance upon any informationor data furnished here. By using these maps and associated data the user does so entirely at their ownrisk and explicitly acknowledges that he/she is aware of and agrees to be bound by this disclaimer and agrees not to present any claim or demand of any nature against the USACE, its officers, agents, employees or servants in any forum whatsoever for any damages of any nature whatsoever that may result from or may be caused in any way by the use of the maps and associated data.
0 500 1,000250
Feet
µ
U.S. Army Corps of EngineersChicago District
Thursday, February 19, 2009 J:\Templates\GN_Portrait_A_Size93.mxt
LegendPotential Upland Site
Potential Aquatic Site
A Thornton Reservoir Boreholes
A Calumet Tunnel Boreholes Attachment G-6

Soil Boring Logs available upon request for U08 and surrounding area
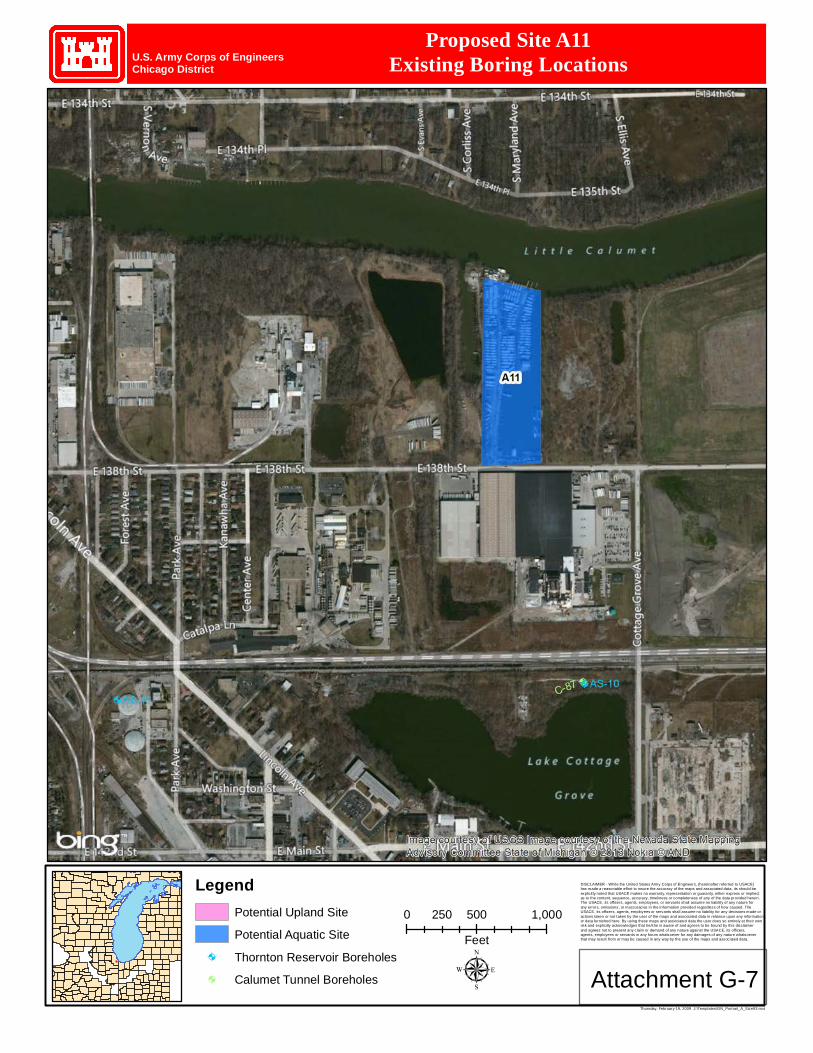
Proposed Site A11Existing Boring Locations
DISCLAIMER - While the United States Army Corps of Engineers, (hereinafter referred to USACE)has made a reasonable effort to insure the accuracy of the maps and associated data, its should beexplicitly noted that USACE makes no warranty, representation or guaranty, either express or implied,as to the content, sequence, accuracy, timeliness or completeness of any of the data provided herein.The USACE, its officers, agents, employees, or servants shall assume no liability of any nature forany errors, omissions, or inaccuracies in the information provided regardless of how caused. The USACE, its officers, agents, employees or servants shall assume no liability for any decisions made or actions taken or not taken by the user of the maps and associated data in reliance upon any informationor data furnished here. By using these maps and associated data the user does so entirely at their ownrisk and explicitly acknowledges that he/she is aware of and agrees to be bound by this disclaimer and agrees not to present any claim or demand of any nature against the USACE, its officers, agents, employees or servants in any forum whatsoever for any damages of any nature whatsoever that may result from or may be caused in any way by the use of the maps and associated data.
0 500 1,000250
Feet
µ
U.S. Army Corps of EngineersChicago District
Thursday, February 19, 2009 J:\Templates\GN_Portrait_A_Size93.mxt
LegendPotential Upland Site
Potential Aquatic Site
A Thornton Reservoir Boreholes
A Calumet Tunnel Boreholes Attachment G-7

Soil Boring Logs available upon request for A11 and surrounding area
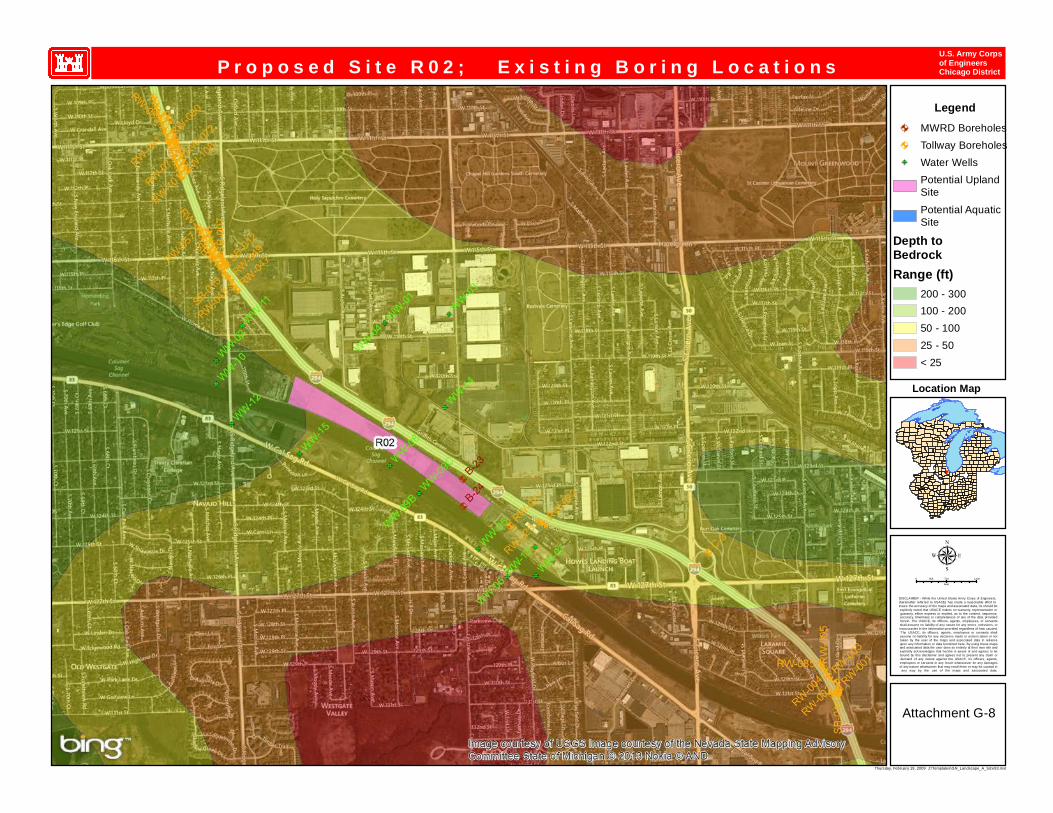
P r o p o s e d S i t e R 0 2 ; E x i s t i n g B o r i n g L o c a t i o n s
Location Map
DISCLAIMER - While the United States Army Corps of Engineers, (hereinafter referred to USACE) has made a reasonable effort to insure the accuracy of the maps and associated data, its should be explicitly noted that USACE makes no warranty, representation or guaranty, either express or implied, as to the content, sequence, accuracy, timeliness or completeness of any of the data provided herein. The USACE, its officers, agents, employees, or servants shall assume no liability of any nature for any errors, omissions, or inaccuracies in the information provided regardless of how caused. The USACE, its officers, agents, employees or servants shall assume no liability for any decisions made or actions taken or not taken by the user of the maps and associated data in reliance upon any information or data furnished here. By using these maps and associated data the user does so entirely at their own risk and explicitly acknowledges that he/she is aware of and agrees to be bound by this disclaimer and agrees not to present any claim or demand of any nature against the USACE, its officers, agents, employees or servants in any forum whatsoever for any damages of any nature whatsoever that may result from or may be caused in any way by the use of the maps and associated data.
Attachment G-8
0 710 1,420355
Feet
µ
U.S. Army Corpsof EngineersChicago District
Thursday, February 19, 2009 J:\Templates\GN_Landscape_A_Size93.mxt
LegendA MWRD Boreholes
A Tollway Boreholes
!A Water Wells
Potential UplandSite
Potential AquaticSite
Depth toBedrockRange (ft)
200 - 300
100 - 200
50 - 100
25 - 50
< 25
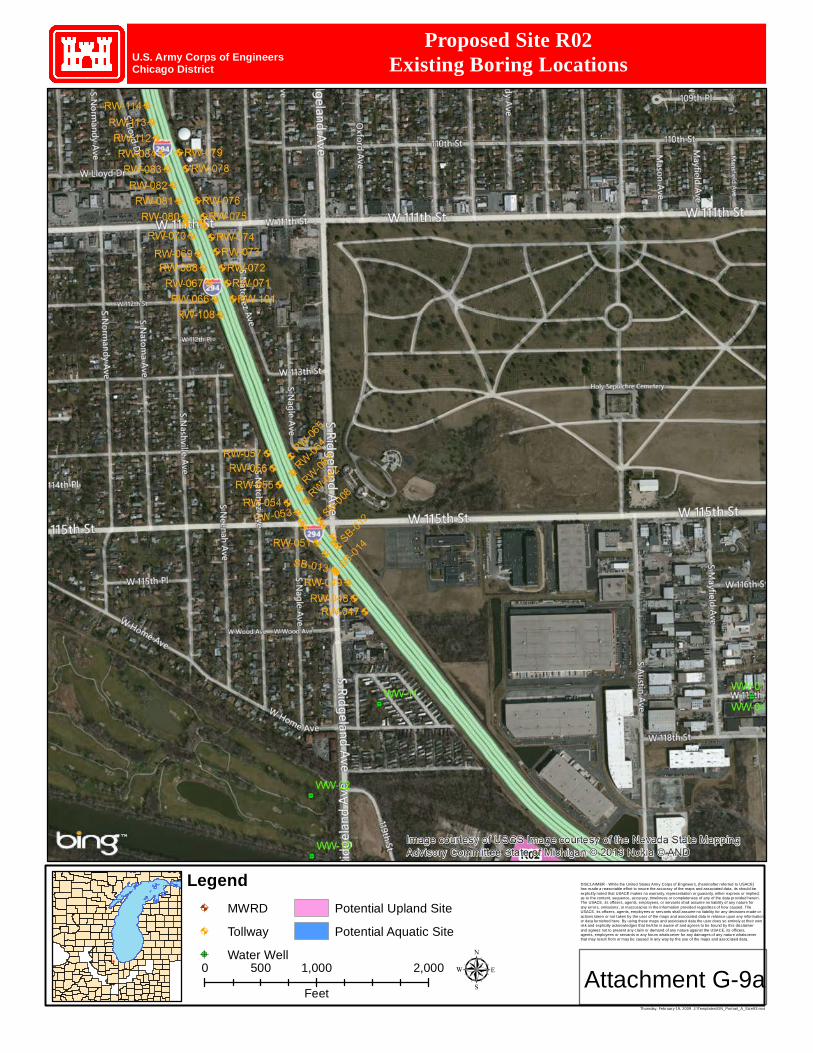
Proposed Site R02Existing Boring Locations
DISCLAIMER - While the United States Army Corps of Engineers, (hereinafter referred to USACE)has made a reasonable effort to insure the accuracy of the maps and associated data, its should beexplicitly noted that USACE makes no warranty, representation or guaranty, either express or implied,as to the content, sequence, accuracy, timeliness or completeness of any of the data provided herein.The USACE, its officers, agents, employees, or servants shall assume no liability of any nature forany errors, omissions, or inaccuracies in the information provided regardless of how caused. The USACE, its officers, agents, employees or servants shall assume no liability for any decisions made or actions taken or not taken by the user of the maps and associated data in reliance upon any informationor data furnished here. By using these maps and associated data the user does so entirely at their ownrisk and explicitly acknowledges that he/she is aware of and agrees to be bound by this disclaimer and agrees not to present any claim or demand of any nature against the USACE, its officers, agents, employees or servants in any forum whatsoever for any damages of any nature whatsoever that may result from or may be caused in any way by the use of the maps and associated data.
0 1,000 2,000500
Feetµ
U.S. Army Corps of EngineersChicago District
Thursday, February 19, 2009 J:\Templates\GN_Portrait_A_Size93.mxt
LegendA MWRD
A Tollway
!A Water Well
Potential Upland Site
Potential Aquatic Site
Attachment G-9a

P r o p o s e d S i t e R 0 2 ; E x i s t i n g B o r i n g L o c a t i o n s
Location Map
DISCLAIMER - While the United States Army Corps of Engineers, (hereinafter referred to USACE) has made a reasonable effort to insure the accuracy of the maps and associated data, its should be explicitly noted that USACE makes no warranty, representation or guaranty, either express or implied, as to the content, sequence, accuracy, timeliness or completeness of any of the data provided herein. The USACE, its officers, agents, employees, or servants shall assume no liability of any nature for any errors, omissions, or inaccuracies in the information provided regardless of how caused. The USACE, its officers, agents, employees or servants shall assume no liability for any decisions made or actions taken or not taken by the user of the maps and associated data in reliance upon any information or data furnished here. By using these maps and associated data the user does so entirely at their own risk and explicitly acknowledges that he/she is aware of and agrees to be bound by this disclaimer and agrees not to present any claim or demand of any nature against the USACE, its officers, agents, employees or servants in any forum whatsoever for any damages of any nature whatsoever that may result from or may be caused in any way by the use of the maps and associated data.
Attachment G-8b(Southeast Borings)
0 360 720180
Feet
µ
U.S. Army Corpsof EngineersChicago District
Thursday, February 19, 2009 J:\Templates\GN_Landscape_A_Size93.mxt
LegendA MWRD Boreholes
A Tollway Boreholes
!A Water Wells
Potential UplandSite
Potential AquaticSite

R I D G E L A N D A D J A C E N T S O I L B O R I N G S
Location Map
DISCLAIMER - While the United States Army Corps of Engineers, (hereinafter referred to USACE) has made a reasonable effort to insure the accuracy of the maps and associated data, its should be explicitly noted that USACE makes no warranty, representation or guaranty, either express or implied, as to the content, sequence, accuracy, timeliness or completeness of any of the data provided herein. The USACE, its officers, agents, employees, or servants shall assume no liability of any nature for any errors, omissions, or inaccuracies in the information provided regardless of how caused. The USACE, its officers, agents, employees or servants shall assume no liability for any decisions made or actions taken or not taken by the user of the maps and associated data in reliance upon any information or data furnished here. By using these maps and associated data the user does so entirely at their own risk and explicitly acknowledges that he/she is aware of and agrees to be bound by this disclaimer and agrees not to present any claim or demand of any nature against the USACE, its officers, agents, employees or servants in any forum whatsoever for any damages of any nature whatsoever that may result from or may be caused in any way by the use of the maps and associated data.
Approx. BedrockElevation
0 475 950237.5
Feet
µ
U.S. Army Corpsof EngineersChicago District
Thursday, February 19, 2009 J:\Templates\GN_Landscape_A_Size93.mxt
LegendA Soil Boring
!A Water Well

Soil Boring Logs available upon request for R02 and surrounding area
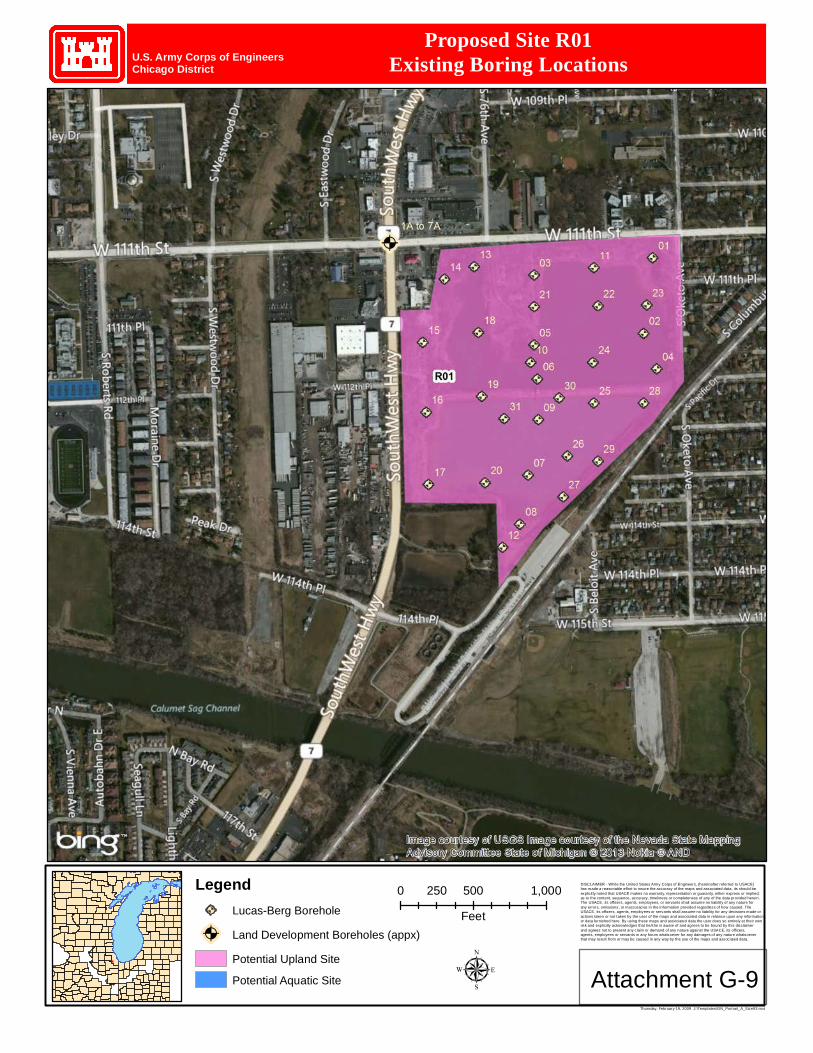
Proposed Site R01Existing Boring Locations
DISCLAIMER - While the United States Army Corps of Engineers, (hereinafter referred to USACE)has made a reasonable effort to insure the accuracy of the maps and associated data, its should beexplicitly noted that USACE makes no warranty, representation or guaranty, either express or implied,as to the content, sequence, accuracy, timeliness or completeness of any of the data provided herein.The USACE, its officers, agents, employees, or servants shall assume no liability of any nature forany errors, omissions, or inaccuracies in the information provided regardless of how caused. The USACE, its officers, agents, employees or servants shall assume no liability for any decisions made or actions taken or not taken by the user of the maps and associated data in reliance upon any informationor data furnished here. By using these maps and associated data the user does so entirely at their ownrisk and explicitly acknowledges that he/she is aware of and agrees to be bound by this disclaimer and agrees not to present any claim or demand of any nature against the USACE, its officers, agents, employees or servants in any forum whatsoever for any damages of any nature whatsoever that may result from or may be caused in any way by the use of the maps and associated data.
0 500 1,000250
Feet
µ
U.S. Army Corps of EngineersChicago District
Thursday, February 19, 2009 J:\Templates\GN_Portrait_A_Size93.mxt
LegendA Lucas-Berg Borehole
A Land Development Boreholes (appx)
Potential Upland Site
Potential Aquatic Site Attachment G-9

Soil Boring Logs available upon request for R01 and surrounding area

CELRC-TS-DG 8 August 2013 MEMORANDUM FOR RECORD SUBJECT: Calumet DMMP, Harbor Soils Test Results Introduction 1. The Calumet Harbor dredged material is being considered for reuse as fill for the Illinois
Tollway Authority’s I-57/294 interchange. In order for it to be used, the material must adhere to certain physical properties. A memo dated March 18, 2013 included a summary of previously completed soil tests in the harbor and the CDF, which indicated that the soils may be suitable.
2. Therefore, additional tests were carried out specifically to determine the soil’s suitability with respect to maximum dry density, optimal moisture, organic content, Atterberg limit, grain size, and natural moisture content. These were completed on the material that was being dredged at the end of June 2013.
Sample Locations
3. A site visit was conducted on 27 June 2013 to collect samples from the Calumet Harbor
dredging activities. The first sample was taken from Scow #1, which was full of dredged material from previous day’s work and docked in a slip. While it is unknown precisely where this scow was filled, the dredging contractor estimated that it was a few hundred feet southeast of where Scow #2 was being filled.
Figure 1: Photo taking Sample #1
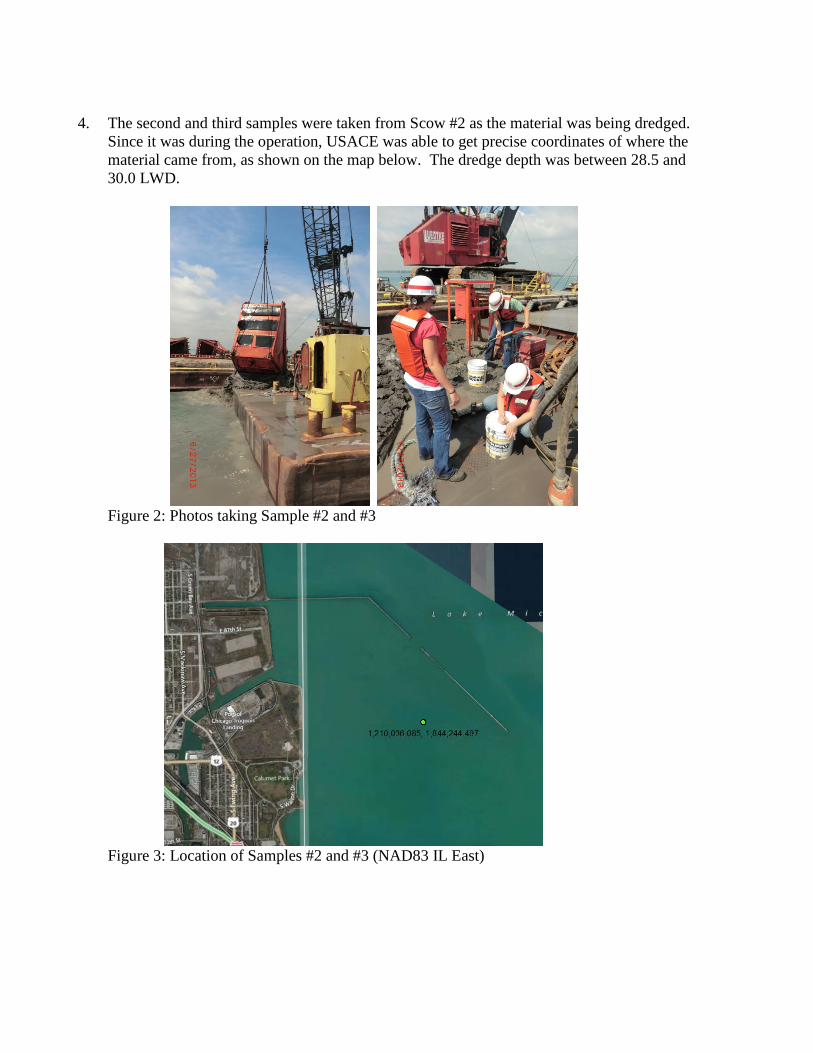
4. The second and third samples were taken from Scow #2 as the material was being dredged.
Since it was during the operation, USACE was able to get precise coordinates of where the material came from, as shown on the map below. The dredge depth was between 28.5 and 30.0 LWD.
Figure 2: Photos taking Sample #2 and #3
Figure 3: Location of Samples #2 and #3 (NAD83 IL East)
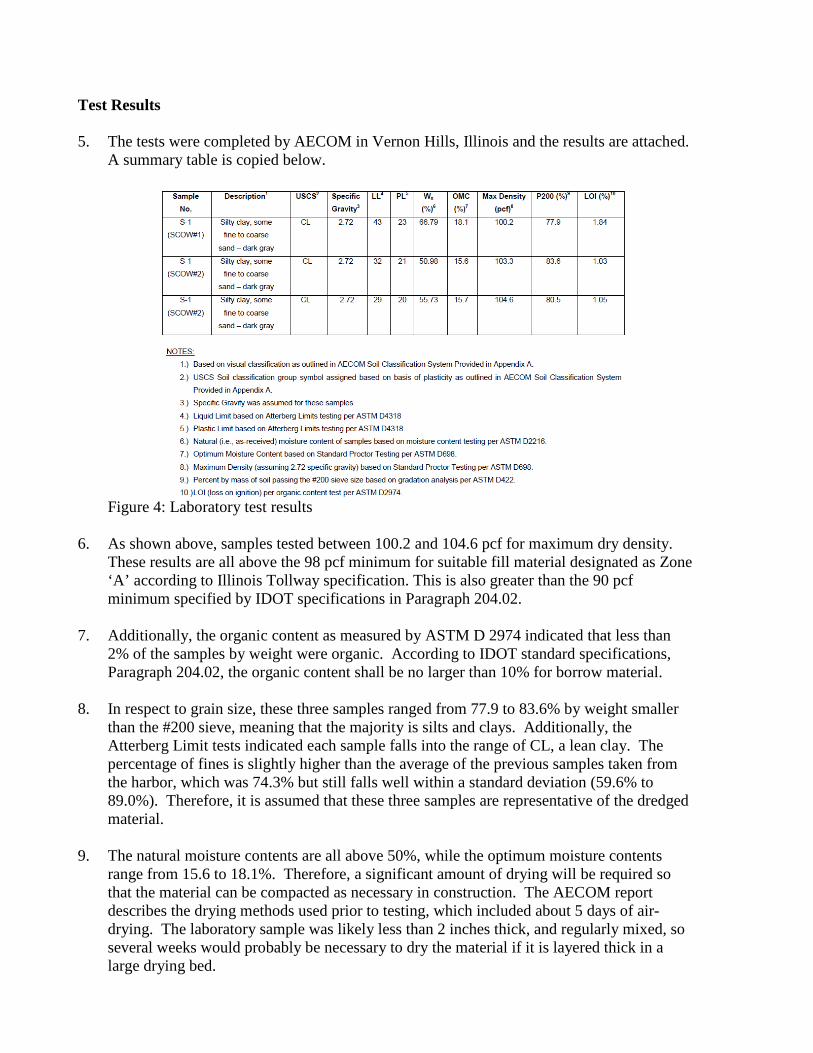
Test Results 5. The tests were completed by AECOM in Vernon Hills, Illinois and the results are attached.
A summary table is copied below.
Figure 4: Laboratory test results
6. As shown above, samples tested between 100.2 and 104.6 pcf for maximum dry density.
These results are all above the 98 pcf minimum for suitable fill material designated as Zone ‘A’ according to Illinois Tollway specification. This is also greater than the 90 pcf minimum specified by IDOT specifications in Paragraph 204.02.
7. Additionally, the organic content as measured by ASTM D 2974 indicated that less than 2% of the samples by weight were organic. According to IDOT standard specifications, Paragraph 204.02, the organic content shall be no larger than 10% for borrow material.
8. In respect to grain size, these three samples ranged from 77.9 to 83.6% by weight smaller than the #200 sieve, meaning that the majority is silts and clays. Additionally, the Atterberg Limit tests indicated each sample falls into the range of CL, a lean clay. The percentage of fines is slightly higher than the average of the previous samples taken from the harbor, which was 74.3% but still falls well within a standard deviation (59.6% to 89.0%). Therefore, it is assumed that these three samples are representative of the dredged material.
9. The natural moisture contents are all above 50%, while the optimum moisture contents
range from 15.6 to 18.1%. Therefore, a significant amount of drying will be required so that the material can be compacted as necessary in construction. The AECOM report describes the drying methods used prior to testing, which included about 5 days of air-drying. The laboratory sample was likely less than 2 inches thick, and regularly mixed, so several weeks would probably be necessary to dry the material if it is layered thick in a large drying bed.

Conclusion
10. Based on the results from the laboratory testing, the dredged material in Calumet Harbor would be appropriate for use as fill for the Illinois Tollway project. Effort will be required to dry out the soils to obtain suitable moisture contents. This can be accomplished with time, weather, thickness of soil layer, frequency of handling, application of lime, or a combination of these actions.
Daniel J. Ferris, PE TS-DG
Attachments
1. AECOM Laboratory Testing Report 2. Memo dated 18 March 2013
AECOM 616.942.9600 tel 5555 Glenwood Hills Pkwy, Suite 300 616.940.4396 fax
Grand Rapids, Michigan 49512
Laboratory Testing Report Calumet CDF Geotechnical Testing U.S. Army Corps of Engineers – Chicago District AECOM Project No.: 60302272 Date: July 30, 2013
Prepared by: AECOM Aaron M. Humphrey, P.E. Senior Project Engineer (616) 940-4451
Reviewed by: AECOM Paul A. Tarvin, P.E. Vice President (414) 944-6080
AECOM Calumet CDF Geotechnical Testing 2
Contents
1.0 Introduction .................................................................................................................................... 1 2.0 Authorization and Purpose ............................................................................................................ 2 3.0 Scope of Services ........................................................................................................................... 3 4.0 Procedures ...................................................................................................................................... 4 5.0 Testing Results Discussion ........................................................................................................... 5 6.0 General Qualifications ................................................................................................................... 7
APPENDICES Appendix A – AECOM Soil Classification System
Appendix B – Standard Proctor Test Results
Gradation Test Results
Atterberg Limits Test Results
Organic Content Test Results

AECOM Calumet CDF Geotechnical Testing 1
602302272 - Calumet Harbor CDF Report Draft.doc
1.0 Introduction
According to the United States Army Corps of Engineers – Chicago District, the following paragraphs provide background information for the project:
“Material is being dredged from Calumet Harbor at the mouth of the Calumet River, near the border between Illinois and Indiana. The materials are being placed in the USACE built and maintained Confined Disposal Facility (CDF), which is just south of the river mouth at Lake Michigan. This CDF is nearing capacity and USACE is investigating alternative locations for dredged materials. The CDF contains materials from both the harbor and the river. The focus of this investigation is to test soil samples of the harbor material offloaded from the dredging barge. These harbor materials (and not the river materials) are being considered for other uses so geotechnical properties are required to characterize the soil for potential use. The harbor materials have been environmentally tested and are within TACO Tier 1, according to IEPA.”
AECOM Calumet CDF Geotechnical Testing 2
602302272 - Calumet Harbor CDF Report Draft.doc
2.0 Authorization and Purpose The United States Army Corps of Engineers (USACE) engaged AECOM to perform laboratory soil testing for the captioned project. The project was presented by USACE to AECOM in a scope of work dated May 30, 2013. The authorization was provided on June 11, 2013, in a letter signed by Ericka Hillard (USACE – Chicago).

AECOM Calumet CDF Geotechnical Testing 3
602302272 - Calumet Harbor CDF Report Draft.doc
3.0 Scope of Services The AECOM services were completed in general accordance with the Calumet CDF Geotechnical Testing Scope of Work (SOW) dated May 30, 2013. The Scope of Work included, but was not limited to, the following tasks:
preparing a Quality Control Plan (QCP), performing requested laboratory soil testing as outlined in section 4.0 of this report; and, preparing this laboratory testing report providing the results of the laboratory testing.

AECOM Calumet CDF Geotechnical Testing 4
4
4.0 Procedures Laboratory testing was performed on samples which were delivered to the USACE accredited AECOM geotechnical testing laboratory in Vernon Hills, Illinois on July 1, 2013. AECOM was not provided with any information regarding where the samples were collected from or how they were sampled. The testing program is summarized below:
Laboratory Testing Program Summary
Test Name Designation Proposed Number of Tests
Completed Number of Tests
Moisture Content ASTM D2216 3 3 Atterberg Limits ASTM D 4318 3 3
Combined Analysis ASTM D 422 3 3
Organic Content ASTM D2974 3 3 Standard Proctor ASTM D69
6 6
The laboratory testing results are included in Appendix B of this report.
AECOM Calumet CDF Geotechnical Testing 5
5
5.0 Testing Results Discussion Table 1 on the following page provides a summary of the testing results included in Appendix B. The soils
were received on July 1, 2013 and were tested shortly thereafter. As can be seen from the testing results,
the material consists of an inorganic silty clay with varying amounts of sand. The natural moisture
content of the material ranges from approximately 51 percent to 67 percent, while the optimum moisture
contents as determined by the standard Proctor tests range from approximately 15.5 to 18 percent. Since
the natural moisture content of the material as delivered was considerably higher than the optimum
moisture, the samples had to be dried in the laboratory for over 2.5 days at 120 degrees Fahrenheit to
reach a condition dry enough for preparation of the compaction test samples. Index test samples had to
be air-dried for approximately five days before the index testing could be performed.
These factors indicate that a significant amount of drying will be required in order to achieve adequate
compaction of the samples for field applications. The amount of drying time will depend on the weather
conditions, thickness of soil being dried, and the frequency of handling (i.e., turning over) of the soil.

AECOM Calumet CDF Geotechnical Testing 6
6
TABLE 1: GEOTECHNICAL TESTING SUMMARY
Sample No.
Description1 USCS2 Specific Gravity3
LL4 PL5 Wn
(%)6 OMC (%)7
Max Density (pcf)8
P200 (%)9 LOI (%)10
S-1
(SCOW#1)
Silty clay, some
fine to coarse
sand – dark gray
CL 2.72 43 23 66.79 18.1 100.2 77.9 1.84
S-1
(SCOW#2)
Silty clay, some
fine to coarse
sand – dark gray
CL 2.72 32 21 50.98 15.6 103.3 83.6 1.03
S-1
(SCOW#2)
Silty clay, some
fine to coarse
sand – dark gray
CL 2.72 29 20 55.73 15.7 104.6 80.5 1.05
NOTES:
1.) Based on visual classification as outlined in AECOM Soil Classification System Provided in Appendix A.
2.) USCS Soil classification group symbol assigned based on basis of plasticity as outlined in AECOM Soil Classification System
Provided in Appendix A.
3.) Specific Gravity was assumed for these samples
4.) Liquid Limit based on Atterberg Limits testing per ASTM D4318
5.) Plastic Limit based on Atterberg Limits testing per ASTM D4318
6.) Natural (i.e., as-received) moisture content of samples based on moisture content testing per ASTM D2216.
7.) Optimum Moisture Content based on Standard Proctor Testing per ASTM D698.
8.) Maximum Density (assuming 2.72 specific gravity) based on Standard Proctor Testing per ASTM D698.
9.) Percent by mass of soil passing the #200 sieve size based on gradation analysis per ASTM D422.
10.) LOI (loss on ignition) per organic content test per ASTM D2974.

AECOM Calumet CDF Geotechnical Testing 7
602302272 - Calumet Harbor CDF Report Draft.doc
6.0General Qualifications
The information presented in this report is based on data obtained from laboratory testing completed on soil samples delivered by representatives of the Corp of Engineers to the AECOM laboratory in Vernon Hills, IL. This report has been prepared in accordance with generally accepted soil and foundation engineering practices to aid in the evaluation of this property, and to assist in the design of this project. No other warranty, expressed or implied, is made. The scope of this report is limited to the specific project and location described herein, and our description of the project represents our understanding of the significant aspects relevant to soil characteristics.

602302272 - Calumet Harbor CDF Report Draft.doc
APPENDIX A
AECOM Soil Classification System
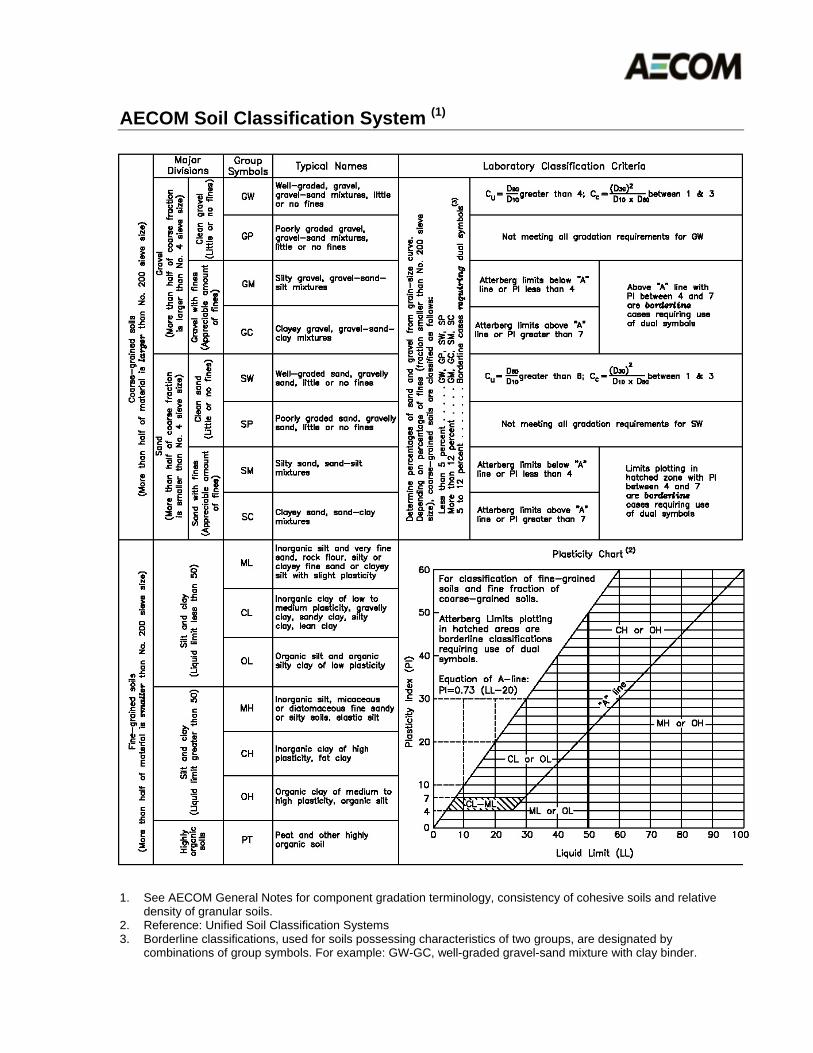
AECOM Soil Classification System (1)
1. See AECOM General Notes for component gradation terminology, consistency of cohesive soils and relative
density of granular soils. 2. Reference: Unified Soil Classification Systems 3. Borderline classifications, used for soils possessing characteristics of two groups, are designated by
combinations of group symbols. For example: GW-GC, well-graded gravel-sand mixture with clay binder.

602302272 - Calumet Harbor CDF Report Draft.doc
APPENDIX B
Standard Proctor Test Results
Gradation Test Results
Atterberg Limits Test Results
Organic Content Test Results
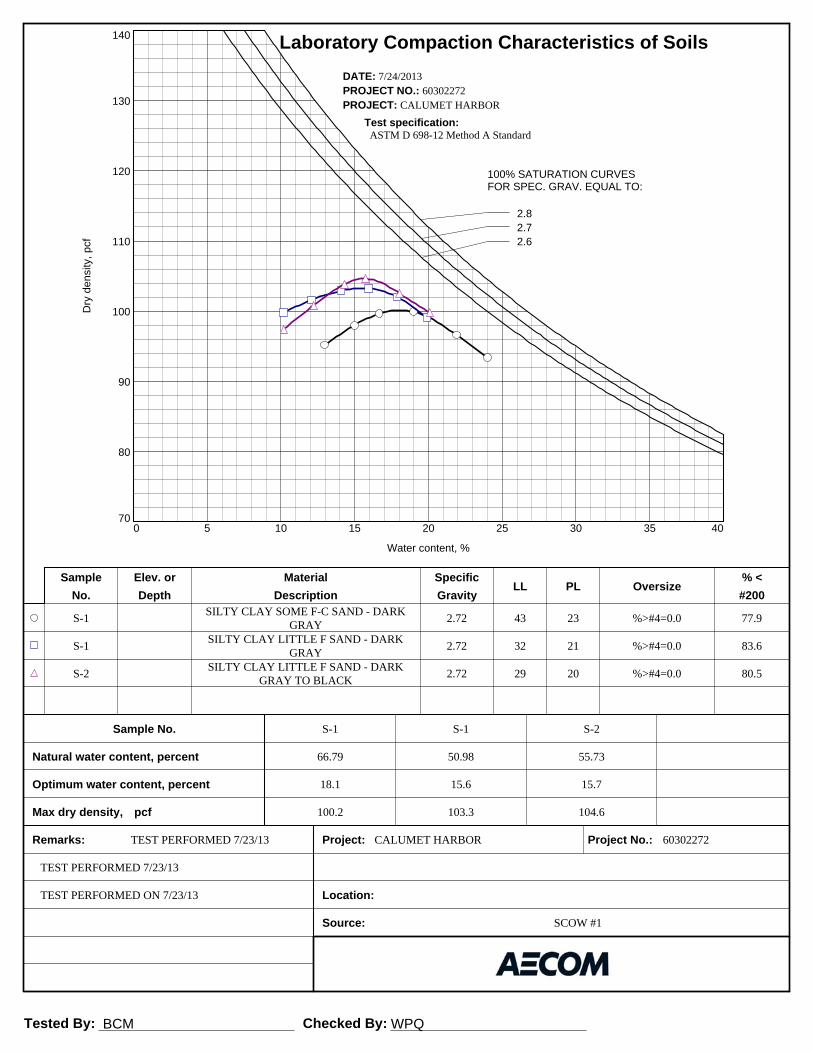
Tested By: BCM Checked By: WPQ
S-1SILTY CLAY SOME F-C SAND - DARK
GRAY2.72 43 23 %>#4=0.0 77.9
S-1SILTY CLAY LITTLE F SAND - DARK
GRAY2.72 32 21 %>#4=0.0 83.6
S-2SILTY CLAY LITTLE F SAND - DARK
GRAY TO BLACK2.72 29 20 %>#4=0.0 80.5
S-1 S-1 S-2
66.79 50.98 55.73
18.1 15.6 15.7
100.2 103.3 104.6
60302272
SCOW #1
SpecificOversize
Gravity
Max dry density, pcf
Project: Project No.:
Location:
Source:
Sample Elev. or MaterialLL PL
% <No. Depth Description #200
Sample No.
Natural water content, percent
Optimum water content, percent
Remarks:
Dry
de
nsi
ty,
pcf
70
80
90
100
110
120
130
140
Water content, %
0 5 10 15 20 25 30 35 40
100% SATURATION CURVESFOR SPEC. GRAV. EQUAL TO:
2.82.72.6
Laboratory Compaction Characteristics of Soils
PROJECT: CALUMET HARBORPROJECT NO.: 60302272DATE: 7/24/2013
Test specification: ASTM D 698-12 Method A Standard
TEST PERFORMED 7/23/13
TEST PERFORMED 7/23/13
TEST PERFORMED ON 7/23/13
CALUMET HARBOR

Tested By: BCM Checked By: WPQ
S-1SILTY CLAY SOME F-C SAND - DARK
GRAY2.72 43 23 %>#4=0.0 77.9
S-1
66.79
18.1
100.2
60302272
SCOW #1
SpecificOversize
Gravity
Max dry density, pcf
Project: Project No.:
Location:
Source:
Sample Elev. or MaterialLL PL
% <No. Depth Description #200
Sample No.
Natural water content, percent
Optimum water content, percent
Remarks:
Dry
de
nsi
ty,
pcf
70
80
90
100
110
120
130
140
Water content, %
0 5 10 15 20 25 30 35 40
100% SATURATION CURVESFOR SPEC. GRAV. EQUAL TO:
2.82.72.6
Laboratory Compaction Characteristics of Soils
PROJECT: CALUMET HARBORPROJECT NO.: 60302272DATE: 7/24/2013
Test specification: ASTM D 698-12 Method A Standard
TEST PERFORMED 7/23/13 CALUMET HARBOR
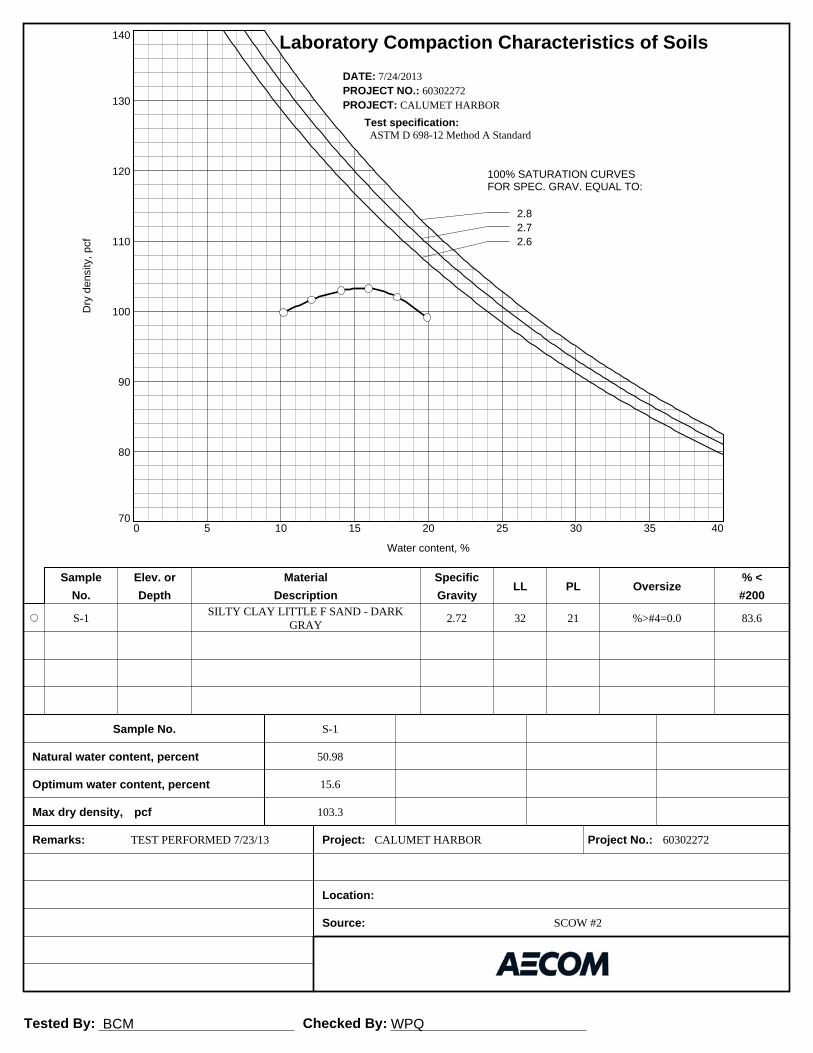
Tested By: BCM Checked By: WPQ
S-1SILTY CLAY LITTLE F SAND - DARK
GRAY2.72 32 21 %>#4=0.0 83.6
S-1
50.98
15.6
103.3
60302272
SCOW #2
SpecificOversize
Gravity
Max dry density, pcf
Project: Project No.:
Location:
Source:
Sample Elev. or MaterialLL PL
% <No. Depth Description #200
Sample No.
Natural water content, percent
Optimum water content, percent
Remarks:
Dry
de
nsi
ty,
pcf
70
80
90
100
110
120
130
140
Water content, %
0 5 10 15 20 25 30 35 40
100% SATURATION CURVESFOR SPEC. GRAV. EQUAL TO:
2.82.72.6
Laboratory Compaction Characteristics of Soils
PROJECT: CALUMET HARBORPROJECT NO.: 60302272DATE: 7/24/2013
Test specification: ASTM D 698-12 Method A Standard
TEST PERFORMED 7/23/13 CALUMET HARBOR

Tested By: BCM Checked By: WPQ
S-2SILTY CLAY LITTLE F SAND - DARK
GRAY TO BLACK2.72 29 20 %>#4=0.0 80.5
S-2
55.73
15.7
104.6
60302272
SCOW #2
SpecificOversize
Gravity
Max dry density, pcf
Project: Project No.:
Location:
Source:
Sample Elev. or MaterialLL PL
% <No. Depth Description #200
Sample No.
Natural water content, percent
Optimum water content, percent
Remarks:
Dry
de
nsi
ty,
pcf
70
80
90
100
110
120
130
140
Water content, %
0 5 10 15 20 25 30 35 40
100% SATURATION CURVESFOR SPEC. GRAV. EQUAL TO:
2.82.72.6
Laboratory Compaction Characteristics of Soils
PROJECT: CALUMET HARBORPROJECT NO.: 60302272DATE: 7/24/2013
Test specification: ASTM D 698-12 Method A Standard
TEST PERFORMED ON 7/23/13 CALUMET HARBOR

Tested By: BCM Checked By: WPQ
Cu Cu spec. D10 D10 spec. Cu D10 D60 % - #30
Material and Supplier
Project No. Client: Remarks:Project:
Source of Sample: SCOW #1 Sample Number: S-1
Source of Sample: SCOW #2 Sample Number: S-1Source of Sample: SCOW #2 Sample Number: S-2
0.0169 94.6
0.0313 99.3
0.0319 99.7
SILTY CLAY SOME F-C SAND - DARK GRAYSILTY CLAY LITTLE F SAND - DARK GRAYSILTY CLAY LITTLE F SAND - DARK GRAY TO BLACK
60302272 US ARMY CORPS OF ENGINEERS
PE
RC
EN
T F
INE
R
0
10
20
30
40
50
60
70
80
90
100
PE
RC
EN
T C
OA
RS
ER
100
90
80
70
60
50
40
30
20
10
0
GRAIN SIZE - mm.
0.0010.010.1110
3 in
.
2 in
.
1½ in
.
1 in
.
¾ in
.
½ in
.
3/8
in.
#4 #10
#20
#30
#40
#60
#100
#140
#200
PARTICLE SIZE ANALYSIS OF SOILS ASTM D422
CALUMET HARBOR SHELL NOTED
F.M.=0.30
SHELL NOTED
F.M.=0.06
SHELL NOTED
F.M.=0.04
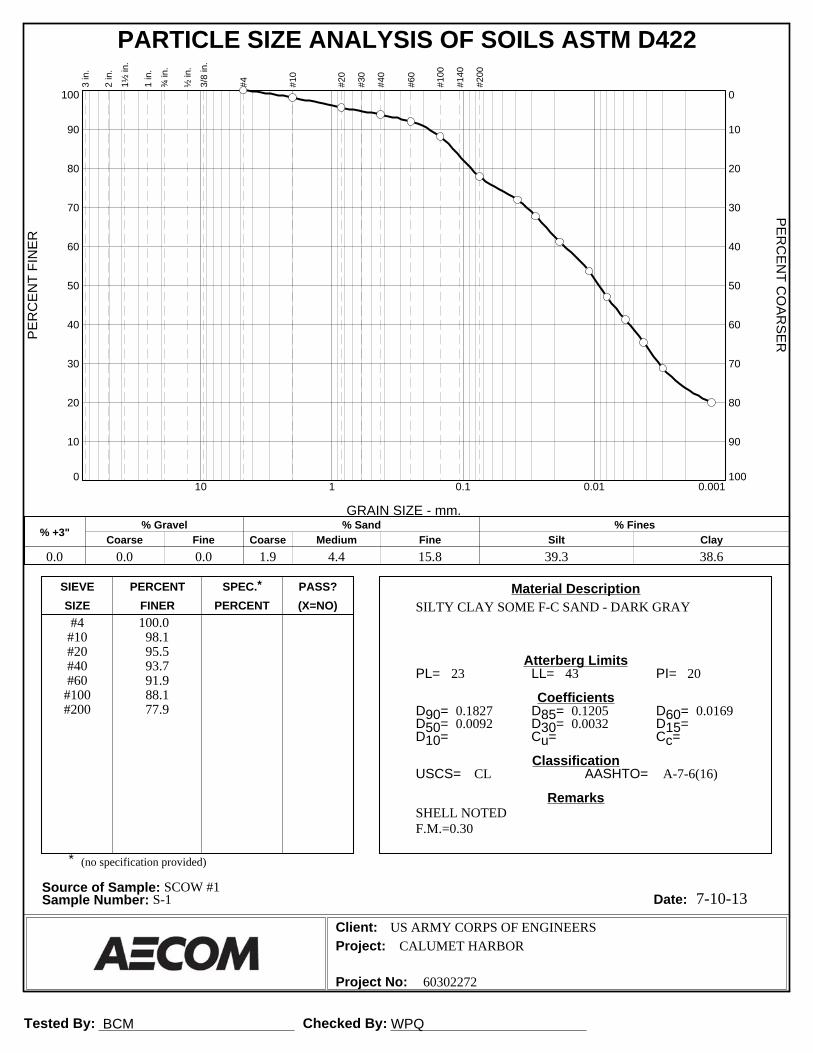
Tested By: BCM Checked By: WPQ
7-10-13
(no specification provided)
PL= LL= PI=
D90= D85= D60=D50= D30= D15=D10= Cu= Cc=
USCS= AASHTO=
*
SILTY CLAY SOME F-C SAND - DARK GRAY#4#10#20#40#60
#100#200
100.098.195.593.791.988.177.9
23 43 20
0.1827 0.1205 0.01690.0092 0.0032
CL A-7-6(16)
SHELL NOTEDF.M.=0.30
US ARMY CORPS OF ENGINEERS
CALUMET HARBOR
60302272
Material Description
Atterberg Limits
Coefficients
Classification
Remarks
Source of Sample: SCOW #1Sample Number: S-1 Date:
Client:Project:
Project No:
SIEVE PERCENT SPEC.* PASS?SIZE FINER PERCENT (X=NO)
PE
RC
EN
T F
INE
R
0
10
20
30
40
50
60
70
80
90
100
PE
RC
EN
T C
OA
RS
ER
100
90
80
70
60
50
40
30
20
10
0
GRAIN SIZE - mm.
0.0010.010.1110
% +3"Coarse
% GravelFine Coarse Medium
% SandFine Silt
% FinesClay
0.0 0.0 0.0 1.9 4.4 15.8 39.3 38.6
3 in
.
2 in
.
1½ in
.
1 in
.
¾ in
.
½ in
.
3/8
in.
#4 #10
#20
#30
#40
#60
#100
#140
#200
PARTICLE SIZE ANALYSIS OF SOILS ASTM D422

Tested By: BCM Checked By: WPQ
7-10-13
(no specification provided)
PL= LL= PI=
D90= D85= D60=D50= D30= D15=D10= Cu= Cc=
USCS= AASHTO=
*
SILTY CLAY LITTLE F SAND - DARK GRAY#4#10#20#40#60
#100#200
100.099.899.599.098.596.883.6
21 32 11
0.1002 0.0800 0.03130.0188 0.0052
CL A-6(9)
SHELL NOTEDF.M.=0.06
US ARMY CORPS OF ENGINEERS
CALUMET HARBOR
60302272
Material Description
Atterberg Limits
Coefficients
Classification
Remarks
Source of Sample: SCOW #2Sample Number: S-1 Date:
Client:Project:
Project No:
SIEVE PERCENT SPEC.* PASS?SIZE FINER PERCENT (X=NO)
PE
RC
EN
T F
INE
R
0
10
20
30
40
50
60
70
80
90
100
PE
RC
EN
T C
OA
RS
ER
100
90
80
70
60
50
40
30
20
10
0
GRAIN SIZE - mm.
0.0010.010.1110
% +3"Coarse
% GravelFine Coarse Medium
% SandFine Silt
% FinesClay
0.0 0.0 0.0 0.2 0.8 15.4 54.0 29.6
3 in
.
2 in
.
1½ in
.
1 in
.
¾ in
.
½ in
.
3/8
in.
#4 #10
#20
#30
#40
#60
#100
#140
#200
PARTICLE SIZE ANALYSIS OF SOILS ASTM D422
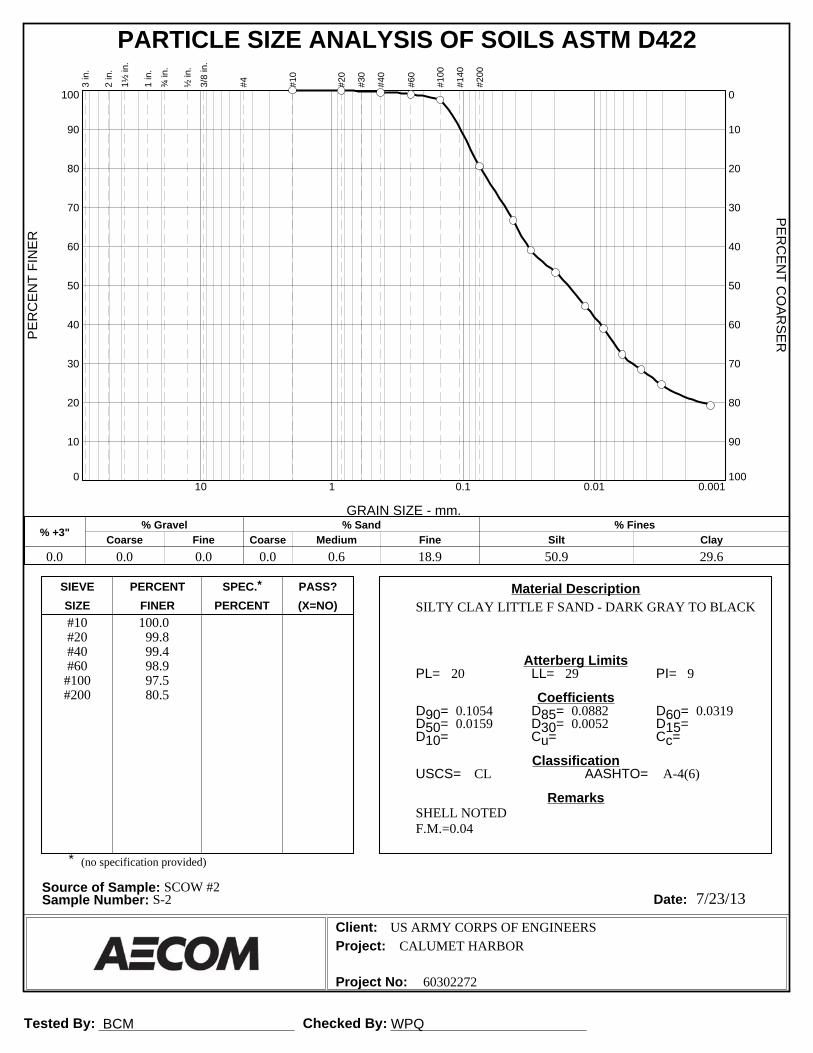
Tested By: BCM Checked By: WPQ
7/23/13
(no specification provided)
PL= LL= PI=
D90= D85= D60=D50= D30= D15=D10= Cu= Cc=
USCS= AASHTO=
*
SILTY CLAY LITTLE F SAND - DARK GRAY TO BLACK#10#20#40#60
#100#200
100.099.899.498.997.580.5
20 29 9
0.1054 0.0882 0.03190.0159 0.0052
CL A-4(6)
SHELL NOTEDF.M.=0.04
US ARMY CORPS OF ENGINEERS
CALUMET HARBOR
60302272
Material Description
Atterberg Limits
Coefficients
Classification
Remarks
Source of Sample: SCOW #2Sample Number: S-2 Date:
Client:Project:
Project No:
SIEVE PERCENT SPEC.* PASS?SIZE FINER PERCENT (X=NO)
PE
RC
EN
T F
INE
R
0
10
20
30
40
50
60
70
80
90
100
PE
RC
EN
T C
OA
RS
ER
100
90
80
70
60
50
40
30
20
10
0
GRAIN SIZE - mm.
0.0010.010.1110
% +3"Coarse
% GravelFine Coarse Medium
% SandFine Silt
% FinesClay
0.0 0.0 0.0 0.0 0.6 18.9 50.9 29.6
3 in
.
2 in
.
1½ in
.
1 in
.
¾ in
.
½ in
.
3/8
in.
#4 #10
#20
#30
#40
#60
#100
#140
#200
PARTICLE SIZE ANALYSIS OF SOILS ASTM D422

Tested By: ER Checked By: BCM
SILTY CLAY SOME F-C SAND - DARK GRAY 43 23 20 93.7 77.9 CL
SILTY CLAY LITTLE F SAND - DARK GRAY 32 21 11 99.0 83.6 CL
SILTY CLAY LITTLE F SAND - DARK GRAY TOBLACK
29 20 9 99.4 80.5 CL
60302272 US ARMY CORPS OF ENGINEERS
MATERIAL DESCRIPTION LL PL PI %<#40 %<#200 USCS
Project No. Client: Remarks:Project:
Source of Sample: SCOW #1 Sample Number: S-1
Source of Sample: SCOW #2 Sample Number: S-1
Source of Sample: SCOW #2 Sample Number: S-2
PLA
ST
ICIT
Y IN
DE
X
0
10
20
30
40
50
60
LIQUID LIMIT0 10 20 30 40 50 60 70 80 90 100 110
CL-ML
CL or OL
CH or OH
ML or OL MH or OH
Dashed line indicates the approximateupper limit boundary for natural soils
47
WA
TE
R C
ON
TE
NT
26
28
30
32
34
36
38
40
42
44
46
NUMBER OF BLOWS5 6 7 8 9 10 20 25 30 40
LIQUID AND PLASTIC LIMITS ASTM D 4318
SHELL NOTEDSHELL NOTEDSHELL NOTED
CALUMET HARBOR
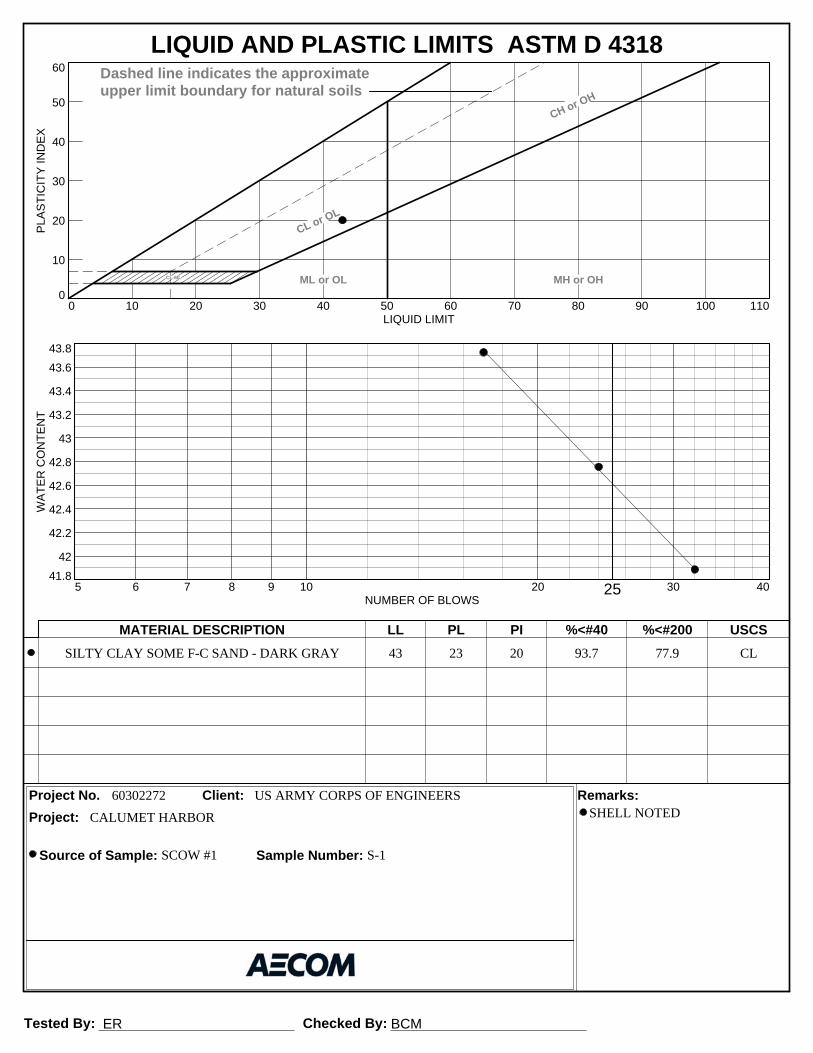
Tested By: ER Checked By: BCM
SILTY CLAY SOME F-C SAND - DARK GRAY 43 23 20 93.7 77.9 CL
60302272 US ARMY CORPS OF ENGINEERS
MATERIAL DESCRIPTION LL PL PI %<#40 %<#200 USCS
Project No. Client: Remarks:Project:
Source of Sample: SCOW #1 Sample Number: S-1
PLA
ST
ICIT
Y IN
DE
X
0
10
20
30
40
50
60
LIQUID LIMIT0 10 20 30 40 50 60 70 80 90 100 110
CL-ML
CL or OL
CH or OH
ML or OL MH or OH
Dashed line indicates the approximateupper limit boundary for natural soils
47
WA
TE
R C
ON
TE
NT
41.8
42
42.2
42.4
42.6
42.8
43
43.2
43.4
43.6
43.8
NUMBER OF BLOWS5 6 7 8 9 10 20 25 30 40
LIQUID AND PLASTIC LIMITS ASTM D 4318
SHELL NOTEDCALUMET HARBOR

Tested By: ER Checked By: BCM
SILTY CLAY LITTLE F SAND - DARK GRAY 32 21 11 99.0 83.6 CL
60302272 US ARMY CORPS OF ENGINEERS
MATERIAL DESCRIPTION LL PL PI %<#40 %<#200 USCS
Project No. Client: Remarks:Project:
Source of Sample: SCOW #2 Sample Number: S-1
PLA
ST
ICIT
Y IN
DE
X
0
10
20
30
40
50
60
LIQUID LIMIT0 10 20 30 40 50 60 70 80 90 100 110
CL-ML
CL or OL
CH or OH
ML or OL MH or OH
Dashed line indicates the approximateupper limit boundary for natural soils
47
WA
TE
R C
ON
TE
NT
30
30.4
30.8
31.2
31.6
32
32.4
32.8
33.2
33.6
34
NUMBER OF BLOWS5 6 7 8 9 10 20 25 30 40
LIQUID AND PLASTIC LIMITS ASTM D 4318
SHELL NOTEDCALUMET HARBOR

Tested By: ER Checked By: BCM
SILTY CLAY LITTLE F SAND - DARK GRAY TOBLACK
29 20 9 99.4 80.5 CL
60302272 US ARMY CORPS OF ENGINEERS
MATERIAL DESCRIPTION LL PL PI %<#40 %<#200 USCS
Project No. Client: Remarks:Project:
Source of Sample: SCOW #2 Sample Number: S-2
PLA
ST
ICIT
Y IN
DE
X
0
10
20
30
40
50
60
LIQUID LIMIT0 10 20 30 40 50 60 70 80 90 100 110
CL-ML
CL or OL
CH or OH
ML or OL MH or OH
Dashed line indicates the approximateupper limit boundary for natural soils
47
WA
TE
R C
ON
TE
NT
27.6
28
28.4
28.8
29.2
29.6
30
30.4
30.8
31.2
31.6
NUMBER OF BLOWS5 6 7 8 9 10 20 25 30 40
LIQUID AND PLASTIC LIMITS ASTM D 4318
SHELL NOTEDCALUMET HARBOR
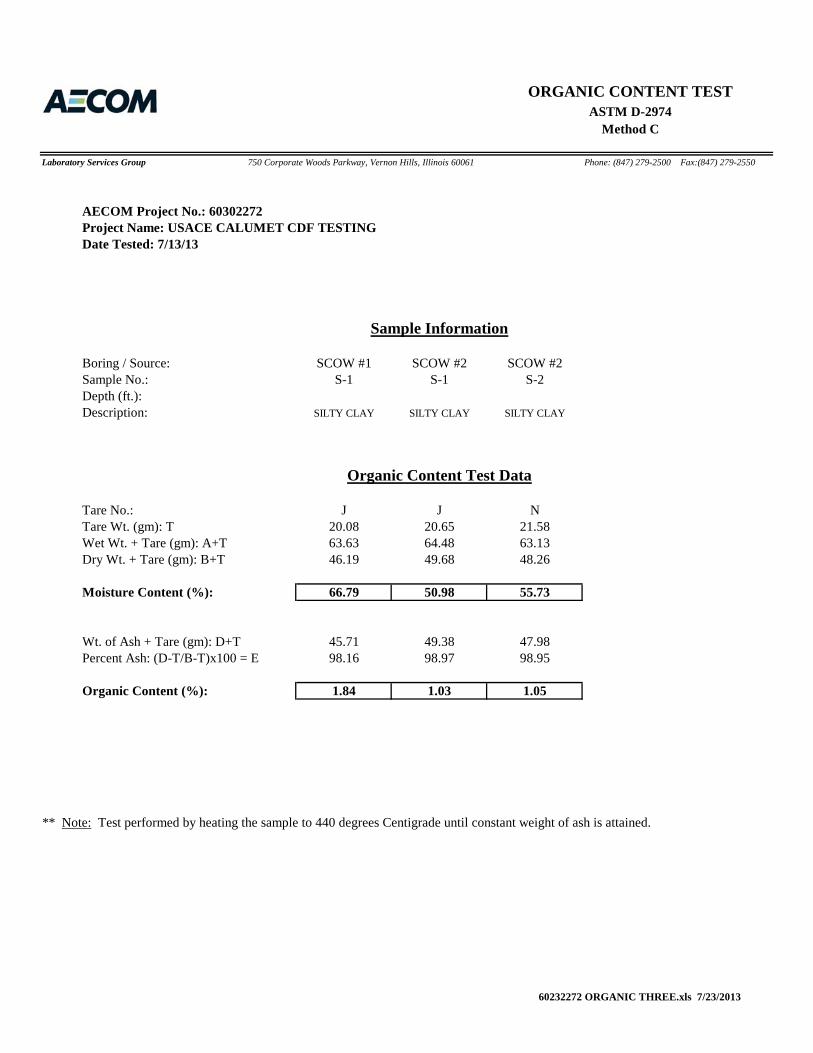
ORGANIC CONTENT TESTASTM D-2974
Method C
Laboratory Services Group 750 Corporate Woods Parkway, Vernon Hills, Illinois 60061 Phone: (847) 279-2500 Fax:(847) 279-2550
AECOM Project No.: 60302272Project Name: USACE CALUMET CDF TESTING Date Tested: 7/13/13
Boring / Source: SCOW #1 SCOW #2 SCOW #2Sample No.: S-1 S-1 S-2Depth (ft.):Description: SILTY CLAY SILTY CLAY SILTY CLAY
Tare No.: J J NTare Wt. (gm): T 20.08 20.65 21.58W t Wt + T ( ) A+T 63 63 64 48 63 13
Sample Information
Organic Content Test Data
Wet Wt. + Tare (gm): A+T 63.63 64.48 63.13Dry Wt. + Tare (gm): B+T 46.19 49.68 48.26
Moisture Content (%): 66.79 50.98 55.73
Wt. of Ash + Tare (gm): D+T 45.71 49.38 47.98Percent Ash: (D-T/B-T)x100 = E 98.16 98.97 98.95
Organic Content (%): 1.84 1.03 1.05
** Note: Test performed by heating the sample to 440 degrees Centigrade until constant weight of ash is attained.
60232272 ORGANIC THREE.xls 7/23/2013

CELRC-TS-DG 18 March 2013 MEMORANDUM FOR RECORD SUBJECT: Calumet DMMP, Use of Harbor Soils for Tollway Fill Introduction 1. Calumet Harbor and River require regular dredging to allow for shipping to continue up the
river. Normally, this dredged material is placed in Confined Disposal Facilities (CDF). The current CDF is nearing capacity, so the Calumet Dredged Material Management Plan (DMMP) is investigating alternatives to CDF disposal by reducing the amount of dredged material that needs to be placed in a CDF.
Purpose 2. One possibility for reducing the amount of sediment entering a CDF is instead using the
dredged material from Calumet Harbor as fill for the Illinois Tollway Authority’s proposed I-294/I-57 interchange. This site would not use the sediment from the river, as it is usually more organic and may contain contaminants.
3. This Memorandum is intended to compare the materials in the Calumet Harbor using
existing data from the CDF and harbor with the Illinois Tollway’s specifications for embankment fill to see if this use is feasible. This Memorandum only assesses the physical properties, not the chemical properties of the soils.
Tollway Material Requirements
4. The tollway has two types of embankment materials used for different areas of construction.
a. Zone ‘A’ – Used as structural embankment to support the roadbed.
b. Zone ‘B’ – Used to complete slopes between the foreslopes of Zone ‘A’ and the neat line slopes of the completed embankment section. Also used for infield areas at interchanges and where embankment is required to improve drainage.
5. Zone ‘A’ material must be free of organics that can decay. Large stones are not allowed in
areas where piles are to be driven. The maximum dry density (γd(max)) must be at least 98 pcf. For clay materials, Zone ‘A’ must be placed within the range of -3 and +2 percent of the optimum moisture content, while cohesionless materials only need to maintain a moisture content that allows for lubrication and permit proper placement. Compaction of the Zone ‘A’ materials must be at least 95% of the γd(max).

6. Zone ‘B’ has less stringent requirements. The material can have organics, but cannot contain large stumps, roots, or chemicals that inhibit the growth of vegetation. Zone ‘B’ material does not have a minimum γd(max). This material can be placed at any moisture content, although it should be dry enough so that earthwork can be completed. Compaction of the Zone ‘B’ materials must be at least 80% of the γd(max).
CDF and Harbor Material Properties
7. Several iterations of testing have been completed at the CDF, as well as, in the harbor. A
summary of these tests are in the table below.
Company Date Source Tests
Kemron 2005 CDF Particle size, Bulk density, Dry density, Moisture content, Specific gravity, Porosity
CDM 2006 CDF Atterberg limits, Friction angle, Cohesion, Specific gravity, Moisture content, Dry density
TestAmerica 2011 Harbor Particle size, Moisture content
Table 1. Summary of laboratory tests in CDF and Harbor 8. All the samples above were either classified based on an Atterberg Limit test or by particle
size (sieve and hydrometer) test. All but 3 of the 39 samples contain at least 50% fine-grained materials including silt and clay by weight. Results of the available particle size tests are shown in the figure below.
Average amount of fine-grained material by weight, Overall
Average amount of fine-grained material by weight, CDF
Average amount of fine-grained material by weight, Harbor
70.3% 65.0% 74.3% Table 2. Comparison of grain sizes between CDF and Harbor
9. All 28 samples tested for particle size completely passed through at least the ¾-inch sieve,
meaning the largest grain was less than ¾-inch in diameter in samples tested from the CDF and harbor.
10. A total of 24 samples were tested for in situ dry density, all from the CDF. The graph below shows the relationship of moisture content and dry density.
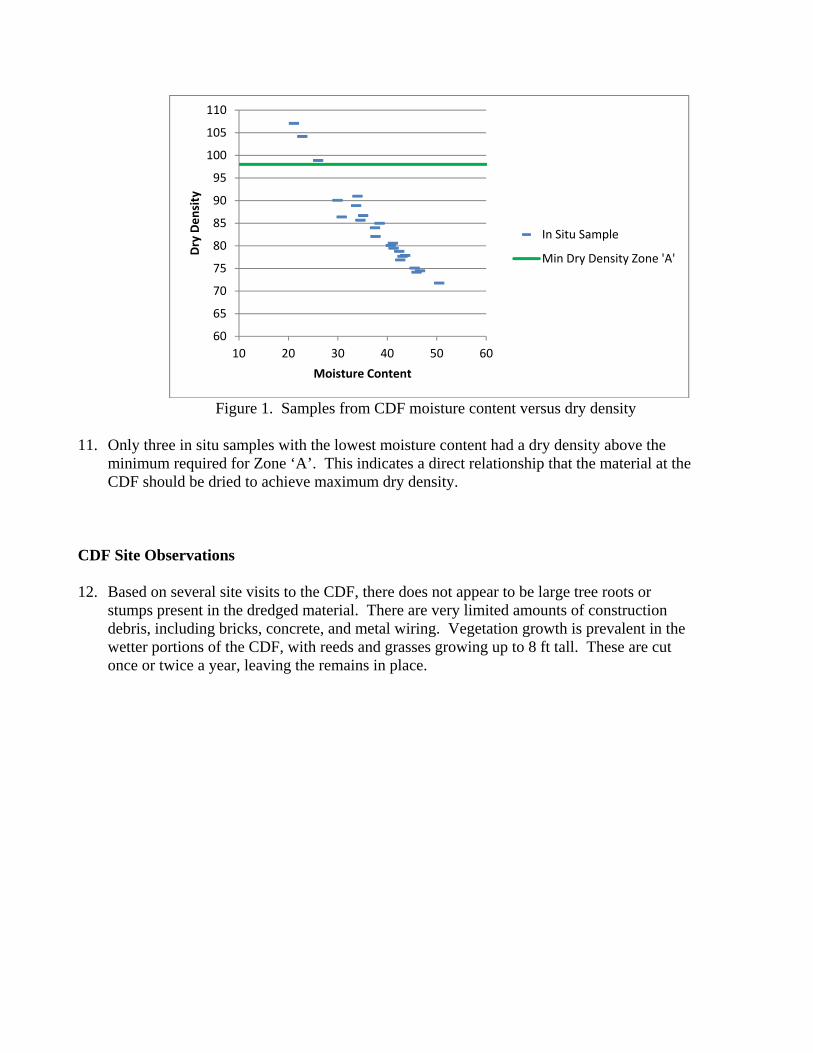
Figure 1. Samples from CDF moisture content versus dry density
11. Only three in situ samples with the lowest moisture content had a dry density above the
minimum required for Zone ‘A’. This indicates a direct relationship that the material at the CDF should be dried to achieve maximum dry density.
CDF Site Observations 12. Based on several site visits to the CDF, there does not appear to be large tree roots or
stumps present in the dredged material. There are very limited amounts of construction debris, including bricks, concrete, and metal wiring. Vegetation growth is prevalent in the wetter portions of the CDF, with reeds and grasses growing up to 8 ft tall. These are cut once or twice a year, leaving the remains in place.
60
65
70
75
80
85
90
95
100
105
110
10 20 30 40 50 60
Dry Density
Moisture Content
In Situ Sample
Min Dry Density Zone 'A'
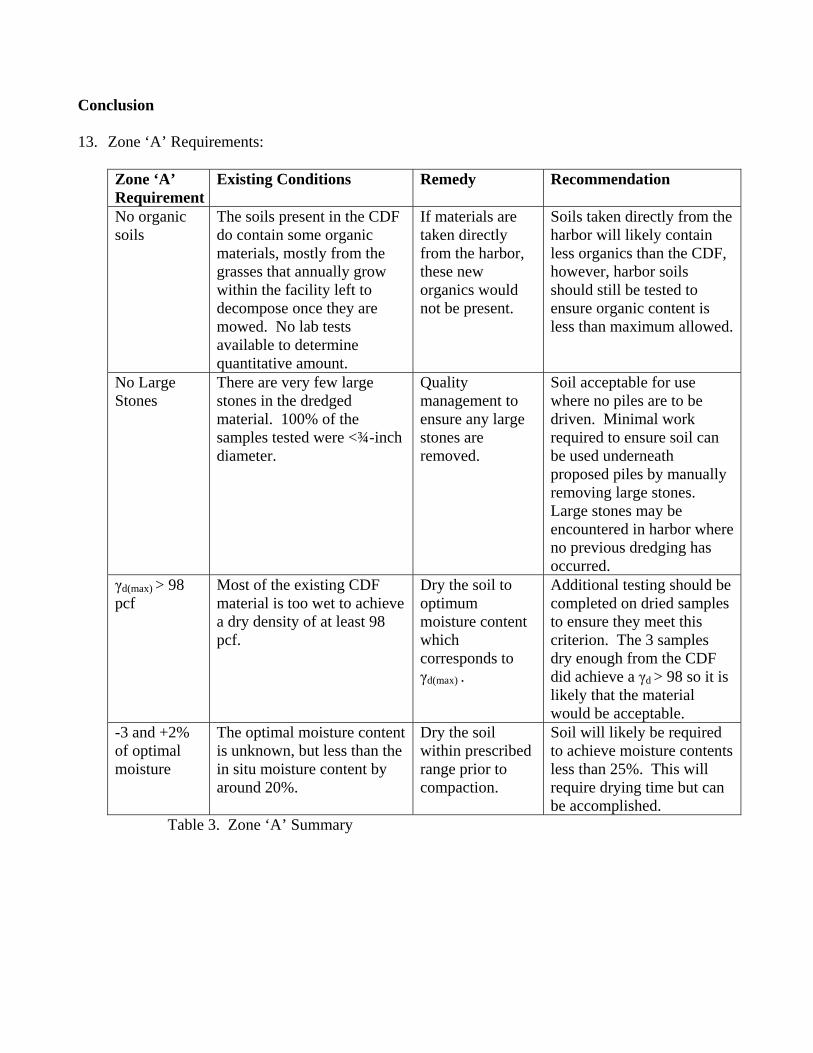
Conclusion 13. Zone ‘A’ Requirements:
Zone ‘A’ Requirement
Existing Conditions Remedy Recommendation
No organic soils
The soils present in the CDF do contain some organic materials, mostly from the grasses that annually grow within the facility left to decompose once they are mowed. No lab tests available to determine quantitative amount.
If materials are taken directly from the harbor, these new organics would not be present.
Soils taken directly from the harbor will likely contain less organics than the CDF, however, harbor soils should still be tested to ensure organic content is less than maximum allowed.
No Large Stones
There are very few large stones in the dredged material. 100% of the samples tested were <¾-inch diameter.
Quality management to ensure any large stones are removed.
Soil acceptable for use where no piles are to be driven. Minimal work required to ensure soil can be used underneath proposed piles by manually removing large stones. Large stones may be encountered in harbor where no previous dredging has occurred.
γd(max) > 98 pcf
Most of the existing CDF material is too wet to achieve a dry density of at least 98 pcf.
Dry the soil to optimum moisture content which corresponds to γd(max) .
Additional testing should be completed on dried samples to ensure they meet this criterion. The 3 samples dry enough from the CDF did achieve a γd > 98 so it is likely that the material would be acceptable.
-3 and +2% of optimal moisture
The optimal moisture content is unknown, but less than the in situ moisture content by around 20%.
Dry the soil within prescribed range prior to compaction.
Soil will likely be required to achieve moisture contents less than 25%. This will require drying time but can be accomplished.
Table 3. Zone ‘A’ Summary

14. Zone ‘B’ Requirements:
Zone ‘B’ Requirement
Existing Conditions Remedy Recommendation
No large stumps or roots
No large organic materials are present, only small, non-woody organics.
None Acceptable
Material constructible
Material saturated and may be too wet to work with.
Material should be staged in a drying area and dewatered to an acceptable moisture content determined by the Tollway.
If material can be dried so that traditional earth-moving equipment can place it, the harbor material would be acceptable.
Table 4. Zone ‘B’ Summary
15. Generally, the composition of the dredged materials appears to have the potential for use as
Illinois Tollway backfill. Additional laboratory tests will be required to affirm the maximum dry density is at least 98 pcf and that the organic content is below the allowable amount. The maximum dry density tests will also determine the optimal moisture content. The additional laboratory data should test samples based on location inside the harbor, as well as, depth beneath the lake bottom.
16. In order to be acceptable for use as Zone ‘A’ and Zone ‘B’ fill, the dredged materials must be dried to achieve the required moisture content and dry density. Since almost all of the available samples were mostly fine-grained, drying the materials will require a few days to several weeks, depending on the time of year. Therefore, a staging area will be necessary where the dredged material can be spread out to dry via evaporation and permeation. Drying can be accelerated by placing the dredged material in a thin layer and mixing the material via discing.
17. It should be noted that this Memorandum does not take into account chemical composition
of the dredged materials.
Daniel J. Ferris, PE TS-DG
Attachments: Conglomerated Soil Laboratory Results

Soil Source
Date Sampled Taken By: Sample ID Classification
Moisture Content as Sampled (%)
Dry Density as Sampled (pcf)
CDF Jan‐05 Kemron ‐ 76.0% fine 41.25 79.5
CDF Feb‐05 Kemron ‐ 71.4% fine 34.55 85.7
CDF Mar‐05 Kemron ‐ 79.7% fine 41.12 80.6
CDF Apr‐05 Kemron ‐ 63.6% fine 37.6 82.1
CDF May‐05 Kemron ‐ 68.1% fine 40.68 80.1
CDF Jun‐05 Kemron ‐ 74.9% fine 33.95 91
CDF Jul‐05 Kemron ‐ 71.4% fine 43.06 77.7
CDF Aug‐05 Kemron ‐ 47.7% fine 38.43 85
CDF Sep‐05 Kemron ‐ 55.6% fine 29.92 90.1
CDF P1 2005 Kemron ‐ 77.9% fine 50.48 71.8
CDF P2 2005 Kemron ‐ 55.9% fine 33.68 88.9
CDF P3 2005 Kemron ‐ 37.9% fine 30.76 86.4
CDF Mar‐06 CDM G01 9.5‐12' CL 45.5 75.1
CDF Mar‐06 CDM G01 9.5‐12' CL 46.6 74.5
CDF Mar‐06 CDM G01 9.5‐12' CL 37.5 84
CDF Mar‐06 CDM G02 7‐9.5' CL 42.4 78.8
CDF Mar‐06 CDM G02 7‐9.5' CL 45.9 74.2
CDF Mar‐06 CDM G02 12‐14.5' CL 42.6 76.9
CDF Mar‐06 CDM G02 12‐14.5' CL 26 98.9
CDF Mar‐06 CDM G02 12‐14.5' CL 43.6 77.9
CDF Mar‐06 CDM G02 12‐14.5' CL 22.8 104.2
CDF Mar‐06 CDM G02 12‐14.5' CL 21.1 107.1
CDF Mar‐06 CDM G02 7‐9.5' CL 35.1 86.7
Harbor Oct‐11 TestAmerica MU1‐G1 84.5% fine 48.36 ‐
Harbor Oct‐11 TestAmerica MU1‐G2 77.8% fine 46.84 ‐
Harbor Oct‐11 TestAmerica MU1‐G3 77.5% fine 44.3 ‐
Harbor Oct‐11 TestAmerica MU1‐GNU 74.2% fine 42.87 ‐
Harbor Oct‐11 TestAmerica MU1‐GNL 64.5% fine 27.68 ‐
Harbor Oct‐11 TestAmerica MU1‐GS 69.3% fine 34.48 ‐
Harbor Oct‐11 TestAmerica MU2‐G1 82.1% fine 43.96 ‐
Harbor Oct‐11 TestAmerica MU2‐G2 50.9% fine 36 ‐
Harbor Oct‐11 TestAmerica MU2‐G3 47.3% fine 34.66 ‐
Harbor Oct‐11 TestAmerica MU2‐GN 67.3% fine 49.98 ‐
Harbor Oct‐11 TestAmerica MU2‐GS 54.7% fine 32.74 ‐
Harbor Oct‐11 TestAmerica MU3‐G1 77.6% fine 44.2 ‐
Harbor Oct‐11 TestAmerica MU3‐G2 93.8% fine 45.07 ‐
Harbor Oct‐11 TestAmerica MU3‐G3 96.0% fine 45.79 ‐
Harbor Oct‐11 TestAmerica MU3‐GN 78.6% fine 45.36 ‐
Harbor Oct‐11 TestAmerica MU3‐GS 92.9% fine 44.3 ‐
Subsurface Investigation Report
Ridgeland Calumet DMMP
Investigation W912P6-14-D-0002
Submitted to:
Mr. Daniel J. Ferris
Department of the Army
Chicago District, U.S. Army Corp of Engineers
231 South LaSalle Street, Suite 1500
Chicago, IL 60604
Submitted by:
GEI Consultants, Inc.
115 Lake Street
Libertyville, Illinois 60048
(847) 984-3401
August 29, 2014
Project No. 1406570
Jamie S. Matus, CPG
Senior Consultant
Geotechnical
Environmental and
Water Resources
Engineering
Subsurface Investigation Report Ridgeland Calumet DMMP Investigation W912P6-14-D-0002 August 29, 2014
GEI Consultants, Inc. i
Table of Contents
1. Authorization and Project Background 1
2. Project Location and Site Conditions 2
3. Scope of Work 3
4. Subsurface Exploration Procedures 4
4.1 Drilling Procedures 4 4.2 Boring Locations 4
4.3 Boring Log Procedures 5
4.4 Laboratory Testing Procedures 5
5. Subsurface Conditions 7
5.1 Overburden Characteristics 7 5.1.1 Pavement and Pavement Subgrade 7
5.1.2 Fill Material 7 5.1.3 Native Soils 9
5.2 Rock Characteristics 10 5.3 Groundwater Conditions 11
6. Soil and Rock Properties 12
6.1 Laboratory Testing Results 12 6.1.1 Visual Classification 12
6.1.2 Moisture Content 12 6.1.3 Atterberg Limits 12
6.1.4 Grain Size Analysis 12 6.1.5 Soil Dry Density 13 6.1.6 Consolidated Undrained Triaxial 13 6.1.7 Unconsolidated Undrained Triaxial 13 6.1.8 Falling Head Permeability 14
6.1.9 Rock Uniaxial Compressive Strength 15
7. Limitations 16
8. References 17
Subsurface Investigation Report Ridgeland Calumet DMMP Investigation W912P6-14-D-0002 August 29, 2014
GEI Consultants, Inc. ii
Appendices
A. Figures
Figure 1 – Site Location Diagram
Figure 2 – Boring Location and Cross-Section Location Diagram
Figure 3 – Profile at Cross Section A-A’
Figure 4 – Profile at Cross Section B-B’
B. Photographic Log
C. Boring Logs
D. Laboratory Test Results
E. Environmental Addendum to the Subsurface Report
Subsurface Investigation Report Ridgeland Calumet DMMP Investigation W912P6-14-D-0002 August 29, 2014
GEI Consultants, Inc. 1
1. Authorization and Project Background
This report summarizes the results of the Ridgeland Calumet DMMP Investigation, outlined
in the revised Scope of Work dated April 15, 2014 and prepared by the US Army Corps of
Engineers (USACE), Chicago District. GEI Consultants, Inc. (GEI) was contracted by Strata
Earth Services (Strata) to provide field oversight and logging of soil borings, provide
geotechnical engineering services and prepare this summary report. Strata holds IDIQ
contract No. W912P6-14-D-0002 with the USACE Chicago and Detroit Districts to provide
geotechnical services. A proposal for the proposed task order was prepared by Strata on May
2, 2014, and included a Quality Control Plan.
The Calumet Dredged Materials Management Plan (DMMP) is a study to determine
alternative sites to dispose dredged materials from the Calumet River and Harbor, as the
current Confined Disposal Facility (CDF) is reaching capacity. After vetting through
multiple sites, a site along the Cal-Sag Channel in Alsip, IL was determined to be a possible
option.
The site consists of the Metropolitan Water Reclamation District’s (MWRD) former drying
beds. The drying beds are constructed with a sloped asphalt surface to allow for surface
drainage into a pipe along the south side of the site. The site is accessible via Ridgeland
Avenue from the west, through MWRD’s gates. The north and east side of the sites are
bordered by a drainage ditch, while the south side has an asphalt access road and then a steep
drop-off into the Cal-Sag Channel. The USACE is considering construction of a new CDF,
which would be constructed out of either sheet pile wall or T-wall around the perimeter. The
wall would be about 10 to 20 feet tall to allow for interior disposal of dredged material.
Several chambers would be constructed. The material would be offloaded from barges on
the Cal-Sag Channel from proposed crane pads between the channel and proposed CDF.
Field investigation is needed to support the design of the new CDF.
The geotechnical investigation portion of the project included drilling and sampling twenty
one (21) soil borings to depths ranging from 20 to 70 feet for a total of 810 linear feet. The
drilling and sampling included 770 feet of soil sampling and 40 feet of rock coring. The
borings are located along the Cal-Sag Channel in Alsip, IL at the Metropolitan Water
Reclamation District, off Ridgeland Avenue.
An additional 30 feet is to be sampled per Addendum 1, which adds environmental work to
the investigation. The environmental work will be summarized and provided as an
addendum to this report.

Subsurface Investigation Report Ridgeland Calumet DMMP Investigation W912P6-14-D-0002 August 29, 2014
GEI Consultants, Inc. 2
2. Project Location and Site Conditions
The project site is located along the north side of the Cal-Sag Channel in Alsip, Illinois.
Figure 1 in Appendix A illustrates the site location. The site is located between the Cal-Sag
Channel to the south, interstate highway 294 (I-294) to the north, and Ridgeland Avenue on
the west. Access to the site is from the west off of Ridgeland Avenue. The site consists of
the Metropolitan Water Reclamation District’s (MWRD) former drying beds.
The north and east sides of the site are bordered by a drainage ditch, while the south side has
an asphalt access road and then a steep drop-off into the Cal-Sag Channel.
Coordinates for the proposed boring locations were provided to Strata/GEI by the USACE in
the April 15, 2014 (revised) Scope of Work. A total of 21 soil borings were proposed, and a
map was provided in the Scope of Work. Boring locations were located and marked in the
field by HBK Engineering. HBK also determined the final coordinates and elevation of each
boring location. The elevation (NAVD 88) and coordinates of each boring are noted on
Figure 2 in Appendix A and on the soil boring logs in Appendix C. Figure 2 in Appendix A
illustrates the overall location of the site and the location of the proposed borings.
Strata cleared underground public utilities by contacting JULIE and coordinating with onsite
personnel for additional utility clearance.
Surficial geology of the area surrounding the site was mapped by Bretz (1939) to contain a
combination of glacial river bottom (chiefly erosional, with some residual gravel) peat and
muck deposits, and “made land” (artificial fills, spoil banks, dumps, etc.). While this
mapping was completed in the early 1930s, it was conducted before major development in
the area, and represents somewhat “original” conditions. Data from soil borings conducted
during this investigation roughly match the soil types describe by Bretz. The fill material
used in construction of the roadway and MWRD drying bed consists of asphalt pavement,
crushed stone fill, and a minimum of 2 feet of cohesive material, all underlain by various fill
and natural soils. The bedrock beneath the overburden is Silurian-aged dolomite of the
Racine Formation.

Subsurface Investigation Report Ridgeland Calumet DMMP Investigation W912P6-14-D-0002 August 29, 2014
GEI Consultants, Inc. 3
3. Scope of Work
Strata/GEI’s services were completed in general accordance with the Ridgeland Calumet
DMMP Investigation revised Scope of Work (USACE Contract No. W912P6-14-D-0002,
April 15, 2014). The Scope of Work included, but was not limited to, the following tasks:
Preparation of a Quality Control Plan (QCP) and Accident Prevention Plan (APP) and
submitted for review and approval by USACE.
Coordinate site access and utility clearance with USACE representatives.
Established soil boring locations as specified by USACE.
Mobilize drilling equipment and personnel to complete 21soil borings to various
depths.
Drill borings at 21 locations to recover soil and bedrock core samples for analysis and
testing. Prepare boring logs for each borehole on ENG FORM 1836 at the time of
drilling with all pertinent data included.
Visually inspect and classify the soil recovered from the boreholes for USCS soil
classification, color, water saturation, bearing strength (using a calibrated
penetrometer), and other pertinent information, and bedrock for rock type, porosity,
core recovery, RQD, hardness, fractures, condition and filling of fractures, and other
pertinent data.
Restore the drill site to “original condition” after drilling. Grout boreholes with a
cement grout following completion.
Collect soil samples from borings into sample jars for laboratory classification and
testing.
Clean, mark, box, and photograph recovered core samples.
Survey the horizontal and vertical location of boreholes following completion of
drilling. Borings will be surveyed using the North American Datum 1983 (NAD83)
Illinois State Plane East for horizontal control, and the North American Vertical
Datum 1988 (NAVD88) for the vertical coordinate system.
Prepare a stratagraphic log of subsurface conditions encountered at each of the boring
locations.
Perform laboratory testing on soil and rock samples.
Prepared a subsurface investigation report summarizing the field investigation, soil
and rock conditions, boring locations, final boring logs, and laboratory test results.

Subsurface Investigation Report Ridgeland Calumet DMMP Investigation W912P6-14-D-0002 August 29, 2014
GEI Consultants, Inc. 4
4. Subsurface Exploration Procedures
Drilling Procedures 4.1
Drilling was conducted between June 16, 2014 and July 1, 2014. Borings were advanced
using truck-mounted drilling rigs. Drilling and sampling of the overburden soil was
conducted in accordance with appropriate ASTM methods, including:
ASTM D 1586, “Standard Test Method for Standard Penetration Test (SPT) and
Split-Barrel Sampling of Soils”
ASTM D 1587, “Standard Practice for Thin-Walled Tube Sampling of Soils for
Geotechnical Purposes”
ASTM D 2113, “Standard Practice for Rock Core Drilling and Sampling of Rock for
Site Investigation”
Rock coring was performed in accordance with the requirements of ASTM D 2113,
“Standard Practice for Rock Core Drilling and Sampling of Rock for Site Investigation”.
Rock cores were drilled using a diamond core bit of NX size (54.7 mm ID).
Following drilling, each borehole was grouted using a cement grout, from the bottom of the
borehole to the ground surface.
A photographic log of the drilling and sampling operations is contained in Appendix B.
Boring Locations 4.2
The drilling location is located on the north side of the Cal-Sag Channel, east of Ridgeland
Avenue, in Alsip, Illinois. The investigation area is approximately 40.5 acres, and is
approximately 3,800 feet long (west to east) along the north side, by approximately 720 feet
wide (south to north) along the west side and approximately 400 feet wide along the east
side. Figure 1 in Appendix A illustrates the site location. Figure 2 in Appendix A indicates
the location of the borings.
All borings were drilled at the proposed and marked locations. Boring AS-14-01, however,
encountered an obstruction at a depth of 17 feet below ground surface (BGS), a void between
18.3 feet and 23.5 feet bgs, and refusal at 24 feet bgs. To obtain the required depth of 50 feet
at this location, the boring was abandoned and a new boring was offset 20 feet to the south of
the original location. This boring (AS-14-01A) was blind drilled to a depth of 17.5 feet bgs,
where sampling resumed. The boring was completed to the full depth of 51.5 feet bgs.
Subsurface Investigation Report Ridgeland Calumet DMMP Investigation W912P6-14-D-0002 August 29, 2014
GEI Consultants, Inc. 5
A summary of the boring location including coordinates and surface elevation are included in
Table 5-1 below and on the table in Figure 2 in Appendix A.
Boring Log Procedures 4.3
An experienced geologist was present during drilling to collect environmental samples,
observe and document the recovered soil and rock core, and interpret the information
obtained from the samples. Soil samples were examined and logged following ASTM D
2488, “Standard Practice for Description and Identification of Soils”, and ASTM D 5434-93,
“Standard Guide for Field Logging of Subsurface Explorations of Soil and Rock.” Soil was
examined and classified for USCS soil classification, color, water saturation, bearing strength
(using a calibrated penetrometer), and other pertinent information. Representative samples
from each sampled interval were placed into glass jars for laboratory analysis.
Rock core was examined and logged for rock type, degree of weathering, bedding thickness,
core recovery, RQD, relative hardness, fractures location and filling of fractures, and other
pertinent data. RQD was determined following ASTM D 6032-08, “Standard Testing
Method for Determining Rock Quality Designation (RQD) of Rock Core.” Logging of the
boreholes was performed in general conformance to ASTM D 5434 – Standard Guide for
Field Logging of Subsurface Explorations of Soil and Rock. The rock core was placed in
standard core boxes, cleaned, labeled, and photographed with scale for reference. Empty
spaces in the boxes were filled with foam pipe insulation to prevent movement of core.
A separate boring log was prepared for each borehole on USACE ENG FORM 1836 at the
time of drilling. Field data laboratory classification of soil was placed into formal boring
logs using the gINT program. Completed boring logs are contained in Appendix C.
Laboratory Testing Procedures 4.4
A variety of laboratory testing was performed on fill, native soil and rock samples (split
spoons, Shelby tubes and rock cores) recovered during the exploration. Samples recovered
from the soil borings were submitted to the AECOM Geotechnical Laboratory in Vernon
Hills, Illinois for testing. Results of the analyses are discussed in Section 6 of this report.
Samples collected during the field exploration were analyzed for the following in general
accordance with their respective ASTM standards, using the latest edition of the test
requirements:
Soil Classification per ASTM D2488
Moisture Content per ASTM D2216

Subsurface Investigation Report Ridgeland Calumet DMMP Investigation W912P6-14-D-0002 August 29, 2014
GEI Consultants, Inc. 6
Atterberg Limits per ASTM D4318
Grain Size per ASTM D422
Dry Density per ASTM D7263
Consolidated-Undrained Triaxial Compression per ASTM D4767
Unconsolidated-Undrained Triaxial Compression per ASTM D2850
Hydraulic Conductivity Determination per ASTM D5084
Uniaxial Compressive Strength per ASTM D7012

Subsurface Investigation Report Ridgeland Calumet DMMP Investigation W912P6-14-D-0002 August 29, 2014
GEI Consultants, Inc. 7
5. Subsurface Conditions
Subsurface conditions at the drilling locations consisted of asphalt pavement, underlain by
crushed limestone road base, followed by a layer of fill material which varied in thickness
between borings, and finally underlain by native soils. The native soils are underlain by
dolomitic limestone bedrock. The fill soils consist of granular base course, clay, silt, and
organic soils. Native soils consist of clays, silts, organic soils, sand and gravel. Observations
for each major soil unit are summarized below. Boring logs for each boring are contained in
Appendix C, and photographs of the drilling operations, soil samples, and rock core are
contained in Appendix B.
Figure 2 in Appendix A illustrates the location of two cross-section profiles. Figures 3 and 4
in Appendix A are northeast-southwest profiles across the drilled area, using data obtained
from the boring logs. Figure 3 includes borings AS-14-10, AS-14-10A, AS-14-04, AS-14-
17, AS-14-06, AS-14-09, AS-14-08, AS-14-10, AS-14-13 and AS-14-15. Figure 4 includes
borings AS-14-02, AS-14-03, AS-14-18, AS-14-05, AS-14-19, AS-14-07, AS-14-09, AS-14-
20, AS-14-11, AS-14-21, AS-14-14, AS-14-12, AS-14-13 and AS-14-16.
Overburden Characteristics 5.1
5.1.1 Pavement and Pavement Subgrade
Asphalt pavement was present at each of the 21 boring locations, at a thickness ranging from
4.25 inches to 6.75 inches. This pavement was underlain by crushed limestone sub-base fill,
which ranged in thickness between 0.5 feet and 2 feet.
5.1.2 Fill Material
Fill soils are present beneath the pavement and limestone base to a depth between 6 feet and
24 feet bgs, depending on boring location. Fill soils consist predominantly of silty clay, silt,
and organic silty clay, with some clayey topsoil, sand and gravel. The soil color is brown,
black, brownish-gray, and gray. Trace amounts of shale, roots, wood, cinders, concrete,
shells, sand and gravel were noted in various samples. The designation of fill was
determined by the field geologist and in the laboratory during inspection of the collected
samples.
A woven geotextile fabric was observed in 9 borings at the site during sampling. These
borings include:

Subsurface Investigation Report Ridgeland Calumet DMMP Investigation W912P6-14-D-0002 August 29, 2014
GEI Consultants, Inc. 8
AS-14-06 at a depth of 6.0 feet (594.4 feet elevation) – the fabric is located between
brown silty clay fill (above) and black silty clay fill (below), with an additional 12
feet of fill below the fabric.
AS-14-08 at a depth of 5.9 feet (592.7 feet elevation) – the fabric is located within
brown silty clay fill, and is underlain by approximately 4 additional feet of fill.
AS-14-09 at a depth of 5.5 feet (589.7 feet elevation) – the fabric is located between
brown silty clay fill (above) and gray silt fill below, with an additional 10 feet of fill
beneath the fabric.
AS-14-10 at a depth of 6.2 feet (593.4 feet elevation) – the fabric is located between
gray silty clay fill (above) and gray silty clay fill with black organics (below). An
additional 14 feet of fill is present beneath the fabric depth.
AS-14-12 at a depth of 6.1 feet (591.5 feet elevation) – the fabric is located between
brown silty clay fill (above) and gray silty clay fill (below), with an additional 6.5
feet of fill beneath the fabric.
AS-14-13 at a depth of 7.4 feet (587.8 feet elevation) – the fabric is located between
brown to gray silt fill (above) and native fine brown sand and gravel below.
AS-14-14 at a depth of 6.0 feet (590.9 feet elevation) – the fabric is located between
brown and gray silty clay fill (above) and black organic silty clay (below), with an
additional 5.5 feet below the fabric depth.
AS-14-15 at a depth of 7.25 feet (592.5 feet elevation) – the fabric is located within
brown to gray silty clay fill, with an approximately 16 feet of additional fill below the
fabric.
AS-14-17 at a depth of 6.0 feet (591.0 feet elevation) – the fabric is located between
brown silty clay fill (above) and brown native silt below.
While the geotextile fabric was noted during drilling of these 9 borings, it may be present
beneath the entire investigation area. Individual soil samples may have not been collected at
the same interval to intersect the fabric in the sampling device at the other boring locations.
The area within the MWRD drying beds reportedly has 2 feet of cohesive material beneath
the asphalt and crushed stone base. The soil above the geotextile fabric (average of
approximately 6.2 feet deep in the borings where it was observed) is likely this “cap” of
cohesive material. Based on observed thicknesses of asphalt and crushed stone base, this
“cap” material would be an average of 4.2 feet thick (minimum of 3.0 feet and maximum of
5.5 feet thick) where the geotextile fabric was observed.
Table 5-1 summarizes the boring ID, coordinates, elevations, depth drilled, fill thickness and
bedrock elevation.
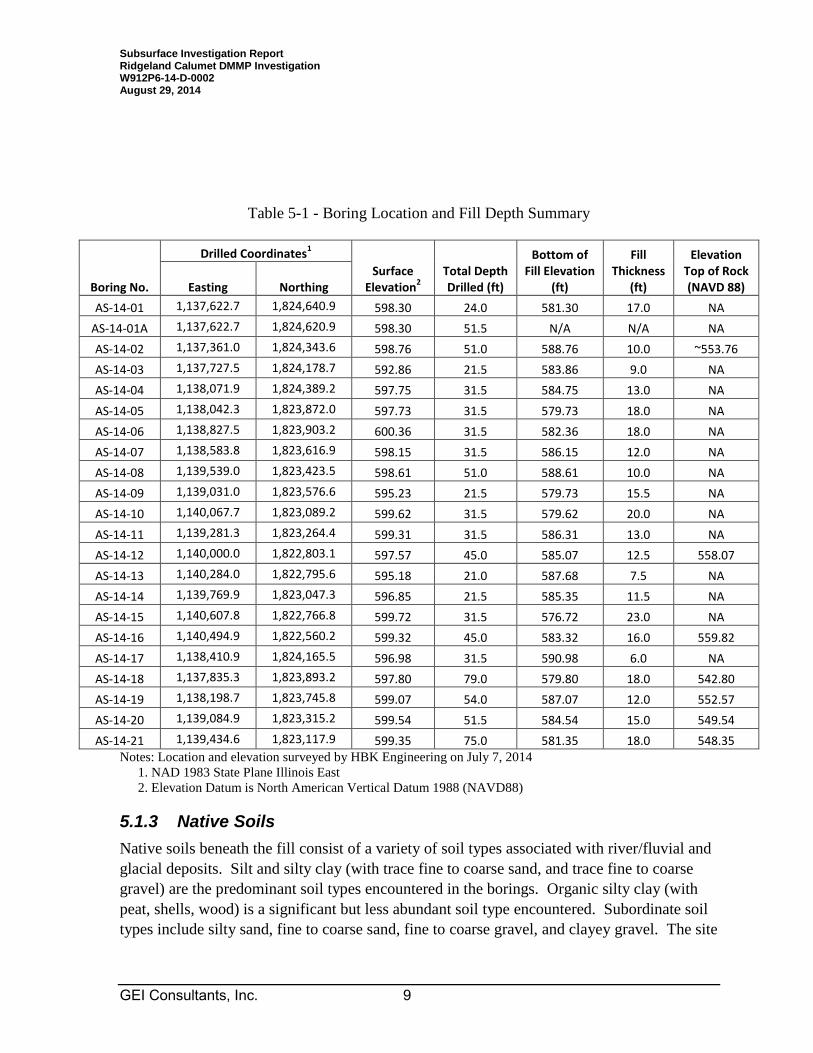
Subsurface Investigation Report Ridgeland Calumet DMMP Investigation W912P6-14-D-0002 August 29, 2014
GEI Consultants, Inc. 9
Table 5-1 - Boring Location and Fill Depth Summary
Boring No.
Drilled Coordinates1
Surface Elevation
2
Total Depth Drilled (ft)
Bottom of Fill Elevation
(ft)
Fill Thickness
(ft)
Elevation Top of Rock (NAVD 88) Easting Northing
AS-14-01 1,137,622.7 1,824,640.9 598.30 24.0 581.30 17.0 NA
AS-14-01A 1,137,622.7 1,824,620.9 598.30 51.5 N/A N/A NA
AS-14-02 1,137,361.0 1,824,343.6 598.76 51.0 588.76 10.0 ~553.76
AS-14-03 1,137,727.5 1,824,178.7 592.86 21.5 583.86 9.0 NA
AS-14-04 1,138,071.9 1,824,389.2 597.75 31.5 584.75 13.0 NA
AS-14-05 1,138,042.3 1,823,872.0 597.73 31.5 579.73 18.0 NA
AS-14-06 1,138,827.5 1,823,903.2 600.36 31.5 582.36 18.0 NA
AS-14-07 1,138,583.8 1,823,616.9 598.15 31.5 586.15 12.0 NA
AS-14-08 1,139,539.0 1,823,423.5 598.61 51.0 588.61 10.0 NA
AS-14-09 1,139,031.0 1,823,576.6 595.23 21.5 579.73 15.5 NA
AS-14-10 1,140,067.7 1,823,089.2 599.62 31.5 579.62 20.0 NA
AS-14-11 1,139,281.3 1,823,264.4 599.31 31.5 586.31 13.0 NA
AS-14-12 1,140,000.0 1,822,803.1 597.57 45.0 585.07 12.5 558.07
AS-14-13 1,140,284.0 1,822,795.6 595.18 21.0 587.68 7.5 NA
AS-14-14 1,139,769.9 1,823,047.3 596.85 21.5 585.35 11.5 NA
AS-14-15 1,140,607.8 1,822,766.8 599.72 31.5 576.72 23.0 NA
AS-14-16 1,140,494.9 1,822,560.2 599.32 45.0 583.32 16.0 559.82
AS-14-17 1,138,410.9 1,824,165.5 596.98 31.5 590.98 6.0 NA
AS-14-18 1,137,835.3 1,823,893.2 597.80 79.0 579.80 18.0 542.80
AS-14-19 1,138,198.7 1,823,745.8 599.07 54.0 587.07 12.0 552.57
AS-14-20 1,139,084.9 1,823,315.2 599.54 51.5 584.54 15.0 549.54
AS-14-21 1,139,434.6 1,823,117.9 599.35 75.0 581.35 18.0 548.35 Notes: Location and elevation surveyed by HBK Engineering on July 7, 2014
1. NAD 1983 State Plane Illinois East
2. Elevation Datum is North American Vertical Datum 1988 (NAVD88)
5.1.3 Native Soils
Native soils beneath the fill consist of a variety of soil types associated with river/fluvial and
glacial deposits. Silt and silty clay (with trace fine to coarse sand, and trace fine to coarse
gravel) are the predominant soil types encountered in the borings. Organic silty clay (with
peat, shells, wood) is a significant but less abundant soil type encountered. Subordinate soil
types include silty sand, fine to coarse sand, fine to coarse gravel, and clayey gravel. The site

Subsurface Investigation Report Ridgeland Calumet DMMP Investigation W912P6-14-D-0002 August 29, 2014
GEI Consultants, Inc. 10
stratigraphy is highly variable but in general, the natural soils encountered below the fill
typically consist of loose to medium dense silts and with periodic layers of organic silt or
clay. The organic soils have high moisture contents, typically in excess of 90 to 100% and
are more common in the boring along the Cal-Sag. Inter-bedded silts, silty clay, gravel and
sandy silts typically underlie the organic soils and upper silt deposits and extend to the
termination depth of the boring or to the top of the dolomitic limestone where encountered.
The boring logs contained in the Appendix should be referenced for detailed descriptions of
the subsurface conditions encountered at each boring. Variations in the soil profile should be
anticipated throughout the site.
Rock Characteristics 5.2
Rock coring was completed in borings AS-14-18 and AS-14-21 using a NX size core barrel.
Coring was typically commenced once relatively competent rock was encountered as
determined by the driller. Once the top of weathered, typically highly fractured rock was
encountered a split spoon sample was driven to determine if the material was weathered rock
or an extremely dense soil layer which often overlies the surface of the bedrock. Once the
top of weathered rock was confirmed, either by split spoon refusal or by observations of rock
fragments in the sampling device, the borehole was advanced using drilling fluid and rock bit
to the depth of more competent rock where rock coring was then completed.
The top of rock at Boring AS-14-18 was encountered at approximately 56.5 feet (elevation
541.3 feet). Rock coring began at a depth of 59 feet and consisted of medium hard gray to
light gray dolomitic limestone, slightly weathered to fresh and typically closely bedded.
Small diameter vugs were noted in zones with vertical fractures noted at approximately 61.5
feet. Core recovery in Run No. 1 was 100 percent with a RQD of 96%. In Run No. 2 which
ended at the bottom of the boring at 79 feet, the recovery and RQD were 89.5%.
Split spoon refusal in Boring AS-14-21 was encountered at a depth of 51 feet with solid rock
noted by the driller at approximately 54 feet (elevation 545.3 feet). Coring commenced at a
depth of 55 feet and continued to the bottom of the boring at 75 feet below existing grade.
The dolomitic limestone was similar in hardness and degree of weathering as noted in AS-
14-18 with core recovery ranging from 84 to 100% and RQD values ranging from 64% to
81%. Additional details regarding the rock material encountered are included on the
photographs of each core and on the borings logs included in Appendix B and C,
respectively.
Rock was also likely encountered in borings AS-14-02, AS-14-12, AS-14-16, AS-14-19 and
AS-14-20. The approximate top of rock elevation in all borings is shown on the cross
sections. The elevation of rock, where encountered is shown on Table 5-1.
Subsurface Investigation Report Ridgeland Calumet DMMP Investigation W912P6-14-D-0002 August 29, 2014
GEI Consultants, Inc. 11
Groundwater Conditions 5.3
Groundwater or saturated soil conditions were documented in the field by the drilling crew at
the time of the exploration. Specific depth and elevation of groundwater or saturated soil
conditions encountered at each soil boring is included on the soil boring logs in Appendix C.
Groundwater level fluctuations may occur with time and seasonal change due to variations in
precipitation, evaporation, surface water runoff and local dewatering.

Subsurface Investigation Report Ridgeland Calumet DMMP Investigation W912P6-14-D-0002 August 29, 2014
GEI Consultants, Inc. 12
6. Soil and Rock Properties
Soil and rock samples were delivered to the AECOM geotechnical laboratory in Vernon
Hills, Illinois for testing of a variety of engineering and physical properties.
Laboratory Testing Results 6.1
The laboratory testing program was developed by GEI/Strata and reviewed and approved by
USACE. The following sections contain a summary of the laboratory test results. Individual
test results can be found in Appendix D.
6.1.1 Visual Classification
All samples collected from the soil borings were visually classified following ASTM D 2488,
“Standard Practice for Description and Identification of Soils.” These laboratory
classifications have been included on the boring logs (Appendix C), and these descriptions
have superseded the field classification of the soils. A summary of the visual classification
test results is included on Table D-1 in Appendix D.
6.1.2 Moisture Content
The moisture content of all cohesive soil samples (224 samples total) collected from the soil
borings was determined following ASTM D 2216, “Standard Test Methods for Laboratory
Determination of Water (Moisture) Content of Soil and Rock by Mass.” A summary of the
moisture content test results is included on Table D-1 in Appendix D. A copy of the
laboratory report for the moisture content tests is included in Appendix D.
6.1.3 Atterberg Limits
Liquid and plastic limits were determined on five (5) samples following ASTM D 4318,
“Standard Test Methods for Liquid Limit, Plastic Limit, and Plasticity Index of Soils.” A
summary of Atterberg Limit tests in included on Table D-1 and copy of the laboratory report
for the limit testing is contained in Appendix D.
6.1.4 Grain Size Analysis
The particle size distribution was determined on twelve (12) samples, following ASTM D
422, “Standard Test Method for Particle-Size Analysis of Soils.” A summary of grain size
for each samples tested in included on Table D-1 and a copy of the laboratory reports for the
particle size testing is contained in Appendix D.

Subsurface Investigation Report Ridgeland Calumet DMMP Investigation W912P6-14-D-0002 August 29, 2014
GEI Consultants, Inc. 13
6.1.5 Soil Dry Density
Sixteen (16) soil density tests were completed following ASTM D7263. The unit weight of
soil samples tested ranged from 32.5 pcf for organic silt to 123.9 pcf on a sample of silty clay
fill. The results of all dry density tests are summarized on Table D-1 in Appendix D.
6.1.6 Consolidated Undrained Triaxial
Two consolidated-isotropically undrained (CIU) tests were performed in general accordance
with ASTM D4767. The tests were performed on three (3) separate samples, approximately
2.8-inch-diameter by 6-inch-long specimens of native silty clay trimmed from a thin-walled
Shelby tube sample. Each of the three samples were tested at three pressures. Individual test
reports are provided in Appendix D. Table 6-1 summarizes the CIU test results.
Table 6-1 – CIU Triaxial Test Results
Test No. Boring Sample Depth
(ft) USCS Description
Back
Pressure at
Saturation
(tsf)
Dry Unit
Weight at
Saturation
(pcf)
Water
Content at
Saturation
(%)
Lateral
Effective
Confining
Pressure
(tsf)
Strain
Rate
(%/min)
At Peak Shear Stress
Strain
(%)
Shear
Stress, q
(tsf)
Excess Pore
Pressure
(tsf)
Friction
Angle
(degrees)(2)
13.2 PSI
AS-14-
11 S-5 10.0-12.5 OL
Organic
SILT
5.04 46.21 96.63 5.99 0.02 5.2 0.4 0.63 33.7
17.7 PSI 5.04 47.06 94.19 6.31 0.02 9.7 0.52 0.87 33.7
26.5 PSI 5.15 45.71 98.1 7.06 0.02 10.4 0.72 1.33 33.7
8.4 PSI
AS-14-
12 S-6 12.5-15.0 CL Silty CLAY
5.04 106.9 21.65 5.64 0.02 14.63 0.34 0.20 27.1
11.2 PSI 5.09 106.7 21.72 5.85 0.02 15.28 0.43 0.22 27.1
16.5 PSI 5.04 113.6 18.19 6.25 0.02 15.09 0.65 0.44 27.1
10.3 PSI
AS-14-
21 S-7 15.0-17.5 OL
Organic
SILT and
PEAT
5.04 32.32 152.35 5.78 0.02 6.95 0.41 0.57 34.2
13.8 PSI 5.04 34.25 141.47 6.03 0.02 9.52 0.53 0.74 34.2
20.6 PSI 5.04 35.44 135.35 6.52 0.02 4.03 0.72 1.06 34.2
6.1.7 Unconsolidated Undrained Triaxial
To determine the undrained shear strength of the natural cohesive clay soils recovered in
Shelby tubes, five (5) unconsolidated-undrained (UU or Q) triaxial compression tests were
performed in general accordance with ASTM D2850. The tests were performed on
approximately 2.8-inch-diameter by 6-inch-long specimens of native silty clay trimmed from
thin-walled Shelby tube samples. The results of individual tests are included in Appendix D.
Table 6-2 summarizes the UU test results.
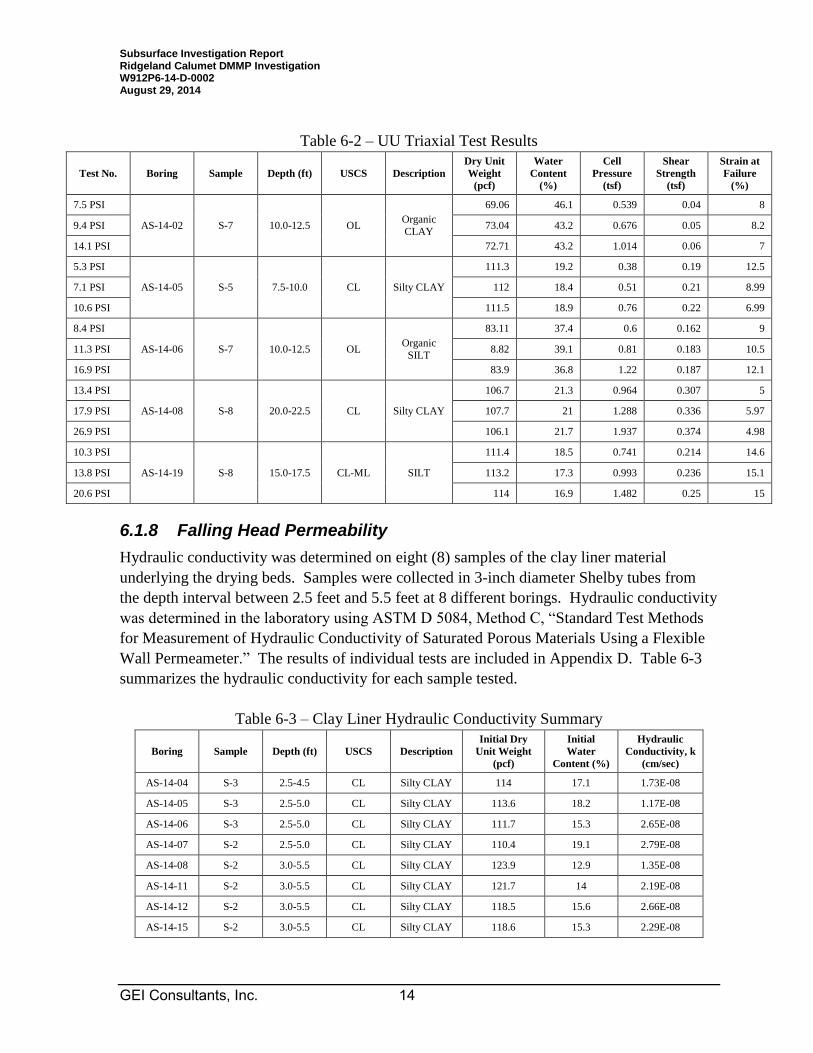
Subsurface Investigation Report Ridgeland Calumet DMMP Investigation W912P6-14-D-0002 August 29, 2014
GEI Consultants, Inc. 14
Table 6-2 – UU Triaxial Test Results
Test No. Boring Sample Depth (ft) USCS Description
Dry Unit
Weight
(pcf)
Water
Content
(%)
Cell
Pressure
(tsf)
Shear
Strength
(tsf)
Strain at
Failure
(%)
7.5 PSI
AS-14-02 S-7 10.0-12.5 OL Organic
CLAY
69.06 46.1 0.539 0.04 8
9.4 PSI 73.04 43.2 0.676 0.05 8.2
14.1 PSI 72.71 43.2 1.014 0.06 7
5.3 PSI
AS-14-05 S-5 7.5-10.0 CL Silty CLAY
111.3 19.2 0.38 0.19 12.5
7.1 PSI 112 18.4 0.51 0.21 8.99
10.6 PSI 111.5 18.9 0.76 0.22 6.99
8.4 PSI
AS-14-06 S-7 10.0-12.5 OL Organic
SILT
83.11 37.4 0.6 0.162 9
11.3 PSI 8.82 39.1 0.81 0.183 10.5
16.9 PSI 83.9 36.8 1.22 0.187 12.1
13.4 PSI
AS-14-08 S-8 20.0-22.5 CL Silty CLAY
106.7 21.3 0.964 0.307 5
17.9 PSI 107.7 21 1.288 0.336 5.97
26.9 PSI 106.1 21.7 1.937 0.374 4.98
10.3 PSI
AS-14-19 S-8 15.0-17.5 CL-ML SILT
111.4 18.5 0.741 0.214 14.6
13.8 PSI 113.2 17.3 0.993 0.236 15.1
20.6 PSI 114 16.9 1.482 0.25 15
6.1.8 Falling Head Permeability
Hydraulic conductivity was determined on eight (8) samples of the clay liner material
underlying the drying beds. Samples were collected in 3-inch diameter Shelby tubes from
the depth interval between 2.5 feet and 5.5 feet at 8 different borings. Hydraulic conductivity
was determined in the laboratory using ASTM D 5084, Method C, “Standard Test Methods
for Measurement of Hydraulic Conductivity of Saturated Porous Materials Using a Flexible
Wall Permeameter.” The results of individual tests are included in Appendix D. Table 6-3
summarizes the hydraulic conductivity for each sample tested.
Table 6-3 – Clay Liner Hydraulic Conductivity Summary
Boring Sample Depth (ft) USCS Description
Initial Dry
Unit Weight
(pcf)
Initial
Water
Content (%)
Hydraulic
Conductivity, k
(cm/sec)
AS-14-04 S-3 2.5-4.5 CL Silty CLAY 114 17.1 1.73E-08
AS-14-05 S-3 2.5-5.0 CL Silty CLAY 113.6 18.2 1.17E-08
AS-14-06 S-3 2.5-5.0 CL Silty CLAY 111.7 15.3 2.65E-08
AS-14-07 S-2 2.5-5.0 CL Silty CLAY 110.4 19.1 2.79E-08
AS-14-08 S-2 3.0-5.5 CL Silty CLAY 123.9 12.9 1.35E-08
AS-14-11 S-2 3.0-5.5 CL Silty CLAY 121.7 14 2.19E-08
AS-14-12 S-2 3.0-5.5 CL Silty CLAY 118.5 15.6 2.66E-08
AS-14-15 S-2 3.0-5.5 CL Silty CLAY 118.6 15.3 2.29E-08

Subsurface Investigation Report Ridgeland Calumet DMMP Investigation W912P6-14-D-0002 August 29, 2014
GEI Consultants, Inc. 15
6.1.9 Rock Uniaxial Compressive Strength
Three (3) representative samples of rock core were selected and tested for Uniaxial
Compressive Strength (UCS) per ASTM D 7012, Method C. Appendix D contains a copy of
the individual laboratory testing results. Table 6-4 summarizes the USC for test results.
Table 6-4 – UCS Test Results
Boring Sample Depth (ft) Description Unit Weight
(pcf)
Uniaxial
Compressive
Strength (psi)
AS-14-18 Run 1 59.6-60.0 Light Gray Dolomite 158.0 13,185
AS-14-18 Run 1 67.04-67.45 Light Gray Dolomite 168.7 18,270
AS-14-21 Run 1 57.10-57.50 Light Gray Dolomite 154.9 12,685
Subsurface Investigation Report Ridgeland Calumet DMMP Investigation W912P6-14-D-0002 August 29, 2014
GEI Consultants, Inc. 16
7. Limitations
This report has been prepared in general accordance with generally accepted geotechnical
engineering practices to aid in the evaluation of this site and to assist the owner and architect
and/or engineer in the design of this project. No other warranty, either expressed or implied,
is made. The scope is limited to the specific project and location described herein, and our
description of the project represents our understanding of the significant aspects relevant to
the geotechnical characteristics. In the event that any changes in the design or location of the
facilities as outlined in this report are planned, we should be informed, so that the changes
can be reviewed and conclusions of this report modified, as necessary, in writing by the
Geotechnical Engineer. As a check, we recommend that we be authorized to review the
project plans and specifications to confirm that recommendations contained in this report
have been interpreted in accordance with our intent. Without this review, we will not be
responsible for the misinterpretation of our data, analysis, and/or recommendations, nor how
these are incorporated into the final design.
The analysis and summary of soil sampling and laboratory test results submitted in this report
are based on data obtained from soil borings performed at locations indicated on the location
diagram and from information discussed in this report. This report does not reflect any
variations which may occur between borings. In the performance of subsurface explorations,
specific information is obtained at specific locations at specific times. However, it is a well-
known fact that variations in soil and rock conditions exist on most sites between boring
locations, and that seasonal and annual fluctuations in groundwater levels will likely occur.
The nature and extent of variations may not become evident until the course of construction.
If variations then appear evident, it will be necessary for a re-evaluation of recommendations
contained in this report after performing on-site observations during the construction period
and noting characteristics of the variations.
Subsurface Investigation Report Ridgeland Calumet DMMP Investigation W912P6-14-D-0002 August 29, 2014
GEI Consultants, Inc. 17
8. References
Bretz, J. H., 1939, Geology of the Chicago region. Part II. The Pleistocene, Map 14, Surficial
geology of the Palos Park Quadrangle

Appendices to Ridgeland Calumet DMMP Investigation Report available upon request