chi - utm.md · ghelbet a. strategic management - emerging requirement in ensuring economic...
TRANSCRIPT

Chişinău
JOURNAL OF TECHNICAL UNIVERSITY OF MOLDOVA AND MOLDAVIAN ENGINEERING ASSOCIATION
Technical and applied scientific publication founded in
9 February 1995
Typesetting and desktop publishing: Dulgheru Valeriu Cover: Podborschi V. Trifan N.
ISSN 1683-853X Published by Technical University of Moldova

2
C O N T E N T
Abstract…………………………………………………………………........ 3
Băjenescu T. M. I. State-of-the-Art of Photovoltaics……………………………………….. 13
Bostan V., Bostan I., Dulgheru V.
Energy conversion, consumption and conservation………………………..
24
Abramovich N., Dick S., Sontea V.
Speckle pattern of radiation scattered of soft biological tissues. Light fields outside tissue………………………………………………………
32
Derevianko V., Kondratieva N., Sanitskiy N., Hryshko H.
Investigation of nanomodified hemihydrate calcium sulfate hydration processes………………………………………………………
37
Mishutin V., Kroviakov S.,Zavoloka M., Bogutsky V, Stanchyk Ie.
Increasing the durability of expanded clay lightweight concretes for thin-walled hydraulic engineering structures…………………………
42
Guțu M Composite material test results and finite element analysis: its correlation.….. 46
Ciobanu N., Buțanu V., Ungureanu D., Secrieru N.
SCADA system application in wastewater treatment plants…………….
53
Bulgaru V. Quality of local goat milk depending on the season…………………….. 58
Galușca E. The formation and testing of the tribological layers sprayed in the plasma jet…………………………………………………………..
62
Țibichi V. Evaluation of rheological behaviour of a beam resting on environment with viscoelastic properties………………………………...
66
Ghelbet A. Characteristics and trends in the development of local footwear industry…………………………………………………………
70
Bulgaru V. Gutium O. The impact of season on ash content in local goat milk…………………. 75
Dântu S., Ivanov L., Galușca E.
The determination of the melting time of the particle by spraying in the plasma jet………………………………………………..
78
Malcoci Iu, Bodnariuc I. Vibroacoustical diagnosis of planetary precessional kinematical transmission………………………………………………………………
82
Bostan I., Dulgheru V. Elaboration and design of the planetary precessional transmission……... 86
Dulgheru V. Teaching creativity and inventive problem solving in science………. 92
Manolea Gh. Personalities from the meridians of the scientific universe…………... 95
The National Centre of Space Technologies……………………………….. 98
Solar energy - a safe energy source in Moldova……………………………. 99

3
Summary of articles published in the 3 issues of magazines published in 2016. MI, nr. 1
Andriuţă M. Statistical solutions in the mechanization of construction practice…………….. 11
Chiricuta I. Use of steel works slag in road structures - comparative study………………... 15
Marina V., Marina Viorica Regularities of variation of strain/stress states in polycrystalline materials with cubic lattice………………………………………………………………...
17
Vîrlan V. Methods and schemes for phosphorus remove from domestic wastewater…….. 22
Lozan A. The phenomena of the mixing process in the mixers with bars of cyclic action……………………………………………………………..
27
Nazaria A. Production of dry white wines by applying regeneration process of selected yeasts into grape must……………………………………………….
33
Bradu A., Cazacu N. Application of self-compacting concrete with fly ash………………………….. 39
Cîrlan А. Regarding the choice of soil strength parameters for assessment of foundation bearing capacity………………………………………………….
42
Chelmenciuc C. Exergetic analysis of gas processes in tunnel ovens and those with integrated cogeneration…………………………………………………….
46
Plamadeala V., Rotaru I. „Artificial bumps” – ecology or safety…………………………………………. 51
Beleuţa V. Operative calculation of the reactions, internal forces and the initial elastic displacements of the top slewing crane anchored tower………………………..
55
Ignat V. Efficient use analysis of material stocks………………………………………... 59
Mamaliga V., Odainîi D. PEST Analysis - effective method for the analysis of the national economy (example free economic zones…………………………………………………..
65
Talpa P. Stabilization soil with a mineral binder and acrylic copolymer ENVIROTAC SCTM…………………………………………………………….
69
Ghelbet A. Strategic management - emerging requirement in ensuring economic development.
72
Timotin L. General characteristics and main trends of development of entrepreneurship in the Republic of Moldova…………………………………..
84
Ciobanu M. The importance of free economic zones for attracting foreign direct investments in manufacturing industry of the Republic of Moldova……………
92
Ignat V. Economic efficiency of sunflower seeds production in the Moldova Republic… 101 Bobicev V., Maxim V., Lazu V.
Online version of Romanian Associative Dictionary…………………………… 105
Băjenescu Titu-Marius I. Petru Bogdan, founder of physical chemistry in Romania……………………… 111
Manolea Gh. Personalities from the meridians of the engineering universe: Gheorghe Lazăr………………………………………………………………….
122
MI, nr. 2
Băjenescu Titu-Marius I. Reliability aspects of MEMS and RF Microswitches…………………………… 11 Adascalitei A., Secrieru N., Todos P.
Technology enhanced electrical engineering Education in context of CRUNT TEMPUS project……………………………………………………….
18
Javgureanu V., Gordelenco P., Bors D.
Features elasto-plastic deformation and brittle fracture, electrolytic iron coatings…………………………………………………………………………..
22
Mogoreanu N. Moldovan electricity market problems: legal provisions and reality……………. 29
Guţuleac E., Zaporojan S., Gîrleanu I., Cărbune V.
Hybrid stochastic Petri nets with matrix attributes for modelling of discrete-continuous process………………………………………………………
34
Bradu A., Cazacu N. Mechanical properties of self-compacting concrete. 41
Marusic G., Marusic D., Puţuntică A.
RiverPrut - Software for determination and management of water quality……... 45
Javgureanu V., Gordelenco P., Bors D.
The elasto-plastic properties and porosity characterizations of coatings electrolytic iron…………………………………………………………………..
49
Chelmenciuc C., Musteață V., Tcaci L.
The thermody-namic benefits of the integration of cogeneration installations in bakery ovens……………………………………………………..
54

4
Kalashnikova V. Method of designing of the elite dwelling for the cohabitants
with different psychotypes………………………………………………………. 59
Bantea- Zagareanu V., Canja A.
Development of breakfast food concentrates for therapeutic nutrition…………..
65
Cazac V. The Winder Control System with Alternative Current Drive of Wire Drawing Line……………………………………………………………
68
Nicolaev P. Impedance meter with simulated resonance…………………………………….. 76
Cojuhari I., Izvoreanu I., Fiodorov I., Moraru D.
Synthesis of the control algorithm with thermal process in the oven……………
83
Bostan I., Piso I.M., Bostan V., Badea A., Secrieru N., Manciu G. V.
Prospects for cooperation of the technical university of Moldova with Romanian space agency in the field of space technologies……………………...
89
Bostan I., Piso I.M., Bostan V., Badea A., Secrieru N., Trusculescu M.,Candraman S., Margarint A.
Architecture of the ground stations - satellites communication network……….. 96
Dulgheru V. Creativity in groups: why brainstorming doesn’t work?....................................... 104
Manolea Gh. Personalities from the meridians of the engineering universe: Aurel Vlaicu…… 106
MI, nr. 3
Cerempei V. The production and use of biofuels based on mono hydroxides: technologies and technical means………………………………………………..
11
Korotun I. Chernivtsi city's architectural heritage from the years 1918 – 1940…………….. 23 Ciobanu N., Secrieru N.
Procedures and automated control algorithms of the wastewater treatment process…………………………………………………………………
28
Guţuleac E., Zaporojan S., Ţurcanu Iu., Gîrleanu I.
Analysis QoS of Ad hoc Service Oriented Computing Devices by Fuzzy Petri Nets………………………………………………………………
36
Carpov A., Tronciu S. Provincial Art Nouveau of Bessarabia…………………………………………... 46
Braniste T. The interactions between living cells and semiconductor based nanostructures……………………………………………………………..
50
Tărîţă V., Macari A., Scripcari I.
Research of some technological spheres to harness walnuts……………………. 56
Ghendov-Moşanu A., Bantea-Zagareanu V., Tatarov P.
The use of walnut (Juglans regia L.) oilcake flour for the preparation of Amaretti-style biscuits……………………………………………………………
62
Tronciu S. The theoretical model of placement of the new architectural objects in Tiraspol………………………………………………………………..
66
Pascaru S. Conceptual delimitations between Crisis management and Anticrisis management in the market economy…………………………………………….
71
Trifan N. Aspects of generating the teeth of precessional gears by plastic deformation….. 75 Vaculenco M. Generation technology of the multiple precessional gearing with
sphero-spatial moving of cylindrical tool on numerical control machine tools by 3 degrees of freedom………………………………………….
79
Bodnariuc I. The experimental research of the kinematic precessional gear qualitative basic indicators………………………………………………………
83
Dulgheru V. Creative problem solving using existing sources ……………………………….. 91
Manolea Gh. Personalities from the meridians of the scientific universe: Hermann Oberth....... 92

5
REZUMATE Titu-Marius I. Băjenescu. Starea actuală a fotovoltaicelor. Articolul trece în revistă starea actuală și tendințele de viitor ale celulelor fotovoltaice. Electricitatea solară este mai scumpă decât cea produsă cu ajutorul surselor tradiționale de energie, însă în ultimii 20 ani, problemele de cost au fost aproape rezolvate. Provocările includ demonstrația duratelor de viață lungă pentru a justifica costurile suplimentare și eficiența crescută a conversiei de putere. Mult efort de cercetare va fi necesar pentru a reduce costurile și a face electricitatea fotovoltaică competitivă cu celelalte tehnologii energetice.
Bostan V., Bostan I., Dulgheru V. Conversia, consumul și conservarea energiei. Astăzi, cea mai mare parte din energia necesară pentru consumul zilnic este produsă prin arderea combustibililor fosili - cărbune, petrol și gaze naturale. Mai multe milioane de ani, descompunerea plantelor și animalelor a dus la formarea combustibililor fosili, care practic au fost consumate în aproximativ 200 de ani. Pentru sistemele bazate pe surse de energie fosile cele mai mari pierderi au loc la producerea de energie electrică (aproximativ 66%), urmate de pierderi în rețelele electrice la transport și distribuție, precum și pierderile în dispozitive. Diversificarea surselor de energie devine un imperativ economic și ecologic. Aceste energii alternative sunt numite energie din surse regenerabile. Cele mai cunoscute surse regenerabile de energie sunt energia solară (directă, fotovoltaică și termică), eoliană (ca un derivat al energiei solare), hidraulice (folosind energia potențială și cinetică a apei), geotermală, bioenergie, etc.
Abramovich N., Dick S., Șontea V. Specl-structura de radiații împrăștiate in țesuturile biologice moi. Câmpuri optice în afara țesutului. Studiul teoretic a structurii-specl, care poate fi observată în lumina reflectată într-un țesut de piele multi-strat. Sunt discutați factorii biofizici și optici asociați cu concentrația volumică de sânge în derma și melanina epidermei, care influențează asupra contrastului imaginilor speclelor. Sunt prezentate exemple a structurelor-specl, formate de lumina împrăștiată în mod repetat în adîncimea țesuturilor, la iradierea cu fasciculul laser de diferite lungimi de undă.
Derevianko V., Kondratieva N., Sanitskiy N., Hryshko H. Studiul proceselor de hidratare a semihidratului sulfatului de calciu nanomodificat. În articol sunt prezentate rezultatele cercetărilor procesului de hidratare a ipsosului de construcție cu conținut de nanomodificatori de carbon. Interacțiunea moleculelor ipsosului natural cu o suprafață de grafen prezintă un proces chimic, care este confirmat prin
metodele analizelor cuanto-chimice. Sporirea rezistenței mecanice a compozitului de ipsos cu conținut de UNT este cauzată de accelerare procesului de cristalizare a ipsosului natural la limita cu suprafața de grafen.
Mishutin A. Kroviakov S. Zavoloka M. Bogutsky V, Stanchyk Ie. Sporirea viabilității cheramzito-betonului pentru construcții hidrotehnice cu pereți subțiri. Sunt prezentate rezultatele cercetărilor care confirmă că cheramzitobetonul modificat poate fi utilizat efectiv pentru construcția instalațiilor hidrotehnice cu pereți subțiri. Sunt prezentate compozițiile optimale ale betonului pe bază de cheramzit hidrofobizat. Aceste compoziții de beton asigură o viabilitate sporită a construcțiilor în medii cu umiditate sporită.
Guțu M. Rezultatele testelor materialelor compozite și analiza cu element finit: corelarea acestora. În prezenta lucrare sunt prezentate câteva aspecte privind metoda de simulare a testării materialelor compozite cu software-ul de analiză cu element finit. Epruvetele au fost fabricate din răşină poliesterică armată cu fibre de sticla. Pentru epruvete au fost folosite două tipuri de tesaturi: unidirecțională și bidirecțională. Epruvetele au fost încercate la tracțiune și forfecare. Proprietățile elastice determinate experimental ale materialului compozit au fost utilizate ca date de intrare. Modelarea arhitecturii compozitului probelor a fost realizată cu software-ul ANSYS compozit PrepPost.
Ciobanu N., Buțanu V., Ungureanu D., Secrieru N. Aplicarea sistemelor SCADA în stații de epurare a apelor uzate. Managementul tradițional și modalitatea de întreținere a stațiilor de epurare a apelor uzate este foarte ineficient sau imposibil, prin urmare, este avantajos să se pună în aplicare un sistem de management, care să permită să identifice starea prin achiziție de date complexe pentru a planifica și controla aceste stații în orice condiții. Această lucrare pune în discuție viziunea autorilor a arhitecturii SCADA pentru monitorizarea sistemelor de canalizare și de colectare a nămolului/distribuție și stații de epurare a apelor uzate, în conformitate cu cerințele, privind gestiunea, precum și reducerea în mod eficient a operațiunilor și costurilor de întreținere.
Bulgaru V. Calitatea laptelui de capră autohton în funcție de sezon. Calitatea laptelui de capră depinde de factori, cum ar fi rasa, numărul și stadiul de lactație, starea de sănătate, regiune, dietă, și are o influență predominantă asupra calității produselor ulterioare din lapte de capră. Obiectivul principal al

6
investigației prezente a fost de a studia efectul perioadei de lactație (sezon) și aria geografică privind compoziția laptelui de capră. Pe parcursul întregului studiu au fost colectate probe de lapte de capră, în fiecare lună din regiunea de Nord, Centru și Sud a Moldovei. În cadrul aceleiași specii și rase sezonul are o influență mare asupra compoziției laptelui. Indicii organoleptici stabiliți pentru laptele de capră au prezentat caracteristici specifice pentru lapte de capră proaspăt. Laptele colectat în prima perioadă de lactație este bogat în proteine și grăsimi. Aceste componente scad și începând cu luna iulie există o creștere lentă. Rezultatele obținute vor contribui la valorificarea tehnologică optimă a laptelui de capră.
Galușca E. Formarea și testarea straturilor tribologice pulverizate în jet de plasma. Materialele utilizate pentru instalațiile din industria alimentară necesită cerințe speciale cum ar fi rezistența sporită la uzură, coroziune etc. Pentru soluționarea unora dintre aceste probleme, în scopul de a îmbunătăți proprietățile tribologice și, de asemenea, pentru a crește fiabilitatea sistemelor prin utilizarea unor materiale mai puțin costisitoare, se propune formarea straturilor de înaltă rezistență a cuplelor de frecare. Straturile sunt formate din pulberi ce conțin următoarele componente în diferite proporții: Cr, Ni, Ti, Mn, Si, Al. Suprafețele pieselor sunt acoperite cu pulbere în jet de plasmă.
Țibichi V. Evaluarea comportării reologice a unei grinzi rezemate pe mediu cu proprietăți vâsco-elastice. Gradul de deformare al corpurilor se schimbă în timp până la atingerea echilibrului dintre forțele interne și externe. În prezenta lucrare, la descrierea comportării reologice a grinzii rezemate pe mediu deformabil, s-a folosit modelul mecanic Zener. Pentru o grindă din beton s-a efectuat un calcul care a pus în evidență timpul în care deplasările, presiunea reactivă a mediului de rezemare și momentul încovoietor din secțiunile grinzii se stabilizează.
Ghelbet A. Caracteristici și tendințe în dezvoltarea industriei autohtone de încălțăminte. Industria ușoară a Republicii Moldova reprezintă un important sector al economiei naționale. Obiectul afacerii industriei date reprezintă articolele de încălțăminte și îmbrăcăminte, precum și alte bunuri de consum. Cea mai mare parte a întreprinderilor fac parte din grupul IMM-urilor, oferă peste 20 mii locuri de muncă și realizează un excedent de produse valorificate la export. Articolul își propune să realizeze o scurtă analiză a activității și să contureze tendințele de dezvoltare a industriei ușoare în ansamblu și a industriei încălțămintei în special.
Bulgaru V. Gutium O. Impactul sezonului asupra conținutului de cenușă din laptele de capră
autohton. În cadrul aceleași specii și rase de capre perioada de lactație are o mare influență asupra conținutului total de cenușă. Laptele colectat în luna decembrie în comparație cu probele din luna august are o creștere mai mare a conținutului de cenușă. Această creștere este mai evidentă în laptele de capră colectat din zona de sud a Republicii Moldova - de la 0,78-1,44 %. Rezultatele obținute pe parcursul acestui studiu vor contribui la valorificarea tehnologică optimă a laptelui de capră.
Dântu S., Ivanov L., Galușca E. Determinarea timpului de topire a particulei la pulverizarea în jet de plasmă. Calitatea straturilor depuse prin pulverizare în jet de plasmă este determinată de următorii factori: materialul pulberilor şi suprafaţa materialului de baza, proprietăţile termofizice ale materialelor, temperatura particulelor, starea particulei la interacţiunea cu suprafaţa materialului de bază. Un element de bază ce influențează calitatea reprezintă modalitatea de dozare a particulelor în jet de plasmă şi schimbările ce se petrec. Scopul este de a determina timpul de topire a particulei.
Malcoci Iu, Bodnariuc I. Diagnostica vibroacoustică a transmisiei planetare precesionale. Un sistem dinamic ideal nu ar trebui să genereze vibrații, deoarece vibrațiile înseamnă o pierdere de energie. Vibrațiile în transmisia planetară precesională are loc în rulmenți, în angrenaje, arbori înclinaţi, piese rotative dezechilibrate, cuplaje. În cazul în care se produce o avarie, nu numai procesele dinamice se schimbă, dar, de asemenea, se modifică forțele care acționează asupra componentelor sistemului. În ceea ce privește aceste aspecte, nivelul de zgomot a fost măsurat prin utilizarea sonometrului tip 2250 Light al firmei Brüel & Kjaer care are tot ce este necesar pentru a efectua măsurări de mare precizie, clasa 1 sarcini în domeniile de aplicare de mediu, profesionale și industriale. Rezultatele obținute și măsurate au fost prezentate în diagrame și tabele care trebuie comparate cu valoarea limită din standardul german VDI-2058 pentru severitatea vibrațiilor și a nivelului de zgomot.
Bostan I., Dulgheru V. Elaborarea și proiectarea transmisiei planetare precesionale. Anumite probleme ale transmisiilor mecanice pot fi rezolvate cu efecte speciale, prin dezvoltarea de noi tipuri de transmisii bazate pe transmisii planetare precesionale cu angrenaj multiplu, care au fost dezvoltate de către autori. Multiplicitatea absolută a angrenajului precesional (până la 100% perechi de dinți aflaţi simultan în angrenare, comparativ cu 5% -7% - în angrenajele clasice) asigură creșterea capacității portante și masă și dimensiuni mici. Articolul prezintă analiza principalelor structuri ale transmisiilor precesionale, metodologia de calcul a parametrilor geometrici de bază şi de proiectare.

7
ABSTRACT Titu-Marius I. Băjenescu. State-of-the-Art of Photovoltaics. The current and future trends in photovoltaic cells and systems are reviewed in this paper. Solar electricity is more expensive than that produced by traditional sources. But over the past two decades, the cost gap has been near closing. Challenges include demonstrating long lifetimes to justify upfront costs and increasing power-conversion efficiency. More work needs to be done to reduce the cost, and thus makes photovoltaic electricity competitive with other energy technologies.
Bostan V., Bostan I., Dulgheru V. Energy conversion, consumption and conservation. Today, most of the energy needed for daily consumption is produced by burning fossil fuels - coal, oil and natural gas. Several million years, plants and animals decomposing led to the formation of fossil fuels, which, however, were consumed during about 200 years, practically. For systems based on fossil energy sources the biggest losses occur at the production of electrical energy (about 66%), followed by losses in the electrical networks at transportation and distribution, and losses in the devices. Diversification of energy sources becomes an economic and environmental imperative. These alternative energies are called renewable energy. The best known renewable energy sources are solar energy (direct, photovoltaic and thermal), wind (as a derivative of solar energy), hydraulic (using potential and kinetic energy of water), geothermal, bioenergy, etc.
Abramovich N., Dick S., Sontea V. Speckle pattern of radiation scattered of soft biological tissues. Light fields outside tissue. Speckle patterns observed by reflected light from a multi-layered skin tissue are theoretically studied. Biological and optical factors related with volume concentration of melanin in epidermis and of blood in dermis, which affect the speckle image contrast, are discussed. Examples are given of speckle patterns formed outside tissue by light multiply scattered in tissue depth under laser irradiation at various wavelengths.
Derevianko V., Kondratieva N., Sanitskiy N., Hryshko H. Investigation of nanomodified hemihydrate calcium sulfate hydration processes. This article presents the results of the investigation of gypsum hydration processes in the presence of carbon nanomodifiers. The hemihydrate calcium sulfate molecule interaction with graphene-like surface is the chemical phenomenon, which is demonstrated by the
quantum-chemical analysis methods. The CNT-containing gypsum composite strength improvement is due to the accelerated process of hemihydrate calcium sulfate crystallization at the graphene surface. Mishutin V., Kroviakov S., Zavoloka M., Bogutsky V, Stanchyk Ie. Increasing the durability of expanded clay lightweight concretes for thin-walled hydraulic engineering structures. This article reveals that modified expanded clay lightweight concrete can be effectively used for construction of thin-walled hydraulic engineering structures. Influence of the composition of lightweight concrete on its properties has been investigated. Optimal compositions of expanded clay lightweight concrete processed by the hydrophobized gravel were chosen. These compositions ensure high durability of the concrete in a humid environment.
Guțu M. Composite material test results and finite element analysis: its correlation. In this paper are presented some aspects regarding the method of simulation of composite materials testing with finite element analysis software. There were simulated tensile and shear tests of specimens manufactured from glass fiber reinforced polyester. For specimens manufacturing two types of fabrics were used: unidirectional and bidirectional. Experimentally determined elastic properties of composite material were used as input data. Modeling of composite architecture of the specimens was performed with ANSYS Composite PrepPost software.
Ciobanu N., Buțanu V., Ungureanu D., Secrieru N. SCADA system application in wastewater treatment plants. The modality traditional management and maintenance of WWTP plants is very inefficient or impossible, therefore it found advantageous to implement a management system, enabling the state to identify complex data acquisition, to plan and control these plants in any conditions. This paper discusses the vision of the authors of the SCADA architecture for monitoring the sewage and sludge collection/distribution systems and wastewater treatment plants, complying with the requirements on the leakages, and effectively reducing the operations and maintenance costs.
Bulgaru V. Quality of local goat milk depending on the season. Goat milk quality depends on factors such as breed, number and stage of lactation, health status, region, diet, and has a predominant influence on the quality of subsequent goat milk products. The main

8
objective of present investigation was to study the effect of lactation (season) and geographical area on composition and physico-chemical properties of goat milk. During the entire study the fresh goat milk samples were collected from goats in each month from North, Center and South of Moldova. Within the same species and breeds season has great influence in the milk composition. Organoleptic indices determined for the local goat milk presented characteristics specific for full goat milk. Collected milk in the first lactation period is rich in protein and fat, as these components decrease and since July there is a slow increase. The results obtained during this study will help to obtain an optimal technological valorisation of goat milk.
Galușca E. The formation and testing of the tribological layers sprayed in the plasma jet. The materials used for installations from the food industry, demand special requirements - as high resistance to wear, corrosion... To solve some of these problems, so to increase the tribological proprieties and also to increase the reliability of installations with less expensive materials, the formation of wear resistant layers in couples of friction is proposed. The layers are made from powders containing these components in different proportions: Cr, Ni, Ti, Mn, Si, Al... The surfaces of pieces are coated with powder through the plasma jet.
Țibichi V. Evaluation of rheological behavior of a beam resting on environment with viscoelastic properties. Deformation of bodies changing over time until reaching the balance between internal and external forces. In the present work, for description of the rheological behaviour of the beam resting on the deformable medium, was used the Zener mechanical model. For a concrete beam was performed a calculation revealed the time during the displacements, environment reactive pressure and the bending moment in the beam sections is stabilizing.
Ghelbet A. Characteristics and trends in the development of local footwear industry. Light industry of the Republic of Moldova is an important sector of the national economy. Articles of clothing, footwear and other consumer goods represent the object of business for this industry. Most businesses are SMEs, which offers over 20000 jobs and achieves a surplus of products valued at export. The article proposes to conduct a brief survey of the work and to outline the trends of development of light industry in general and in particular for footwear industry.
Bulgaru V. Gutium O. The impact of season on ash content in local goat milk. Within the same species
and breeds the lactation period has a great influence on the total ash content. Milk collected in December compared with samples in August has a larger increase in ash content, this increase is more evident in goat milk collected in the south of Moldova from 0.78 to 1.44%. The results obtained during this study will contribute to optimal technological processing of goat milk.
Dântu S., Ivanov L., Galușca E. The determination of the melting time of the particle by spraying in the plasma jet. The quality of the deposited layers by spraying in the plasma jet is determined by several factors: the powder material and the surface of the base material, the thermo-physical properties of the material, the temperature of the particles, the particle condition at the interaction with the surface of the base material. A basic element that influences the quality, constitutes the particles and especially the way of dosing in the plasma jet and the changes that occur. The goal is to determine the time of melting of the particle.
Malcoci Iu, Bodnariuc I. Vibroacoustical diagnosis of planetary precessional kinematical transmission. An ideal dynamical system should not generate any vibrations, because vibrations mean a loss of energy. Vibration in planetary precessional gear box occurs at bearings, gear wheels, misaligned shafts, imbalance rotating parts, couplings. If damage occurs, not only the dynamic processes change, but also the forces that act on system components. Regarding this aspects, sound level was measured by using Brüel & Kjær Sound Level Meter Type 2250 Light that has everything needed to perform high-precision, Class 1 measurement tasks in environmental, occupational and industrial application areas. Obtained and measured results was presented in diagrams and tables to be compared with German standard VDI-2058 Limit value for vibration severity and noise level.
Bostan I., Dulgheru V. Elaboration and design of the planetary precessional transmission. Some problems of mechanical transmissions can be solved with special effects by developing new types of transmissions based on planetary precessional transmissions with multiple gear, that were developed by the author. Absolute multiplicity of precessional gear (up to 100% pairs of teeth simultaneously involved in gearing, compared to 5%-7% - in classical gearings) provides increased lifting capacity and small mass and dimensions. The article presents the analysis of the main structures of precessional transmissions, the methodology of main geometrical parameters calculation and design.

9
SOMMAIRE
Titu-Marius I. Băjenescu. Etat de l’art des photovoltaïques. L’article passe en revue l’état actuel et les tendances dans le domaine des cellules photovoltaïques. L’électricité solaire est plus chère que celle produite avec les sources traditionnelles d’énergie, mais pendant les 20 dernières années, les problèmes de coût ont été presque résolus. Les défis incluent la démonstration des durées de vie longues pour justifier les coûts supplémentaires et l’efficacité plus grande de la conversion de puissance. Beaucoup d’efforts de recherche seront nécessaires afin de réduire les coûts et faire en sorte que l’électricité photovoltaïque soit compétitive avec les autres technologies énergétiques.
Bostan V., Bostan I., Dulgheru V. Conversion d'énergie, la conservation et la consommation. Aujourd'hui, la plupart de l'énergie nécessaire pour la consommation quotidienne est produit par la combustion de combustibles fossiles - le charbon, le pétrole et le gaz naturel. Plusieurs millions d'années, la décomposition des plantes et des animaux ont conduit à la formation de combustibles fossiles, qui, cependant, ont été consommés pendant environ 200 ans, pratiquement. Pour les systèmes basés sur des sources d'énergie fossiles les plus grosses pertes occure à la production d'énergie électrique (environ 66%), par des pertes dans le transport et les réseaux de distribution électrique, et les pertes dans les dispositifs. Diversification des sources d'énergie devient impératifs économiques et de l'environnement. Thes a appelé les énergies alternatives renouvelables. Le plus connu sources d'énergie renouvelable est les énergie solaire (directe, photovoltaïque et thermique), éolienne (comme un dérivé de l'énergie solaire), hydraulique (utilisant l'énergie potentielle et cinétique de l'eau), la géothermie, la bioénergie, etc.
Abramovich N., Dick S., Shontya V. Speckle rayonnement structure, dispersés tissus biologiques mous. Champs d'éclairage à l'extérieur du tissu. Une étude théorique du speckle observé dans la lumière réfléchie à partir d'un tissu multi-couches de la peau. Les facteurs biophysiques et optiques évoqués liés à la concentration du volume sanguin dans le derme et l'épiderme de la mélanine, ce qui affecte le contraste de l'image de tavelures. Des exemples du speckle formée par la lumière de façon répétée dispersés dans le tissu en vrac par irradiation d'un faisceau laser à différentes longueurs d'onde.
Derevianko V., Kondratieva N., Sanitskiy N., Hryshko H. Étude des processus d'hydratation du sulfate de calcium hémi-hydraté nanomodifié. L'article présente les résultats d'une étude des processus d'hydratation du gypse en présence des nanomodificateurs carbonés. L'interaction de la molécule de gypse bihydraté avec la surface en
graphène est un processus chimique, ce qui est confirmé par l'analyse chimique quantique. L'accroissement de la résistance du matériau composite de gypse, contenant nanotubes de carbone, est du au processus accéléré de cristallisation du gypse bihydraté près de la surface de graphène.
Mishutin A. Kroviakov S. Zavoloka M. Bogutsky V, Stanchyk Ie. Augmentation de la durabilité des bétons d’argile expansée pour les ouvrages hydrauliques à parois minces. Cet article montre que les bétons d’argile expansée modifiés peuvent être utilisés efficacement pour la construction des ouvrages hydrauliques à parois minces. L'influence de la composition du béton à agrégats légers sur ses propriétés a été étudiée. Les compositions optimales des bétons d’argile expansée à base de gravier hydrophobe ont été élaborées. Les compositions données assurent une haute durabilité du matériau dans un milieu humide.
Guţu M. Résultats des tests de matériaux composites et analyse par éléments finis: sa corrélation. Dans cet article sont présentés quelques aspects relatifs à la méthode de simulation des matériaux composites test avec logiciel d 'analyse par éléments finis. On a simulé des essais de traction et de cisaillement de spécimens fabriqués à partir de polyester renforcé de fibres de verre. Pour la fabrication des spécimens, deux types de tissus ont été utilisés: unidirectionnel et bidirectionnel. Des propriétés élastiques déterminées expérimentalement du matériau composite ont été utilisées comme données d'entrée. La modélisation de l'architecture composite des spécimens a été réalisée avec le logiciel ANSYS Composite PrepPost.
Ciobanu N., Buțanu V., Ungureanu D., Secrieru N. SCADA dans les stations de traitement des eaux usées. La modalité traditionnelle de gestion et de maintenance des stations d'épuration des eaux usées est très inefficace ou impossible, il a donc trouvé avantageux de mettre en place un système de gestion permettant à l'etat d'identifier l'acquisition de données complexes, de planifier et de contrôler ces usines dans toutes les conditions. Cet article traite de la vision des auteurs de l'architecture SCADA pour le suivi des systèmes de collecte et de distribution des eaux usées et des boues et des stations d'épuration, en respectant les exigences de décharge et en réduisant les coûts d'exploitation et d'entretien.
Bulgaru V. La qualité du lait de chèvre locale selon la saison. La qualité du lait de chèvre dépend de facteurs tels que la race, le nombre et le stade de lactation, l'état de santé, la région, le régime alimentaire, et a une influence prédominante sur la qualité du produits laitiers de chèvre. L'objectif

10
principal de la présente recherche était d'étudier l'effet de la lactation (saison) et la région géographique sur la composition chimique du lait de chèvre. Au cours de l'étude, ils ont prélevé des échantillons de lait de chèvre chaque mois du nord, centre et sud de la Moldavie. Dans la même espèce saison a une grande influence sur le lait composition. Indices sensoriels fixés pour le lait de chèvre ont des caractéristiques spécifiques du lait de chèvre frais. Le lait recueilli dans la première période de lactation est riche en protéines et en matières grasses, ces composants diminuent depuis Juillet et il y a une croissance lente. Les résultats obtenus au cours de cette étude contribueront à la transformation technologique optimale du lait de chèvre.
Galușca E. La formation et la recherche des couches tribologiques par la pulvérisation dans le jet de plasma. Les matériaux utilisés pour les installations de l'industrie alimentaire, exigent des conditions spéciales - comme une résistance élevée à l'usure, à la corrosion... Pour résoudre certains de ces problèmes, afin d'augmenter les propriétés tribologi-ques et aussi pour augmenter la fiabilité des installa-tions avec des matériaux moins coûteux, est proposée la formation de couches résistant à l'usure en couples de frottement. Les couches sont constituées de poudres contenant ces composants dans différentes proporti-ons: Cr, Ni, Ti, Mn, Si, Al ... Les surfaces des pièces sont recouvertes de poudre dans le jet de plasma.
Tibichi V. Évaluation du comportement rhéologique d'une poutre reposant sur un environnement avec les propriétés viscoélastiques. Déformation des corps changer au fil du temps jusqu'à atteindre l'équilibre entre les forces internes et externes. Dans cet article, la description du comportement rhéologique de la poutre reposant sur la moyenne déformable le modèle mécanique de Zener a été utilisé. Pour une poutre en béton, un calcul qui a mis en évidence lors des mouvements, la pression réactif d’environnement portant et le moment de flexion dans les sections de poutre se stabilise.
Ghelbet A. Caractéristiques et tendances dans le développement de l'industrie nationale de la chaussure. L'industrie textile moldave est un secteur important de l'économie nationale. Business Object de l’industrie est des chaussures, des vêtements et d'autres biens de consommation. La plupart des entreprises font partie des PME, il offre plus de 20 mille emplois et atteint un excédent de produits vendus à l'exportation. L’ article vise à procéder à une brève analyse des tendances commerciales et de déve-loppement des grandes lignes de l'industrie dans son ensemble et l'industrie de la chaussure en particulier.
Bulgaru V. Gutium O. L'impact de la saison sur cendres en local lait de chevre. Dans les mêmes espèces et races pendant la lactation a une grande
influence sur la teneur totale en cendres. Le lait collecté en Décembre par rapport aux échantillons en Août a une augmentation plus importante de la teneur en cendres, cette augmentation est plus évidente dans le lait de chèvre collectés dans le sud de la Moldavie de 0,78 à 1,44%. Les résultats obtenus au cours de cette étude contribueront à la transformation technologique optimale du lait de chèvre.
Dântu S., Ivanov L., Galușca E. Détermination de la fusion de particule par la pulvérisation dans le jet de plasma. La qualité des couches déposées par la pulvérisation dans le jet de plasma, est déterminée par plusieurs facteurs: le matériel de poudres et la surface du matériel de base, les propriétés thermo-physiques, la température des particules, la condition de particule a l'interaction avec la surface du matériel de base. Un élément important qui influencent la qualité représente les particules, et notamment, la modalité de dosage dans le jet de plasma et les changements qui se produisent. L'objectif est de déterminer le moment de la fusion de la particule.
Malcoci Iu, Bodnariuc I. Diagnostic vibroacous-tique de la transmission cinématique préces-sionnelle planétaire. Un système dynamique idéal ne doit pas générer de vibrations, car les vibrations signifient une perte d'énergie. Les vibrations dans la transmission planétaire précessionnelle se produisent dans les roulements, les roues dentées, les arbres mal alignés, les pièces en rotation déséquilibré, les accouplements. En cas de dommages, non seulement les processus dynamiques changent, mais aussi les forces qui agissent sur les composants du système. En ce qui concerne ces aspects, le niveau sonore a été mesuré à l'aide de sonomètre Brüel & Kjær Type 2250 Light qui possède tout le nécessaire pour effectuer des tâches de mesure de précision de classe 1 dans les domaines d'application environnementale, professionnelle et industrielle. Les résultats obtenus et mesurés ont été présentés dans des diagrammes et des tableaux à comparer avec la valeur limite par le standard allemande VDI-2058 pour la sévérité des vibrations et le niveau de bruit.
Bostan I., Dulgheru V. Elaboration et conception de la transmission précessionnelle planétaire. Certains problèmes de transmissions mécaniques peuvent être résolus avec des effets spéciaux en développant de nouveaux types de transmissions basées sur des transmissions planétaires précessionnelles à engrena-ges multiples, développées par l'auteurs. La multiplici-té absolue de l'engrenage de précession (jusqu'à 100% de paires de dents impliquées simultanément dans l'engrenage, comparé à 5% -7% - dans les engrenages classiques) fournit une capacité de levage accrue et de petites masses et dimensions. L'article présente l'analyse des principales structures des transmissions précessionnelles, la méthodologie de calcul des paramètres géométriques principaux et de projection.

11
РЕЗЮМЕ Бэженеску T. M. И. Текущее состояние фотоэлементов. Статья анализирует текущее состояние и будущие тенденции фотоэлементов. Солнечная электроэнергия стоит дороже, чем полученной с использованием традиционных источников энергии, но в последние 20 лет почти были решены вопросы, касающиеся затрат. Проблемы включают в себя доказательства о длительном сроке службы, чтобы оправдать дополнительные расходы и повышение эффективности преобразования энергии. Будут необходимы много исследовательских усилий чтобы сократить расходы и сделать фотоэлектрическую электроэнергию конкурентоспособной с другими энергетическими технологиями.
Бостан В., Бостан И. Dulgheru В. Преобразование, сохранение и потребление энергии. На сегодняшний день большая часть энергии необходимой для ежедневного потребления получается за счет сжигания ископаемого топлива - угля, нефти и природного газа. Несколько миллионов лет, разлагающиеся растения и животные привели к образованию ископаемых видов топлива, которые, однако, практически были израсходованы в течение примерно 200 лет. Для систем основанных на ископаемых источников энергии наибольшие потери имеют место при производстве электрической энергии (около 66%), далее следуют потери в электрических сетях при транспортировке и распределении, а также потери в устройствах. Диверсификация источников энергии станет существенным императивом экономическим и окружающей среды. Эти альтернативные энергии названы возобновляемыми источниками энергии. Наиболее известными возобновляемыми источниками энергии является солнечная энергия (прямая, фотоэлектрическая и тепловая), ветровая (как производное от солнечной энергии), гидравлическая (с использованием потенциальной и кинетической энергии воды), геотермальная, биоэнергетика и т.д.
Абрамович Н. ,Дик С., Шонтя В. Cпекл-структура излучения, рассеянного мягкими биологическими тканями. Cветовые поля вне ткани. Теоретически исследована спекл-структура, наблюдаемая в отраженном свете от многослойной ткани кожи. Обсуждены биофизические и оптические факторы, связанные с объемными концентрациями крови в дерме и меланина эпидермиса, которые влияют на контраст изображения спеклов. Приведены примеры спекл-структуры, образованной светом, многократно рассеянным в толще ткани, при облучении лазерным пучком на различных длинах волн.
Деревянко В., Кондратьева Н., Саницкий Н., Гришко А. Исследование процессов гидратации наномодифицированного полугидрата сульфата
кальция. В статье представлены результаты исследования процессов гидратации строительного гипса в присутствии углеродных наномодификато-ров. Взаимодействие молекулы двуводного гипса с графеноподобной поверхностью является химическим процессом, что подтверждается методами квантово-химического анализа. Повышение прочности гипсового композита, содержащего УНТ, обусловлено, ускоренным процессом кристаллизации двуводного гипса вблизи графеновой поверхности.
Мишутин А., Кровяков С., Заволока М., Богуцкий В., Станчик Е. Повышение долговечности керамзитобетонов для тонкостенных гидротехнических сооружений. В данной статье показано, что модифицированные керамзитобетоны могут эффективно использоваться для строительства тонкостенных гидротехнических сооружений. Изучено влияние состава легкого бетона на его свойства. Разработаны оптимальные составы керамзитобетонов на основе гидрофобизированного гравия. Данные составы обеспечивают высокую долговечность материала во влажной среде.
Гуцу M. Результаты испытаний композитный материалов и анализ методом конечных элемен-тов: их корреляция. В данной работе представлены некоторые аспекты, касающиеся способа моделиро-вания тестирования композитных материалов с помощью программного обеспечением для конечно-элементного анализа. Были смоделированы тесты на растяжение и сдвиг образцов, изготовленных из полиэстера армированного стекловолокном. Для изготовления образцов были использованы два типа тканей: однонаправленными и двунаправленными. Экспериментально определены упругие свойства композиционного материала которых были использованы в качестве входных данных. Моделирование композитной архитектуры образцов проводили с помощью программного обеспечения ANSYS Composite PrepPost.
Чобану Н,., Буцану В,. Унгуреану Д,, Секриеру Н. Применение системы SCADA на очистных сооружениях. Tрадиционное управление и техническое обслуживание систем очистки сточных вод очень неэффективно или невозможно, поэтому найдено целесообразным внедрить систему управления, что позволяет определить комплексный сбор данных, планировать и контролировать эти системы в любых условиях. В данной статье обсуждается видение авторов архитектуры SCADA для мониторинга сточных вод и систем их распределения и очистки сточных вод, с соблюдением требований по утечкам и эффективно снижая расходы на эксплуатацию и техническое обслуживание.
Булгару В. Качество местного козьего молока в зависимости от времени года. Качество козьего

12
молока зависит от таких факторов, как порода, количество и стадии лактации, состояние здоровья, региона, диеты, и имеет преимущественное влияние на последующее качество продуктов из козьего молока. Основной целью настоящего исследования явилось изучение влияния периода лактации (сезона) и географической зоны на состав козьего молока. В процессе исследования были собраны образцы козьего молока, каждый месяц с севера, центра и юга Молдовы. У тех же видах пород сезон имеет большое влияние на состав молока. Органолептические показатели, установленные для козьего молока, имели специфические черты свежего козьего молока. Молоко, полученное в первый период лактации, бо-гат белками и жирами, эти компоненты умень-шаются, а с июля происходит медленный рост. Полу-ченные результаты будут способствовать оптима-льной технологической переработки козьего молока.
Галушка Е. Формирование и тестирование трибологических поверхностей напылённых в плазменной струе. Материалы, используемые для пищевой промышленности требуют особых условий - таких, как высокая износостойкость, коррозия стойкость... Для того, чтобы решить некоторые из этих проблем, с целью повышения трибологических свойств, а также для повышения надежности систем с менее дорогих материалов, предлагается формирование слоев высокопрочных пар трения поверхностей. Слои состоят из порошков, содержащих эти компоненты в разных пропорциях: Cr, Ni, Ti, Mn, Si, Al ... Поверхности деталей покрыты порошком напыленных в плазменной струе.
Цибики В. Оценка реологического поведения балки на вязкоупругом основании. Деформация тел изменяется во времени до достижения равновесия между внутренними и внешними силами. В данной работе, для описания реологического поведения балки на деформируемом основании, была использована механическая модель Zener. Для бетонной балки был проведен расчет, при помощи которого было выявлено время стабилизации: деформаций, реакции основания и изгибающего момента в сечениях балки.
Гелбет A. Характеристики и тенденции в развитии отечественной обувной промышлен-ности. Молдавская легкая промышленность является важной отраслью народного хозяйства. Бизнес-объекты данной промышленности являются обувь, одежда и другие потребительские товары. Большинство предприятий являются частью МСП, обеспечивают более 20000 рабочих мест и достигается избыток продукции, реализуемой на экспорт. Эта статья призвана провести краткий анализ бизнес-тенденций и наметить развитие легкой промышленности в целом и обувной промышленности, в частности.
Булгару В., Гутюм О. Влияние сезона на содержание золы в местном козьем молоке. В
рамках одного и того же вида и породы коз, период лактации оказывает большое влияние на общее содержание золы. Молоко, отобранное в декабре, по сравнению с образцами отобранные в августе имеет более увеличенное содержание золы. Это увеличение является более очевидным в молоке отобранном на юге Молдовы - от 0,78 до 1,44%. Результаты, полученные в ходе этого исследования, помогут в оптимальной технологической переработке козьего молока.
Дынту С., Иванов Л., Галушка Е. Определение времени плавления частицы при напыления в плазменной струи. Качество напыленных поверхностей определяется несколькими факторами: видов материалов, поверхность материальной основы, термо-физические свойства материалов, температуры частиц, состояние частиц при взаимодействиe с поверхностью материальной основы. Основой, что влияет на качество, являются частицы, а именно, способ дозировки в плазменной струи и изменения, которые происходят. цель состоит в том, чтобы определить время плавления частицы при напылении
Малкоч Ю., Боднарюк И. Виброакустическая диагностика планетарной прецессионной кинематической передачи. Идеальная динамическая система не должна генерировать любые вибрации, поскольку колебания означают потерю энергии. Вибрации в планетарной прецессионной передаче происходят в подшипниках, в зубчатых колесах, в наклонном валу, во вращающихся неуравновешенных частях, в муфтах. При возникновении повреждений, изменяются не только динамические процессы но и силы, которые действуют на компоненты системы. Что касается этих аспектов, уровень звука измеряли с помощью шумомера 2250 Light фирмы Brüel & Kjaer, который имеет все необходимое для выполнения высокоточных измерений в прикладных областях окружающей среды, охране труда и промышленной. Полученные и измеренные результаты были представлены в схемах и таблицах, которые были сравнены с предельными значениями из немецкого стандарта VDI-2058 для вибрации и уровня шума.
Бостан И., Дулгеру В. Разработка и проекти-рование планетарной прецессионной передачи. Некоторые проблемы механических передач могут быть решены оптимально путем разработки новых видов передач на основе планетарных прецессион-ных передач с многопарным зацеплением, разрабо-танными авторами. Абсолютная многопарность прецессионного зацепления (до 100% пар зубьев одновременно участвующих в зацеплении, по сравнению с 5% -7% - в классических) обеспечивает повышенную нагрузочную способность и малые массу и габариты. В статье представлен анализ основных структур прецессионных передач, методики расчета основных геометрических параметров и проектирования.

State of the Art of Photovoltaics 13
STATE OF THE ART OF PHOTOVOLTAICS
Titu-Marius I. BĂJENESCU, prof. Switzerland
1. INTRODUCTION
The PV effect was discovered in 1839 by Becquerel; solar cells developed rapidly only in the 1950s owing to space programs and used on satellites (crystalline Si, or c-Si, solar cells with efficiency of 6–10%). The energy crisis of the 1970s greatly stimulated research and development for PV. Solar cells based on compound semiconductors (III–V and II–VI) were first investigated in the 1960s. At the same time, polycrystalline Si (pc-Si) and thin-film solar cell technologies were developed (Fig. 2).
Current energy systems are locked into carbon-intensive energy sources, while many consumers use energy inefficiently, which create powerful inertia against change. And the political economy of implementing the policies necessary to make the transition is fraught with challenges. The reality of the marketplace will be more dynamic, uncertain and disruptive to existing business models than predicted by equilibrium economics.
Global demand for energy1 is increasing rapidly, because of population and economic growth, especially in emerging market economies. Increased energy efficiency and the use of renewable energies are important measures to tackle these challenges. The environmental imperative to reduce CO2 emissions in the energy sector coincides with a looming new investment cycle in power generation in most OECD countries. A large-scale transformation of the global energy sector is possible, although it will require significant investment [2]. By acting now, long-term costs can be reduced2.
Solar electricity is more expensive than that produced by traditional sources. But over the past two decades, the cost gap has been closing. Solar photovoltaic (SPV) technology has emerged as a useful power source of applications such as lightning, meeting the electricity needs of villages,
1 At earth’s surface average solar energy is ~4x1024 J/year; global energy consumption in 2001 was ~4x10²⁰ J/year (increasing ~2% annually). 2 Every US dollar that is not spent on investment in the energy sector before 2020 will require an additional USD 4.3 to be spent after 2020 to compensate for increased greenhouse gas emissions by building zero-carbon plants and infrastructure by 2035 [2].
hospitals, telecommunications, and houses. Now PV technology is being increasingly recognized as a part of the solution to the growing energy challenge and an essential component of future global energy production. Cost, in terms of $/W, remains the greatest barrier to further expansion of PV generated power and cost-reduction is the prime goal of the PV sector.
Although photovoltaics3 (PV) still has a small share, it is the fastest growing renewable4 technology. In September 2009, the European Commission designated photonics as one of five key enabling technologies for our future prosperity. The technology roadmap of the next generation PV and OLED (organic light emitting diodes) promises new cheap, flexible and organic membranes, which will open new markets for mobile applications. Light plastics (= OLED) and power plastics (= organic photovoltaics – OPV) will probably merge into a hybrid membrane which will make it possible to transform light into power and vice versa (Fig. 1). Imagine a smart phone being charged with the little
Figure 1. Comparison Si-PV and OPV (after [3]).
3 Photovoltaics (PV), also called solar cells, are electronic devices that convert sunlight directly into electricity. The modern form of the solar cell was invented in 1954 at Bell Telephone Laboratories. 4 Renewable power generation can help countries meet their sustainable development goals through provision of access to clean, secure, reliable and affordable energy. Renewable energy has gone mainstream, accounting for the majority of capacity additions in power generation today. Tens of GW of wind, hydropower and solar photovoltaic capacity are installed worldwide every year in a renewable energy market that is worth more than a hundred billion USD annually. Other renewable power technology markets are also emerging. Recent years have seen dramatic reductions in renewable energy technologies’ costs as a result of R&D and accelerated deployment. Yet policy-makers are often not aware of the latest cost data.

14 State of the Art of Photovoltaics
Nowadays, sensors are embedded in every smart application. While applications are increasingly becoming smarter, these tiny photonics devices can have major impacts. They are an enabler for reduced power consumption (think for instance
of light management). And lasers improve efficiency by automated inspection. Optical communication technologies such as glass fibres lead to higher bandwidth and reduce power consumption at the same time.
SOLAR ENERGY
CRYSTALLINE-Si THIN-FILM CONCENTRATING PV ORGANIC PV 3rd GENERATION SOLAR THER- MAL POWER c-Si (wfer-based a-Si (amorphous silicon) c-Si up to 100x Molecular quantum dot Parabolic troughs crystalline silicon CdTe (cadmium telluride) c-Si up to 100-1000x Polymeric thermo PV Solar power towers mc-Si (wafer-based CIS or CIGS [copper multijunction up to dye-sensi- hot carrier cells Linear Frasnel crystalline silicon) indium (gallium) diselenide] 100-1000x tized solar intermediate reflectors mc-Si ribbon or nano-crystalline silicon cell band solar cell Dish/Engine sheet micro-crystalline silicon up/down converters systems
ELECTRIC ENERGY
Figure 2. Solar technologies (after [9]).
Humans absorb more than 70% of
information through light. Light is a universal tool and often provides revolutionary solutions. Though already significant solar energy5 will become truly mainstream when it’s $/W is comparable to other energy sources; at the moment it is around 4 times too expensive.
Figure 3. The market share of solar energy in USA today [4]. A Btu (British thermal unit) is the amount of heat energy required to raise 1 pound of water by
1 degree.
Within the Kyoto Protocol the EU committed itself to a reduction of at least 20% in greenhouse gases by 2020, rising to 30% if there is an international agreement committing other developed countries to “comparable emission reductions and economically more advanced developing countries to contributing adequately according to their responsibilities and respective capabilities.”
5 The solar energy occupies a small fraction of the current energy mix – about 0.01 percent for whole world. Developed country like the United States may have a little bit higher shares (Fig. 3).
The high reliabilities associated to PV modules are indirectly reflected in the output power warranties usually provided in this industry, which are currently in the range of 25 years, and may reach 30 years in a near future. (Forty-year module lifetimes may not sound as exciting as new photovoltaic materials, but it's essential to make solar power economic). Reliability evaluation based on degradation models is commonly applied in highly reliable products as a cost effective and confident way of evaluating their reliability. This reliability, the increasing potential of electricity interruption from grid overloads, as well as the rise of electricity prices from conventional energy sources, add to the attractiveness of PV systems. About 80% of the current production uses wafer-based crystalline silicon technology6 [5]
PV modules can degrade their performance as a result of different factors such as: Degradation of packaging materials; loss of adhesion of encapsu-lants; degradation of cell/module interconnection; degradation caused by moisture intrusion; degradation of the semiconductor device [6].
The degrading reliability levels of each national grid are early warning signs of the need for a major technology shift. The negative impacts of current electric power production and declining levels of reliability will not be changed overnight; the process is complex and will involve many affected parties.
6 A major advantage of this technology is that complete production lines can be bought, installed and be up and producing within a relatively short time-frame. However, the temporary shortage in silicon feedstock and the market entry of companies offering turn-key production lines for thin-film solar cells led to a massive expansion of investments into thin-film capacities between 2005 and 2010.

15 State of the Art of Photovoltaics
There is scepticism on the reliability and reproducibility of the device performance of organic photovoltaic cell (OPVC); that is why the accurate and reproducible performance of organic electronic devices should be systematically studied and addressed [7]. Additional layer of LiF dramatically improves the reliability and reproducibility of the OPVC.
Benefits of PV
- Solar power is a renewable resource that is available everywhere in the world.
- Solar PV technologies are small and highly modular and can be rapidly installed and used virtually anywhere, unlike many other electricity generation technologies.
- Unlike conventional power plants using coal, nuclear, oil and gas; solar PV has no fuel costs and relatively low operation and maintenance (O&M) costs. PV can therefore offer a price hedge against volatile fossil fuel prices.
- PV, although variable, has a high coincidence with peak electricity demand driven by cooling in summer and year round in hot countries.
- Ambient temperature operation. - No moving parts. - High reliability over 30+ years. - No emissions, combustion or radioactive
waste. Disadvantages of PV
- Fuel source is diffuse (sunlight is a relatively low-density energy);
- High initial (installed) costs; - Unpredictable hourly or daily output; - Lack of economical efficient energy
storage. Three generations devices
PV cell technologies are usually classified into three generations, depending on the basic material used and the level of commercial maturity [7]. (i) First-generation PV systems (fully commercial) use the wafer-based crystalline silicon7 (c-Si) technology, either single crystalline (sc-Si) or multicrystalline (mc-Si). PV production is currently 90% “first-generation” solar cells that rely upon
7 The efficiency of crystalline silicon modules ranges from 14% to 19%. The highest efficiency for a PV material is usually the “laboratory” efficiency, where optimum designs are tested. PV cell efficiencies are less than this, because compromises are often required to make affordable cells. Module efficiency is somewhat lower than cell efficiency, given the losses involved in the PV module system.
expensive bulk multi-crystalline or single crystal semiconductors. Dominated by silicon wafers they are reliable and durable but expensive. First-generation solar cells dominate the market with their low costs and the best commercially available efficiency. (ii) Second-generation PV systems (early market deployment) are based on thin-film PV technologies and generally include three main families: (1) amorphous (a-Si) and micromorph silicon (a-Si/c-Si); (2) cadmium telluride (CdTe); and (3) copper indium selenide (CIS) and copper indium-gallium diselenide (CIGS). It reduces the active material cost, eventually the substrate will be the cost limit and higher efficiency will be needed to maintain the $/W cost reduction trend. Second-generation thin-film PV technologies are attractive because of their low material and manufacturing costs, but this has to be balanced by lower efficiencies than those obtained from first-generation technologies. (iii) Third-generation PV systems include technologies, such as concentrating PV (CPV) and organic PV (OPV) cells that are still under demonstration or have not yet been widely commercialized, as well as novel concepts under development. “Third generation” devices will utilise new technologies to produce high-efficiency devices. Other organic or hybrid organic / conventional (DSSC) PV technologies are at the R&D stage. They offer low efficiency, but also low cost and weight, and free-form shaping. Therefore, they could fill niche markets (e.g. mobile applications) where these features are required [8].
During many years, PV industry was based on the niche applications of powering satellites and remote locations. The tide has changed dramatically with growing recognition of the environmental impact of non-renewable energy sources and the economic volatility that comes from reliance upon oil.
Half of the cost of first-generation devices is the silicon wafer and efficiencies are limited to around 20%. Instead of using wafers, a cheaper “second-generation” of solar cells would use cheap semiconductor thin-films deposited on low-cost substrates to produce devices of similar efficiencies. As “second generation” technology reduces the active material cost, eventually the substrate will be the cost limit and higher efficiency will be needed to maintain the $/W cost reduction trend. “Third generation” devices will utilise new technologies to produce high-efficiency devices.
Tremendous advances outside the photovoltaic industry, in nanotechnologies, photonics, optical metamaterials, plasmonics and

16 State of the Art of Photovoltaics
semiconducting polymer sciences8 offer the prospect of cost competitive photovoltaics based on new science and third-generation concepts. Within the next some 20 years it is reasonable to expect that cost-reductions, a move to second generation technologies and implementation of some new technologies and third-generation concepts can lead to fully cost competitive solar energy. Cost, in terms of $/W, remains the greatest barrier to further expansion of PV generated power and cost-reduction is the prime goal of the PV sector.
Figure 4. Price/watt ($/Wp) of crystalline installed
PV in the world market 2008-2011. Wp = Watt peak. [10].
The first generation (1G) technology is based
on screen printing based device similar to that shown in figure 3. 1G silicon PV benefited greatly from its symbiosis with the IC industry which provided the materials, processing know-how, and manufacturing tools necessary to allow a rapid move to large scale production. The single crystal wafer silicon efficiencies is situated in the 18-21% range offering the potential for lower $/W. But the multi-crystalline silicon (mc-Si) currently accounts for 63% of the world market, including manufacturers with cell efficiencies around 13-14%, at overall lower $/W cost.
1G PV costs around US$ 4/W, and this is still around 4 times too expensive for truly competitive commercial production.
Second generation (2G) PV technologies are single junction devices that aim to use less material whilst maintaining the efficiencies of 1G PV. 2G solar cells use amorphous-Si (a-Si), CuIn(Ga)Se2 (CIS), CdTe/CdS) or polycrystalline-Si (p-Si) deposited on low-cost substrates such as glass
8 Poor durability and low efficiency have been key disappointments with polymer solar cells.
(Figure 4). In the last 10 years, CdTe module efficiency increased from 7 % to 11 %.
CdTe, CIS and a-Si absorb the solar spectrum much more efficiently than c-Si or mc-Si and use only 1-10 μm of active material. The new technology p-Si produces ~11% efficient devices using light-trapping schemes to increase the effective-thickness of the silicon layer.
Figure 5. Schematic diagrams of thin-film CdTe, CIGS, and a-Si thin-film PV devices (after [11]).
Compared to 1G, the 2G PV offers the
potential to slash costs, financial pay-back and energy pay-back times (the potential of thin-film PV is 16.5% for CdTe, and 18.4% for CIGS, but PV based on CdTe and CIGS has been slow to scale-up – Fig. 5). Given the impressive progress by thin-film silicon over the last few years, it seems that the potential of 2G is most likely to be realised by silicon based thin-film devices, bolstered by the development of production tools for the flat panel display sector.
The future is for third generation (3G) devices which exceed the limits of single junction devices and lead to ultra-high efficiency for the same production costs of 1G/2G PV, driving down the $/W [12]. There are four types of third-generation PV technologies: (i) Concentrating PV (CPV); (ii) Dye-sensitized solar cells (DSSC); (iii) Organic solar cells; and (iv) Novel and emerging solar cell concepts.
The progress in PV technology should be measured in $/W. Two routes can be possible to cheaper PV energy: The first is based on the pragmatic use of new technology to improve the performance or decrease the cost of current devices. The second might involve new whole device concepts. So, in recent years we have seen the emergence of dye-sensitized9 [13], and polymer based solar cells (including organic/inorganic hybrids) [14, 15] as fundamentally new types of device; there is every chance that these devices might still demonstrate step-change improvements.
9 Dye-sensitized cells still face difficult issues related to poor charge mobility and device stability.

17 State of the Art of Photovoltaics
There are different approaches to reduce the levelized costs of electricity from photovoltaics. On one hand, module costs decrease due to economies of scale, less material and energy consumption, or the use of cheap materials. On the other hand, system costs can be reduced by an increase in module efficiency, which also provides the advantage of smaller systems and less use of area. Hence, all components of a high-concentration photovoltaics (HCPV) system have to be further developed to reach highest efficiencies. Large progress can be observed, especially in the field of III–V multijunction solar cells10, where record efficiencies above 41% have been reported by different groups in 2009 [16, 17]. However, despite the high concentration levels, the solar cell still represents up to 20% of the overall costs of a HCPV system [18]. Therefore, a key element for further energy cost reduction is a highly efficient multijunction solar cell. The state-of the art approach for highly efficient photovoltaic energy conversion is marked by the Ga0:50In0:50P/ Ga0:99In0:01As/Ge structure. This photovoltaic device is today well established in space applications and recently has entered the terrestrial market [19].
The biggest losses are due to the nature of the photovoltaic effect itself, because of the large volume of infra-red light that has insufficient energy to raise an electron into the conduction band (sub-bandgap losses) and because high energy photons can only raise one electron to the conduction band and wasting excess energy by heating the solar cell (hot-electron or thermalisation losses). These fundamental losses directly lead to an efficiency limit of ~ 40% for all commonly used semiconductors and 43.9% for single junction silicon solar cells. 3G concepts aim to harness some of this wasted energy.
Emerging technologies encompass advanced thin-films11 and organic cells.
10 The biggest problem for high-efficiency multijunction and GaAs cells is the high cost of the materials. 11 Thin-film solar cells comprised successive thin layers, just 1 m to 4 m thick, of solar cells deposited onto a large, inexpensive substrate such as glass, polymer, or metal. As a consequence, they require a lot less semiconductor material to be manufactured in order to absorb the same amount of sunlight (up to 99% less material than crystalline solar cells). In addition, thin-films can be packaged into flexible and lightweight structures, which can be easily integrated into building components (Building-Integrated PV, BIPV). These are photovoltaic materials that are used to replace conventional building materials in parts of the building envelope such as the roof, skylights, or façades. The advantage of BIPV is that the initial cost can be offset by reducing the amount spent on building materials and labor that would normally be used to
Concentrator technologies (CPV) use an optical concentrator system which focuses solar radiation onto a small high-efficiency cell. CPV technology is currently being tested in pilot applications.
Novel PV concepts aim at achieving ultra-high efficiency solar cells via advanced materials and new conversion concepts and processes. They are currently the subject of basic research (wafer-based c-Si and thin-films). The levelized cost of electricity (LCOE) of utility-scale systems for both thin film and c-Si could decline to between USD 0.06 and USD 0.10/kWh by 2020. Under the International Energy Agency (IEA) scenario, the LCOE of PV systems will not reach grid parity in most countries until after 2020.
A new technique for producing nanowire meshes using the power of light could open up a range of applications including transparent solar panel coatings [22]. (Nanowires NW are being developed as a vital component for quantum computing - the smallest ever silicon nanowire is in the works).
The authors of paper [23] have developed highly efficient (12.8%) nanowire solar cells by employing a self-aligned selective emitter structure without costly optical patterning.
There are a number of novel solar cell technologies under development that rely on using quantum dots/wires, quantum wells, or super lattice technologies [24, 25]. These technologies are likely
construct the part of the building that the BIPV modules replace. These advantages make BIPV one of the fastest growing segments of the photovoltaic industry. Rather than using polysilicon, these cells use thin layers of semiconductor materials like amorphous silicon (a-Si), copper indium diselenide (CIS), copper indium gallium diselenide (CIGS), or cadmium telluride (CdTe). A thin photoactive film is deposited on a substrate, which can be either glass or a transparent film. Afterwards, the film is structured into cells. Unlike crystalline modules, thin-film modules are manufactured in a single step. Thin-film systems usually cost less to be produced than crystalline silicon systems but have substantially lower efficiency rates [20]. On average, thin-film cells convert 5%–13% of incoming sunlight into electricity, compared to 11%–20% for crystalline silicon cells. However, as thin film is relatively new, it may offer greater opportunities for technological improvement.
The silicon photovoltaic (PV) module has reached mature commercial status, capturing 86% of the global PV module market in 2011, with manufacturers offering very similarly configured, essentially interchangeable product designs. As a result of rapidly declining prices for silicon modules, the competing thin-film (TF) module market is experiencing a hiatus in manufacturing expansion. Many TF companies have curtailed expansion plans and several have actually gone bankrupt. New thin film products will struggle to gain bankability acceptance on the level of silicon products. [21]

18 State of the Art of Photovoltaics
to be used in concentrating PV technologies where they could achieve very high efficiencies by overcoming the thermodynamic limitations of conventional (crystalline) cells. However, these high-efficiency approaches are in the fundamental materials research phase. Furthermore from the market are the novel concepts, often incorporating enabling technologies such as nanotechnology, which aim to modify the active layer to better match the solar spectrum [26].
Organic-inorganic hybrid solar cells These cells are typically thin film devices
consisting out of photoactive layer(s) between two electrodes of different work functions. High work function, conductive and transparent indium tin oxide (ITO) on a flexible plastic or glass substrate is often used as anode. The photoactive light absorbing thin film consists out of a conjugated polymer as organic part and an inorganic part out of e.g. semiconducting nanocrystals (NCs). A top metal electrode (e.g. Al, LiF/Al, Ca/Al) is vacuum deposited onto the photoactive layer finally. A schematic illustration of a typical device structure is shown in Fig. 6 (a). Generally there are two different structure types for photoactive layers – the bilayer structure [(Fig. 6 (b)] and the bulk heterojunction structure [(Fig. 6 (c)].
Figure 6. Schematic illustration of typical device
structures for hybrid solar cells [27].
In hybrid solar cells, photocurrent generation is a multistep process. Briefly, when a photon is absorbed by the absorbing material, electrons are exited from the valance band (VB) to the conduction band (CB) to form excitons. The excitons diffuse to the donor/acceptor interface where charge transfer can occur leading to the dissociation of the excitons into free electrons and holes. Driven by the internal electric field, these carriers are transported through the respective donor or acceptor material domains and are finally
collected at the respective electrodes. To sum up, there are four main steps: photon absorption, exciton diffusion, charge separation as well as charge carrier transport and collection. The physics of organic/hybrid solar cells is reviewed in detail elsewhere [28, 29].
Green Photonics
‘Green photonics’ [30] is the term used to encompass the application of photonics technologies that can generate or conserve energy, cut greenhouse gas emissions, reduce pollution, or yield environmentally sustainable outputs. Green photonics covers a broad range of photonic technologies and applications: photovoltaic electricity generation, highly efficient solid-state lighting (SSL), new energy-efficient communication technologies, optical sensing for improved energy efficiency and reduced pollution, and clean manufacturing using laser processing. Green photonics will impact the product design and manufacturing PV processes employed.
Green photonics is already a key technology for improving the global balance of atmospheric carbon dioxide and will become increasingly important in the decades to come. In spite of the recent recession the overall market demand for green photonics technology is expected to achieve a 2009-2020 compound annual growth rate (CAGR) of ~20% on average [31]. Significant drivers within the sector will be solid-state lighting and solar photovoltaics, where figures of 35% and 30% respectively for the 2009-2020 CAGR are predicted. These predictions show that green photonics will be a driver for profitable growth and so further stimulate employment. Europe is leading the world in solid-state lighting and photovoltaic technologies, and their system applications.
While fossil and nuclear-fuelled electric systems have an overall energy conversion efficiency that is quite low (<30%), greener alternatives remain less cost-effective or lack technological readiness for the reliability required by such an important global infrastructure.
Green growth strategies aim to build upon the complementarities between economic and environmental policy, taking into account the full value of natural capital as a factor of production and its role in growth. Energy efficiency is probably one of the main keys to long-term environmental sustainability. Greening energy will be among the earliest drivers of greener growth. Meeting growing energy demand will mean a total investment in the sector of USD 270 trillion over the next four decades [32].

19 State of the Art of Photovoltaics
Sustainability
Sustainability can be defined as ensuring that the needs of the present are met without compromising the ability of future generations to meet theirs. Thus sustainability not only includes products that have positive impact on the environment but rather comprises three categories of impact that are essential for the wealth of the society, i.e. ecological, economic and societal impact. Photonics will contribute to sustainability by offering improved environmental, economic and societal benefits (termed eco-efficiency) in three main areas: industrial design, products and production techniques [33].
“Green” or “sustainable” buildings use key resources like energy, water, materials, and land more efficiently than buildings that are just built to code. With more natural light and better air quality, green buildings typically contribute to improved employee and student health, comfort, and productivity. On average, green buildings use 30% less energy than conventional buildings. Green buildings provide financial benefits that conventional buildings do not.
To truly become green and play a major role in society's chosen path toward global sustainable development will require a major shift in the present centralized, base-loaded, fossil fuel paradigm toward a dispersed, multi-technologic, renewable-supported system of significantly greater complexity.
Strong public policy in shaping more sustainable futures for electric power will be required as has been demonstrated by the successes of several European nations and Japan. The solution to this complex issue will require a multi-faceted technological approach supported by strong public policy incentives [34]. Renewables + increased efficiency = sustainability.
Organic Photovoltaics OPV OPV are less mature than conventional
silicon based photovoltaic materials, but offer a number of highly attractive features, not least of which is the prospect of mass production of thin-film plastic solar cells. Organic solar cells (OSCs) are regarded as low-cost and potentially environmentally benign sources of power. Reel-to-reel fabrication offers large area production and substantially lowered costs, and would transform the range of deployment options for energy generation installations. To cope with the future
energy demands of cities, huge areas of solar cells will be required, too large to be contemplated with conventional silicon-based PV. The big attraction of OPV technology is the potential for applying it directly in thin-film form to many urban surfaces, including windows and facades, without interfering with the existing functionalities of these building elements, thereby making it feasible to match accessible energy-harvesting capacity with energy consumption needs. Since more than 40% of global energy use derives from the requirements of buildings, this technology could have a dramatic impact.
The second major application for organic photovoltaics is in the mobile devices market, where the ability to integrate a thin film, flexible energy generating layer onto the device itself or serving as a portable foil, would have major implications towards becoming less dependent on the availability of electric current.
OSCs have achieved efficiencies in the research laboratory of ten percent. Great progress in this field has been driven by the development of new organic semiconductors that maximize the absorption of light and the transport of charge, transparent electrodes that do not rely on rare and toxic elements, barrier materials that reduce the rate of photochemical degradation, and substrate materials that improve mechanical robustness. One aspect of organic solar cells that has received far less attention by the research community is the production energy, toxicity, and costs associated with synthesizing organic semiconductors at the scale required to satisfy even a small fraction of the growing worldwide need for energy.
OSCs typically comprise a heterostructure of two types of semiconductors with offset frontier molecular orbitals (Fig. 7) [35]. This heterostructure is sandwiched between a low-work-function electrode (which collects the electrons) and a high-work-function electrode (which collects the holes). This sandwich-like structure sits on a thin substrate (e.g., glass or polyethylene terephthalate, PET). Most, if not all, devices must be encapsulated to exclude water and oxygen. Upon the absorption of light, an electron is promoted in either the donor or the acceptor from the highest occupied molecular orbital (HOMO) to the lowest unoccupied molecular orbital (LUMO). Transfer of an excited electron in the LUMO of the donor to the LUMO of the acceptor produces free charge carriers. These carriers drift to opposite sides of the device, in part, because of the built-in electric field established by electrodes with different values of work function. This process is the basis of the photovoltaic effect in

20 State of the Art of Photovoltaics
OPV and other “excitonic” cells, and is in contrast to the mechanism of conventional solar cells, in which charge carriers are generated directly upon the absorption of photons, and are segregated by the internal field established by a p–n junction [36].
Organic photovoltaic cells are often cited for their potential to fulfill roles in unique applications such as wearable electronics [37], portable energy sources in the developing world [38], artificial retinas [39], and power generating polarizing filters [40]. Many of these applications are specifically targeted to the consumer market rather than to utility-scale generation of power. Considering the rate at which once-state-of-the-art consumer electronic devices are rendered obsolete by new models, it may be more important to minimize environmental impact than is it to maximize the lifetime - or even performance - of some devices for some applications.
Figure 7. Schematic drawing and approximate energy levels of materials used in OSCs. (a) A transparent substrate (not drawn to scale) supports a
transparent electrode, a semiconducting layer comprising an electron donor and an electron acceptor, and a top electrode. In part (b), the energy levels of the electrodes represent the
values of work function, while the energy levels of the organic donor and acceptor represent the frontier molecular orbitals (highest occupied and lowest unoccupied molecular orbital,
HOMO and LUMO). In the “conventional” geometry represented in the figure, the work function of the transparent
electrode is higher than that of the top electrode; in the “inverted” geometry, the polarity is reversed [35].
OSCs have the potential to show high
efficiencies at low cost, as they exhibit favourable optical and charge generation properties, and are compatible with mass printing techniques. State-of-the-art record solar cells have almost reached 8% power conversion efficiency, and modules of above 200 cm2 with 3.5%. Both are based on newly synthesised organic semiconductors [41]. For applications without the need for infrastructure such as inverters, low cost organic solar cells will be easier to realise.
A future vision envisaged for organic photonics will be the full integration of three functionalities; light generation (OLED), power generation (OPV) and digital processing (plastic electronics), into a single membrane. With such technology, it becomes possible to envisage readily applied membranes that provide a self-powering intelligent lighting system suitable for deployment in buildings, outdoor locations or vehicles [42].
The report [43] reviews the reliability of PV power plants and their components. The results focus on silicon-based PV technologies, but include available data on the smaller installed base of thin-film and concentration photovoltaics (CPV) modules.
Wireless nanosensor networks (WNSN) WNSN will allow novel intelligent
nanosensors to detect new types of events of the nanoscale in a distributed fashion over extended areas. Two main characteristics are important: their THz band wireless communication and their nanoscale energy harvesting process. WNSNs consist of nanosized communicating devices, which can detect and measure new types of events at the nanoscale. These networks are the enabling technology for unique applications such as intrabody drug delivery systems or surveillance networks for chemical attack prevention. One of the major bottlenecks in WNSNs is posed by the very limited energy that can be stored in a nanosensor mote in contrast to the energy that is required by the device to communicate. Recently, novel energy harvesting mechanisms have been proposed to replenish the energy stored in nanodevices. With these mechanisms, WNSNs can overcome their energy bottleneck and even have infinite lifetime (perpetual WNSNs), provided that the energy harvesting and consumption processes are jointly designed [44].
WNSNs will have a great impact in almost every field of our society ranging from healthcare to homeland security and environmental protection. Enabling the communication among nanosensors is still an unsolved challenge. The use of novel nanomaterials to build nano-antennas, nano-transceivers and nano-processors has pointed us to the terahertz band as the natural domain of operation of nanosensor devices. This frequency range supports very high transmission bandwidths in the short range. Despite nanosensor devices and networks are still in their very early stage, ICT are a key player in the development of this new paradigm. Many researchers are currently engaged in

21 State of the Art of Photovoltaics
developing the hardware underlying future nanosensor devices [45].
In order to overcome their limitations, these nano-devices can be interconnected to execute more complex tasks in a distributed manner. The resulting nanonetworks are envisaged to expand the capabilities and applications of single nano-machines, both in terms of complexity and range of operation. Novel nanomaterials such as Carbon Nanotubes (CNTs) and Graphene Nanoribbons (GNRs) have been proposed as the building material of novel nano-antennas. Their development stems from the necessity of solutions which radiate in adequate frequencies. If we used the classical approach, antennas reduced to the nanoscale would radiate at extremely high frequencies, compromising the feasibility of the communication. The numerical results show that the electromagnetic (EM) wave propagation speed can be up to 100 times below that of speed of light in vacuum, for CNT and GNR in both edge configurations. For all this, a 1 µm long antenna radiates in the THz band (0.1 – 10 THz). Feasible input resistances are achieved with higher voltage or larger antenna dimensions [46].
Conclusions Also resuming: 1st Generation : Crystalline silicon, relatively
thick (100s μm); Higher efficiency, relatively expensive.
2nd Generation : Thin Film Technology (1 –10 μms); Flexible, low cost, lower efficiency CdTe, CIGS, a-Si, DSC.
“Next Generation”: Organic PV (OPV), plastic solar cells; Earth abundant inorganics (CZTS, pyrite) Quantum-dot (3rd Generation).
All technologies continue to grow: CdTe and Si growing fastest; other technologies getting squeezed.
Three possible future scenarios: Status quo Continued dominance by c-Si, mc-Si CdTe an important component of utility
market Others: Niche markets in consumer/aerospace Transition to new forms of crystalline
silicon Ribbon silicon Ultrathin silicon Breakthrough in thin film technology CIGS: Compete with x-Si, CdTe in power
sector
DSC: Consumer products, BIPV, selected climates
PV system prices have seen a slower decline than in the years before or even small increases, confirming that the speed of future cost reduction is likely reduced [49].
One key to the development of any photovoltaic technology is the cost reduction associated with achieving economies of scale. This has been evident with the development of crystalline silicon PVs and will presumably be true for other technologies as their production volumes increase. Worldwide production of terrestrial solar cell modules has been rapid over the last several years, with China recently taking the lead in total production volume [47].
Securing a solid future for photovoltaics requires both refining current technology to improve its cost, performance, and durability in the near future, and developing new materials for a new generation of technology.
More than 80% of the world PV industry is based on c-Si and pc-Si wafer technologies. Single-junction c-Si and GaAs solar cells are approaching their upper limits in terms of the theoretical maximum efficiency. Remarkable efficiency results have been achieved in the field of thin-film solar cells: 19–20% CIGS and 16–17% CdTe and Si polycrystalline thin-film solar cells. III–V multi-junction solar cells have obtained about 40% efficiency [48].
Perovskytes are much more cost-efficient than silicon PV-cells, don’t contribute to global warming and are more flexible and manageable. Stacking perovskytes onto a silicon cell could boost the solar system’s overall efficiency. In April 2016 the Hong Kong Polytechnic University (assembling a perovskite layer made of molybdenum trioxide, gold and molybdenum trioxide, each designed with an optimized thickness) realised the world’s highest power conversion efficiency of 25.5% with the development of perovskyte-silicon solar cells [49].
References
1. Razykov T. M. et al. Solar Photovoltaic Electricity: Current Status and Future Prospects, Solar Energy 85(2011), pp. 1580–1608. 2. OECD & IEA. Green Growth Studies; Energy, OECD Publishing, 2011. 3. Organic Solar Cells http://www.meerholz.uni-koeln.de/fileadmin/user_upload/Docs/Vorlesung/ Solar_cells_Handout. pdf

22 State of the Art of Photovoltaics
4. Chu Y. (GENI) - Review and Comparison of Different Solar Energy Technologies, www.geni.org/globalenergy/.../review-and-comparison 5. Băjenescu T.-M. Advances and Trends in Photovoltaics (PV). EEA, Vol. 61, nr. 1(2013), pp. 7-13. 6. Quintana M. A., et al. Commonly Observed Degradation in Field-aged Photovoltaic Modules. Proc. of 29th Photovoltaic Specialists Conference, 2002; pp. 1436–1439. 7. Kim M.-S. Understanding Organic Photovoltaic Cells: Electrode, Nanostructure, Reliability, and Performance. Ph. D. Thesis, University of Michigan, 2009. 8. IRENA Working Paper 2012. Renewable Energy Technologies: Cost Analysis Series, Solar Photovoltaic Technologies, pp. 4-11. 9. Bosetti V. et al. The Future Prospects of PV and CSP Solar Technology. Review of Environment, Energy and Economics, Nota di lavoro 1/2012, www.feem.it/getpage. aspx?id=4401 10. Utpal G., Sukhendu J., Sayan D. State of Art of Solar Photovoltaic Technology. Conference Papers in Energy, Vol. 2013, Article ID 764132, 9 pages, http://dx.doi.org/10.1155/2013/764132 11. Boreland M., Bagnall D. Current and Future Photo-voltaics. users.ecs.soton.ac.uk/... /photovoltaics/Boreland%20an... 12. Green M. A. (publisher). Third Generation Photovoltaics: Advanced Solar Energy Conversion. Springer, 2006. 13. Gratzel M. Nature, vol. 414(2001), p. 338. 14. Kanicki J. In Handbook of Conducting Polymers, (T. A. Skotheim, editor); Dekker, New York, 1986. 15. Brabec C. J., Sariciftci S. N. Chemical Monthly, 132(2001), p. 421. 16. Guter W., Schöne J., Philipps S. P., Steiner M., Siefer G., Wekkeli A., Welser E., Oliva E., Bett A. W., Dimroth F. Appl. Phys. Lett. 94(22), 223504 (2009) 17. King R. R., Boca A., Hong W., Larrabee D., Edmondson K. M., Law D. C., Fetzer C. M., Mesropian S., Karam N. H. In Conference Record of the 24th European Photovoltaic Solar Energy Conference and Exhibition, Hamburg, Germany, 21–25 Sep 2009, pp. 55–61 18. Lerchenmüller H., Bett A. W., Jaus J., Willeke G. In Conference Record of the 3rd International Conference on Solar Concentrators for the Generation of Electricity or Hydrogen, Scottsdale, AZ, USA, 1–5 May 2005, p. 6. 19. Simon P. Philipps, et al. Present Status in the Development of III–V Multi-Junction Solar Cells. In
A. B. Cristóbal López, et al. (eds.), Next Generation of Photovoltaics, Springer Series in Optical Sciences 165, DOI 10.1007/978-3-642-23369-2 1, Springer-Verlag, Berlin and Heidelberg, 2012. 20. Efficiency. Which Measures the Percentage of the Sun’s Energy Striking the Cell or Module, is One Important Characteristic of a Solar Cell or Module. Over Time, Average Cell Efficiencies Have Increased, European Photovoltaic Industry Association, Solar Generation 6, Solar Photovoltaic Electricity Empowering the World, 2011. 21. Electrical Power Research Institute. Review of Photovoltaic System Reliability Challenges and Opportunities. 05 Dec. 2012, Product ID: 1024002. 22. Stanford sees the light with nanowire mesh; flexible and transparent electronics on the way. http://news.techeye.net/science/stanford-sees-the-light-with-nanowire-mesh 23. Um H.-D. et al. Incorporation of a self-aligned selective emitter to realize highly efficient (12.8%) Si nanowire solar cells. Nanoscale, 6(2014), p. 5193. 24. Nozik A. et al. Multiple Exciton Generation in Colloidal Quantum Dots, Singlet Fission in Molecules Quantum Dot Arrays, Quantum Dot Solar Cells, and Effects of Solar Concentration,” Presentation to the Symposium “Third Generations and Emerging Solar Cell Technologies, April 26-29, 2011, Golden CO. 25. Raffaelle R. P. Next Generation Photovoltaics. Presentation to the Symposium “Third-Generation and Emerging Solar-Cell Technologies”, April 26-29, 2011, Golden, CO. 26. Leung Siu-fung et al. Engineered Optical Absorption of Nano/Micro-pillar Arrays for Efficient Photovoltaics. Presentation to the Symposium “Third-Generation and Emerging Solar-Cell Technologies”, April 26-29, 2011, Golden, CO. 27. Zhou Y. et al. Organic-Inorganic Hybrid Solar Cells: State of the Art, Challenges and Perspectives. www.intechopen.com 28. Greenham N. C. Hybrid Polymer/ Nanocrystal Photovoltaic Devices, in Organic Photovoltaics (eds. C. Brabec, V. Dyakonov and U. Scherf), Wiley-VCH Verlag GmbH & Co. KGaA, Weinheim, Germany, 2008. 29. Saunders B. R., Turner M. L. Nanoparticle-Polymer Photovoltaic Cells. Advances in Colloid and Interface, 2008. Science, Vol. 138, Nr. 1, pp. 1-23, ISSN 0001-8686 30. The term Green Photonics is trademarked by the OIDA. (www.oida.org)

23 State of the Art of Photovoltaics
31. http://www.businesswire.com/news/home/ 20090324006339 /en/OIDA-Proposes-Criteria-Optoelectronics-Carbon-Economy -European 32. IEA (2011a), World Energy Outlook 2011 (WEO-2011), OECD Publishing, doi: 10.1787/weo-2011-en 33. Wessler B., Tober U. Green Photonics – the Role of Photonics in Sustainable Product Design. In Proceedings- SPIE “The International Society For Optical Engineering,” 2011, 8065; 8065 15 SPIE Eco-Photonics: Sustainable Design, Manufacturing, and Engineering Workforce Education for a Green Future Conference, https://getinfo.de/app/Green-photonics-the-role-of-photonics-in-sustainable/id/BLCP% 3ACN079692009 34. Jansson Peter M., Michelfelder Richard A. Greening Electricity Infrastructures: Increasing System Complexity, Reliability and Sustainability. esd.mit.edu/symposium/pdfs/papers/jansson.pdf 35. Gregg B. A. J. Phys. Chem. B, 107(2003), 4688–4698. 36. Gregg B. A., In Organic Photovoltaics: Mechanisms, Materials, and Devices, ed. S. S. Sun and N. S. Sariciftci, CRC Press, Boca Raton, FL, 2005, Ch. 6, pp. 139–159. 37. Krebs F. C., Biancardo M., Winther-Jensen B., Spanggard H., Alstrup J. Sol. Energy Mater. Sol. Cells, 2006, 90, 1058–1067. 38. Krebs F. C., Nielsen T. D., Fyenbo J., Wadstrom M., Pedersen M. S. Energy Environ. Sci., 2010, 3, 512–525. 39. Ghezzi D., M. R. Antognazza, R. Maccarone, S. Bellani, E. Lanzarini, N. Martino, M. Mete, G. Pertile, S. Bisti, G. Lanzani and F. Benfanati, Nat. Photonics, 2013 DOI:10.1038/ nphoton.2013.34. 40. Zhu R., Kumar A., Yang Y. Adv. Mater., 2011, 23, 4193–4198. 41. Deibel C., Dyakonov V. Polymer–Fullerene Bulk Heterojunction Solar Cells. Progr. Phys. 73, 096401(2010)http://dx.doi.org/10.1088/0034-4885/ 73/9/096401;arXiv:[cond-mat.mtrl-sci]30 Aug 2010 42. Wessler B., Tober U. Green Photonics – the Role of Photonics in Sustainable Product Design. In Proceedings- SPIE “The International Society For Optical Engineering,” 2011, ISBN 9780819486516; 8065; 8065 15; SPIE Eco-Photonics: Sustainable Design, Manufacturing, and Engineering Workforce Education for a Green Future Conference, https://getinfo.de/app/Green-photonics-the-role-of-photonics-in-sustainable/id/BLCP% 3ACN079692009 43. Electrical Power Research Institute. Review of Photovoltaic System Reliability Challenges and Opportunities. 05 Dec. 2012, Product ID: 1024002.
44. Jornet J. M., Akyildiz I. F. Joint Energy Harvesting and Communication Analysis for Perpetual Wireless Nanosensor Networks in the Terahertz Band. IEEE Transactions On Nanotechnology, Vol. 11(2012), No. 3, pp. 570-580. 45. Akyildiz I.F., Jornet J.M. Electromagnetic wireless nanosensor networks. www.elsevier.com/ locate/ nanocomnet. 46. Jornet J. M., Akyildiz I. F. Graphene-Based Nano-Antennas for Electromagnetic Nanonetworks in the Terahertz Band. In Proc. of 4th European Conference on Antennas and Propagation, Barcelona, Spain, April 2010. 47. Gangopadhyay Utpal, et al. State of Art of Solar Photovoltaic Technology. Conference Papers in Energy, Volume 2013, Article ID 764132, 9 pages, http://dx.doi.org/10.1155/2013/764132 48. Razykov T. M. et al. Solar Photovoltaic Electricity: Current Status and Future Prospects. Solar Energy 85(2011), pp. 1580–1608. 49. IEA International Energy Agency. Trends 2015 in Photovoltaic Applications, http://www.iea-pvps.org/ fileadmin/ dam/public/report/national/ IEA-PVPS_-_Trends_2015_-_MedRes.pdf
Recommended for publication: 19.08.2016
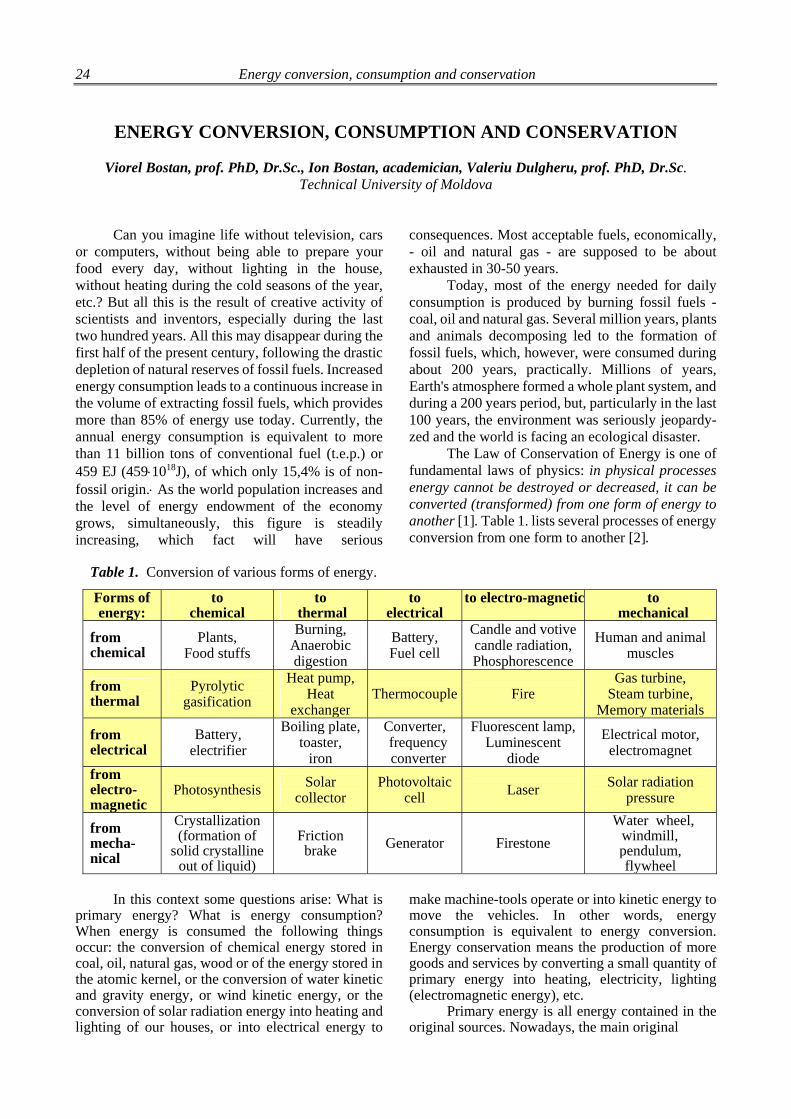
24 Energy conversion, consumption and conservation
ENERGY CONVERSION, CONSUMPTION AND CONSERVATION
Viorel Bostan, prof. PhD, Dr.Sc., Ion Bostan, academician, Valeriu Dulgheru, prof. PhD, Dr.Sc. Technical University of Moldova
Can you imagine life without television, cars or computers, without being able to prepare your food every day, without lighting in the house, without heating during the cold seasons of the year, etc.? But all this is the result of creative activity of scientists and inventors, especially during the last two hundred years. All this may disappear during the first half of the present century, following the drastic depletion of natural reserves of fossil fuels. Increased energy consumption leads to a continuous increase in the volume of extracting fossil fuels, which provides more than 85% of energy use today. Currently, the annual energy consumption is equivalent to more than 11 billion tons of conventional fuel (t.e.p.) or 459 EJ (4591018J), of which only 15,4% is of non-fossil origin. As the world population increases and the level of energy endowment of the economy grows, simultaneously, this figure is steadily increasing, which fact will have serious
consequences. Most acceptable fuels, economically, - oil and natural gas - are supposed to be about exhausted in 30-50 years.
Today, most of the energy needed for daily consumption is produced by burning fossil fuels - coal, oil and natural gas. Several million years, plants and animals decomposing led to the formation of fossil fuels, which, however, were consumed during about 200 years, practically. Millions of years, Earth's atmosphere formed a whole plant system, and during a 200 years period, but, particularly in the last 100 years, the environment was seriously jeopardy-zed and the world is facing an ecological disaster.
The Law of Conservation of Energy is one of fundamental laws of physics: in physical processes energy cannot be destroyed or decreased, it can be converted (transformed) from one form of energy to another [1]. Table 1. lists several processes of energy conversion from one form to another [2].
Table 1. Conversion of various forms of energy.
Forms of energy:
to chemical
to thermal
to electrical
to electro-magnetic to mechanical
from chemical
Plants, Food stuffs
Burning,Anaerobic digestion
Battery, Fuel cell
Candle and votive candle radiation, Phosphorescence
Human and animal muscles
from thermal
Pyrolytic gasification
Heat pump,Heat
exchangerThermocouple Fire
Gas turbine,Steam turbine,
Memory materials
from electrical
Battery, electrifier
Boiling plate,toaster,
iron
Converter, frequency converter
Fluorescent lamp, Luminescent
diode
Electrical motor, electromagnet
from electro-magnetic
Photosynthesis Solar collector
Photovoltaic cell Laser Solar radiation
pressure
from mecha-nical
Crystallization (formation of
solid crystalline out of liquid)
Friction brake Generator Firestone
Water wheel,windmill, pendulum, flywheel
In this context some questions arise: What is
primary energy? What is energy consumption? When energy is consumed the following things occur: the conversion of chemical energy stored in coal, oil, natural gas, wood or of the energy stored in the atomic kernel, or the conversion of water kinetic and gravity energy, or wind kinetic energy, or the conversion of solar radiation energy into heating and lighting of our houses, or into electrical energy to
make machine-tools operate or into kinetic energy to move the vehicles. In other words, energy consumption is equivalent to energy conversion. Energy conservation means the production of more goods and services by converting a small quantity of primary energy into heating, electricity, lighting (electromagnetic energy), etc.
Primary energy is all energy contained in the original sources. Nowadays, the main original

Energy conversion, consumption and conservation 25
sources are fossil fuels (coal, oil and natural gas), biofuels – wood, wooden wastes, agricultural waste, manure, etc. Other sources can be added, like hydraulic and geothermal energy, and other sources of renewable energy such as solar and wind energy, and nuclear energy as well. Consumers are interested in the satisfaction of their energy needs: they need thermal energy for heating and cooking, electrical energy for lighting, transportation and production of goods, etc. The quantity of supplied energy, the form of useful energy needed, the amount of energy losses and the price to pay for the used energy are important things for consumers. Fig. 1 and 2 show the three notions of energy (primary, supplied and useful), for two systems of electrical energy production – from natural gas at a condensation thermal power station (fig. 1.) and from conversion of solar energy into electrical energy using photovoltaic modules (PV). In both cases three devices are used: the electric bulb, the compact fluorescent lamp (CFL) and the electrical motor. The efficiency of devices is equal to 5, 20 and 90 %, respectively.
For systems based on fossil energy sources the biggest losses occur at the production of electrical energy (about 66%), followed by losses in the electrical networks at transportation and distribution, and losses in the devices. The last can be quite significant, if device efficiency is small. For example, for an electric bulb the global efficiency of energy conversion equals to 1,5% only, in other words, from 100 units of primary energy only 1,5 units are applied usefully, and 98,5 units bring about atmosphere thermal and gas pollution with the greenhouse effect. Global efficiency of a CFL lamp is 6%, and for an electric motor – 26,7 %.
National [3] and international statistics published data about the production and consumption of various forms of energy sources. Data is presented both in natural measurement units and in conventional measurement units. The concept of „consumption of primary energy sources” is applied in economic estimations, in the determination of energy efficiency and in the specific energy consumption, etc. The above concept contains all forms of the consumed energy – fuel, electrical or thermal energy obtained from the fossil sources, from the nuclear or hydraulic energy, from the energy of various forms of biomass, or from geothermal, solar and wind energy, etc. It is important to know generally accepted agreements concerning the presentation of statistical data related to the consumption of primary energy resources. UNO, International Energy Agency (IEA) and some countries recommend the following methodology for primary energy resources calculation [4,5]:
1. primary energy used for the production of
electrical energy at thermal power stations (TPS: energy of fossil fuels is transformed into steam thermal energy, then into mechanical energy and, finally, into electrical energy) is defined as the result of multiplying the quantity of the produced electrical energy by 3 or division by 0,33, that in fact is the average efficiency of the thermal power station;
2. Contribution of primary energy to the production of hydraulic or wind electrical energy or from other renewable sources is considered equiva-lent with the quantity of electrical energy. In other words, in the case of electrical energy production from renewable sources, the efficiency of the conversion process is not taken into consideration.
Obviously, the value of the conversion process efficiency is very important in this case too (fig. 2). The higher the efficiency, the lower the unit cost of the produced electrical energy. As well, the overall efficiency of energy conversion is defined as the relationship of the useful energy to the solar primary energy incident on the surface of the PV module. It should be mentioned that useful energy is relatively bigger than in the case of fossil primary energy use. The agreement to use the above accepted concept of primary energy aims at outlining the fact that for the production of one unit of electrical energy from a renewable source, the same unit of primary energy will be spent, which circulates in the environment and does not change the balance of nature. The methods of energy (fossil or renewable) conversion are characterized by the efficiency factor E. The higher efficiency E, less primary energy will be spent at input for the production of one energy unit at output.
Efficiency factor E is determined by the mathematical relation:
useful
primary
EE 100%.
E (1)
The biggest part of primary energy sources on Earth belongs to fossil fuels based on carbon. World reserves of fossil fuels (oil, coal, gas) estimate at approximately [6] (BBEP – billions of barrels equivalent petroleum; MB – millions of barrels; MBEP – millions of barrels equivalent petroleum): oil: from 1050691 to 1277702 millions of
barrels (from 167 to 203 km³); gas: from 171040 to 192720 km³ (6,8 · 0,182
= 1,239 BBEP); coal: 1081279 million tons (1081279 · 0,9 ·
4,879 = 4,786 BBEP), Daily consumption of fuels in 2002 (7,9 is the
conversion ratio of tons equivalent petroleum in barrels equivalent petroleum BEP): oil: (10230 · 0,349) ·7,9/365= 77 MB/day;

26 Energy conversion, consumption and conservation
Figure 1. Primary, supplied and useful energy: the case of energy from fossil sources.
Figure 2. Primary energy, delivered and useful: the case of renewable energy.

Energy conversion, consumption and conservation 27 gas: (10230 · 0,212) · 7,9/365= 47 MBEP/day; coal: (10230· 0,235) · 7,9/365= 52 MBEP/day.
According to the most optimistic forecast done by Oil & Gas Journal, World Oil [7] these reserves of fossil fuels will last for:
32 years – oil; 72 years – gas; 252 years – coal. World reserves of oil and gas, distributed
among the biggest producers, are given in table 1.2
[6]. To note the fact that these estimates were done according to constant daily fuel consumption for year 2002. Natural gas is the most environment friendly fossil fuel and might be a partial solution to the climate warming and atmosphere pollution issues (Table 3).
Natural gas could be largely used in future for the production of hydrogen from methane (CH4), necessary for the functioning of fuel cells that will substitute gradually internal combustion engines.
Table 2. World reserves of oil and gas, January 2005.
Crude oil (billion of barrels)
Natural gas (Millions of cubic km )
Countries/Regions Oil & Gas Journal World Oil Oil & Gas Journal World Oil North America 214771 40874 7477,7 7752,4 Central and South America 100595 75973 7096,9 7837,3 Europe 17613 18125 5497,1 5419,3 Eurasia 77832 89898 55314,4 79978,9 Middle East 729341 708289 71448,3 72030,9 Africa 100784 112410 13498,8 14185,8 Asia and Oceania 36246 36244 10875,8 12036,4 World Total 1277182 1081813 171940 192720 Table 3. Atmosphere pollution by fossil fuels burning (kg emissions per TJ of consumed energy).
Emissions Natural gas Oil Coal
Nitrogen oxides 43 142 359
Sulphur dioxides 0.3 430 731
Solid particles 2 36 1 333
Source: US Environmental Protection Agency; American Gas Association (AGA).
Figure 3. World consumption of primary energy: 2002, 451 EJ.
Figure 4. Structure of RES consumption in the world: 2002, 69,4 EJ.

28 Energy conversion, consumption and conservation
There are other estimations too. According to the estimations of ARAMCO, presented at a workshop organized by OPEC in 2005, until now it was extracted about 1 trillion barrels or approximately 18% of the proven reserves of 5,7 billion barrels of oil. These quantities are estimated
to maintain the recent level of consumption for a 140 years time. „Still, this should not impede the development of alternative sources of oil, because energy demands supplementary energy sources” mentioned the reporter.
Oil, coal and gas made up 78,7 % of primary energy production in 2002 (fig. 3).
World consumption of primary energy of all forms increased in the former century more than 10 times and, in 2002, it reached about 451EJ (451x1018J) or 10800 mln. t.e.p. [www.bp.com/ centres/ energy2002/ index.asp and www.undp.org/ seed/eap/ activities/wea]. The share of renewable energy sources (RES) equals (15,4 %). Fig. 4 shows the structure of primary energy consumption from renewable sources: traditional biomass supplies 71,5 %, hydraulic energy – 13,0 %, other renewable sources – 15,5 %. The concept of “other renewable sources” includes geothermal energy, wind and solar energy, micro- and mini-hydro energy, new forms of energy from biomass – liquid and solid biofuels, biogas. According to the 2004 estimations of the US Department of Energy, the consumption of fossil fuels is increasing continuously, as these fuels continue to be the main energy sources used in the world (see fig. 5). The coming of such nations as China and India on the world market of fuel consumption confirms the hypothesis of future growth of daily consumption of fossil fuels. These countries are very big consumers as their population makes about half of the Earth’s population.
Figure 5. World energy needs supply in TW, 2004. USA Department of Energy.
The same information, for EU countries and Romania, is presented in fig. 6. Renewable energy has reached 13,8% of the world primary energy of 9958 Mtep in 2000 [8].
The consumption of renewable energy has increased by 2% in the last 30 years. At the same time, the term „other categories” refers to new renewable sources and includes geothermal, solar, wind, and other energy that has grown by 9%. In comparison with the lowest consumption in 1971, the wind energy increased by 52%, followed by solar energy - by 32%. About 58% of the renewable energy is consumed by the domestic, commercial and public sectors.
Renewable energy sources have reached the volume of 19% in 2000 (fig. 7) and are on the second place in the world production of electrical energy (after coal - 39%), followed by nuclear energy (17%), natural gas (17%) and oil (8%). The biggest share of renewable electrical energy belongs to hydraulic energy (92%), produced by large hydro stations constructed in dams. For the time being, the world production of electrical energy is environment unfriendly, and this is an issue for researchers to consider as well as the issue of energy resources exhaust.
In the long run, the world production of fossil fuels will reach a maximum growth, followed by a continuous reduction until it will reach the lowest level. Afterwards, the extraction will become disadvantageous economically or impossible from the engineering point of view. Countries, importing energy sources, will found themselves in difficult situation. The curve in fig. 8 shows an example of oil production decline forecast, based on the Hubbert peak theory of maximum [9,10]. The highest rate on the curve was estimated on the basis of production
Figure 6. Primary energy consumption in EU member countries (a) and Romania (b).
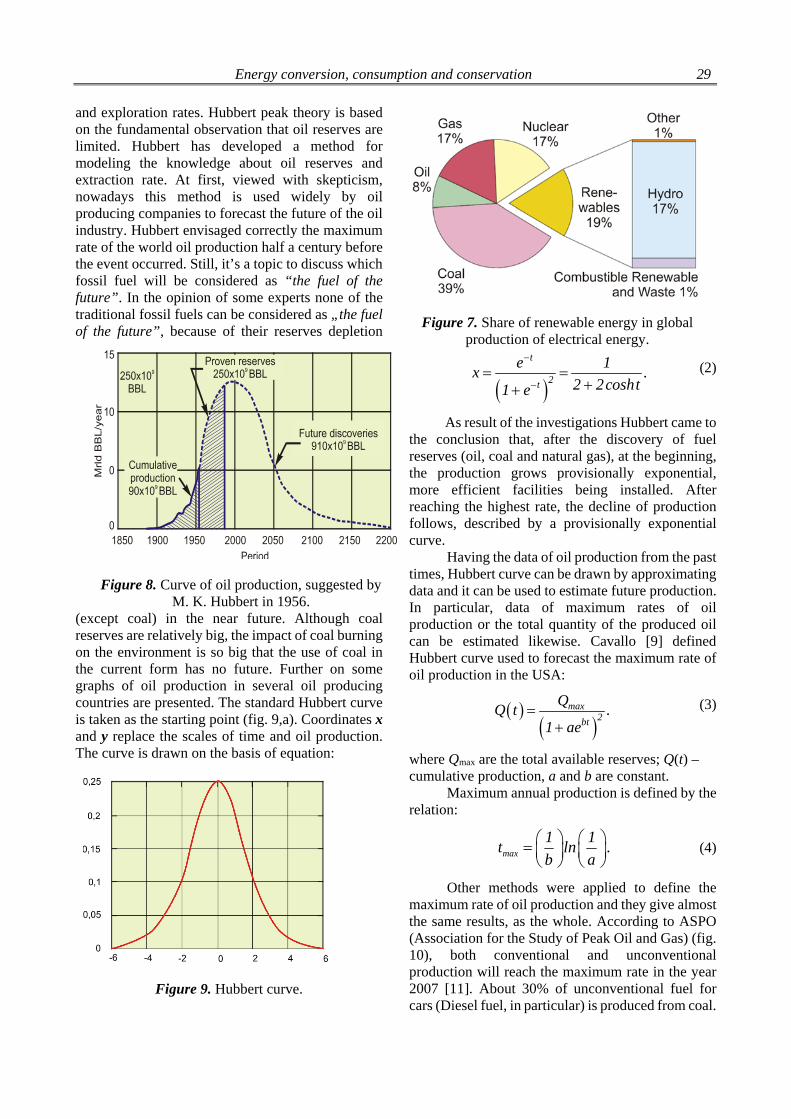
Energy conversion, consumption and conservation 29 and exploration rates. Hubbert peak theory is based on the fundamental observation that oil reserves are limited. Hubbert has developed a method for modeling the knowledge about oil reserves and extraction rate. At first, viewed with skepticism, nowadays this method is used widely by oil producing companies to forecast the future of the oil industry. Hubbert envisaged correctly the maximum rate of the world oil production half a century before the event occurred. Still, it’s a topic to discuss which fossil fuel will be considered as “the fuel of the future”. In the opinion of some experts none of the traditional fossil fuels can be considered as „the fuel of the future”, because of their reserves depletion
(except coal) in the near future. Although coal reserves are relatively big, the impact of coal burning on the environment is so big that the use of coal in the current form has no future. Further on some graphs of oil production in several oil producing countries are presented. The standard Hubbert curve is taken as the starting point (fig. 9,a). Coordinates x and y replace the scales of time and oil production. The curve is drawn on the basis of equation:
Figure 9. Hubbert curve.
t
2t
e 1x .
2 2cosht1 e
(2)
As result of the investigations Hubbert came to the conclusion that, after the discovery of fuel reserves (oil, coal and natural gas), at the beginning, the production grows provisionally exponential, more efficient facilities being installed. After reaching the highest rate, the decline of production follows, described by a provisionally exponential curve.
Having the data of oil production from the past times, Hubbert curve can be drawn by approximating data and it can be used to estimate future production. In particular, data of maximum rates of oil production or the total quantity of the produced oil can be estimated likewise. Cavallo [9] defined Hubbert curve used to forecast the maximum rate of oil production in the USA:
max2bt
QQ t .
1 ae
(3)
where Qmax are the total available reserves; Q(t) – cumulative production, a and b are constant.
Maximum annual production is defined by the relation:
max
1 1t ln .
b a
(4)
Other methods were applied to define the maximum rate of oil production and they give almost the same results, as the whole. According to ASPO (Association for the Study of Peak Oil and Gas) (fig. 10), both conventional and unconventional production will reach the maximum rate in the year 2007 [11]. About 30% of unconventional fuel for cars (Diesel fuel, in particular) is produced from coal.
Figure 7. Share of renewable energy in global production of electrical energy.
Figure 8. Curve of oil production, suggested by M. K. Hubbert in 1956.

30 Energy conversion, consumption and conservation
Geographical distribution of hydrocarbon reserves continues to be unchanged with a big concentration of oil in the Middle East (65%) and OPEC countries, and a more or less distribution between the Russia (37%) and the Middle East (35%)
for gas. The newly discovered world reserves of about 500 mln billions of barrels of oil are concentrated in 29 oil deposits areas, including 7 coastal areas at drilling depths over 1000 m and 29 gas deposits areas, 8 of which located in the Middle Asia and 5 in Australia. From the total of 29 gas areas 5 are located at depths over 1000 m. 50% of newly discovered gas deposits are concentrated in 10 countries, on the one hand, in Iran and Saudi Arabia, on the other hand, in Brazil and Angola.
The new oil deposits are explored at bigger and bigger depths. The depth of coastal exploration increased from 300 m in 1978 to 1900 m (fig. 11) in 1999. During these 20 years the depth of continental shelf oil production continued to be limited by technological aspects. Nowadays, the potential of oil resources at depths have not been defined yet. But the issues of technological exploitation of these
resources are significant: high pressure, low temperature, considerable depths, constant presence of ocean currents, etc. The use of conventional coastal solutions for big water depths is inconceivable, and new technologies are demanded.
The majority of companies producing offshore oil have a drilling experience of about 3000 m. The achievement of these objectives depends on the technological challenges for the next 5–10 years. An option of a future technology is shown in fig. 12.
We hope that the exhaustion of oil and natural gas reserves, the increase of difficulties related to their exploitation that will lead inevitably to price growth and to the understanding the threat of the ecological disaster towards which the mankind is
straightening, will change the balance in favour of renewable energy sources friendly to the environment. The world energy crisis leads to the growth of prices as result of partial dissatisfaction of current needs. The prices on oil on the world market have increased constantly with some fluctuations.
Diversification of energy sources becomes an economic and environmental imperative. These alternative energies are called renewable energy. What are these alternative sources of energy? The best known renewable energy sources are solar energy (direct, photovoltaic and thermal), wind (as a derivative of solar energy), hydraulic (using potential and kinetic energy of water), geothermal, bioenergy, etc.
Renewable energy can be used both as a centralized and largely decentralized energy source. Decentralized sources are particularly advantageous, especially for rural and isolated consumers. At the same time, according to UN information, about 2 billion people lack access to electricity, while about 40 countries have no national electricity networks. The cost of the network is bigger in proportion of 4:1
Figure 10. Estimation of maximum share of oil and gas production, 2004 (conventional and
unconventional).
Figure 11. Depth records at exploring offshore oil.
Figure 12. Key-technologies for oil drilling from deep deposits.

Energy conversion, consumption and conservation 31 or more to the cost of power plants. From this point of view, promoting decentralized energy sources is advantageous, as key programs of rural electrification and poverty reduction in rural areas.
Bibliography
1. Stöcker H. Toute la physique. Dunod, Paris, - 1999, 1180 p. 2. Hinrichs R. A., Kleinbach M. Energy: its use and environment. Third edition. Thomson Learning. 2002, 590 p. 3. Energy Balance of the Republic of Moldova in 2003. Department of Statistics and Sociology, Republic of Moldova. Ch.: 2004, 37 p. 4. Boyle G. Renewable Energy: power for a sustainable future. Oxford University Press. 2004, 452 p. 5. Bostan, I., Gheorghe, A., Dulgheru, V., Sobor, I., Bostan, V., Sochirean, A. Resilient Energy Systems. Renewables: Wind, Solar, Hydro. Springer, VIII, 507 p. 2013. ISBN 978-94-007-4188-1. 6. An Assessment of World Hydrocarbon Resources, Hans-Holger Rogner, Annu. Rev. Energy Environ. 1997. 22:217–62. 7. Global oil & gas depletion: an overview, R.W. Bentley, Energy Policy, 30, 189 – 205, 2002. 8. Flavin Ch., Lenssen N. Energy Wave. Guide to the impending energy revolution. Tehnica Publ. House, Bucharest, 1996. 9. Cavallo A. J. Hubbert’s Petroleum Production Model: An Evaluation and Implications for World Oil Production Forecasts, Natural Resources Research,Vol. 13, No. 4, December 2004. 10. Deffeyes K. S. Hubbert's Peak: The Impending World Oil Shortage. Princeton University Press. 2002. ISBN 0-691-09086-6. 11. Peak Oil Theory. World Running Out of Oil Soon; Could Distort Policy & Energy Debate.
Recommended for publication: 13.07.2016.

32 Speckle pattern of radiation scattered of soft biological tissues. Light fields outside tissue
SPECKLE PATTERN OF RADIATION SCATTERED OF SOFT BIOLOGICAL TISSUES. LIGHT FIELDS OUTSIDE TISSUE
Nicolai Abramovich1, Postgraduate, Serghei Dick1, PhD, doc., Victor Sontea2, Dr.Sc., prof.
1Belarus State University of Informatics and Radioelectronics, Belarus 2Technical University of Moldova
1. INTRODUCTION
The speckle structure of scattered light is currently used in both scientific and practical purposes for determining various characteristics of biological tissues, e.g. tissue particle sizes and blood flow rate, for diagnosing different kinds of pathologies and monitoring therapy efficiencies. However the developed techniques are constructed, generally empirically and are based on experimental data without quantitative theoretical justification. This results in incomplete use of diagnostic and other features inherent in the original speckle pattern of scattered light. So urgent is the construction of a theoretical framework of formation of interference field parameters based on radiative transfer theory and its relation to the coherence theory.
The aim of this work is to study the speckle pattern of the light field, multiply scattered soft biological tissues, and assessment of the light field outside tissue.
2. CALCULATION PROCEDURE
An analytical method of calculating the characteristics of the interference pattern formed by the repeatedly scattered light inside the multi-layer biological tissue as human skin kind at wavelengths of visible and near IR spectral ranges at laser irradiation, is described in [1,2].
The calculations assumed that the scattering particles are immobile. The simulation used a well-known analytical solutions of radiative transfer theory [3] in the presentation of the scattering function as a sum of functions having substantially different angular scales [4], for the separation of the total radiation in the coherent Ec and incoherent background Enc. Calculated [5] absorption and extinction coefficients μaj and μej as well as phase functions or a number of their integral parameters [6]. Completed research in this paper are based, in addition, the optical model of skin tissue [4, 7-9]. Examined the tissue, consisting of three
macroscopically homogeneous layers: the stratum corneum, the epidermis and dermis.
The input parameters for the calculation are the wavelength of the laser, as well as structural and biophysical characteristics of the layers of the skin - the geometric thickness d0 and d1 (index j= 0, 1 and 2 denote respectively stratum corneum, epidermis and dermis), the volume concentration and blood capillaries in the dermis Cb and melanin in the epidermis Cm, the degree of oxygenation of the blood S (the ratio of the concentration of oxyhemoglobin to total hemoglobin). Dermis assumed semi-infinite (in optical terms) layer. The coefficients 1,2a
can be varied by changing a
wavelength of the illuminating beam, so of volume of concentrations of absorbers - respectively melanin and hemoglobin derivatives. Thus, the biological tissue model provides a direct connection between the optical determining the characteristics of the light field in the tissue and biophysical parameters
To go to the observation of the speckle pattern on the upper boundary of the surrounding (on the skin), we use the results of [3]. Here is shown that the image generated by the coherent light within the surrounding at depths z ÷ z + dz, is transferred as follows into the plane z = 0
d ∗ , , 2 1 cos, 2
dA , 2
where r - the coordinate measured in the direction normal to z, ri,j - the characteristic size of the speckles, φ - random phase, dAi,j - albedo elementary layer dz tissue. In (1) the value j = 0, 1 and 2 correspond to the stratum corneum, the epidermis and dermis, and i = 0, 1 and 2 - the direct light, a diffraction and diffusion components [1,2]. Albedo dAi,j contains the index i, that shows in the general case albedo values may depend on the structure of the angular intensity Ii,j component. Let’s mark that the representation (1) of the image speckles on the surface corresponds to the calculation of illuminance Ei,j in the "effective" surrounding with double geometric thicknesses and coefficient also doubled the scattering and absorption of each layer [3].We write in the explicit expression for dAi,j, assuming
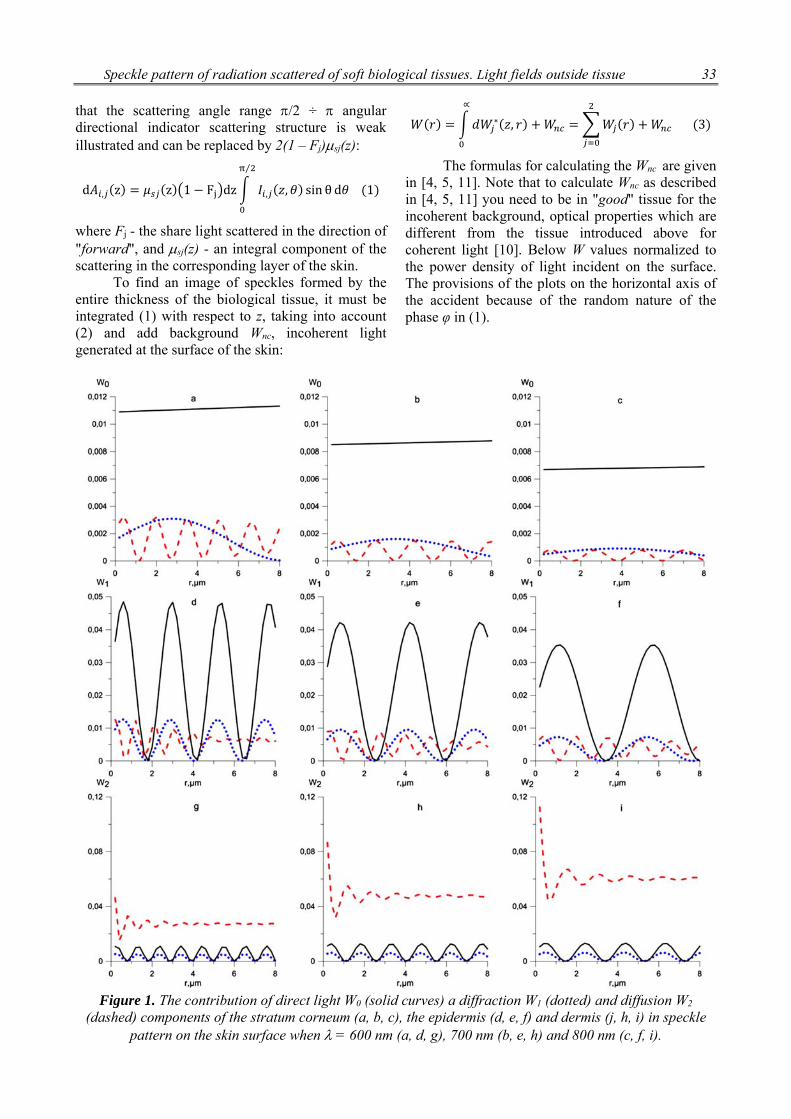
Speckle pattern of radiation scattered of soft biological tissues. Light fields outside tissue 33
that the scattering angle range /2 ÷ angular directional indicator scattering structure is weak illustrated and can be replaced by 2(1 – Fj)sj(z):
d , z z 1 F dz , , sin θ d 1
⁄
where Fj - the share light scattered in the direction of "forward", and sj(z) - an integral component of the scattering in the corresponding layer of the skin.
To find an image of speckles formed by the entire thickness of the biological tissue, it must be integrated (1) with respect to z, taking into account (2) and add background Wnc, incoherent light generated at the surface of the skin:
∗ , 3
∝
The formulas for calculating the Wnc are given in [4, 5, 11]. Note that to calculate Wnc as described in [4, 5, 11] you need to be in "good" tissue for the incoherent background, optical properties which are different from the tissue introduced above for coherent light [10]. Below W values normalized to the power density of light incident on the surface. The provisions of the plots on the horizontal axis of the accident because of the random nature of the phase φ in (1).
Figure 1. The contribution of direct light W0 (solid curves) a diffraction W1 (dotted) and diffusion W2
(dashed) components of the stratum corneum (a, b, c), the epidermis (d, e, f) and dermis (j, h, i) in speckle pattern on the skin surface when = 600 nm (a, d, g), 700 nm (b, e, h) and 800 nm (c, f, i).

34 Speckle pattern of radiation scattered of soft biological tissues. Light fields outside tissue
3. EXAMPLES OF SIMULATED
SPECKLE STRUCTURE OUTSIDE
BIOTISSUE
Fig. 1 shows the radial irradiance distribution Wj(r) at wavelengths = 600, 700 and 800 nm, generated by the three components (i = 0, 1, and 2) coherent light on the skin surface, the back-scattered throughout the thickness of the stratum corneum (a,b,c) epidermis (d,e,f) and dermis (g,h,i). The calculations were performed for the following values of structural and biophysical parameters of tissue: the thickness of the stratum corneum and epidermis d0 = 20 mm and d1 = 100 mm (hereinafter, these parameters remain fixed), the degree of oxygenation of the blood S = 0.75, the volume of melanin concentration in the epidermis and blood in the dermis Cm = 0.08 , and Cb = 0.08. As can be seen from fig. 1, the contribution of the stratum corneum to the total interference pattern is small and in many cases can be ignored. For the epidermis and dermis values W1 и W2 , on the contrary, are comparable. With increasing wavelength (fig. 1 h, i) contribution of dermal to the total W2 interference pattern increases markedly, while the value of W1 decreases a little. This is associated with a significant (approximately an order of magnitude) decrease in blood absorption index at = 800 nm in compare with 600 and 700 nm. The absorption of the melanin does not change very much, but at the same time there is a decrease in scattering index of the epidermis. [4]
Fig. 2 shows the total (by index i) contributions from the three components of each layer in the interference pattern on the surface, as well as integrated speckle pattern W (3) of the backscattered light. Usually blood diagnostic tasks by speckle parameters of reflected radiation is interesting a component of the dermis in full interference pattern. As is evident from fig. 2 (a) this component at 600 nm is largely hidden epidermis. Therefore, when the characteristics of erythrocytes = 600 nm is more convenient to determine the variable component of the speckle pattern caused by the motion of the particles in blood flow. However, consideration of this issue is beyond the scope of this research. When = 700 nm (fig. 2b) the value of the components of the dermis and epidermis is about the same. When = 800 nm (fig. 2 c) the contribution of the dermis exceeds the optical signal from the epidermis, which can be the basis for the creation of non-invasive diagnostic methods for blood pulse irradiation the tissue surface. This will be the subject of study in the future.
Figure 2. The contribution of the stratum corneum (solid curves), the epidermis (dotted) and dermis
(dashed) to the total speckle light (dash-dot) on the skin surface when = 600 nm (a), 700 nm (b) and
800 nm (c).

Speckle pattern of radiation scattered of soft biological tissues. Light fields outside tissue 35
Figure 3. Full structure of the speckle light at the skin surface. 1 - = 800 nm, 2 - 600 nm, S = 0,75 (a, b) and S = 0,97 (c, d);
a, c - Cm = 0.08, Cb = 0.04 (solid), 0.08 (dotted) and 0.16 (dashed); b, d - Cm = 0.04 (solid), 0.08 (dotted) and 0.16 (dashed), Cb = 0.08.
Let’s examine the dependence of the full speckle pattern of light on the surface of the skin tissue on the biophysical parameters - the degree of oxygenation of blood S, Cm volume concentration of melanin in the epidermis and the dermis capillaries Cb.
As previously noted, the total value of light field W on the skin surface is bigger at a wavelength of 800 nm. Fig. 3 (b, d) varies the volume concentration of melanin in the epidermis Cm, which acts as a spectral filter with fixed value Cb = 0.08 for various values of the degree of blood oxygenation S = 0.75 (fig. 3 b), and S = 0.97 (fig. 3 d). By
increasing melanin concentration Cm in the range of 0.04 to 0.16 total luminance value of W decreases. Epidermis simply attenuates light penetrating in the depth of the medium, the attenuation being the more noticeable, the more concentration fm is.
Fig. 3 (a, c) correspond to the variable (ranging from 0.04 to 0.16) volume concentration Cb of blood capillaries in the dermis at a fixed Cb = 0.08.
With increasing Cb contribution of light scattering of red blood cells in the total attenuation of the dermis growing, so full value of the W light speckle pattern is reduced.

36 Speckle pattern of radiation scattered of soft biological tissues. Light fields outside tissue
We note that while simultaneous increasing
the volume concentration of melanin Cm in the epidermis and the dermis capillaries Cb integrated speckle pattern W) backscattered light decreases even faster because of the weakening of the epidermis (which becomes the greater noticed, in case Cm is bigger) and reducing incoherent background due to growth tissue absorption.
It should be noted that the light field on the W skin practically does not depend on the extent of blood oxygenation S under = 800 nm (curve 1 in fig. 3) and increases (curves 2 in fig. 3) = 600 nm is stronger (2 the solid curve in fig. 3 b, d), the smaller is the value of volume concentration of melanin Cm in the epidermis (0.04 versus 0.08 and 0.16). The presented analytical method of estimating the parameters of the speckle pattern observed in the reflected light from the multilayer biological tissue has important scientific and practical applications: it allows without the use of complicated and cumbersome numerical algorithms to calculate the characteristics of the light field on the tissue surface. This can be the basis for the creation of new and improvement of the known methods for studying the interaction of light with biological tissues [11]. Analytical disposition of calculation method provides simplicity of use by various categories of researchers who do not specialize in computer technology and programming. This will expand the number of consumers, including medical practitioners, biologists, etc.
4. CONCLUSION
The results described above are valid for mobile scattering particles under their pulse illumination, when the pulse duration is essentially smaller than the characteristic time of the particle movement. The scatterers obviously can be considered as “frozen” or immobile in this case.
In future is planning to develop received results in case of moving scatterers and construction parameters of the analytical relations between the speckle pattern and different characteristics of moving particles (e.g., red blood cells) and the surrounding in which they move. It is obvious that the functionality of the optical speckle methods of diagnosis of biological tissues in this care significantly enhances.
Reference
1. Abramovich N., Barun V., Dick S. et al. Analytical procedure for evaluating contrast of light field scattered by soft biological tissues// 5th Troitsk Conf. on Medical Phys. and Innovations in Medicine, V. 1, p. 212 – 214, 2012. 2. Abramovich N., Barun V., Dick S., Ivanov A. Simulation of the speckle pattern of the light field inside the multi-layer tissue of the skin // JEPTER. – V. 86, - № 6. – p .1288 – 1295, 2013 3. Katsev I., Zege E., Prikhach A., Polonsky I. Efficient technique to determine backscattered light power for various atmospheric and oceanic sounding and imaging systems // JOSA A, V. 14, р.1338, 1997 4. Barun V., Ivanov A. et al. Absorption spectra and light penetration depth of normal and pathologically altered human skin // J. Appl. Spectrosc., V. 74, p. 430 – 439, 2007. 5. Barun V., Ivanov,A. Light absorption in blood during low-intensity laser irradiation of skin // Quantum Electron., V. 40, p. 371 – 376, 2010. 6. Ivanov A., Katsev I. On the speckle structure of light field in disperse medium illuminated by a laser beam // Quant. Electron., V. 35, p. 670– 674, 2005. 7. Jacques S. http://omlc.ogi.edu/news/jan98/ skinoptics.html. 8. Tuchin V. Lasers and fiber optics in biomedical research // 1998, Saratov: Izd. Saratov. Univer. 9. Gemert V., Jacques, M. S. et al. Skin optics // IEEE Trans. Biomed. Eng.,V. 36, p. 1146, 1989. 10. Zege E., Katsev I., Polonsky I. Multicomponent approach to light propagation in clouds and mists // Appl. Opt., V. 32, N. 15, p.2803, 1993. 11. Dick S. Laser-optical methods and technical means of verification of the functional state of biological objects// 2014, Minsk. Izd. BSUIR.
Recommended for publication: 18.11.2016.

Investigation of hydration processes of nanomodified calcium sulfate hemihydrates 37
INVESTIGATION OF HYDRATION PROCESSES OF NANOMODIFIED CALCIUM SULFATE HEMIHYDRATE
V.N.Derevianko1, Dr.Sc.Eng., Prof., N.V.Kondratieva2, PhD. Eng, Assoc. Prof., N.A.Sanitskiy3,
Dr.Sc.Eng., Prof., H.M.Hryshko4, PhD. Eng. 1 PHEI Prydniprovska State Academy of Civil Engineering and Architecture
2 PHEI Ukrainian State University of Chemical Technology 3 Lviv Polytechnic National University
4 Dnipropetrovsk State Agrarian-Economic University
1. INTRODUCTION
The article is concerned with development of new trend in the mineral binding substances nanomodification involving structure formation mechanisms and hence affecting various properties.
2. RATIONALE
Reports on successful nanosystems application in various areas encourage conduction of researches concerning impact the nanomodifiers have on mineral binding substance structure and properties. Effect is that additional phase boundary having the excess surface energy is formed in the “binder – gauging liquid” system [1]. This is one of factors influencing the hydration processes.
The literature review conducted by authors showed the null information on the reliable mechanisms of mineral binding substances hydration processes in the presence of nanomodifiers. The laboratory investigations show successful results in physical-and-mechanical properties changing, yet to a small extent. Problem complexity consists in unavailability of the adapted research technique, up-to-date equipment and materials.
3. RESEARCH OBJECTIVE
Study of impact factors and mechanism of
calcium sulfate systems hydration process in presence of nanomodifiers.
4. RESEARCH TECHNIQUES AND MATERIALS
For the purpose of the present research, carbon
nanotubes were used, which were made in the
hydrocarbons catalytic pyrolysis plant of the Center of carbon nanomaterials of the Vladimir State University n.a. A.G. and N.G. Stoletov, Russia (Table 1).
Table 1. Properties of multilayer carbon nanotubes (CNT).
Mat
eria
l
Nu
mb
er o
f la
yers
Len
gth
, μm
Dia
met
er, n
m
Sp
ecif
ic s
urf
ace
area
, m2 /g
Pu
rity
, %
CNT max 30
2-5 10-60 120 95
Gypsum binder with addition of surfactant in
amount of 0.4% of binder mass (Table 2) is used as reference standard. Table 2. Reference standard composition and properties.
Cal
ciu
m s
ulf
ate,
%
Su
rfac
tan
t, %
W/G
%
pH
Set
tin
g ti
me,
min
Str
engt
h, M
Pa
star
t
end
com
pre
ssio
n
ben
din
g
100 0,4 59 7,2 6 8 4,6 2,2

38 Investigation of hydration processes of nanomodified calcium sulfate hemihydrates
Carbon nanotubes were added in form of suspension prepared as follows: powder of multilayer carbon nanotubes was preliminary added to water solution of plasticizer, then it was processed in sonicator, which ensured formation of steady dispersion of the nanoparticles suspended in water. Polycarboxylate P-11 by the Macromer Research and Development Enterprise (Vladimir, Russia) and Sika Retarder plasticizer (Switzerland) were used as plasticizers. The suspension preparation process was controlled for the following parameters: suspension density, colloidal system stability (electrokinetic potential determination [2]), CNT concentration, viscosity.
X-ray diffraction analysis methods and calorimetric tests were used for the investigation of mineralogical composition and kinetics of the processes occurring in the modified matrix. New formations structures, sizes and morphology were investigated with the use of scanning electron microscopes.
In order to improve efficiency of carbon nanotubes (CNT), CNTs surface was chemically modified with the functional groups, for example, hydroxyl or carboxylic groups [3]. Carboxylation of carbon nanotubes was carried out by their interaction with various oxidizing agents [4 - 6] (chromium and manganese salts in high oxidation states, hydrogen peroxid). For the CNTs oxidization by hydroxyl groups, mechanochemical method [7 - 8] was used, which consists in the CNT milling with alkali during 60 minutes.
5. RESEARCH RESULTS
Conducted researches on the determination of water-gypsum ratio, ultimate bending strength and compression strength of bending test beams at 2 hours show that the increase of nano-additive content causes monotonic increase in structural characteristics of composite material (fig. 1).
Maximum strength improvement (27 – 29%) is achieved at the use of carbon nanotubes with the hydroxyl groups. At the use of initial nanotubes, strength improvement makes 13-15% (fig. 2).
The increase in carbon nanotubes concentration results in the increase in colloidal solution pH from 7.2 to 8.1, which influences the calcium sulfate hydration processes, and hence the structure formation processes and physical-and-mechanical properties of final material. In this case, increase in hydrogen exponent value results in the gypsum binder structural characteristics improvement.
In the course of calorimetric tests, calcium sulfate hemihydrate particles were tempered with water and were not agitated. Test conditions are such that regardless of dilution by water, initial binder particles are separated by small spaces, and ions passing into solution hardly ever move over large distances due to difficulty of diffusion in the liquid phase.
Figure 1. Histogram of the carbon nanotubes impact on gypsum binder strength.
Figure 2. Histogram of calcium sulfate based composite compression strength vs. carbon
nanotubes surface functionalization.
At the CNT addition, increase in the hydration reaction rate was observed. This owes to the active CaSO4·2H2O crystallization due to addition of

Investigation of hydration processes of nanomodified calcium sulfate hemihydrates 39
nanomodifier having the large specific surface area and high reactive capacity.
Results of measurement (fig. 3) of heat generation rate during calcium sulfate hemihydrate hydration show possibility of the technological control by means of technological processes in order to impart necessary properties to material.
Figure 3. Heat generation rate during the calcium
sulfate hemihydrate hydration process vs. nanomodifier type.
According to researches [10], Ca2+ sorption on
the graphene-like CNT surface causes increase in near-surface solution oversaturation degree. This facilitates more complete and rapid calcium sulfate hemihydrate conversion into calcium sulfate dihydrate, and hence accelerates calcium sulfate dihydrate crystallization process. Thus, thermodynamical curves are representative of achievability of hardening processes in conjunction with achievement of the required technological characteristics – strength, setting time, etc.
During investigation with the use of X-ray diffractometer X`Pert PRO MPD 3040/60 Fa. PANalytical (Institute of ceramics, glass and build materials (IKGB TU Bergakademie Freiberg)), analysis was conducted of initial gypsum binder, building gypsum-based samples modified and non-modified with the carbon nanotubes (Table 3).
Following materials were used as structural models of mineral components for full-profile quantitative X-ray phase analysis: gypsum CaSO4·2H2O (PDF No. 01-074-1433); bassanite CaSO4·0.5H2O (PDF No. 01-081-1849); anhydrite CaSO4 (PDF No. 01-086-2270), carbon C (PDF No. 01-075-2078).
Effect of nanomodifiers (CNT) on the hydration process is presented in the figs. 4, 5.
X-ray photograph of 1st cycle (fig. 4, curve 1) of gypsum sample shows a presence of large amount of calcium sulfate dihydrate (91 %), presence of calcium sulfate hemihydrate (up to 3%). Duration per cycle makes 5 minutes 16 sec. A hydration process is completed at 18th cycle (fig. 4, curve 2), i.e., upon expiration of 95 minutes, CaSO4·2H2O percentage makes 88%.
Table 3. Phase concentrations, % Wt.
Data from X-ray photograph of CNT-
modified gypsum binder hardening are indicative of hydration processes intensification. Hydration process is also completed at 18th hardening cycle (upon expiration of 95 minutes), while calcium sulfate dihydrate formation rate is considerably higher, the CaSO4·2H2O percentage makes up to 93%.
Figure 4. Rietveld diagram of gypsum hardening
over time.
CaS
O4·
0,5H
2O
CaS
O4·
2H2O
CaS
O4
CaC
O3
С
Gypsum binder
91 3 4 2 -
Building gypsum
3 88 4 2 -
Building gypsum +
CNT 1 93 3 2
1 (0,05)

40 Investigation of hydration processes of nanomodified calcium sulfate hemihydrates
Figure 5. Rietveld diagram of CNT-modified
gypsum hardening over time.
At hydration of the non-modified building gypsum during 18 cycles (95 minutes), process occurs with the CaSO4·2H2O formation up to 88%. At the same conditions, modified gypsum hydration makes up to 93%, and quantity of unreacted CaSO4 some decreases (Table 3).
Based on data of quantitative X-ray photographs and X-ray photographs over time, it may be concluded that CNT introduction causes hydration process enhancement, more complete calcium sulfate hemihydrate conversion into dehydrate is observed, and calcium sulfate matrix physical-and-mechanical parameters improvement is provided.
The analysis of microstructure of gypsum composition samples showed that without the modifying additive, loose structure of gypsum samples is formed with significant amount of pores.
It may be assumed that nanodispersed CNT additives act as “crystallization nuclei”, on the surface of which calcium sulfate matrix structuring occurs with achievement of improvement of gypsum composition structural characteristics. This is due to that during growth, crystals partly penetrate into each other and form three-dimensional network permeating and incorporating entire gypsum stone into a body.
Study [11] presents carbon surface effect on the structure of calcium sulfate dihydrate molecule, and proposes hypothesis for mechanism of CNT impact on structure and mechanical properties of calcium sulfate composites. Calcium sulfate hydration model is based on the Le Chatelier’s theory positing that calcium sulfate hemihydrate
interaction with water results in its dissolution with formation of the solution saturated with the Ca2+ and SO4
2- ions. Calculation of the calcium sulfate dihydrate
molecule interaction with CNT surface showed that the molecule is prone to the chemical interaction with surface [12] through the calcium ion (fig. 6).
a)
b)
Figure 6. Model fragments of CNT surface interacting with:
а) –calcium sulfate molecule; b) Ca2+ ion.

Investigation of hydration processes of nanomodified calcium sulfate hemihydrates 41
CONCLUSIONS
Introduction of carbon nanostructures into the gypsum compositions results in the mechanical strength improvement due to formation of fine-cristalline needle-like structure of the increased density. Given the same nanomodifier content in the calcium sulfate matrix, maximum compression strength increment making 27-29% is achieved at the use of CNTs functionalized with hydroxyl groups. At the use of the non-modified carbon nanotubes, strength increment in the presence of additive only makes 13-15%.
Chemical functionalization of carbon nanotubes surface facilitates reduction of the sedimentation effect inherent to the nanoparticles. In addition, it enables more uniform nanostructure dispersion throughout the modified material volume and provides the chemical interaction between nanotubes and substance matrix.
Calcium sulfate dihydrate molecule interaction with the graphene-like surface is a chemical process, which is demonstrated by the quantum-chemical analysis methods. Improvement of CNT-containing gypsum composite strength is due to the accelerated process of calcium sulfate dihydrate crystallization at the graphene surface.
References
1. Gusev B.V. Challenges for creation of nanomaterials and development of nanotechnologies in construction [Electronic resource] / B.V. Gusev // Nanotechnologies in Construction: Scientific Internet Journal. M.: СNT NanoStroitelstvo (Nano-Construction Technology Innovation Facility) - 2009. - No. 2. - pp. 5-10. – Access mode: http//www.nanobuild.ru 2. Chumak A.G. Structure and properties of composite material based on gypsum binder and carbon nanotubes [Electronic resource] / 3. Chumak A.G. Nanotechnologies in Construction: Scientific Internet Journal. M.: СNT NanoStroitelstvo (Nano-Construction Technology Innovation Facility) - 2013. - No. 2. - pp. 24-34. - Access mode: http//www.nanobuild.ru 4. Habachesku V.N. Covalent functionalization of carbon nanotubes: synthesis, properties and application of fluorinated derivatives [Text] / V.N. Habachesku, Translation from English by E.E. Grigorieva // Successes of chemistry. 80(8). - 2011. - pp. 739-760. 5. Yakovlev G.I. Modification of cement concretes with the multilayer carbon nanotubes [Text] / G.I. Yakovlev, G.N. Pervushin, A. Korzhenko.
6. A.F. Burianov, I.A. Pudov, A.A. Lushnikova // Construction materials. – Moscow. - 2011. - No. 2. - pp. 47-51. 7. Petrenko D.B. Modified Boehm's method for the determination of hydroxyl groups in the carbon nanotubes [Electronic resource] / D.B. Petrenko // Electronic journal ‘Bulletin of the Moscow state regional university’. Chemistry. - 2012. – No.1 . - Access mode: www.evestnik-mgou.ru. 8. Badamshina E.R. Modification of carbon nanotubes and synthesis of polymeric composites involving these [Text] / E.R. Badamshina, M.P. Gafurova, Ya.I. Estrin // Successes of chemistry. 79 (11). - 2010. - pp. 1028 – 1064. 9. Yudovich M.E. Surface-active properties of nanomodified plasticizers [Text] / M.E. Yudovich, A.N. Ponomarev, S.I. Gareev // Construction materials. - 2008. - No. 3. - pp. 2-3. 10. Morsy M. Synthesis and characterization of thermally stable carbon nano-tubes using ARC-Discharge technique [Text] / M. Morsy, S.A. Elkhodary, S.S. Shebl // Construction materials: Reports of the V International conference «Nanotechnology for Green and Sustainable Construction», March 23 - 25, Cairo. – 2012. - No.2. – pp. 44-47. 11. Tokarev Yu.V. Modification of anhydrite-based composite materials with ultra- and nanodispersed filling compounds [Text] / Yu.V. Tokarev, I.S. Maeva, G.I. Yakovlev, G.N. Pervushin // Intelligent systems in production, Izhevsk: IzhGTU Press (Izhevsk State Technical University Press). - 2010. - No. 1. - pp. 300-315. 12. Yalunina O.V. Modification of gypsum-based materials with the carbon nanosystems [Electronic resource] / O.V. Yalunina, I.V. Bessonov // Izhevsk - 2008. - Access mode: rosgips.ru›files/SBORNIK2008 (27).doc 13. Reshetnyak V.V. Interaction of calcium ions with the matrix carbon nanostructures [Text] / V.V. Reshetnyak, V.E. Vaganov, A.G. Chumak, A.G. Petrunin, M.Yu. Popov // Construction, materials science, machine building: Edited volume. – Dnipropetrovsk, PGASA (Dnieper Region State Academy of Construction and Architecture). - 2013. 14. Zakrevskaya L.V. Analysis of hardening mechanism of the cellular concretes modified with the carbon nanostructures [Text] / L.V. Zakrevskaya, Yu.V. Baranova, V.E. Vaganov, S.Yu. Petrunin, R.N. Dzhivak// Young science in the classic university: theses of reports at scientific conferences of Festival of students, graduate students and young scientists. – Ivanovo: Ivanovo State University, 2012. – pp. 76-77.
Recommended for publication:23.09.2016.

42 Increasing the durability of expanded clay lightweight concretes for thin-walled hydraulic…
INCREASING THE DURABILITY OF EXPANDED CLAY LIGHTWEIGHT CONCRETES FOR THIN-WALLED
HYDRAULIC ENGINEERING STRUCTURES
A.V. Mishutin, Dr.Sc. Eng., Prof., S.O. Kroviakov, PhD. Eng., M.V. Zavoloka, PhD. Eng., V.L. Bogutsky, Ie.V. Stanchyk
Odessa State Academy of Civil Engineering and Architecture
INTRODUCTION
Thin-walled construction is used in many types of hydraulic engineering structures (floating structures, channel walls, quay walls, pumping stations etc.). Heavy concretes were mainly used for such structures previously. Since recent times, lightweight aggregate concrete has been used for thin-walled structures. Modified expanded clay lightweight concrete has a relatively low bulk density with high strength and durability [1]. It can be used for thin-walled hydraulic engineering structures, such as floating docks, houses and hotels.
In the course of the study the influence of the expanded clay lightweight concrete composition on its properties has been found. First stage of the study investigated the lightweight concrete processed by the hydrophobized gravel. Second stage studied the concretes with the use of silica fume. High-quality concrete has been obtained.
1. PROBLEM FORMULATION
Expanded clay lightweight concrete is known to have strength higher than that of the expanded clay. Positive effect of porous fillers can be often explained by self-vacuuming [2]. They act as "pumps" that take water from the cement paste. As a result of a porous filler action we obtain compacted cement paste. Moisture that has been accumulated in the filler grains is later yielded to the cement paste. This moisture from the filler improves the cement hydration process. The concrete using the porous filler is less prone to sedimentation than concrete based on granite crushed stone. This is conditioned to self-vacuuming process as well. According to [3], self-vacuuming process also increases the chemical resistance of concrete. For this reason, the recommendation for developing the facilities/structures in an aggressive environment is to use fillers with high capillary water absorption.
Also, concrete with porous aggregates has high frost resistance [1].
For example, many years of experience in the shipbuilding domain proved that expanded clay lightweight concrete is effective for thin-walled structures [4]. There is a positive experience in using the lightweight aggregate concrete for constructing the thin-walled structures of the floating docks at Pallada State Shipbuilding Plant in Kherson (Ukraine) [5].
However, concretes based on porous aggregates have high W/C. Therefore, a significant interest represents the study of porous gravel hydrophobic property to reduce W/C in the concrete mixture.
Fiber concretes are also widely used in thin-walled engineering structures. Therefore, there is an important study of the effectiveness of using the dispersed reinforcement in expanded clay concretes.
2. RESEARCH METHODOLOGY
Studies of the expanded clay lightweight
concrete properties were conducted using the experimental design techniques [6]. The following materials were used: grade M400 sulphate-resistant portland cement, expanded clay gravel of the 5-10 mm fraction, quartz sand with 2.7 fineness modulus, S-3 superplasticizer, Penetron Admix bridging agent, 136-157M silicon-organic fluid, Baucon polypropylene fiber (18.7 μm diameter, and 12 mm fiber length), and silica fume.
At the first stage, 5-factor experiment was conducted in accordance with the 27-point optimal plan [7]. The following factors had variable compositions:
Х1 – portland cement, from 400 to 600 kg/m3; Х2 – concentration of the silicone-organic fluid
in the emulsion during processing of gravel, from 0 to 1.6%;
Х3 – addition of Penetron Admix, 0 to 2% of the cement weight;
Х4 – S-3 superplasticizer, from 0.5 to 0.9% of the cement weight;

Increasing the durability of expanded clay lightweight concretes for thin-walled hydraulic… 43
Х5 – fibers, from 0 to 1.2 kg/m3. Hydrophobized gravel was obtained by dipping
into the silicone-organic fluid emulsion. All concrete mixes had mobility equaling to 2 ± 0.5 cm.
At the second stage, 3-factor experiment was conducted in accordance with the 15-point optimal plan. The following factors had variable compositions:
Х1 – portland cement, from 500 to 600 kg/m3; Х2 – silica fume, from 0 to 50 kg/m3; Х3 – S-3 superplasticizer, from 0.5 to 1% of the
cement weight. All concrete mixes had mobility equaling to 3 ±
1 cm.
3. RESULTS AND DISCUSSION As a result of the study, complex experimental
and statistical models were obtained. The analysis of these models (the first stage of studies) shows that increasing the amount of portland cement and S-3 superplasticizer reduces the water content of the mixture. Introduction of Penetron Admix additive does not affect the W/C, and the use of fiber significantly increases the W/C. Hydrophobized gravel reduces the W/C in the concrete mixtures by 10-20% due to the reduction of water absorption by lightweight aggregate.
Introduction of Penetron Admix and fiber has little effect on the compressive strength of expanded clay lightweight concrete. Effect of an amount of the portland cement, S-3 superplasticizer and the concentration of the silicone-organic fluid in the processing gravel is shown in Figure 1.
The diagram shows that the highest strength will have that lightweight concrete, into which S-3 superplasticizer in the 0.7-0.8% concentration is added. Hydrophobized gravel, at the 0.7-0.8% concentration of the silicone-organic fluid, increases the strength of expanded clay lightweight concrete. Increasing the concentration of the silicone-organic fluid in excess of 0.8% will have a negative effect as the filler adhesion to the matrix will deteriorate.
Water resistance of the concrete is one of the main indicators of the quality of the thin-walled structures. It was found that introduction of the fibers would have a little effect on water resistance of the expanded clay lightweight concrete. Effectiveness of the introduction of Penetron Admix additives is large and it is approximately equal for all compositions. Introduction of 2% Penetron Admix improves the water resistance of concrete by around 2 atmospheres.
Figure 1. Effect of the amount of the portland cement, S-3 superplasticizer and the concentration
of silicone-organic fluid on the strength of expanded clay lightweight concrete (the first stage
of studies); x3=x5=0 Figure 2 diagram shows the influence of
portland cement, S-3 superplasticizer and the concentration of the silicone-organic fluid used for processing of the gravel on the water resistance of concrete. When plotting the chart, we accepted that amount of Penetron Admix additives would be 2% of the cement weight (х3=1).
Figure 2. Effect of the amount of the portland cement, S-3 superplasticizer and the concentration
of silicone-organic fluid on water resistance of expanded clay lightweight concrete (the first stage
of studies); x3=1, x5=0
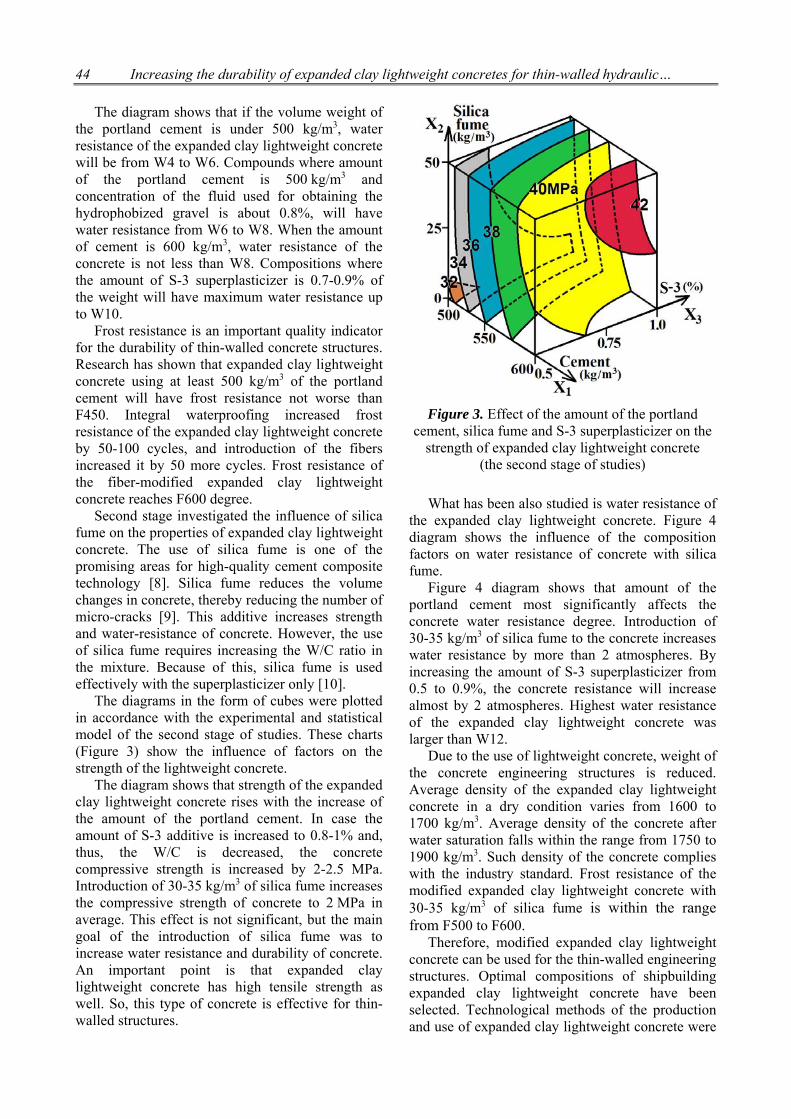
44 Increasing the durability of expanded clay lightweight concretes for thin-walled hydraulic…
The diagram shows that if the volume weight of
the portland cement is under 500 kg/m3, water resistance of the expanded clay lightweight concrete will be from W4 to W6. Compounds where amount of the portland cement is 500 kg/m3 and concentration of the fluid used for obtaining the hydrophobized gravel is about 0.8%, will have water resistance from W6 to W8. When the amount of cement is 600 kg/m3, water resistance of the concrete is not less than W8. Compositions where the amount of S-3 superplasticizer is 0.7-0.9% of the weight will have maximum water resistance up to W10.
Frost resistance is an important quality indicator for the durability of thin-walled concrete structures. Research has shown that expanded clay lightweight concrete using at least 500 kg/m3 of the portland cement will have frost resistance not worse than F450. Integral waterproofing increased frost resistance of the expanded clay lightweight concrete by 50-100 cycles, and introduction of the fibers increased it by 50 more cycles. Frost resistance of the fiber-modified expanded clay lightweight concrete reaches F600 degree.
Second stage investigated the influence of silica fume on the properties of expanded clay lightweight concrete. The use of silica fume is one of the promising areas for high-quality cement composite technology [8]. Silica fume reduces the volume changes in concrete, thereby reducing the number of micro-cracks [9]. This additive increases strength and water-resistance of concrete. However, the use of silica fume requires increasing the W/C ratio in the mixture. Because of this, silica fume is used effectively with the superplasticizer only [10].
The diagrams in the form of cubes were plotted in accordance with the experimental and statistical model of the second stage of studies. These charts (Figure 3) show the influence of factors on the strength of the lightweight concrete.
The diagram shows that strength of the expanded clay lightweight concrete rises with the increase of the amount of the portland cement. In case the amount of S-3 additive is increased to 0.8-1% and, thus, the W/C is decreased, the concrete compressive strength is increased by 2-2.5 MPa. Introduction of 30-35 kg/m3 of silica fume increases the compressive strength of concrete to 2 MPa in average. This effect is not significant, but the main goal of the introduction of silica fume was to increase water resistance and durability of concrete. An important point is that expanded clay lightweight concrete has high tensile strength as well. So, this type of concrete is effective for thin-walled structures.
Figure 3. Effect of the amount of the portland cement, silica fume and S-3 superplasticizer on the
strength of expanded clay lightweight concrete (the second stage of studies)
What has been also studied is water resistance of the expanded clay lightweight concrete. Figure 4 diagram shows the influence of the composition factors on water resistance of concrete with silica fume.
Figure 4 diagram shows that amount of the portland cement most significantly affects the concrete water resistance degree. Introduction of 30-35 kg/m3 of silica fume to the concrete increases water resistance by more than 2 atmospheres. By increasing the amount of S-3 superplasticizer from 0.5 to 0.9%, the concrete resistance will increase almost by 2 atmospheres. Highest water resistance of the expanded clay lightweight concrete was larger than W12.
Due to the use of lightweight concrete, weight of the concrete engineering structures is reduced. Average density of the expanded clay lightweight concrete in a dry condition varies from 1600 to 1700 kg/m3. Average density of the concrete after water saturation falls within the range from 1750 to 1900 kg/m3. Such density of the concrete complies with the industry standard. Frost resistance of the modified expanded clay lightweight concrete with 30-35 kg/m3 of silica fume is within the range from F500 to F600.
Therefore, modified expanded clay lightweight concrete can be used for the thin-walled engineering structures. Optimal compositions of shipbuilding expanded clay lightweight concrete have been selected. Technological methods of the production and use of expanded clay lightweight concrete were
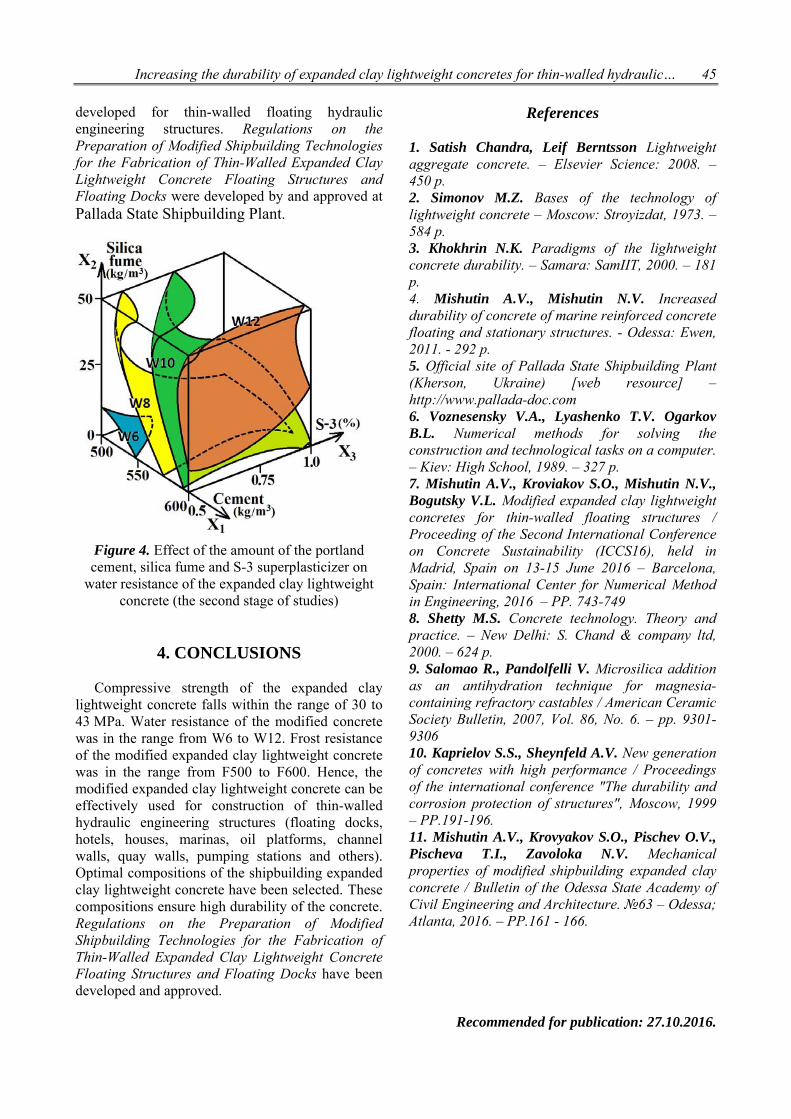
Increasing the durability of expanded clay lightweight concretes for thin-walled hydraulic… 45
developed for thin-walled floating hydraulic engineering structures. Regulations on the Preparation of Modified Shipbuilding Technologies for the Fabrication of Thin-Walled Expanded Clay Lightweight Concrete Floating Structures and Floating Docks were developed by and approved at Pallada State Shipbuilding Plant.
Figure 4. Effect of the amount of the portland cement, silica fume and S-3 superplasticizer on
water resistance of the expanded clay lightweight concrete (the second stage of studies)
4. CONCLUSIONS Compressive strength of the expanded clay
lightweight concrete falls within the range of 30 to 43 MPa. Water resistance of the modified concrete was in the range from W6 to W12. Frost resistance of the modified expanded clay lightweight concrete was in the range from F500 to F600. Hence, the modified expanded clay lightweight concrete can be effectively used for construction of thin-walled hydraulic engineering structures (floating docks, hotels, houses, marinas, oil platforms, channel walls, quay walls, pumping stations and others). Optimal compositions of the shipbuilding expanded clay lightweight concrete have been selected. These compositions ensure high durability of the concrete. Regulations on the Preparation of Modified Shipbuilding Technologies for the Fabrication of Thin-Walled Expanded Clay Lightweight Concrete Floating Structures and Floating Docks have been developed and approved.
References
1. Satish Chandra, Leif Berntsson Lightweight aggregate concrete. – Elsevier Science: 2008. – 450 p. 2. Simonov M.Z. Bases of the technology of lightweight concrete – Moscow: Stroyizdat, 1973. – 584 p. 3. Khokhrin N.K. Paradigms of the lightweight concrete durability. – Samara: SamIIT, 2000. – 181 p. 4. Mishutin A.V., Mishutin N.V. Increased durability of concrete of marine reinforced concrete floating and stationary structures. - Odessa: Ewen, 2011. - 292 p. 5. Official site of Pallada State Shipbuilding Plant (Kherson, Ukraine) [web resource] – http://www.pallada-doc.com 6. Voznesensky V.A., Lyashenko T.V. Ogarkov B.L. Numerical methods for solving the construction and technological tasks on a computer. – Kiev: High School, 1989. – 327 p. 7. Mishutin A.V., Kroviakov S.O., Mishutin N.V., Bogutsky V.L. Modified expanded clay lightweight concretes for thin-walled floating structures / Proceeding of the Second International Conference on Concrete Sustainability (ICCS16), held in Madrid, Spain on 13-15 June 2016 – Barcelona, Spain: International Center for Numerical Method in Engineering, 2016 – PP. 743-749 8. Shetty M.S. Concrete technology. Theory and practice. – New Delhi: S. Chand & company ltd, 2000. – 624 p. 9. Salomao R., Pandolfelli V. Microsilica addition as an antihydration technique for magnesia-containing refractory castables / American Ceramic Society Bulletin, 2007, Vol. 86, No. 6. – pp. 9301-9306 10. Kaprielov S.S., Sheynfeld A.V. New generation of concretes with high performance / Proceedings of the international conference "The durability and corrosion protection of structures", Moscow, 1999 – PP.191-196. 11. Mishutin A.V., Krovyakov S.O., Pischev O.V., Pischeva T.I., Zavoloka N.V. Mechanical properties of modified shipbuilding expanded clay concrete / Bulletin of the Odessa State Academy of Civil Engineering and Architecture. №63 – Odessa; Atlanta, 2016. – PP.161 - 166.
Recommended for publication: 27.10.2016.

46 Composite material test results and finite element analysis: its correlation
COMPOSITE MATERIAL TEST RESULTS AND FINITE ELEMENT ANALYSIS: ITS CORRELATION
Marin Guţu, PhD student
Technical University of Moldova
INTRODUCTION
Fiber-reinforced composite materials have gained popularity (despite their generally high cost) in high-performance products that need to be lightweight, yet strong enough to take harsh loading conditions such as aerospace components (tails, wings, fuselages, propellers), wind rotors, boat and scull hulls, bicycle frames and racing car bodies. Other uses include fishing rods, storage tanks, swimming pool panels, and baseball bats. The new Boeing 787 structure including the wings and fuselage is composed largely of composites. Composite materials are also becoming more common in the realm of orthopedic surgery. In order to study the structures of composite materials, as for classic materials, two calculation methods are used: analytical methods and numerical methods. For composite material strength structure modelling both theoretical models and real models are used. Theoretical models are an intermediate link between experience and theory referring to these structures, comprehensive and accurate but laborious. These are often sets of hypotheses based on the analogy with structures whose theory is well known. Real models allow experimental way of solving problems that cannot be solved analytically or numerically, either because there are no appropriate calculation methods or because existing methods are too laborious and expensive. There are no general algorithms and methods to ensure transition from real structure to its model which approximates, with predetermined error, the structure that will be calculated. There are several models developed, all correct, but with different performance. But modelling of composite structures is very difficult. To obtain data closer to reality, composite materials are modelled on level of the lamine. This clearly shows the main damages occurring in the fibre reinforced laminate (matrix cracks, delamination, fibre failure etc.). Because of the high degree of complexity of analytical methods and limitation of their application for a wide variety of structures there were developed very much the numerical methods. Currently, the
most widely used numerical method of calculation applied in field of analysis of composite structures is the finite element method (FEM). Finite element analysis software are continuously improved thereby in their library are included finite elements for analysis of composite structures. Currently, research on the FEM takes the form of laborious theoretical and applicative studies, pursuing a variety of directions:
- setting up and developing of modern computing software for these structures, by facilitating of composite material modelling architecture and visualization of stresses that occur in it, modernization of data input (automatic generation of nodes and elements, suitable and easy to use menus, etc.), creation of facilities related data preprocessing and postprocessing analysis results, coupling with general interest programs etc.;
- creation of software products including opportunities for optimization of composite structures using the criteria of weight, stiffness, strength, price etc.
MATERIALS AND TESTING METHOD
Composite material samples were manufactured in the laboratory “Composite Technologies" within the Scientific Technical Center of Advanced Technologies Implementation "Etalon" of the Technical University of Moldova. The samples were made from polyester resin reinforced with fiberglass using technology of vacuum assisted resin transfer moulding (Fig. 1). This method is most prevalent due to its advantages: it is ecological (the whole process takes place under vacuum and thus totally eliminates exposure to pollutants), hardening resin occurs at ambient temperature and can be obtained very good quality parts. The same time by this method can be obtained higher percentage of fiber (60% - 70%) compared to hand molding (30% - 40%). Fabrics characteristics are shown in Table 1. Laminates obtained by overlapping fabrics are described by the type of the fabric, the number of layers and the angle of fiber orientation. These parameters are included in laminate notation [1] Table 2. In order to facilitate uniform penetration of

Composite material test results and finite element analysis: its correlation 47
the resin among laminates a layer of chopped strand mat (CSM) was used. For analysed plates the volume fraction of fibers was determined by expression:
m
m
f
f
f
f
fmm
m
V
, (1)
where the mf and mm is the mass of fibres and matrix respectively; ρf and ρm - density of fibres and matrix respectively. The fiber content by weight was obtained about 66% for unidirectional laminate and 43% for bidirectional laminate. The samples were cut using a cutting disc device then finished according to standard ASTM D3039.
Table 1. Characteristics of fabrics.
Fabric type Number of fibres in
bundle Details
E glass woven roving (WR) 300 g/m2
Warp 600
Weft 600
E glass unidirectional UD 600 g/m2
Warp 2400
Weft 300
Table 2. Characteristics of laminates.
Nr. of specimens Notation Type of tests Plate
thickness, mm 5
[02/CSM/02] tensile x 2,9
5 tensile y 2,9 5
[WR 0-9013/CSM/ WR 0-9013] tensile x 7,2
5 shear 7,2
Figure 1. Composite material samples.

48 Composite material test results and finite element analysis: its correlation
ASPECTS REGARDING REQUIRED MECHANICAL PROPERTIES OF
COMPOSITE MATERIAL
Because unidirectionally reinforced composite materials are part of orthotropic materials that admit three orthogonal planes of symmetry for physical characteristics, the study of a structure having some form made of laminated composite materials and reinforced with continuous fibers requires the following elastic characteristics of a lamina:
E11 – modulus of elasticity of lamina in the direction of fibers (Young);
E12 – transverse modulus of elasticity; G12 – shear modulus of elasticity of the lamina; v12 – Poisson coefficient.
These characteristics are required as input data for finite element analysis of composite specimens. Determination of mechanical properties of material obtained from different layers of fabrics well established fiber orientation. It can only be done by testing. But for laminated composite materials reinforced with unidirectional fibers, approximate estimation of these features can be done using the method of mixtures [3]. Elastic and mechanical characteristics of the material were determined by means of resistive electrical tensometry [3]. Experiments have been conducted in Mechanical Testing Laboratory and Technology, Faculty of Mechanics of the Technical University "Gheorghe Asachi" Iasi. Tests were performed on universal testing machine “WDW-50". The results obtained for the modulus of elasticity were compared with the data from charts provided by the manufacturer of fiber glass fabrics. Dependency graphs of modulus of elasticity for different types of fabrics and the fiber content in the composite material are presented in figure 2. Obtained mean values of the modulus of elasticity in result of testing are marked with discontinued lines. The accuracy of compliance with manufacturing technology and of experiment execution was confirmed to a certain extent by the experiment. Mechanical and elastic values obtained are within the limits provided by the
company producing fabrics of glass fibers. It is evident that the rigidity and longitudinal strength are limited by obtained fibre volume fraction. For hand moulding, the amount of fibers is 30-40%, and using of vacuum assisted resin transfer molding consolidates the material by removing air and the excess of volatile compounds, and allows fiber volume fraction of 50% or more. Using "prepregs" which are unidirectional or woven fibers pre-impregnated with epoxy resin partially cured allows increasing fiber volume fraction.
NUMERICAL MODELING
Real tests of specimens were simulated with finite element analysis software ANSYS. This validation of software is necessary to have greater confidence in subsequent simulation results of parts modeled from tested composite materials.
Figure 2. The dependence of elastic modulus on the degree of reinforcement (chart provided by the manufacturer of glass fiber fabrics for the polyester resin with ρ = 1,2 g/cm3).

Composite material test results and finite element analysis: its correlation 49
In calculation methodology of finite element stiffness matrix the following assumptions relating to material are considered [4]
• each lamina is modeled as continuous medium, linear elastic. Theory does not include cracks, air pockets etc.;
• lamina from composition laminates are orthotropic, parallel and perfectly stuck together;
• fibers are not examined isolated of matrix nor adhesive layer (interface effects are neglected);
• individual layers are bonded ideally to each other. In case of loads application relative slip doesn’t appear;
• material behaves linearly ideal elastic, i.e. for each individual layer is applied law of linear elasticity;
• until delamination joints are considered ideal. All experimentally determined elastic constants were used as input data. Modeling of composite specimens architecture was performed using software ANSYS Composite PrepPost. For specimens meshing four nodes shell finite elements SHELL181 was used. After some preliminary simulations adequate size of finite element was determined for which simulation results converge. In case of tensile test specimen minimal finite element size is 2,5×2,5 mm. For Shear test specimen finite element size is 0,4×0,4 mm.
Meshed specimen and details of nodal displacements and applied load are shown in figure 3, a. The distribution of stresses and strain in the specimen is shown in figure 3, b. Maximum equivalent stress is obtained in the vicinity of fixing mandrel, where is concentrator area. For most specimens material failure occurs especially there figure 3, c. According to the results of the finite element analysis, stresses and strains arising on the rupture region are higher by 10%. In the diagrams constructed by real tests were introduced values of stress and strains from measurement area figure 4. Deviations observed in the diagram of figure 3 are related to the difference between the modality of attachment of the specimen. During the experiment specimen fixation is on the contour (in the chuck) but in the numerical model fixation of the specimen is on the entire section. Because of that higher tensions arise in the outer layers of the specimen. The results of finite element analysis of bidirectional fabric specimens are placed in the diagram representing real tests data, figure 5. Due to the fact that during the experiments two transducers
a. b. c.
Figure 3. Specimen tensile test simulation:
a – boundary conditions in tensile test; b – stress distribution; c – tensile tested specimen.

50 Composite material test results and finite element analysis: its correlation
a. b. Figure 4. Response of the unidirectional laminate to axial and transverse tension:
a – longitudinal loaded specimen; b – transverse loaded specimen.
Figure 5. Responses of the bidirectional laminate to axial tension.

Composite material test results and finite element analysis: its correlation 51
a.
b.
Figure 6. Specimen shear test simulation: a – boundary conditions; b – stress and strain
distribution.
Figure 7. Response of the bidirectional laminate to in-plane shear loading.
were damaged and erroneous data were recorded, in the diagram are displayed results for only three specimens. For bidirectional fabric, as is shown in the diagram, the results correlate excellent. Details of nodal displacements and shear loading of meshed specimen model is shown in in figure 6 a. Specimen model boundary conditions have been set taking into account the recommendations in [5]. Stress distribution in the specimen is shown in figure 6 b. Shear stresses and sliding deformations were considered in the measuring transducer area. Comparative chart with the results of finite element analysis superimposed on the test results is shown in figure 7. Given the fact that shear loaded specimen has nonlinear behavior after about 10-12% of the specific deformation (slip) it is normal that curves do not correlate on the entire loading domain.
CONCLUSIONS
For the composite materials reinforced with fabrics were verified cases that influence the correlation of test results with finite element analysis results. First of all, it is important correctness of the determined elastic characteristics of the test material
and the errors reducing. Another aspect is related to numerical modeling of the experiment which must be performed as close to the real test. This is achievable only by using special software with modeling capabilities of the composite material and finite element analysis. Deviations that occur between the numerical model and experiment can be caused by the size of finite elements. In this case were determined finite element dimensions for which simulation results converge. Setting of the specimen boundary conditions also affects results of the simulation. In this case fixing conditions of the real specimen cannot be respected in the numerical model. This is due to the fact that the real specimen is clamped in chuck on the contour, but the numeric model specimen is fixed on the entire section. For this reason, in the specimens formed from multiple layers stresses and strains are higher in the outer layers. To reduce this measurement error special strain gauges are used that are inserted between layers of fabric at the stage of manufacturing of composite material. Also, it is very important that for simulated specimen, to consider stresses and strains from the same section with the bonded strain gauges. Based on the obtained results it was created a database of mechanical characteristics of the
0
10
20
30
40
50
60
70
80
0 0.01 0.02
Shear stress, τ
Shear strain γ, %
WR4
WR5
ANSYS

52 Composite material test results and finite element analysis: its correlation
composite materials for the development of the new concepts in the Centre for Developing of Renewable Energy Conversion Systems. Also, the recommendations of composite material architecture and the blades manufacturing technology were defined, which in the future, will allow serial production of aerodynamic blades for small wind turbines.
Bibliography
1. Bere P. Cercetări teoretice şi experimentale privind fabricaţia şi comportarea mecanică a tuburilor din materiale compozite polimerice. Teză de doctor în tehnică. Cluj-Napoca, 2009. 233 p. 2. Richardson D. The fundamental principles of composite material stiffness predictions. Presentation, University of the West of England. http://compositesgateway.org/ (visited on 16.02.2016). 3. Bârsănescu P. D., Bejan L., Mocanu F., Bâtcă C. Tensometrie electrică rezistivă aplicată la materiale compozite. Editura Tehnopress, Iaşi 2004. 250 p. 4. Natanail R. Cercetări privind concepția şi fabricația pieselor din materiale compozite pentru producția specială din industria auto. Rezumat. Teză de doctorat. Sibiu, 2011. 76 p. 5. Lourenco N. F. S. Predictive finite element method for axial crush of composite tubes. Thesis of Doctor of Philosophy. University of Nottingham, 2002. 178 p.
Recommended for publication: 28.09.2016

SCADA system application in wastewater treatment plants 53
SCADA SYSTEM APPLICATION IN WASTEWATER TREATMENT PLANTS
1N. Ciobanu, superior lecturer, 2V. Buțanu, 1N. Secrieru, assoc.prof., PhD., 1D. Ungureanu, assoc.prof.
1Tehnical University of Moldova 2SC SALONIX-TEH SRL Moldova
1. INTRODUCTION
Network collecting and evacuating of
wastewater from Moldova, including Chisinau, spanning hundreds of hectares and is a compex hierarchical distributed of inputs and outputs. The modality traditional management and maintenance of these complexes is very inefficient, impossible. From the analysis of this complex, just based on the study of other information sources [1-6], found it advantageous to implement a management system, enabling the state to identify complex data acquisition, to plan and control this complex in any conditions. The whole complex is divided into several zones, where different processes occurs. In each area locally it will perform a data acquisition on the allocated processes and convert these digital data for the process parameters regulation by a microcontroller, using actuators and/or transmit data and alarm signals at a higher levels. The implementation of the SCADA system will have a positive impact on the operations, maintenance, process improvement and savings for these wastewater treatment plants (WWTP). The Municipality of Chisinau annonced implementation of a program modernizing the water supply and wastewater services in order to improve living conditions, reduce health risks for its population and to prevent excessive exploitation
of natural resources and environmental pollution. This paper will discuss the system's
evolvement, the architecture and it will demonstrate the system's successes in monitoring the sewage and sludge collection/distribution systems and wastewater treatment plants, complying with the requirements on the discharge, and effectively reducing the operations and maintenance costs.
2. SCADA SYSTEM ARCHITECTURE FOR THE WASTEWATER
TREATMENT PLANT
The Chişinau wastewater treatment plant (Chisinau WWTP) is located southeast of the city, approximately 7km from the city centre, beside the River Bic into which the final effluent is discharged. With the low flows and the fact that it is within the city area, flowing ultimately into the Black Sea, under EU standards it would be classified as a sensitive watercourse (fig. 1). The wastewater flow to the works is approximately
152,000 m3/d, considerably below the works design capacity [7].
Studying the structure, capabilities and parameters WWTP Chisinau and taking into account the needs of the objects in discussion, initially we will formulate the basic requirements for conceptual SCADA system (fig. 2). The SCADA system shall provide a strategy for Real-time solutions that shall go beyond SCADA, offering the end user access to an open and enterprise-friendly data management system. Included in the SCADA system’s family of products shall be a Graphical User Interface (GUI), a fully integrated Real-time subsystem, and a fully integrated Relational Database Management System (RDBMS).
The SCADA system shall also provide for easy and open integration with third party application software via non-proprietary industry standards. The SCADA system shall allow the user of the system the flexibility to accommodate diverse business applications. The SCADA system shall provide capability to extend Real-time data from the
Figure 1. The Chisinau wastewater treatment plant.

54 SCADA system application in wastewater treatment plants
field to the enterprise by providing access to operational and historical data anytime, and anywhere.
The SCADA system shall allow corporate information systems and specialized applications packages access to the SCADA data. The SCADA system architecture shall utilize non-proprietary industry standards all to enable transparent connectivity to other hardware, software, and networks. The objectives of performance, flexibility, expandability and open access are fundamental in determining the utility and longevity of any SCADA system. The SCADA system shall utilize a software architecture that allows functions to be mobile, flexible and robust. It shall also permit distribution of processing among different SCADA system components to optimize overall system performance.
The SCADA system shall conform to the concepts of a distributed information system. Components must have the ability to share historical and real-time data between independent systems and geographical locations. This shall enhance the overall system reliability and functionality by providing shared access to components and applications. The distributed system shall provide configuration options that allow multiple systems to share telemetry data, alarming, eventing, telecommunication, and control functionality. User permissions and security restrictions regarding all
aspects of the system shall propagate seamlessly across the SCADA system’s distributed architecture.
It is proposed all computers in the SCADA system shall connect with each other using the latest industry standard Local-Area Network (LAN) and Wide-Area Network (WAN) technologies. Multiple LANs, WANs, bridges, servers and routers shall complement each other to meet the requirements of system performance, reliability, security and expandability. System peripherals shall connect either directly to the system's LAN, through servers connected directly to the system's LAN, or attached to workstation parallel or serial ports. This shall allow access to any device from any computer in the system with the appropriate access authority. The system shall provide support for distributed network equipment such as networked printers, networked PC's, and mass storage/backup devices (fig. 3).
The SCADA system shall be configured using industry standard, unmodified, hardware and software. The hardware and software supplier's standard products shall constitute the primary components for the system. The system shall not be dependent upon specialized, unique, or proprietary equipment or software available from only a single supplier to the greatest extent possible.
The system shall provide bi-directional item-by-item replication of data between systems. To handle the large amounts of data being exchanged between
ApplicativeServers Servers
Data BaseServersSCADA
PLC network (Ethernet)
SCADA network (Ethernet)
Business network (Internet)
Operators(monitoring)
Operators(modelling/development)
Sensors data aquisition, pomps, valves, electrical motors control
... ... ...Sensors data aquisition, pomps, valves, electrical motors control
Figure 2. The conceptual WWTP plant SCADA architecture.
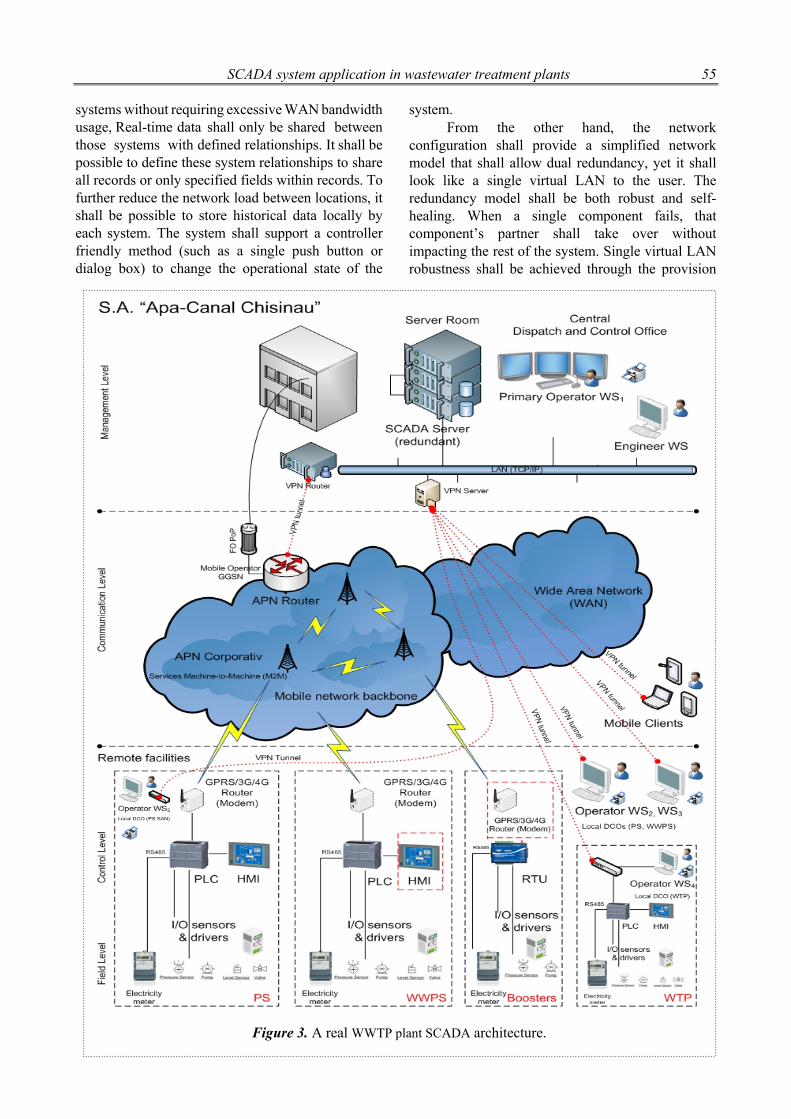
SCADA system application in wastewater treatment plants 55
systems without requiring excessive WAN bandwidth usage, Real-time data shall only be shared between those systems with defined relationships. It shall be possible to define these system relationships to share all records or only specified fields within records. To further reduce the network load between locations, it shall be possible to store historical data locally by each system. The system shall support a controller friendly method (such as a single push button or dialog box) to change the operational state of the
system. From the other hand, the network
configuration shall provide a simplified network model that shall allow dual redundancy, yet it shall look like a single virtual LAN to the user. The redundancy model shall be both robust and self-healing. When a single component fails, that component’s partner shall take over without impacting the rest of the system. Single virtual LAN robustness shall be achieved through the provision
Figure 3. A real WWTP plant SCADA architecture.

56 SCADA system application in wastewater treatment plants
of: - Dual intelligent redundant switches; - Each switch shall be interconnected, providing
the advantage of network communication between cards and redundancy in case of the failure of one card.
- Dual intelligent redundant network cards - The use of intelligent cards and drivers shall
provide for the cards to sense when a network or the other card fails, resulting in the healthy card taking over.
- Floating IP addresses - For a pair of redundant servers, a single address
shall be assigned to the active server. This shall allow connectivity to active servers without having to know what physical machine is currently active. The system shall provide a fail-over mechanism
that shall be an inherent part of the SCADA system. The system shall provide critical task monitoring by health monitoring software to ensure system robustness. Monitor processes periodically shall ask critical software components to check in. If the critical component fails to check in, that one component and all its sub-components shall fail-over; all others shall stay live.
Based on the conceptual architecture, we propose real architecture of SCADA system for WWTP Chisinau [5], taking into account its characteristics and distributed geographical structure (Fig. 3) .
A SCADA System’s components are comprised more CPU’s (PC’s and Servers), PLC’s/RTU’s, I/O Subsystems, Video monitors, Field Sensors, Control Devices (fig. 3) and lots of software that drives the I/O, runs the control algorithms, generates control outputs, displays graphics and monitored values, senses alarm statuses, and stores the monitored points in a series of data files that can be archived and recalled at a later time for analysis or process verification.
Control systems with multi-level architecture usually built on object principle, when the structure of the system selects a similar structure of the automation object, and each subsystem is local, that is, feedbacks are closed within this subsystem [8,9]. Each local subsystem performs a separate function that, given the logic of the whole system. Object principle of construction can simplify the design of a multi-level and to ensure its structural/ architectural reliability. The philosophy of the design shall be simplicity and reliability such that the equipment shall have long trouble free service with low maintenance cost, low energy
consumption and low disturbing impact on the environment.
CONCLUSION SCADA system is used to describe a multitude
of computer-based control systems that allow operators and facility personnel to monitor and control a facility’s equipment either locally or remotely. The SCADA system will automate much of the control process such that WWTP plant operators can focus on other task. The propsed SCADA systems will give the users/operators flexibility to manually control the equipment where desired. SCADA systems are also installed to collect and store information for reporting, trouble-shooting, maintenance indications, and much more. There are some advantages to having the proposed SCADA system, such as: Ability to significantly reduce operating costs,
while improving system performance and relia-bility;
Costly after-hours alarm call-outs can often be avoided since a SCADA system will indicate the nature and degree of a problem;
Since data is continuously recorded, operators do not have to manually read and record meter readings on a daily basis.
Operators do not have to keep track of hundreds of log sheets as any data recorded on the SCADA system can be downloaded and ac-cessed at their convenience.
Bibliography
1. Alley R. E. P.E. Water Quality Control Handbook, McGraw-Hill, Inc, 2000 2. Robescu D., Robescu D. ş.a. Controlul automat al proceselor de epurare a apelor uzate, Editura tehnică, Bucureşti 2008. 3. Energy-Efficient Activated Sludge Monitoring for Wastewater Treatment Plants. - http://cordis.europa.eu/project/rcn/206345_en.html 4. SCADA system for wwtp and pwtp process management. - http://www.cm-bg.eu/articleen-143.html 5. Supervisory Control and Data Acquisition System (SCADA) for Chisinau Water Supply and Wastewater Facilities. - S.A. “Apa-Canal Chisinau”, December 2015, 256p. 6. Secrieru N., Caraulean V. Distributed microcon-trollers network for thermo – and electropower

SCADA system application in wastewater treatment plants 57
station decentralized control. Proceeding of ICMCS-2002, Chişinău, 2002. 7. Ciobanu N., Secrieru N. Procedee și algoritmi de control automatizat ale procesului de epurare a apelor uzate. – Meridian Ingineresc, Nr. 3, 2016. p. 28-35. 8. Implementarea Programului de Investiţii Prioritare al Apă-Canal Chişinău avansează - https://monitorul.fisc.md/editorial/implementarea_programului_de_investiii_prioritare_al_apa-_canal_chiinau_avanseaza.html.
Recommended for publication: 25.08.2016.

58 Quality of local goat milk depending on the season
QUALITY OF LOCAL GOAT MILK DEPENDING ON THE SEASON
Viorica Bulgaru, dr., assoc.prof. Technical University of Moldova
INTRODUCTION
In the current targeting of nutrition a increasing extent to agricultural and food products with high nutritional and biological value need for food, especially animal grows increasingly more.
The assortment of dairy products in the world and especially in Moldova is diverse. Every year there are about eight thousand new food products, of which one third are dairy products. The basic problem of specialists and producers of food is to create the possibility of competition by high indicators of quality and safety of human health, to satisfy consumer demands and competitive price [1, 2, 3 ].
Milk is the main purpose for which goats are bred in Moldova. In this context the quality and milk production should be strengthened as a primary criterion for goat farms. [4,5].
Goat's milk is considered superior to cow's milk due to the effects of nutrients, toning and rickets, anemic and anti-infectives. It has specific taste and smell, pleasant, in case of maintenance and milking hygiene and proper feeding [4,5].
Goat milk is widely used for home consumption worldwide and used to produce different cheeses and yoghurt. There is much historical information about consuming goat milk. Herding of goats is thought to have evolved about 10.000 years ago in the mountains of Iran, making goats one of the oldest domesticated animals [6]. Goat milk, and the cheese made from it was venerated in ancient Egypt. [6] The top producers of goat milk in 2008 were India (4 million metric tons), Bangladesh (2.16 million metric tons) and the Sudan (1.47 metric tons.) [7]. The Mediterranean region produces 18% of the world’s supply of goat milk [8]. According to information given by FAO [9], the goat is believed to be the first true livestock domesticated and world goat milk production reached 15.2 million tons most of it being used by households or families. Europe produces only 2.5% of the world goat milk, but it is the only continent where goat milk production has significant economic importance and organization [10].
The variation in the compositions of milk and the total yield of milk within a species depends on different factors. Some of these factors are
physiological factors, genetical factors and climatic (or precisely micro-climatic) factors. Some physiological factors are stage of lactation, age, udder health and type of diet. Daily variation and season changes can be taken as the climatic factors [8, 9]. Lactation periods as well as climatic conditions are generally termed as seasonal changes which have a great influence on the milk constituents.
Thanks to its nutritive, taste and dietetic values, goat’s milk is recommended to children (above 8 months of age), allergy sufferers, elderly people and convalescents. Goat’s milk is therefore considered the 21st century food, i.e. health-promoting or functional food [11].
The goal of the present study is to determine the general composition of local goat’s milk and to find out the effect of seasonal variation on its constituents.
1. MATERIALS AND METHODS
1.1. Materials
Row goat milk, without added preservatives.
Analyses were carried out in triplicate. Goat milk has been received from farms in the South, Center and North of Moldova, during lactation of 2016. Sample 1 – goat milk received from farms in the North of Moldova. Sample 2 –goat milk received from farms in the Center of Moldova. Sample 3 –goat milk received from farms in the South of Moldova.
1.2. Methods
Sensory quality assessment based on the scoring ladder. Organoleptic assessment of each by comparison with ladders scoring 0 ....5 points and getting the group average score of tasters, (ISO 6658:2005)
where: Pmnp – unweighted average score;

Quality of local goat milk depending on the season 59 fp – weighting factor (shown as part of a total sensory characteristic sensory quality of the product).
The process of chemical analysis of milk samples was based on standard methods. For the chemical analysis of milk Total dry meter (Mac 50/WH). Fat, butirometric method was used (GOST 5867). Protein in the milk samples was estimated using fresh neutralized formaldehyde. The pH value was measured by using digital pH meter (SevenGO SG2 ELK). Acidity was measured by titration method (GOST 3627) in terms of Thorner᾽s degree. Density (GOST 3625), purity degree (GOST 8218).
2. RESULTS AND DISCUSSIONS
Milk and milk products are an important group of food products as they contain many different nutrients that are essential for normal growth and functioning of the body [11].
Goat’s milk contains vitamins, minerals, trace elements, electrolytes, enzymes, proteins, and fatty acids that are easily assimilated by the body. Goat’s milk has a similarity to human milk that is unmatched in cow milk and also has several medicinal values. In 1981, Le-Jaouen reported that goat’s milk has similar vitamins contents of human milk except lower content of folic acid, Vit. C and Inositol [12]. With respect to its mineral composition, in general the levels measured of the principal elements, and the nutritional use made of them, show it to be of higher quality than cow milk (Moreno, 1995; Boza and Sanz Sampelayo, 1997; Haenlein, 2001; Campos et al., 2003) [13].
Taking into consideration the research conducted on the goat milk in different countries, a study of local goat milk properties would be welcome. Scientific studies have been conducted to samples of milk collected in the South, Central, North Moldova.
2.1. Organoleptic indices
Today, goat milk is of particular interest due
to its specific composition, which has led to it being considered a high-quality raw material for manufacturing food for infants and the elderly, as well as for certain sectors of the population with particular needs (Haenlein, 1992, 1996, 2004; Boza and Sanz Sampelayo, 1997; Park, 2006) [13].
02468
1012141618
Score awarded
Sample 1 North Sample 2 Center Sample 3 South
Figure 1. The score awarded sensory quality of goat milk depending on the season
Sensory Quality rating was carried out based on the scoring scale of 5 to 20 points. After evaluating the sensory quality level of food in 20 point system, all milk samples obtained during investigations qualifiers between 15-18 points, corresponding quality characteristics "GOOD" (figure 1.). Sensory quality of milk is characterized by goats forage quality and hygienic conditions of their maintenance, these indicators depend on the season. Respectively, proceeding from results obtained maximum values of milk collected in the center of Moldova and the lowest values it obtained the milk collected in the south. 2.2. Physico-chemical indices
Table 1, 2, 3 and 4 shows the chemical composition of the local goat milk. Table 1. Goat milk physico-chemical indices received in spring months 2016.
Physico-chemical indices
March April May
North Center South North Center South North Center South
Temperature, °C
21 20 21 21 20 22 21 21 21
pH 6,9 6,97 7,03 7,2 7,2 7,1 6,9 6,9 7,1 Density,
g/cm3 1,025 1,024 1,028 1,021 1,018 1,026 1,026 1,022 1,028
Titrable acidity, °T
19 19 19 19 19 18 19 19 19
Dry metter, %
12,3 12,6 13,2 12,0 12,0 12,8 11,4 12,0 10,8
Cleaning degree
I I I I II I I I I
The total solids content of milk is increasing
starting June and have the highest values in the last period of lactation [14].
The titratable acidity and pH are usually milk quality indicators, but it can be affected by lactating, which dictates the chemical composition of milk.

60 Quality of local goat milk depending on the season Table 2. Goat milk physico-chemical indices received in summer months 2016
Physico-chemical indices
June Guly August
North Center South
North Center South North Center South
Temperature, °C
19 21 20 20 19 19 20 19 18
pH 6,81 6,55
6,62
6,60 6,48 6,57 6,53 6,41 6,45
Density, g/cm3 1,028 1,026
1,027
1,028 1,025 1,030 1,029 1,029 1,027
Titrable acidity, °T
19 20 18 18 20 19 19 18 18
Dry metter, %
13,4 14,2 7,1 10,1 8,4 9,5 12,4 9,2 10,5
Cleaning degree
I I I I I I I I I
Table 3. Goat milk physico-chemical indices received in the autumn months 2016
Physico-chemical indices
September Octomber
North Center South North Center South
Temperature, °C
19 19 18 18 19 18
pH 6,53 6,73 6,91 6,63 6,72 6,84 Density, g/cm3 1,030 1,031 1,030 1,030 1,029 1,030 Titrable acidity,
°T 18 20 19 20 19,5 18
Dry metter, % 16,11 11,14 13,75 16,29 14,31 15,23
Cleaning degree I I I I I I
Table 4. Goat milk physico-chemical indices received in the autumn – winter months 2016
Physico-chemical indices
November December
North Center South North Center South
Temperature, °C
19 18 19 18 18
pH 6,72 6,68 6,62 - 6,63 6,92 Density, g/cm3 1,028 1,029 1,029 - 1,030 1,032 Titrable acidity,
°T 16 17 20 - 19 21
Dry metter, % 20,42 15,43 18,82 - 15,83 18,83 Cleaning degree I I I - I I
December goat milk in the north was not collected because of the interruption lactation period (bad weather).
The special characteristics concerning the composition of goat milk, in terms of its principal nutrients, mean that the nutritional utilization of the latter is markedly higher than is the case with cow milk. Thus, the protein of goat milk is more digestible (Park, 1994; Boza and Sanz Sampelayo, 1997; Haenlein, 2001, 2004; Lo´ pez-Aliaga et al. (2003), and at the same time it is more tolerable (i.e. less allergenic) (Bevilacqua et al., 2001; Lara-Villoslada et al., 2004; Sanz Ceballos, 2007). It was observed that the protein content of goat milk significantly affected due to season and the average protein decrease from march to April, but till summers month protein content is stable. Starting July there was an gradually increase in protein content increased (figure 2). The findings of present investigation are in agreement with Haenlein (2002).
Figure 2. The values of protein content in goat milk depending on season and geographical area.
in December, the fat milk collected in the South did not separate because of high viscosity and change the composition of milk, normal effect in the last months of lactation.
Figure 3. The values of fat content in goat milk depending on season and geographical area.
Similarly, the fat of goat milk is more
digestible (Alfe´ rez et al., 2001; Haenlein, 2001), and it may be considered an excellent source of energy for use in various metabolic processes (Boza and Sanz Sampelayo, 1997; Sanz Ceballos, 2007) and even for combating metabolic diseases (Babayan, 1981; Garcı´a Unciti, 1996; Vela´zquez et al., 1996) [13]. According to table results, fat content was highest in march but in the following months decrease, and the lowest fat content was obtain in June, after what it began increase (figure 3). Effect of season and lactation showed significant differences on fat content of milk. The findings of present investigation are in agreement with Charnobai et al. (1999) and S.S.Bhosale et al. (2009) reported that the lactation period influenced the fat content of goat milk.

Quality of local goat milk depending on the season 61
CONCLUSIONS
Milk is the main purpose for which goats are bred in Moldova. In this context the quality and milk production should be strengthened as a primary criterion for goat farms
Organoleptic indices determined for the local goat milk presented characteristics specific for full goat milk without deviations except milk collected in the South in April that were detected contaminants from feed.
Within the same species and breeds season has great influence in the milk composition. Collected milk in the first lactation period is rich in protein and fat, as these components decrease and since July there is a slow increase.
Raw milk characterization constitutes a preliminary and an important step to take account in order to obtain an optimal technological valorization. Among other factors, breed, feed and season or stage of lactation are the most important factors that influenced cheese making and other dairy products valorization.
Bibliography 1. Ried K. Gastrointestinal health. The role of pro- and pre-biotics in standard foods. //Aust. Farm. Physician. 33(4): 253-255, 2004. 2. Patermann C. EU Strategies for life sciences and biotechnology research. // 3rd Moscow International Congress “Biotechnology: state of the art and prospects of development”, Moscow, 2005. 3. Senderov B. Meditinscaia microbnaia ecologhia i functionalinaia pitaniea. Editura Granti, 1998. 4. Taftă V. Producţia şi reproducţia caprinelor, Ed. Ceres, Bucureşti, 1996. 5. Taftă V. Producţia şi reproducţia caprinelor, Ediţia I, Ed. Ceres, Bucureşti, 2002. 6. Haenlein G.F.W. About the evolution of goat and sheep milk production. Small Ruminant Research 68: 3-6, 2007. 7. FAOSTAT. Statistical Database of the Food and Agriculture Organization of the United Nations on Agriculture, Nutrition, Fisheries, Forestry, Food Aid, Land Use and Population, FAO Publisher, Rome. Available from URL: http://www.faostat.fao.org/ Accessed 24 ⁄ 3 ⁄ 2010. 8. Pandya A.J., Ghodke K.M. Goat and sheep milk products other than cheeses and yoghurt. Small Ruminant Research 68: 193-206, 2007.
9. FAO. Statistical Year Book. Food and Agriculture Organization of the United Nations Statistics Division. URL http://faostat.fao.org/. Accessed 7 ⁄ 6 ⁄ 2010. 10. Ulusoy Beyza H. Nutritional and health aspects of goat milk consumption. Review Paper, Akademik Gıda 13(1) 56-60, 2015. 11. Bernacka H. Effect of breed and feeding season on the nutritive quality of goat’s milk. Folia biologica (Kraków), vol. 53, Supplement, 99-102, 2005. 12. Hayam M. Abbas et. al. Physicochemical characteristics of goat’s milk. Life Sci J; 11(1s):307-317]. (ISSN: 1097-8135). http://www.lifesciencesite.com, 2014. 13. Ceballos Laura Sanz, et al. Composition of goat and cow milk produced under similar conditions and analyzed by identical methodology. Journal of Food Composition and Analysis 22, 322–329, 2009. 14. Bhosale S.S. et. al. Effect of lactation on physico-chemical properties of local goat milk. Veterinary World, Vol.2(1): 17-19, 2009.
Recommended for publication: 21.07.2016.

62 The formation and testing of the tribological layers sprayed in the plasma jet
THE FORMATION AND TESTING OF THE TRIBOLOGICAL LAYERS SPRAYED IN THE PLASMA JET
Eduard Galușca
Technical University of Moldova
INTRODUCTION
The materials used for installations from the food industry, demand special requirements - as high resistance to wear, corrosion...
To solve some of these problems, so to increase the tribological proprieties and also to increase the reliability of installations with less expensive materials, the formation of wear resistant layers in couples of friction is proposed. The layers are made from powders containing these components in different proportions: Cr, Ni, Ti, Mn, Si, Al ... The surfaces of pieces are coated with powder through the plasma jet.
1. THE RESEARCH METHOD
The thermal spray process with plasma is
based on the formation of the plasma jet in which the powders are introduced. The materials are melted, mixed and projected on the base material, thus achieving covering layers -composite type. The principle consists in passing a powder material by plasma jet - generated by an electric arc of plasma generator. Due to high temperature the powders melt and are entrained by the gas to the base material. The particles in plastic state adheres to the surface of the base material due to specific mechanisms. The impact between molten particles and the substrate leads to their solidification on the substrate forming thereby the deposition.
The quality of deposited layers through the plasma jet and the coating process depends on the physic-technological properties of sprayed materials.[1,2] The powders- ПГ-СР2, ПТ-19Н-01, ПС-12НВК-01 ПР-Н17Д7СХ, ПН85Ю15, СНГН-50 and various proportions of Al2O3 and Al have the particle size of 40-90 μm. The deposition was carried out at УПУ-3Д installations. The mixture of CO2 + C3H8 + C4H10 (carbon dioxide and natural gas propane-butane) was used as a plasma former.
The protective properties of plasma coatings and the quality are determined by the physicochemical characteristics of powders and the pieces subjected to spraying; technological characteristics of the process equipment; kinematic
and the type of deposition; thermal, deformation and thermochemical phenomena at the interaction of powders particles with the surface.[3,4,5]
The high adherence of the layer that forms the roof with the base material is a compulsory condition, but not decisive in the choice of material for sliding bearings. The decisive factor is the roof property to operate without grip in certain working conditions (load, slip rate, fluid viscosity and chemical activity).
The assessing of the compatibility of materials is made according to the size of critical load, at which the gripping or scuffing phenomenon is observed (tribological system vibration, stream variations) [3,6,8].
Checking for compatibility in laboratory conditions was per formed with water as lubricant.
Friction power loss was determined as the difference between the total power used by stand in working with couples (WE) and the work-load power (We, g):
ΔW=WE-We,g. (1)
The Power loss coefficient of friction is determined from the relationship:
KTP= (WE – We,g )/ WE , (2)
We, g - the work-load power (kW), WE - stand power (kW) to a thermal regime of a specific task set
Pi sp = Pi / Sp , (3)
Pi –bearing load on the regime i (N), Sp - working surface of the specimen (m2)
Sp = S - Sk ; S= π(Re2- Ri
2), (4)
Re – internal ray (m), Ri – external ray (m).
Sk = a · l · n , (5)
a- groove width for cooling (m), l- groove length for cooling (m), n -Number of grooves
Specific task of determining radial bearings:
Psp, rad = Pi / Srad , (6)
Pi –Summary of radial bearing (N), Srad = d L, d - external diameter of the bush (m), L - length bush leaning on bolster(m).
The formation and testing of the tribological layers sprayed in the plasma jet 63
In the experiments, the specific task of
sliding bearings is specified depending on the actual contact surface that is formed on the surface of the bush after running under load:
Psp, F = Pi / SF , (7)
SF –actual contact surface of the bush (m2). Wear speed of friction couple material was
determined by the expression:
v = ΔU /T , (8)
T- time of experiments (h), ΔU = ΔU1 + ΔU2 , ΔU1 – wear bushing sliding bearings or specimen (mm), ΔU2 – sliding bearings wear (mm).
Operating time of sliding bearings to limit state is determined by the expression:
Tlim = ΔUlim / vmed (h), (9)
ΔUlim – allowable wear limit value regulated by technical documentation (mm), vmed –auverage speed wear of materials friction couple (mm/h).
2. THE RESULTS
The results of experiments have shown that the layer that consists of materials containing nickel with the addition of chromium, boron and other components, work well in a couple with pieces whose hardness is lowerthan the layer, Fig. 1.
The layers formed of powders ПТ-01-19Н in couple with AMC – 3 and APB-200-B83 material, works at minimal friction power. A stable operation was determined with rubber 7-3825C this power, at this couple the friction power increasing slower than the couple with grafitoftoroplast 7B-2A at an increased specific pressure from 0.49 MPa to 2.45 MPa (the rubber from 0.32 to 0.58 KW ; 7B-2A from 0.18 to 0.7 kW). The layer consisting of ПТ-19Н-01 powders is incompatible in couple with materials containing silicon carbide and namely CГ-Т and "СУГВАМ" material. At their functioning in couple the galling occurs at a specific pressure of 1.47 MPa at a sliding speed v = 15.7 m / s. The effect of galling occurs also at ПТ-19Н-01and "СУГВАМ" couples of friction. The increased friction power demonstrates the incompatibility of these couplers in these working conditions. Other materials as: the AMC-3, the 7-3825 rubber, APB-200-583, АГ-1500-583, 7B-2A at a functioning in couple with ПТ-19Н-01 demonstrate that they are compatible, but their use is desirable to a specific pressure of 1.47MPa. The functioning at such pressure allows the removal of the heat from bearings, increasing the reliability of tribological
system. The layers formed of ПГ-СР2 powders are
slightly different from ПТ-19Н-01 by the chromium content: the chromium content constitutes 12-15% in ПГ-СР2 powders, and from 7.9% to 14% in ПТ-19Н-01 powder. The layer from these powders works well in couple with 7B-2A material. The friction power depending on a specific pressure for this couple of friction is minimal. At a pressure of 0.49 MPa it constitutes 0.15 -0.16 kW and at 1.96 MPa – 0.44 kW.
Research has shown that at the ПГ-СР2 couples of friction and grafitoftoroplast KB, have approximately the same results. At light load the consumption of power at friction is lower for these selected couple than when operating with 7B-2A. But with an increasing load the power is intensified. The ПГ-СР2 couples with rubber and with APB-200-Б83 works stably without galling.
The ПГ-СР2 layer in couple with AMC-3 operates inadequate due to an increased consumption of power at friction. This couple of friction consumes 0.5 kW at the load of 0.49 MPa, while for the other couples the power load is 0.16 kW. For the ПГ-СР2 layers, formed in the plasma jet, the regimens with specific voltages not higher than 1.47 MPa are recommended
The layers formed of СНГН-50 powders (without melting) at the functioning in couple with established materials, have increased power consumption at friction. This is due to a high porosity and a low hardness of the layers, since the spraying was carried out without melting. The hardness increases to values of 47-57 HRC when the powders are melted. The power at friction is minimum for the couple of СНГН-50 and КВ grafitoftoroplast. At the load of 0.49 MPa this couple of friction consumes power at friction of 0.12 kW. For the mentioned layer in couple of friction with grafitoftoroplast 7B-2A material, at a specific pressure of 0.49 MPa, the friction power is 0.35 kW, so it is 3 times higher. The couples with 7B-2A and KB material at an increasing specific pressure to 1.96 MPa work identically. At a further increasing specific pressure the power at friction increases at СНГН-50 and KB material.
The materials containing graphite and added metals (АГ-1500-Б83 and APB-200-В83) at a specific pressure greater than 1.47 is not working in couple with СНГН-50. The friction power constitutes 1.32 kW for the couple of friction consisting of material АГ-1500-Б83 and СНГН-50 at a specific pressure of 2.45 Mpa, and for the couple with 7B-2A material, the friction power is 0.52 kW. For KB and 7B-2A materials the

64 The formation and testing of the tribological layers sprayed in the plasma jet
recommended regimes at a specific pressure in couple with СНГН-50 can be increased to 2.45 MPa. The couple of friction СНГН-50 with СУГВАМ material has demonstrated a satisfactory function, although the galling starts at minimum specific pressure of 0.49 MPa, in couple with the layer formed from СГ-Т and СУГВАМ powders. The lack of galling of these couplers of friction is due to poor quality of the surface of sliding bearings. Almost all sprayed layers with hardness less than 45 HRC in couple with СУГВАМ and the lubricant water, is galling at small specific pressures.
The layers formed in the jet of plasma from ПН-85Ю15 powders, having at the base the nickel with the addition of aluminum, showed antifriction properties. The couplers formed from the ПН-85Ю15 layer and studied materials, operate quite difficult. At a minimum specific pressure, increased power consumption at friction is observed. At loads of 0.49 MPa, the friction power varies from 0.3 kW for 7B-2A material up to 0.45 kW in couple with APB-200-В83. Further, at the increasing of specific pressure, sharply increases the power at friction and the galling occurs (for materials of couplers of friction). The exception is the couple with AMC-3 material.
This is due to aluminum particles that cling to the working surface of the studied material and afterwards produce the galling. An analog behavior was determined at the surfaces formed in the jet of plasma, the powders representing Al2O3+ 10%Al and 70% AL2O3+30%Al.
The ПС-12НВК-01 powder material was accepted to form layers in the jet of plasma of sliding bearing surfaces, because of high antifriction properties. These capacities are due to the material components consisting of 35% wolfram carbide WC, 14% chromium and the base nickel base, 14% chromium and nickel as a basis. The low power consumption at friction of ПС-12НВК-01 layer in couple with АМС-3 antifriction material, allowed recommending this couple of friction for research at all specific pressure values. The results show that the power consumption at friction does not exceed 0.4 kW.
A practical interest presents the specific loads of 1.47 MPa with power consumption at friction of 0.2 kW, because the calculated values of specific radial loads of submersible electric pumps do not exceed these loads values. The carbide component of the ПС-12НВК-01 layer in couple with СУГВАМ material, make possible to avoid the galling at values of specific pressure from 0.49 MPa to 2.45 MPa. The ПС-12НВК-01 layer in
couple with other antifriction materials, works well only for specific small loads up to 0.98 MPa. The galling process is observed at the functioning in couple with KB antifriction material, at an increased specific load up to 1.96 MPa.
The adherence to the base material depends on the intermediate layer. At the roof formation of 90% Al2O3+ 10%Al on the basis of 12X18H10T with intermediate layers ПT-HA-01 and ПН85Ю15 a different adhesion is obtained. It is because of powders composition ПТ-НА-01 (ТУ 48-4206-156-82) that contains 4 5 % Al, 96 % nickel and ПН85Ю15 (ТУ 14-1-3282-81) contains 12-15% Al and the rest is nickel.
The research has shown that the layers from ПC-12HBK-01 powders on the basis of 3 steel, with ПT-HA-01 intermediate layer, have an adherence of 16.2 MPa. The distance from the coating surface to the electrode was 180 mm. The adherence of this layer to the basis of 3 steel, without intermediate layer constitutes only 10, 4 MPa.
When placing the coating without an intermediate layer, the coefficient of linear expansion differs substantially and therefore the adherence of the roof to the surface, decreases. A high adhesion was determined at the layer ПH55T45, without intermediate layer based on titanium 3M alloy, constituting 13.5 MPa.
The CГ-T (П) roofs with ПT-HA-01 intermediate layer and ПГ-AH9 (without intermediate layer) based on 3 steel showed a low adherence and constitutes 7÷7, 5MPa.
ПТ-19Н-01 layer formed by plasma jet [1, 2] works well in a couple with 7-3285 rubber, AMC-3 and APB-200-Б83. The loss of power at friction at a specific pressure of 0.48 MPa are at rubber ÷ 2.45 - 0.32 ÷ 0.58 kW at grafitofluoroplast 7B-2A - 0,18 ÷ 0,7 kW. It is reasonable to use these couplings to a specific task not exceeding 1.5 MPa to remove the heat from the couple, increasing the reliability of tribotechnical system.
ПГ-CP2 layer contains a higher percentage of chromium (12 to 15%) than ПТ-19Н-01 (7.9 to 14%) and works very well in a couple with 7B-2A grafitofluoroplast. The loss of power at friction depending on the specific task at this couple is minimal: at 0.49 MPais 0.15 ÷ 0.16 kW and from 1.96 MPa - 0.44 kW. Around the same data are shown by couple ПГ-CP2 with KB grafitofluoroplast. The layer СНГН-50 shows a loss of power at a relatively high friction. The reason of this phenomenon is the high porosity accompanied by a low hardness of the layer. The minimum power at friction is in couple with KB grafitofluoroplast. At a specific task of 0.49 MPa, the power friction is

The formation and testing of the tribological layers sprayed in the plasma jet 65
0.12 kW. The low antifriction properties were shown by nickel layer with added aluminum ПН85Ю15 (containing 15% Al). At specific tasks of 0.49 MPa, the consumption of friction power is 0.3 kW, in couple with 7B-2A grafitofluoroplast and up to 0.5 kW in couple with APB-200-68.
Figure 1. The Dependence of power loss to friction
on specific task in couple: 1) ПТ-19Н-01. Materials Testing: 1- AMC-3 ; 2-
APB-200-Б83; 3- АГ-1500-Б83; 4- 7B-2A; 5- rubber7-3825; 6- grafitofluoroplast KB; 7-
carbonfiber‘’СУГВАМ’’. 2) СНГН-50. MaterialsTesting: 1- grafitofluoroplast KB; 2- АГ-
1500-Б83 ; 3- APB-200-68 ; 4- carbonfiber ‘’СУГВАМ’’ ; 5-grafitofluoroplast 7B-2A. 3) ПГ-CP2. Materials Testing: 1- grafitofluoroplast KB ; 2- grafitofluoroplast 7B-2A ; 3- rubber7-3825 ; 4- APB-200-Б83 ; 5- АГ-1500-Б83. 4) ПН85Ю15.
MaterialsTesting: 1- graffiti fluoroplast7B-2A ; 2- graitofluoroplast KB; 3- АГ-1500-Б83 ; 4- APB-
200- 68.
3. CONCLUSIONS
The kinetics of this phenomenon depends on the physical parameters such as: speed, temperature and enthalpy of the sprayed particles. Studies have shown a significant impact on the dynamics of movement of sprayed particles, by phenomenological laws for the frontal drag coefficient, taking into account the loss of pulse of the plasma jet in acceleration of these particles and their diameter.
It has been found that the large difference between the diameters of the sprayed particles contributes to a substantial separation of particles in a spray point if falling on the surface of the piece having different speeds.
Bibliography
1. Polucheniye pokrytij vysokotemperaturnym raspyleniyem. Atomizdat, Moskva, 1973, 39 p. 2. Kudinov V.V., Ivanov V.M. Naneseniye plazmoy tugoplavkikh pokrytij. Mashinostroyeniye, 1981, 192p. 3. Barvinok V.A., Bogdanovich V.I., Anan'yeva Ye.A. Matematicheskoye modelirovaniye dinamiki dvizheniya napylyayemykh chastits v plasmenom gazotermicheskom potoke. Vestnik Samarskogo Gosudarstvennogo Aerokosmicheskogo Universiteta 2007. p. 138-143 4. Mastryukov B. S. Teplofizika metallurgiches-kikh protsessov. M. M.I.S.I.S. 1986. 286 p. 5. Barvinok V.A., Bogdanovich V.I., Dokukina I.A., Neboga V.G.. Matematicheskoye modelirova-niye protsessa formirovaniya mezostrukturno-uporyadochennykh plazmennyx pokrytij. Mekanika i mashinostroyeniye 2011.p. 313-321 6. Barvinok V.A., Shitarev I.L,. Bogdanovich V.I., Dokukina I.A., Karasev V.M. Srabatyva-yemyye iznosostoykiye teplozashchitnyye pokrytiya dlya detaley gazovogo trakta turbiny kompressora i kamery sgoraniya G.T.D. Vestnik Samarskogo Gosudarstvenogo Aerokosmicheskogo Universiteta 2009 p.11-27 7. Kudinov V.V. Plazmennoe pokrytiye. M. Nauka, 1997. 8. Cherepanov A.N., Popov L.N. Modelirovaniye termo i gidrodinamicheskikh protsessov v modifitsirovannoy nanochastitsami metallicheskoy kapli pri yeye soudarenii s pod nozhkoy. Vestnik Udmurskogo Universiteta 2008.p. 214-221
Recommended for publication: 28.10.2016.

66 The assessment of rheological behavior of a beam propped on the environment with…
THE ASSESSMENT OF REOLOGICAL BEHAVIOR OF A BEAM PROPPED ON THE ENVIRONMENT WITH VISCOELASTIC PROPERTIES
Viorica Țibichi
Technical University of Moldova
INTRODUCTION
The Rheology is a science that study inter dependencies between mechanical stress, response of the solids and its proprieties. This since determines mathematical methods to describe the behavior of solids subjected to stress.
Deformation level of solids is changing over time until equilibrium is reached between internal and external forces in the solids.
On the assessment of rheological behavior of the solids are used mechanical methods for which are elaborated differential and integrated equations. Using these models to describe the properties of construction elements and the environment that they rest on, can be traced their behavior over time.
1. THE VISCOELASTIC BEAM PROPPED ON THE VISCOELASTIC
MEDIUM
The following basic models: Maxwell (fig. 1, a); Kelvin-Voight (fig. 1, b); will be assess in rheology as integral parts of more complex mechanical models, reflecting closely, as much as possible, the rheological behavior of the solids.
EE η
a b
η
Figure 1.
Thus, for each material used in construction, standalone element or conjunction of items, can be adopted a rheological method to
simplify and ordering a general problem of correlation between stress and deformations.
For a concrete beam, will be adopted Zener rheological model (fig. 2), and the beam is considered propped on viscoelastic base.
E1η
E2
Figure 2.
The problem will be solved by applying numerical methods. Differential equations of viscoelastic beam propped on viscoelastic base (fig. 3) are following:
pnpkwwhn
nppqnqx
wEI
x
wnHI
**
4
4
4
4
, (1)
where: w – displacement; q – distributed load;
( ) – time derivative; I – moment of inertia of transversal section of the beam;
nEH ,, – the constants of beam material, which are determined depending on modules of elasticity of springs 1E , 2E and viscosity of dumper with following relations:
,,,2121
212 EE
nEE
EEEEH
(2)
*,, nkh – the constants of the supporting medium, which determined by relations (2) replacing modules of elasticity of springs and

The assessment of rheological behavior of a beam propped on the environment with… 67
viscosity of dumper with those of the medium, ie *
1E , *
2E and * . So:
,
,,
*2
*1
**
*2
*1
*2
*1*
2
EEn
EE
EEkEh
(3)
2PP P
Figure 3.
2. THE SOLUTIONS OF THE
CALCULUS
For a given concrete beam with sectional dimensions as 6040 cm2 and the length of
6,3L m with following characteristics: 5
1 105775,0 E MPa, 52 1033,0 E MPa,
161074 P; 51033,0 H MPa, 51021,0 E MPa, 543,81n ; propped on
the viscoelastic base (fig. 3) with
4,350*1 E MPa, 20*
2 E MPa, 11* 10 P;
20h MPa, 92,18k MPa, 0027,0* n calculations was made that permitted to determine displacements in time.
In figures 4, 5, 6 are represented variation in time (a – seconds, b – minutes, c – hours, d – days, e – years) of displacements, reactive pressure and bending moment respectively on the middle of the beam.
CONCLUZIONS
1. According to the results obtained, the bending moment in the central section of the beam is not varying. 2. Displacements occurs mostly in the first day of observations and by the fifth day will reach 38% out from total value. After first year the value of displacement will stabilize. 3. The reactive pressure, also, will increase first five days reaching 38% out from total value, and also at the end of first year this pressure will stabilize.
Figure 4. Variations of displacements: a – seconds, b – minutes, c – hours, d – days,
e – years.
cm610,
0
1
2
3
4
0 1 2 3 4 5t, sec.
a cm410,
0
0.5
1
1.5
2
0 1 2 3 4 5t, min.
b cm210,
0
0.5
1
1.5
2
0 1 2 3 4 5t, hours
c
0
0.05
0.1
0.15
0.2
0.25
0 1 2 3 4 5t, days
d
cm,
0
0.25
0.5
0.75
1
0 1 2 3 4 5t, years
e
cm,

68 The assessment of rheological behavior of a beam propped on the environment with…
Figure 5. Variations of reactive pressure: a – seconds, b – minutes, c – hours, d – days,
e – years.
Figure 6. Variations of bending moment: a – seconds, b – minutes, c – days, d – years.
0
2
4
6
0 1 2 3 4 5t, sec.
a
Pap 210,
0
1000
2000
3000
4000
0 1 2 3 4 5t, days
d
Pap ,
0
5
10
15
0 1 2 3 4 5t, years
b
kPap,
0
1
2
3
4
0 1 2 3 4 5t, min.
b
Pap ,
0
50
100
150
200
250
0 1 2 3 4 5t, hours
c
Pap ,
0
200
400
600
800
0 1 2 3 4 5t, sec.
a
mNM ,
0
200
400
600
800
0 1 2 3 4 5t, min.
b
mNM ,
0
200
400
600
800
0 1 2 3 4 5t, days
c
mNM ,
0
200
400
600
800
0 1 2 3 4 5t, years
d
mNM ,

The assessment of rheological behavior of a beam propped on the environment with… 69
Bibliography
1. Țibichi V. Contribuții privind evaluarea interacțiunii statice și reologice la grinzile rezemate pe medii deformabile// Teză de doctorat, UT Gh. Asachi, Iași, 1999. 2. Ungureanu N., Silion T., Gorbănescu D. Grinzi pereți rezemate pe suport deformabil// Buletinul I.P. Iași, Tomul XXI (XXV), Fasc. 3-4, Sec. V Construcții. Arhitectură,1975. 3. Gorbunov-Posadov M.I. i dr. Raschet konstrukczij na uprugom osnovanii// Moskva, Strojizdat, 1984. 4. Rzhaniczy’n А.R. Necotor’e vopros’ mehaniki system deformirujushihsea vo vrermeni// Moskva-Leningrad, Gostehizdat, 1949
Recommended for publication: 22.09.2016

70 Characteristics and Trends in the Development of Local Footwear Industry
CHARACTERISTICS AND TRENDS IN THE DEVELOPMENT OF LOCAL FOOTWEAR INDUSTRY
Angela Ghelbet Technical University of Moldova
Light industry is a part of the processing industry of the Republic of Moldova. This branch includes following types of activities: textiles manufacture (preparation and spinning of fibers, fabrics, finishing fabrics and other textile items, including carpets, fitted carpets, ropes etc.), manufacture of clothing (clothing, leather clothing, underwear, fur clothing, knitted and crocheted wear, stockings and haberdashery), leather tanning and dressing, fur preparation and dyeing, leather goods and travel articles manufacture, harness and footwear. Starting from a short foray into the history of the footwear industry, we should shape the developing appearance of the footwear industry.
According to CEED I Report, Moldavian footwear industry has experienced three different development stages: 1st stage - development in the USSR period
(1945 - 1991), 2nd stage - between 1992 and 2008,
characterized by cooperation of CMT (cute, make & trim) and
the present period (since 2009) when local manufacturers are forced to refocus their development policy, and searching strategies in order to diversify products, to balance export and local production, to increase local sales and to find niches for the export [1].
We remind about some distinct forms of activity of the entire branch, including the footwear sector, which depends on the business model: production under local trademark or brand for
local market; lohn production (inward processing regime); mixed activity (combination of previously
forms). According to the theory, the transition from
lohn activity to local trademark, involves a reorganization of production lines and distribution systems, together with the development of managerial capabilities and new investments. This migration is a signal of industrial modernization, which assures a higher benefit, a higher stability of the demand and wages, a higher enterprise’s position in the local production chain.
An analysis of retrospective of the industry will form an overall picture of the situation of light industry at the national level.
The local footwear sector knows an ascent and modest development. The sector represents over 50 economic entities, of which two are large enterprises and offer almost 3000 jobs, with a share in GDP below 1 percent. Table 1 reveals the footwear industry's share in the main macroeconomic indicators:
Table 1. Footwear industry's share in the national economy of RM.
Criteria 2011 2012 2013 2014 1015* Light industry’s share in GDP, % 3,07 3,01 3,12 3,39 3,37 Footwear industry's share in the light industry, % 10,24 9,46 8,87 7,22 7,4 Footwear industry’s share in GDP, % 0,31 0,28 0,27 0,24 0,24 Footwear industry's share in industrial production volume, %
0,8 0,7 0,7 0,6 0,66
The share of employees of the footwear industry in the economically active population, %
0,24 0,24 0,22 0,22 0,19
Share of footwear enterprises ‘number in the enterprises ‘number of light industry, %
11,74 12,63 13,96 14,02 -
Share of footwear enterprises ‘number in the total number of industrial enterprises, %
0,86 0,96 1,12 1,11 1,02
* - at the time of the evaluation the data for 2015 are qualified as semifinal Source: systematized and calculated by the author based on NBS of Moldova

Characteristics and Trends in the Development of Local Footwear Industry 71
According to table 1 data, the share of the footwear industry in the light industry indicates an average of 8.2% and a rate of proportional change of 0.9219 points.
The share of footwear industry in GDP is modest, registering an average of 0.268% for the analyzed period, and the proportional rate of decrease is within 0.9379. In 2012, when was reintroduced the income tax, this indicator decreased by 0.78% and the trend of decreasing continues.
The share of footwear industry indicates the trend of proportional change of 0.953 points.
The share of footwear industry’s employees in the economically active population represents
an average of 0.22 percentages, which has the trend of proportional change (decrease) of 0.9432 points.
Each of the above positions has a tendency of decreasing, which indicates symptoms incompatible with the main objective of the research – the development of the industry. Though, the share of enterprises ‘number has a slight trend of growth.
The overall condition and the prevailing atmosphere is evaluated based on key indicators.
Main macroeconomic indicators of footwear industry are systematized in table 2.
Table 2. Main indicators of footwear industry in RM.
Criteria 2011 2012 2013 2014 2015* Number of enterprises, units 58 57 64 54 51 Income from sales, mln MDL 281,05 276,08 292,55 317,66 325,33 The value of output production, current prices, million 259,5 252,2 279,3 275,3 293,4 Number of employees, thousand persons 2,89 2,73 2,53 2,58 2,4 Industrial production volume, thousand pairs 2849 3053 2942 2866 1967 Labor productivity:
986 1118 1163 1111 818 a) pairs
b) thousand MDL 89,79 92,28 110,13 106,33 121,99
* - at the time of the evaluation the data for 2015 are qualified as semifinal Source: systematized and calculated by the author based on NBS of Moldova
According to the information contained in table 2 we observe a decrease in the number of enterprises by 7 in 2015 towards 2011;
Income from sales of footwear industry’s entities indicates a positive trend, recording a growth rate of 1.0372, and the proportional growth of the manufactured production indicates an average of 1.0311;
Number of employees indicates a decrease of 16.9% of hired staff in 2015 towards 2011. In 2014 there is an increase of 1.97% towards 2013. We highlight that the branch is labor
intensive because of the specificity of the production process.
The volume of industrial production recorded an increase of 7.16% in 2012 towards 2011, and a following decrease in the volume of industrial production, the largest gap is in 2015, with a decrease in the volume of 31.37% in 2015 towards 2014. This phenomenon is explained through the reduction of activities of foreign processing in Moldova. Proportional rate of change for 2011-2015 has the value of 0.9115. The phenomenon is shown in table 3.
Table 3. The structure of footwear delivery.
Referral period Delivered
Total Local market Foreign market Physical units Physical units Thousand lei Physical units Thousand lei
2011 2849063 1615202 109422 1209761 179443 2012 3055127 1903849 125895 1196665 133601 2013 2941194 1670243 130460 1192291 138342 2014 2866378 2111646 135065 772702 148077 2015 1967680 1510113 114125 457567 154819
Source: systematized by author based on Customs Service (operators’ customs export and import declarations) and on the external trade statistics of the Directorates and services and infrastructure statistics of the NBS of Moldova [3, 4, 5].

72 Characteristics and Trends in the Development of Local Footwear Industry
The volume of industrial production registered
in the sector is due to cooperation between local enterprises and foreign services providers. The further data confirms the estimated in CEED I production capacity [1], where is mentioned that the total capacity of production of the footwear industry indicates over 3 million pairs of shoes annually and the utilization of the market is 50-60%. Table 3 presents physical and value equivalent of volumes of products delivered to the domestic and foreign market (lohn services and export). From presented data, we may observe that the
value of exported products dominates the value delivered in the local market, though the volume in physical units in the domestic market prevail the volume for the foreign market. This phenomenon is explained by the fact stated above and through the interest and desire of the local business environment to maintain relations with foreign partners, by accepting collaborative conditions vital to domestic entities, but less advantageous due to transfers in foreign currency;
Supplies on the domestic market in 2015 is only 71.51% of the volume delivered in 2014. And
supplies for the foreign market, especially lohn services registered 40.78% of the volume of production expressed in physical units;
Generalized results reflecting production component, does not indicate the negative trend recorded in connection with the reintroduction of income tax on profit from 2012, on the contrary, this period has seen the largest representative volume of production, of 64.4% higher than in 2015. As regards the supplies on the domestic market, their highest physical volume is recorded in 2014, and supplies for the foreign market recorded its highest volume in 2011.
As regards exports, we recall that light industry kept its positive trade balance, due to the production of services, having the exportation of footwear geared towards European Union countries, dominated by Germany and Italy. Geography of imports worldwide presents China as the leader, followed by the countries of the European Union with Italy as leader, Turkey, Ukraine, Romania and other States.
We can follow the panorama of the import and export of footwear in table 4.
Table 4. The dynamics of exports and imports of footwear industry in Moldova, $ mln.
Criteria 2011 2012 2013 2014 2015 Export by section XII, chapter 64 (acc. NM RM)
footwear 49,45 39,72 35,7 33,5 24,0 Import by section XII, chapter 64 (acc. NM RM)
footwear 33,31 31,09 31,2 27,2 18,8 The coverage of imports with export, % 148,45 127,75 114,3 123,16 127,65
Source: systematized by the author based on Statistical yearbooks of Moldova and the quarterly Bulletin I-IV. (http://www.statistica.md/public/files/publicatii_electronice/Buletin trimestrial/Buletin_IV_2015.pdf)
Based on data presented in the table we conclude that export is provided, in principle, by the services exported through the existing cooperation along with modest export of domain entities, thus maintaining a positive trade balance for footwear products. The lowest degree of the coverage of imports with export is in 2013, and the biggest in 2011. Proportional rate of change indicates the average of 0.8346 for the export and 0.8667 for the import. Import coverage with export is modest and is 127%. The modest import is due to low interest from the foreign retail chain, to low capacity of local market and low consumers’ ability to purchase.
This trend is explained by several factors, such as economic globalization, membership of Moldova in WTO (World Trade Organisation), transition of the industry to manufacturing from clients’ raw
materials, accessories and auxiliary materials and to the exports of services, and average competitiveness of products on the domestic market made from individually purchased materials, and changes in population’s welfare. In this context, enterprises have the task to enhance the competitiveness of their products in order to substitute imported goods by increasing the share of manufactured products with complete cycle of production and by development of infrastructure of the footwear industry [2, p. 306].
Regarding the competitive advantage of domestic products, it is due to the low salary level alongside with inexperienced and non-transparent maneuvers.
Figure 1 shows through an histogram wages recorded in the footwear industry in comparison with average wages for the period 2011-2015.
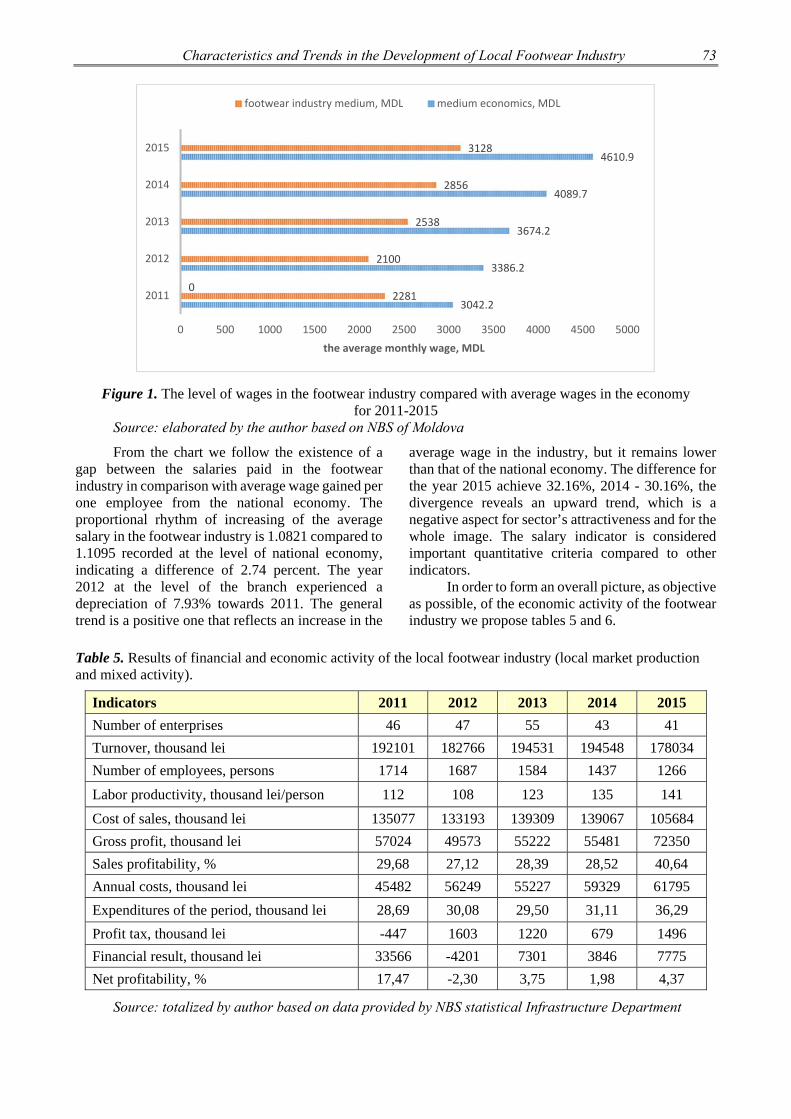
Characteristics and Trends in the Development of Local Footwear Industry 73
Figure 1. The level of wages in the footwear industry compared with average wages in the economy for 2011-2015
Source: elaborated by the author based on NBS of Moldova
From the chart we follow the existence of a gap between the salaries paid in the footwear industry in comparison with average wage gained per one employee from the national economy. The proportional rhythm of increasing of the average salary in the footwear industry is 1.0821 compared to 1.1095 recorded at the level of national economy, indicating a difference of 2.74 percent. The year 2012 at the level of the branch experienced a depreciation of 7.93% towards 2011. The general trend is a positive one that reflects an increase in the
average wage in the industry, but it remains lower than that of the national economy. The difference for the year 2015 achieve 32.16%, 2014 - 30.16%, the divergence reveals an upward trend, which is a negative aspect for sector’s attractiveness and for the whole image. The salary indicator is considered important quantitative criteria compared to other indicators.
In order to form an overall picture, as objective as possible, of the economic activity of the footwear industry we propose tables 5 and 6.
Table 5. Results of financial and economic activity of the local footwear industry (local market production and mixed activity).
Indicators 2011 2012 2013 2014 2015
Number of enterprises 46 47 55 43 41
Turnover, thousand lei 192101 182766 194531 194548 178034
Number of employees, persons 1714 1687 1584 1437 1266
Labor productivity, thousand lei/person 112 108 123 135 141
Cost of sales, thousand lei 135077 133193 139309 139067 105684
Gross profit, thousand lei 57024 49573 55222 55481 72350
Sales profitability, % 29,68 27,12 28,39 28,52 40,64
Annual costs, thousand lei 45482 56249 55227 59329 61795
Expenditures of the period, thousand lei 28,69 30,08 29,50 31,11 36,29
Profit tax, thousand lei -447 1603 1220 679 1496
Financial result, thousand lei 33566 -4201 7301 3846 7775
Net profitability, % 17,47 -2,30 3,75 1,98 4,37
Source: totalized by author based on data provided by NBS statistical Infrastructure Department
3042.2
3386.2
3674.2
4089.7
4610.9
2281
2100
2538
2856
3128
0
0 500 1000 1500 2000 2500 3000 3500 4000 4500 5000
2011
2012
2013
2014
2015
the average monthly wage, MDL
footwear industry medium, MDL medium economics, MDL

74 Characteristics and Trends in the Development of Local Footwear Industry
Table 6. Results of financial and economic activity of the local footwear industry (processing).
Indicators 2011 2012 2013 2014 2015
Number of enterprises 12 10 9 10 10
Turnover, thousand lei 88945 93313 98020 121681 147293
Number of employees, persons 1176 1046 952 1152 1139
Number of enterprises 76 89 103 106 129
Turnover, thousand lei 64156 75758 77139 95115 115527
Number of employees, persons 24789 17555 20881 26566 31766
Sales profitability, % 27,87 18,81 21,30 21,83 21,57
Annual costs, thousand lei 18942 12000 16396 15904 16568
Expenditures of the period, thousand lei 23,86 14,13 17,71 13,99 12,22
Profit tax, thousand lei 0 1584 1522 1385 2437
Financial result, thousand lei 9569 8375 5453 8021 11682
Net profitability, % 10,76 8,98 5,56 6,59 7,93
Source: totalized by author based on data provided by NBS statistical Infrastructure Department
Tables 5 and 6 contain indicators of feasibility, cost-effectiveness and efficiency, which describes the financial and economic activity of entities separate for the domain of external processing activities and mixed activity, which formulate conclusions:
The general activity of the branch is considered cost-effective;
The branch maintained an average of 2500 occupied persons whose workplaces must be kept further, aiming to increase wages and labor productivity, in order to reduce the existing gap towards to the average of the economy and ensure employees a decent standard of living;
The comparative effect of lohn activity towards to the effect obtained from the entities focused on the local market focused and those who practice both business models is just with 10.74% smaller during the analyzed period.
As regards to the contribution to budget through the income tax, the entities that produce for the local market or have mixed activities lost 52.23% towards the external processing system;
The necessity for an efficient cost management (general and operational ones) is obvious, this fact will allow the raise and maintenance of the level of competitiveness of footwear manufactured by local producers;
The apparent development, fueled by increasing turnover is due to increase in prices of footwear because of the rate of inflation registered during the period. This fact is confirmed by the decrease in the volume of physical production sometimes alerting, which recorded a fall of 55.21%
2015 towards 2013. At the same time, this effect is conducted by low demand from consumer, which directly depend on the purchasing power.
Identification of internal reserves and boosting the potential of development is the task for each company’s management, since aggregate economic growth aimed at sustainable development.
Bibliography
1. CEED. Moldova economic sector analysis: final report. Footwear Sector. Chişinău 2010. hppt://moldova usaid.gov/sites/default/files/CEEDcompetitiveness Report 2010. Pdf (consulted 29.09.2011). 2. Ghelbet A. Determinanții direcțiilor strategice de dezvoltare a ramurii/sectorului de încălțăminte din R. Moldova. Creativitate. Tehnologie. Marketing. Al III-lea simpozion internațional, 31 octombrie – 01 noiembrie, 2015 (pag. 304-309). UTM. FIU. Chișinău: Bons Offices, 2014. 350 p. 3. The Statistical Yearbook of the Republic of Moldova, 2012-2015. 4. Information provided by the Statistics Infrastructure Department of the NBS 5. http://www.statistica.md/ (Biroul Național de Statistică) (vizitat 2010-2016).
Recomandat spre publicare: 13.10.2016.

The impact of season on ash content in local goat milk 75
THE IMPACT OF SEASON ON ASH CONTENT IN LOCAL GOAT MILK
Viorica Bulgaru, dr.assoc.prof., Olga Gutium, dr. Technical University of Moldova
INTRODUCTION
Goat's milk is a great raw material for human consumption.
Goat milk like cow milk has high concentration of major nutrients in relation to caloric value. Goat milk have higher medicinal value and it also contains 4.4 per cent fat, 0.137 per cent Ca, 0.112 per cent P, 0.017 per centMg, 0.170 per cent K and 3.4 per cent milk protein. It provided 72 Kcal per 100 goat milk products [1, 2, 3].
In 1981, Le-Jaouen reported that goat’s milk has similar vitamins contents of human milk except lower content of folic acid, Vit. C and Inositol. He added that goats butter is reputed to been effective remedy against disease such as rheumatism and arthritis [4, 5].
Goat’s milk contains vitamins, minerals, trace elements, electrolytes, enzymes, proteins, and fatty acids that are easily assimilated by the body. Goat’s milk has a similarity to human milk that is unmatched in cow milk and also has several medicinal values. Therefore awareness about advantage of consumption of goats milk should be popularized so that production and utilization of goat’s milk could be enhanced [6].
Goats milk shows therapeutic virtues for individuals with certain dietetic problems, thus physicians have traditionally recommended goats milk for infant and others allergic to cow milk. Similarly it has been used in treatment of ulcers [6, 7].
The variation in the compositions of milk and the total yield of milk within a species depends on different factors. Some of these factors are physiological factors, genetical factors and climatic factors. Some physiological factors are stage of lactation, age, udder health and type of diet. Daily variation and season changes can be taken as the climatic factors [8, 9]. Lactation periods as well as climatic conditions are generally termed as seasonal changes which have a great influence on the milk constituents.
A brief knowledge of physico chemical properties of goat milk will help in understanding the effect of various method of processing on the quality of goat milk and milk products [10].
In present investigation an attempt was made to study total ash content and minerals of local goat’s milk and the effect of lactation on the content of these indicators.
The ash content is a very important quality characteristic for more food, especially those of animal origin. Ash content represents the total amount of minerals present within the milk samples and major constituents in ash content comprised of oxide and chloride of mineral elements [11].
1. MATERIALS AND METHODS OF RESEARCH
1.1. Materials
Row goat milk, without added preservatives. Analyses were carried out in triplicate. Goat milk has been received from farms in the South, Center and North of Moldova, during the autumn and winter months of 2016. Sample 1 – goat milk received from farms in the North of Moldova. Sample 2 –goat milk received from farms in the Center of Moldova. Sample 3 –goat milk received from farms in the South of Moldova. 1.2. Methods
Determination of Ash [12]
Analysis procedure Heat the crucible for 30 min in the muffle
furnace set at 550±25 . Allow the crucible to cool to 200 . Transfer it to the desiccators and cool for 30 min, and weigh it until the two recent weights difference is within 0.5 mg.
Sample weighing: weigh 20 g with precision of 0.0001g.
Determination
Steam the liquid samples in water bath until dryness. Place the crucible with dried or solid sample on an electric hot plate with low heat. Heat progressively until the substance

76 The impact of season on ash content in local goat milk
carbonizes without smoke. Transfer the crucible to muffle furnace with temperature of (550±25) and keep 4 hours. When it cools to 200 , remove the crucible and the sample from the muffle furnace to desiccator and cool for 30 min. If carbon particle is seen in the residue before weighing, a few drops of water should be added to the sample and repeat the procedure described above.
Weigh the residue until the two recent weights difference is within 0.5mg. Calculate according to formulation 1.
XM MM M
100, 1
X - the ash content of the sample with unit of g/100g; M1 -the weight of the crucible with the ash with unit of g; M2 - the weight of the empty crucible with unit of g; M3 -the weight of the crucible with the sample with unit of g.
2. RESULTS AND DISCUSSION
The total ash level in goat milk is slightly higher than that in cow milk 0.7 %, usually ranging from 0.70 to 0.85% [13, 14].
The results of goat milk ash content collected in the South, Center and North of the Republic of Moldova, during the autumn-winter months shows values between 0.72 and 1.44 g / 100g (Table 1).
Ash content in local goat's milk has increased significantly in samples received in December, the last period of lactation, when milk composition changed significantly compared to samples in August. A greater increase in ash content is observed in goat milk received in the south of Moldova from 0.78 to 1.44 g / 100g (Table 1).
It was observed that ash content of local goat milk significantly increased from first to last lactations.
The findings are in agreement with Aganga (2002) who studied the milk composition of goat and Ewes milk and also studies the effect of lactation on composition of goat milk and reported that minerals fluctuated in both goats and ewe milk through out the lactation period [15].
Table 1. Ash content of local goat milk received during the autumn-winter months with unit of g/100g.
Period / Month
Geographical areas of Moldova
North Center SouthAsh content of the
sample, g/100g August 0,72 0,70 0,78 September 0,86 0,82 0,94 October 0,92 0,84 1,01 November 0,94 0,85 1,03 December - 0,86 1,44 December goat milk in the north was not collected because of the interruption lactation period (bad weather).
Table 1 data show that the milk collected from different regions of Moldova has a different ash content. Therefore, goat milk from the South reported the highest values about 1 g / 100 g for goat milk collected from the central zone 0.84 g / 100g and the North of Moldova 0.81g / 100g.
Different ash content from three geographical areas may be influenced by external factors such as the type and quality of feed.
Ash content measurement is important to represent the quality, microbiological stability and nutrition in a particular food product [16].
CONCLUSIONS
Goat milk has high concentration of major nutrients in relation to caloric value and it resembles human milk in composition.
The ash content in the researched goat milk colected in the South, Center and North of Moldova according to lactation period is 0.72 to 1.44 g / 100g. The amount of ash in goat milk varies depending on the geographical area of Moldova and the lactation period.
Bibliografie
1. Holmes A.O., Kuzmeski J.W., Lindguist H.C., Rodman H.B. Goat milk as source of bone building minerals for infant feeding. Dairy Sci.Abstr. 8: pag. 194, 1946. 2. Posati L.P. Orr M.L. Composition of foods. Dairy and egg products: Raw, processed, prepared. Agriculture Handbook No. 8-I.U.S. Department of

The impact of season on ash content in local goat milk 77
Agriculture, Agricultural Research Service, Washington, DC, 1976. 3. Saini A.L. Gill R.S. Goat milk: An attractive alternate. Indian Dairyman, 42, pag. 562-564, 1991. 4. Le-Jaouen J.C. Milking and the Technologyof Milk and Milk Products. In "Goat Production"Ed. by Gall, G. Academic. Press, London Ltd.Chap. 11, pag. 345-377, 1981. 5. Hayam M. Abbas et. al. Physicochemical characteristics of goat’s milk.Life Sci J; 11(1s):307-317]. (ISSN: 1097-8135), 2014. 6. Kumar S., Kumar B., Kumar R., Kumar S., Khatkar S., Kanawjia S.K.NurtionalFeatures of Goat Milk. A Review. Indian. J. DairySci. 65(4),2012. 7. Mereado S.S. Goat milk industry in Mexico.Proc. 3ed Intr. Conf. on Goat Production andDiseases. Scottsdale, A2. Dairy Goat J.Publication, 1982. 8. Pandya A.J., Ghodke K.M. Goat and sheep milk products other than cheeses and yoghurt. Small Ruminant Research 68, pag. 193-206, 2007. 9. FAO. Statistical Year Book. Food and Agriculture Organization of the United Nations Statistics Division. URL http://faostat.fao.org/. Accessed 7 ⁄ 6 ⁄2010. 10. Bhosale S.S., Kahate P.A., Kamble K., Thakare V.M., Gubbawar S.G. Effect of Lactation on Physico-Chemical Propertiesof Local Goat Milk.Veterinary World, Vol.2(1),pag. 17-19, 2009. 11. Imran M., Khan H., Hassan S. S. Khan R. Physicochemical characteristics of various milk samples available in Pakistan. Journal of Zhejiang University Science B 9(7), 546-551, pag. 2008. 12. National food safety standard. Determination of Ash in Foods. Issued by Ministry of Health of the People's Republic of China. Implement 01-06-2010. 13. Parkash S., Jenness R. The composition and characteristics of goat milk. Review. Dairy Sci. Abstr., 30, pag. 67-72, 1968. 14. Jandal J.M. Comparative aspects of goat and sheep milk. Small Ruminant Research 22, pag. 177-185, 1996. 15. Aganga A.A., Amarteifo J.O., Nkile N. Stage of lactation on nutrient composition of Tswana sheep and goat milk. J.Food Composition and Analysis, 15 (5), pag. 533-543, 2002. 16. Lai C. Y., Fatimah A. B., Mahyudin N. A., Saari N., Zaman, M. Z. Physico-chemical and microbiological qualities of locally produced raw goat milk. IFRJ 23(2): 739-750, 2016.
Recommended for publication:25.11.2016.

78 The determination of the melting time of the particle by spraying in the plasma jet
THE DETERMINATION OF THE MELTING TIME OF THE PARTICLE BY SPRAYING IN THE PLASMA JET
Sergiu Dântu, assoc.prof.dr., Leonid Ivanov, assoc.prof.dr., Eduard Galușca
Technical University of Moldova
The quality of the deposited layers by spraying
in the plasma jet is determined by several factors: the powder material and the surface of the base material, the thermo-physical properties of the material, the temperature of the particles, the particle condition at the interaction with the surface of the base material.
A basic element that influences the quality, constitutes the particles and especially the way of dosing in the plasma jet and the changes that occur [1].
The total period of particle mentaining in the plasma flow can be divided into the following steps:
1) The temperature increasing of the particle from the initial temperature up to the melting temperature.
2) The formation of a melted zone on the surface of the particle and penetration to the center of the particle. In this case two states of the particle are distinguished: the melted surface of the particle and the center of the particle in the solid state.
The goal is to determine the time of melting of the particle.
At the moment of impact (contact) with the base material, the particle must be completely molten.
The presence of the solid core in the particle leads to the formation of a layer with poor adhesion.
The overheating of the liquid particle, leads to the weight loss of the substance at evaporation.
The aim of the study is to determine the time of melting of the particle [2].
The whole process is divided into two stages: the heating and the melting.
Considering that the process is quite complicate due to plasma fluctuation and because it is not uniform and is unsteady, due to the presence of phase transformations, the dependance of the thermophysical parameters on the temperature, the irregular shape of particles; we can admit some simplifications [3].
1. The particle has a spherical shape 2. The heat flux on the surface of the particle is
constant 3. The thermophysical parameters are constant
and change at the phase transformations; and at the temperature ranges average values are used.
The energy equation for the particle is written as:
(1)
where 0; 0R≤ Symmetric problem initial conditions
T(R, 0)= (2)
we write the limit conditions as follows:
- , 0 (3)
where - the heat flux on the particle surface (density)W/m2
T0 - initial temperature K
- the temperature gradient K/m
0, 0 and 0, ∞ (4)
Equation (1) is solved by operational method [1] and we present it in the following way:
, 3 3
2cos
∞ sin
sin
2cos
∞ sin
(5)
Where µn – the roots of the characteristic equation tgµ=µ
T – temperature, K; - conductivity coefficient W/mK; - thermophysical coefficient m2/s; qc - heat flow W/m2. The problem is solved in general way and we
admit T0=const. and heat flow qc= const. Then (5) can be written as:

The determination of the melting time of the particle by spraying in the plasma jet 79
,∙
∙
∑ ∙∙
∙∞ (6)
When 0 some values can be ignored in considerations that do not influence the final result and (6) is written as:
,∙
∙
(7)
Time of the first stage can be determined from equation (7) introducing R=R0 and admitting the values T=Tn on the particle surface [4].
Determining the melting time of the particle, from the equation (1) we present it for a system of two spherical bodies [5].
The goal is to determine the spread of temperature in the sphere-sphere system.
- the coordinate of the solid- liquid phase transformation
The equation in this case can be presented as:
∙ (8)
where i- ventral sector (core) in the solid state. - the particle surface the liquid state
1- 0 0R 2-0 RR0
T(,)=Tnn- constant (9)
, (10)
where qc – the energy flux density which
contacts with the surface of the particle W/m2, The solution for the liquid peripheral sphere
can be shown in equation (7) where thermophysical parameters are allowed for the liquid phase.
At the borders of liquid and solid phase, the equation of energy conservation can be written as:
∙ ∙ (11)
where L – the latent heat of melting of the solid particles J/kg.
- melting zone, m For solid phase the limit conditions for
equation (8) admitting first-degree (9) When T(,)=Tnno The solving is known generally [2] and can be
written in the following way:
∙ ∑
∙∙∞ (12)
We use the first member of equation (12)
∙
∙∙ (13)
Permeation rate of the melted zone in the
spherical particle can be determined solving equations (7), (11), (13).
We admit that heating and melting of the particles occurs without loss and the heat transfer coefficient is a complex value which includes heat transfer through convection and radiation. Then the time of melting can be presented as:
∙∙
(14)
Solving (14) is suitable for the heat transfer
processes when changing the state of aggregation. Solving the problem more accurate leads to a
groundless complication. For engineering calculations the equation is
quite appropriate.[6] Tn – the temperature of the plasma jet. The flow of the heat from the radiation is
determined by Stefan-Boltzmann equation.
∙ .
The effective value of the heat transfer can be written in the following way:
∙ 100 100
Preparing the surfaces for the formation of resistant coatings
The adhesive strength of the layer to the surface of the base material, depends on the mechanical linkages of the particles and physicochemical interaction between the roof and the base. The increasing of the adherence force is obtained through a preventive processing of the base surface. It has been shown that the maximum adhesion is achieved if the particles of the base surface after processing and the particles of the powdered material are approximately equal. This requirement is achieved if the surfaces are processed with air jet and abrasives, forming a proper roughness. All specimens examined at the adhesion and corrosion resistance and pump assemblies were processed with air jet and abrasives.
The coating was made with ПС-12НВК-01 powder. The plasma forming consists of argon gas and nitrogen in a proportion of 4/1. The distance to

80 The determination of the melting time of the particle by spraying in the plasma jet
the roof formation is 120-200 mm.
The results are shown in Figure 1. The research has shown that the strength of
joining the roof (polished samples) to the coating distance of 160 mm, is about four time less than in specimens processed with sand and air jet and is 2.92 MPa and 12.3 MPa, respectively. The maximum adhesive strength was obtained for the steel 3 specimen (figure 1 curve 4) and is 15 MPa, for the given coating distance; 14.1 MPa for the 12X1810T stainless steel (Figure 1 curve 3). The rated current is I =350A şi U=45V
The adhesion testing of the layers made up of powders of Al2O3 based on the titanium alloy 3M are shown in (Figure 2).
The adhesive strength of Al2O3 layer to the base surface which has been processed by polishing and oxidized at a coating distance of l = 160mm is 4.0MPa (Figure 2 curve 1). The base surface processed with the air jet and quartz sand, afterwards covered with Al2O3 has an adhesive strength of 5.2 MPa (curve 2 Figure 2). The base surface which has been processed with air jet and sand but has not been oxidized has an adhesive strength of 6.7MPa (Figure 2, curve 3).
The research results confirm that the preventive processing of the specimens surfaces, before coating, contributes to the increasing of the adherence strength 1.5-2.0 times, compared to the smooth surface which was not processed with air and sand (abrasives). Therefore, the processing with air jet and abrasives, constitutes an obligatory technological process.
Choosing the optimal regimes for the roof formation resistant to wear
Previously was noted that the resistance adhesion of the roof to the base material or to the intermediate layer, depends on several factors: firstly depends on the plasma forming (gas), the composition of fractional powders and materials from which it is constituted, the distance coating, pressure and intensity values.
When processing the coating technology to a fixed installation with a plasma-forming gas, the coating regime selection consists in determination of the optimal distance for each powder material and the current rate. This selection must provide the particles melting during the plasma jet.
The adhesive strength and high density of surfaces is obtained when the roof is made of completely melted particles of powder material. The coating regime is chosen preventively after the powders become melted on the surface of a glass. The molten particle, reaching the glass trickles on its surface. The coating regime is finally chosen
depending on the adhesive strength of the powdery material to the base material.
The adhesive strength was checked on special specimens with the adhesives method [1]. The coating specimens were made of materials widely used in construction of electric pumps, 12X18H10T stainless steel, titanium alloy 3M, carbon steel 3. When forming layers on the base material, an intermediate layer is created if the coefficient of linear expansion of the roof differs substantially from the coefficient of expansion of the base material. The properties of the intermediate layer are close to the properties of the base material. For certain bulk materials used in forming coatings, the intermediate layer increases the strength of the adhesion. The research has shown that at the coating formation from the powders ПС-12НВК-01 on the base material of carbon steel 3 with the intermediate layer ПТ-НА-01, the adhesive strength for the coating distance of 180 mm distance constitutes 16.2 MPa (Figure 3 curve 5).
The adhesive strength is 5.8 MPa lower and constitutes 10.4 MPa for the roof from the same powdered material, type ПС-12НВК-01 without an intermediate layer on the base material of steel 3 (Figure 4 curve1). The component of the intermediate layer has much influence on the strength of adhesion. When forming the roof of 90% Al2O3+ 10% Al, based on 12X18H10T stainless steel, two intermediate layers ПТ-НА-01 and ПН85Ю15 were checked.
Figure 1. The dependence of the adhesion resistance of the roof formed by plasma jet on the distance forming the roof ПС-12 НВК-01: 1- base- material - 3M titanium alloy, prior to coating, the surface was polished up to 1.25 μm; 2-3M base
material, was processed preventively with air jet and sand; 3- The base material 12X18 H 10 T,
processed with air jet and quartz sand; 4- the base material carbon steel 3, processed with air jet and
quartz sand.
32
1
4
0
2
4
6
8
10
12
14
16
18
120 140 160 180 200
σ(M
Pa)
l(mm)

The determination of the melting time of the particle by spraying in the plasma jet 81
Figure 2. The influence of specimens processing before coating through the plasma jet, the adhesive
strength: 1. basis - 3M alloy, before coating the surface was polished and oxidized. The roof
consists of Al2O3 ; 2. Basis – 3M alloy prior to coating was processed with sand and oxidized. The roof consists of Al2O3 ; 3. Basis- 3M alloy,prior to Al2O3 coating, the surface was processed with air
and sand. Oxidation has not been spent.
Figure 3. The dependence of the adhesive strength of the roofs: ПС -12- НВК-01 and СГ-Т (П) with the intermediate layer ПТ-НА-01,on the distance
roof formation from: 1.- Base material- 3M titanium alloy with the roof СГ-Т ( П); 2.- Base material
Carbon steel 3 with the roof СГ-T(П); 3.- Alloy 3M with the roof ПТ-19Н- 01; 4.- 12X18H10T steel
with the roof ПС 12- НВК- 01; 5.- steel 3 with the roof ПС 12 -НВК-01.
Figure 4. The dependance of the adhesive strength on the coating distance and on the base material: 1- The roof- ПС-12НВК-01 on steel 3 without
intermediate layer ; 2. The roof 50% TiC+50%ПН55Т45 on 3M titanium alloy without intermediate layer.
Bibliography 1. Karslou KH. S. Teploprovodnost' tverdyx tel. M. Nauka, 1964. 2. Koshlyakov N. S. Osnovy differentzial'nyx uravneniy matematicheskoj fiziki. M.: 1976. 3. Poluchenie pokrytij vysokotemperaturnym raspyleniem. Atomizdat, Moskva, 1973, 39 p. 4. Kudinov V.V., Ivanov V.M. Nanesenie plazmoy tugoplavkix pokrytij. Mashinostroenie, 1981, 192 p. 5. Cherepanov A.N., Popov L.N. Modelirovanie termo- i gidrodinamicheskikh protzessov v modifitzirovannoj nanochastitzami metallicheskoj kapli pri eyo soudarenii s pod nozhkoj. Vestnik Udmurskogo Universiteta,2008, p. 214-221 6. Barvinok V.A., Shitarev I.L,. Bogdanovich V.I., Dokukina I.A., Karasev V.M. Srabatyvayemye iznosostojkie teplozashhitnye pokrytiya dlya detalej gazovogo trakta turbiny kompressora i kamery sgoraniya G.T.D. Vestnik Samarskogo Gosudarstvenogo Aerokosmicheskogo Universiteta, 2009, p.11-27
Recommended for publication: 17.11.2016.
2
1
0
2
4
6
8
10
12
14
160 180 200 220
σ(M
Pa)
l(mm)1
2
3
1
0
1
2
3
4
5
6
7
120 140 160 180 200
σ(M
Pa)
l(mm)
1
2
3
4
5
0
2
4
6
8
10
12
14
16
18
160 180 200 220 240
σ(M
Pa)
l(mm)

82 Vibroacoustical diagnosis of planetary precessional kinematical transmission
VIBROACOUSTICAL DIAGNOSIS OF PLANETARY PRECESSIONAL KINEMATICAL TRANSMISSION
Iu Malcoci, PhD, Bodnariuc I., PhD, assoc.prof.
Technical University of Moldova
1. INTRODUCTION
The paper regarding vibroacustical research on planetary precessional kinematical gear box with transmission ratio u=-72,3, see figure 1 [1,2,4,6]. Acoustical analysis on planetary precessional kinematical transmission was made regarding analysis over a frequency range, here, a special analysis (FFT – Fast Fourier Transformation). In practice the simple amplitude measurement of the
vibration speed signal is often used for evaluation of the balance condition. The vibration speed signal is a direct measure of the out-of-balance condition, since the balance quality is specified as the speed of the center of gravity of the rotor. An increase in amplitude over time may indicate increasing damage.
2. CONSTRUCTIVE AND TECHNOLOGICAL SOLUTION TO
REDUCE VIBRATION AND NOISE IN KINEMATICAL PPT
In practice we can use various methods to
minimize vibration and noise levels in dynamic systems. Mechanical transmissions used in various machines and installations are sources of high frequency vibration and noise. The most effective, but also the most expensive way to get quieter transmission, is the method of execution of machine parts with very high precision or method of static and dynamic balancing of moving parts. For kinematical PPT we recommend correct choice of materials for gearwheels in terms of shock and vibration damping. One of the main advantages of PPT is the multiplicity meshing (up to 100% pairs of gearing teeth). For kinematical PPT satellite block can be made of plastic materials with damping properties (absorption) of gear shock. For this purpose has been developed kinematic precessional reducer (Fig. 2), with satellite block made of plastic materials type Hostaform C9021, and satellite wheel made of powders material type Жгр7 [3,4] , see figure 2. 3. STANDARDS FOR ASSESSING THE
SOUND PRESSURE LEVEL
In practice the simple amplitude measurement of the vibration speed signal is often used for evaluation of the balance condition. The vibration speed signal is a direct measure of the out-of-balance condition, since the balance quality is specified as the speed of the center of gravity of the rotor. An increase in amplitude over time may indicate increasing damage.
Experimental result was compared with limits for vibration amplitude (veff in mm/s) in general engineering in line with VDI directive 2056 [5,7]. Regarding this directive Table 1, mechanical systems were divided into four main groups K (small machines), M (medium machines), G (large machines) and T (turbo machines). Tested
a.
b.
Figure 1. Planetary precesional kinematical gear box: a) Satellite wheel made of plastic material
type Hostaform C2091 b) Satellite wheel made of powders material type Жгр7.

Vibroacoustical diagnosis of planetary precessional kinematical transmission 83
kinematical PPT see figure 1 and figure 2 regarding VDI directive 2056 belong to group K for small machines like individual propulsion components of engines and machines whose operating condition is linked to that of the entire machine, in particular series manufactured electric motors up to around 15 kW [7].
4. RESEARCH ON EXPERIMENTAL STAND
Experiments were carried out in a closed
laboratory room with rigid floor on the GUNT laboratory trolley type PT500.01 provided with a T-shaped channel. In these channels, we fix all components (figure 3): drive unit with three phase motor (P=0,36 kW), kinematical PPT gear box with satellite block from plastic materials and GUNT brake/ load unit type PT500.05. Precise axial alignment of the shafts was achieved using claw
couplings. Figure 4 represent typical measurements of noise level. In figure 5 is shown Bruel & Kjaer Sound level meter Type 2250 which was used for measuring noise levels, that have everything needed to perform high-precision, Class 1 measurement tasks in environmental, occupational and industrial application areas.
Sound level meter Type-2250 is a highly versatile, cloud enabled modular platform with many optional application modules such as frequency analysis, FFT, advanced logging (profiling) and sound recording [8].
5. DATA MEASUREMENTS AND RESULTS
In Table 2 is showed noise analysis at various
work speeds, with and without load: the noise level is within the range 32-58 dB for the satellite executed from plastic (figure 2,a) and 38 dB - 64 dB when the
Figure 2. Planetary precesional kinematical gear box: a) Satellite wheel made of plastic material type Hostaform C2091 b) Satellite wheel made of powders material type Жгр7
Table 1. Limit values for assessment of mechanical vibration in line with VDI 2056 [5,7] Sound
pressure [dB]
Vibration amplitude veff [mm/s]
Group K Small machines (< 15 kW)
Group M Medium machines (15kW–75kW)
Group G Large machines (> 75 kW)
Group T Turbo machines (> 75 kW)
133 45,0 Unacceptable Unacceptable Unacceptable Unacceptable 125 18,0 Acceptable 121 11,2 Acceptable 117 7,1 Acceptable Usable 113 4,5 Acceptable Usable 109 2,8 Usable Good 105 1,8 Usable Good 101 1,12 Good 97 0,71 Good
Plastic Satellite Wheel Powders Satellite Wheel
a) b)

84 Vibroacoustical diagnosis of planetary precessional kinematical transmission
Figure 3. Research on the test bench [2].
Figure 4. Measurements of noise level. Figure 5. Sound Level Meter – Type 2250
Table 2. Measured noise level for kinematical precessional transmission
Speed Load
600 min-1
1200 min-1
1800 min-1
2400 min-1
3000 min-1
Pla
stic
sa
tell
ite
Pow
der
sa
tell
ite
Pla
stic
sa
tell
ite
Pow
der
sa
tell
ite
Pla
stic
sa
tell
ite
Pow
der
sa
tell
ite
Pla
stic
sa
tell
ite
Pow
der
sa
tell
ite
Pla
stic
sa
tell
ite
Pow
der
sa
tell
ite
Without load
35 dB 41 dB 46 dB 49 dB 48 dB 53 dB 53 dB 58 dB 58 dB 64 dB
0,5 load 33 dB 39 dB 40 dB 48 dB 47 dB 50 dB 50 dB 56 dB 55 dB 63 dB
Full load 32 dB 38 dB 44 dB 46 dB 46 dB 49 dB 51 dB 55 dB 56 dB 62 dB

Vibroacoustical diagnosis of planetary precessional kinematical transmission 85
satellite wheel is made by powder metal (figure 2,b) [2].
Relatively low levels of noise can be explained by the multiplicity meshing of teeth (up to 100%) and the second factor which led to decrease noise level is represent by use of the plastic wheel (satellite) that have a greater capacity to damping shocks and vibrations and emitted noise level
CONCLUSIONS In conclusion we can mention that assessment
of measured values (Table 2) in line with VDI directive 2056 (Table 1) demonstrated good acoustical behavior of kinematical PPT gear box [1,2].
Bibliography
1. Malcoci Iu., Bodnariuc I. Vibroacoustical Diagnosis of Planetary Precessional Kinematical Transmission (Part I), Innovative Manufacturing Engineering International Conferince, IManE 2015, 20-22 May 2015, Iași, Romania, Trans Tech Ltd, pp. 593-597. 2. Malcoci Iu. Doctoral thesis „Vibro acoustic research of planetary precessional transmissions”, Technical University of Moldova, Chișinău. 2015. 3. Malcoci Iu. Precessional transmision sound research. Chișinău, Meridian Ingineresc nr.4, 2013. pp 64-69. 4. Bostan I, Dulgheru V, Țopa M, Bodnariuc I, Dicusară I, Trifan N, Ciobanu R, Ciobanu O, Odainâi V., Malcoci Iu. Antologia invenţiilor, Vol. 4. Transmisii planetare precesionale cinematice. Chișinău. Ed. Bons Offices, 2011, pp 179-226. 5. Abraham D., Boxhamer J., Mittash P. Instruction manual. PT500 –Machinery Diagnostic. PT500.04 – Computerised Vibration Analyser. G.U.N.T. Gerätebeu GmbH, Barsbütel, Germany. 11/2011. 6. Bodnariuc I. Doctoral thesis „Contributions to theelaboration and research on the kinematic planetary precessional transmissions”. Technical University of Moldova, Chișinău, 2010. 7. Institution of German Engs. (VDI), Directive 2056 „Guideline for evaluating mechanical vibrations from machinery”, Verlang, Düsseldorf (FRG), 10/1964. 8. http://www.bksv.com/Products/handheld-instruments/sound-level-meters/sound-level-meters/type-2250.aspx
Recommended for publication: 16.11.2016.

86 Elaboration and design of planetary precessional transmission
ELABORATION AND DESIGN OF THE PLANETARY PRECESSIONAL TRANSMISSION
Bostan I., Dr.Sc, prof., Dulgheru V., Dr.Sc. prof.
Technical University of Moldova
1. INTRODUCTION
A problem for engineering companies is to
satisfy the ever-increasing requirements to the transmissions used in majority of industrial machinery and technological equipment related to bearing capacity, compactness, mass and dimensions, low cost of production, to kinematical characteristics, structural compatibility with other aggregates of the equipment, etc. Gearings are considered the most sophisticated components of machines. Machine reliability depends very much on the gearing mechanical transmission operation, in general. The quality indices of traditional gears were increased largely by changing involute gearings, and by creating new gearings.
It becomes more and more difficult to satisfy the mentioned demands by partial updating of traditional transmissions. The target problem can be solved with special effects by developing new types of mechanical transmission - precessional planetary transmissions with multiple gear, that were developed by the authors. Due to these innovative features gearing multiplicity in planetary precessional transmission reaches 100% (in classical transmissions - 3-7%) which provides increased bearing capacity, reduced dimensions and weight, extended kinematical range 10 ... 3599 (in harmonic transmissions 79 ... 300), high kinematical accuracy, etc. The research team involved in research on precessional planetary transmissions published over 800 scientific articles, obtained about 180 patents, implemented about 20 practical achievements in the field of fine mechanics and specialized technological equipment, in robotic complexes for the exploration of ferro - manganese concretions from the World Ocean bottom (USSR concept), in spaceflight technique, etc. Know-how in the elaboration of multicouple precessional gear, manufacturing technology and control methods, and a range of precessional transmission diagrams belong to the research team from the Technical University of Moldova [1,2].
The specific character of sphere-spatial (precessional motions of the precessional transmissions pinion make impossible the utilisation
of classical involute teeth profiles. This fact requires the elaboration of new profiles adequate to the sphere-spatial motion of pinion, which would ensure high performances to the precessional transmission. Carrying out on the principle of the transfer function continuity and gear based on the principles of the transfer function continuity and gear multiplicity which aims to:
the elaboration of the gear mathematics model with account of the peculiarities;
the analytical description of teeth profiles by a system of parametric equations on spherical surface and normal teeth section for inner and plane gear;
CAD determination of geometrical and cinematic parameters influence of the gear upon the teeth profiles shape and the justification of their rational limits of variation;
the elaboration of the theoretical basis evaluation of teeth gear multiplicity in precessional transmissions;
area definition of gear multiplicity existence by 100% teeth couples. The production of non-standard teeth profiles requires a new manufacturing technology. In the complexity of problem “gear-synthesis-profile study- manufacturing“ the elaboration of efficient methods of teeth manufacturing which ensures a maximum productivity and reduced cost while satisfying the requirements related to the gear with precessional motion plays an important role. To solve this problem the following has been done:
we elaborated the mathematical model of teeth generation which shows the interaction of teeth in precessional gear;
we investigated the kinematics of the mechanism of method realisation for teeth generation;
we determined the tool path of motion and the family envelope of the generating surface by using the computer;
we elaborated and manufactured from metal milling and tooth grinding tools, inclusively their longitudinal modification.

Elaboration and design of planetary precessional transmission 87
2. KINEMATICAL STRUCTURE Depending on the structural diagram,
precessional transmissions fall into two main types – K-H-V and 2K-H, from which a wide range of constructive solutions with wide kinematical and functional options that operate in reducer and multiplier regime. The kinematical diagram of the precessional transmission K-H-V (fig. 1,a) comprises five basic elements: planet career H, satellite gear g, central wheel b with different number of teeth, connection mechanism W and the body (frame). The roller rim of the satellite gear g gears internally with the sun wheel b, and their teeth generators cross in a point, so-called the centre of precession. The satellite gear g is mounted on the planet (wheel) career H, designed in the form of a sloped crank, which axis forms some angle with the central wheel axis . Average gear ratio will be:
.med
g bgHV
b
z zi =
z
(1)
For g
g b bHV= +1, = 1 /iz z z , i.e. the drive and
driven shafts have opposite directions.
For g
g b bHV= - 1, = 1 /iz z z , i.e. the shafts rotate
the same direction. Precessional transmissions K-H-V fall under two basic types:
- with satellite wheel fixed to the casing; - with central wheel fixed to the casing.
The kinematical diagram of the precessional transmission 2K-H (fig. 1,b) comprises five basic elements: planet career H, satellite gear g with two crown gears Zg1 and Zg2, that gears with the unshiftable b and movable a central wheels.
1
2 1
g a
b g g a
z zi .
z z z z
(2)
The analysis of this relation demonstrates that precessional transmissions 2K-H provide the fulfilment of a large range of transmission ratios i = (12...3599). It is necessary to point out the series of peculiarities of the precessional transmissions 2K-H that ensure higher performances compared to similar planetary transmissions with cylindrical gears: precessional transmissions do not demand conditions of distance equality between the axis. This factor widens the area of their optimal design; precessional transmission kinematics does not limit the selection of the gear couples modules or of the rollers placement pitch. This factor increases the possibilities of shaping teeth pairs and of the
transmission ratios interval; the peculiarities of the designed precessional gears allow increasing in the number of teeth that transmit the load simultaneously and this fact reduces significantly the dimensions and mass for the same loads compared to the traditional involute gearings.
Based on the carried out analysis a constructive diagram of the precessional planetary transmission was designed, taken as the base of precessional multipliers design. The precessional planetary transmission (Fig. 2) comprises the crank shaft 1 on which the satellite block 2, and the fixed and the movable wheels 3 (the movable wheel is connected to the shaft 5) with nonstandard profile of teeth are installed (Fig. 3) [3]. The satellite block 2 has two crown gears (6 and 7) with the teeth executed as conical rollers mounted on the axle with the possibility of revolving around them. The transmission operates in the multiplier mode, as follows: at the rotation of the input shaft 5 with the gear 4, due to the difference in the number of geared teeth (Z4 = Z7 - 1, Z3 = Z6 - 1), the satellite block 2 will
a.
b.
Figure 1. Conceptual diagrams of precesional transmissions that operates efficiently in the
multiplication regime.
Vb
ZbZg
g
H2
1
V
V
a
Zg2Zg1
Zb
H
gbH
Za

88 Elaboration and design of planetary precessional transmission
perform a spherical-spatial motion around the point– centre of precession (the point of intersection of the crown gear roller axes and of the crank shaft axes 1), producing a complete precessional cycle at the rotation of the gear 4 at an angle equal to the angular pitch. Due to its mounting on the sloped side of the crank shaft 1, the precessional motion of the satellite block 2 is transformed into rotational motion of the crank shaft 1 that will produce a complete rotation during a complete precessional cycle of the satellite block.
Figure 3. The teeth profile of central wheels.
3. CALCULATION OF PRECESSIONAL GEAR AT CONTACT PRESSURE
Calculation is done for the wheel with the
smaller number of teeth 4Z , as it supports higher
loads. The Anthology of Inventions [2,4], written by the authors, describes the calculation methodology and the nomographic charts for the selection of
values of 5 basic parameters, that influence the teeth profile. The crank shaft pitch angle θ is recommended in the boundaries 1,5 – 3º. Roller taper angle β, generating angle (pressure angle) αw, the coefficient of proportionality of the associated teeth radiuses and the pitch angle of the roller axis are selected in conformity with the nomographic charts [2,4].
Preliminary calculation of the sun
gear effective diameter. The basic parameters that need calculation are shown in fig. 4. The calculation is done in the following sequence. Multiplicity gear is selected from the recommendations [2,4]. The number of teeth Z that carry
simultaneously the load is calculated:
4Z 1Z
2 100
(3)
(as Z is an integer, the decreasing integral value is
selected). The effective diameter of gear wheels md is
calculated from the relationship:
2 HP H HV3m 2
HO bd w
T 1 K K K cosd 53
Z tg cos
,mm
(4)
where: HK is the experimental coefficient [85], that
characterises the irregularity of load distribution between the teeth;
HK is the experimental coefficient [2,4], that
characterises the irregularity of load distribution on teeth length;
HK is the experimental coefficient [2,4], that
characterises load dynamics;
bd is the coefficient of tooth length [2,4] compared
to diameter dm. According to the effective diameter dm the following can be calculated: – length of gear wheel tooth wb :
w bd mb d , mm (5)
– length of rollers wrb :
wr wb b 2 , mm (6)
– rollers’ diameter in medium and abut section
1 3 6 2 7 4 5
Figure 2. Constructive diagram of the planetary precessional transmission 2K-H.

Elaboration and design of planetary precessional transmission 89
mrd , rrd :
mr m
tgd d
cos
, mm (7)
rr mr wrd d b tg , mm (8)
– diameter of rollers’ axes ad :
a mr wrd d b tg 2 , mm (9)
where ,mm is the thickness of roller plate (wall) in minimal section selected in the boundaries 1...5mm.
Determination of the allowable contact
pressures considering the rolling friction Initially, the tooth-roller friction velocity glV
is determined:
mr
iwarr
a
mrmax
max1gl
d
Kcossinsin2
ddfdf
d
Kf
flnKV
, (10) where 1K – is the coefficient depending on the working conditions of the upper kinematical coupling [2,4];
fmax – maximal value of the friction coefficient; K– rolling friction coefficient; f – friction coefficient; Taking into account Vgl , the allowable contact
pressure HOi is calculated from the relationship:
3K
glV
e72,028,0HOHOi , (11)
where: K3 – is the coefficient, selected from the recommended ones [2,4].
Determination of gear wheel effective
diameter and calculation of the geometrical parameters
The average diameter md of the gear wheels is
defined by the relationship:
2 HP H HV3m 2
HOi bd w
T 1 K K K cosd 53
Z tg cos
.
(12)
And the medium conical distance of the satellite rim with rollers msR – is defined by the relationship:
m
msw
dR
2 cos 1 tg sin tg
,
(13)
Depending on the medium diameter dm the following can be calculated: – length of gear wheel tooth wb :
w bd mb d , mm (14)
– length of rollers wrb :
wr wb b 2 , mm (15)
– rollers’ diameter in medium and abut section mrd , rrd :
mr m
tgd d
cos
, mm (16)
rr mr wrd d b tg , mm (17)
– diameter of rollers’ axes ad :
a mr wrd d b tg 2 , mm (18)
where is the thickness of roller plate (wall) in minimal section selected in the boundaries 1...5mm (calculation is done similarly for another couple of rollers).
Further on, the following can be calculated:
Figure 4. Precessional gear geometry.

90 Elaboration and design of planetary precessional transmission – the medium conical distance of the gear wheel:
mm
mr w
ms
dR
d sin2 cos ctg
2R
mm (19)
– exterior and interior conic distances of the roller rim esR , isR :
wres ms
bR R
2 , mm; wr
is ms
bR R
2 ,mm (20)
– exterior and interior conic distances of the gear wheel rim erR , irR :
wes mr
bR R
2 , mm; w
is mr
bR R
2 , mm (22)
– crest and foot cone angles of the teeth f , v
f 90 , ; v f 2 , . (23)
Verification of teeth resistance at contact
pressure. Allowable contact pressures H are calculated by formula:
2 HP H HVH
m mp w w
2T 1 K K K275 ,MPa
d d b Z cos
. (24)
Calculation is repeated with the constructive parameters modification, in particular of the „tooth-roller” couple to the condition HHOi .
Given the specific operation of the micro hydropower plant (24 hours out of 24) and taking into account the fact that the multiplier is overloaded with dynamic tasks, it is strictly necessary that the gear is subject to verification of teeth resistance at contact pressure for each operation system.
4. DESIGN OF PRECESSIONAL
REDUCER STRUCTURE On the basis of the undertaken study, diagram 2K-H was selected for the development of precessional multiplier of the micro hydropower plant. As a result of analysis of a wide range of tooth profiles with different
geometrical parameters of gear by using the mathematical modelling package MathCAD 2001 Professional, the optimum tooth profiles were selected with account of their functioning in conditions of multiplication. Also, in MathCAD 2001 Professional software the calculation of geometrical parameters of precessional gear was done (fig. 5).
The structures of precessional reducer were designed in SolidWorks software. The planetary precessional reducer is connected by flange with an electric motor, which allows obtaining a compact module, coaxial with the working machine. The structure from fig. 6 is proposed for planetary precessional reducer functioning in conditions of
Figure 5. Central wheel with nonstandard profile
of teeth.
a.
b.
Figure 6. Planetary precessional multiplier: a – general view; b – section view.

Elaboration and design of planetary precessional transmission 91 lower temperatures. On the Fig. 7 the main components of precessional reducer are shown.
To simulate the multiplier assembly and functioning, the dynamic computerised model of the precessional reducer was developed in AutoDesk MotionInventor. The planetary precessional transmission has reduced dimensions and mass, high lifting capacity and reduced ratio up to i = 144 (based on a two stage diagram) with satisfactory mechanical efficiency.
CONCLUSIONS
Among the characteristics of the estimated results of the research in the field of new and efficient drive development we can enumerate the followings:
the precessional drives elaborated ensure: high load-carrying capacity; high mechanical efficiency; high kinematic accuracy; low noise level and vibrations;
costs of drives becomes more attractive as the costs of other equivalent drives. The structural optimization of the precessional transmissions will allow synthesis of new schematics of precessional transmissions with constant and variable transmission ratio and elaboration of new schematics of precessional transmissions for specific running conditions.
Bibliography 1. Bostan I. Precessional transmission with multicouple gear: [Monogr. ] /S. Suvalova (red.). - Chişinău: Ştiinţa, 1991. - 355 p. 2. Bostan I., Dulgheru V., Sochireanu A., Babaian I. Anthology of Inventions: Vol. 1. Planetary Precessional Transmissions, 2011, 593p. ISBN 978-9975-4100-9-0. 3. Bostan I., Ţopa M., Dulgheru V., Vaculenco M. Patent No. 1886 B1 (MD), CIB F16H1/32; B23F9/06. Precessional gearing and procedure for its realisation / T.U.M. – No.2000 – 071; Decl. 13. 10. 2000; Publ. BOPI – 2002. – No. 4. Bostan I., Dulgheru V., Grigoraş Ş. Planetary, precessional and harmonic transmissions. Atlas. – Ed. Tehnică Bucureşti – Ch.: Tehnica, 1997. - 200 p. – ISBN 973-31-1069-8.
Recommended for publication: 24.11.2016
Figure 7. The basic components of precessional gearing reducer.

92 Teaching creativity and inventive problem solving in science
TEACHING CREATIVITY AND INVENTIVE PROBLEM SOLVING IN SCIENCE
What Is Creativity? How to define creativity is an age-old question. Justice Potter Stewart's famous dictum regarding obscenity “I know it when I see it” has also long been an accepted test of creativity. But this is not an adequate criterion for
developing an instructional approach. A scientist colleague of mine recently noted that “Many of us [in the scientific community] rarely give the creative process a second thought, imagining one either ‘has it’ or doesn't.” We often think of inventiveness or creativity in scientific fields as the kind of gift associated with a Michelangelo or Einstein. This is what Kaufman and Beghetto (2008) call big-C creativity, borrowing the term that earlier workers applied to the talents of experts in various fields who were identified as particularly creative by their expert colleagues (MacKinnon, 1978 ). In this sense, creativity is seen as the ability of individuals to generate new ideas that contribute substantially to an intellectual domain. Howard Gardner defined such a creative person as one who “regularly solves problems, fashions products, or defines new questions in a domain in a way that is initially considered novel but that ultimately comes to be accepted in a particular cultural setting” (Gardner, 1993).
But there is another level of inventiveness termed by various authors as “little-c” (Craft, 2000) or “mini-c” (Kaufman and Beghetto, 2008) creativity that is widespread among all populations. This would be consistent with the workplace definition of creativity offered by Amabile and her coworkers: “coming up with fresh ideas for changing products, services and processes so as to better achieve the organization's goals” (Amabile et al., 2005 ). Mini-c creativity is based on what Craft calls “possibility thinking” (Craft, 2000), as experienced when a worker suddenly has the insight to visualize a new, improved way to accomplish a task; it is represented by the “aha” moment when a student first sees two previously disparate concepts or facts in a new relationship, an example of what Arthur Koestler identified as bisociation: “perceiving a situation or event in two habitually incompatible associative contexts” (Koestler, 1964).
In this essay, I maintain that mini-c creativity is not a mysterious, innate endowment of rare
individuals. Instead, I argue that creative thinking is a multicomponent process, mediated through social interactions, that can be explained by reference to increasingly well-understood mental abilities such as cognitive flexibility and cognitive control that are widely distributed in the population. Moreover, I explore some of the recent research evidence (though with no effort at a comprehensive literature review) showing that these mental abilities are teachable; like other higher-order cognitive skills (HOCS), they can be enhanced by explicit instruction.
Creativity Is a Multicomponent Process
Efforts to define creativity in psychological terms go back to J. P. Guilford (Guilford, 1950) and E. P. Torrance (Torrance, 1974), both of whom recognized that underlying the construct were other cognitive variables such as ideational fluency, originality of ideas, and sensitivity to missing elements. Many authors since then have extended the argument that a creative act is not a singular event but a process, an interplay among several interactive cognitive and affective elements. In this view, the creative act has two phases, a generative and an exploratory or evaluative phase (Finke et al., 1996). During the generative process, the creative mind pictures a set of novel mental models as potential solutions to a problem. In the exploratory phase, we evaluate the multiple options and select the best one. Early scholars of creativity, such as J. P. Guilford, characterized the two phases as divergent thinking and convergent thinking (Guilford, 1950). Guilford defined divergent thinking as the ability to produce a broad range of associations to a given stimulus or to arrive at many solutions to a problem (for overviews of the field from different perspectives, see Amabile, 1996; Banaji et al., 2006; Sawyer, 2006). In neurocognitive terms, divergent thinking is referred to as associative richness (Gabora, 2002; Simonton, 2004), which is often measured experimentally by comparing the number of words that an individual generates from memory in response to stimulus words on a word association test. In contrast, convergent thinking refers to the capacity to quickly focus on the one best solution to a problem.
The idea that there are two stages to the creative process is consistent with results from cognition research indicating that there are two distinct modes of thought, associative and analytical (Neisser, 1963; Sloman, 1996). In the associative mode, thinking is defocused, suggestive, and

The Creative Personality 93
intuitive, revealing remote or subtle connections between items that may be correlated, or may not, and are usually not causally related (Burton, 2008).
In the analytical mode, thought is focused and evaluative, more conducive to analyzing relationships of cause and effect (for a review of other cognitive aspects of creativity, see Runco, 2004). Science educators associate the analytical mode with the upper levels (analysis, synthesis, and evaluation) of Bloom's taxonomy (e.g., Crowe et al., 2008), or with “critical thinking,” the process that underlies the “purposeful, self-regulatory judgment that drives problem-solving and decision-making” (Quitadamo et al., 2008). These modes of thinking are under cognitive control through the executive functions of the brain. The core executive functions, which are thought to underlie all planning, problem solving, and reasoning, are defined (Blair and Razza, 2007) as working memory control (mentally holding and retrieving information), cognitive flexibility (considering multiple ideas and seeing different perspectives), and inhibitory control (resisting several thoughts or actions to focus on one). Readers wishing to delve further into the neuroscience of the creative process can refer to the cerebrocerebellar theory of creativity (Vandervert et al., 2007) in which these mental activities are described neurophysiologically as arising through interactions among different parts of the brain.
The main point from all of these works is that creativity is not some single hard-to-measure property or act. There is ample evidence that the creative process requires both divergent and convergent thinking and that it can be explained by reference to increasingly well-understood underlying mental abilities).
Creativity Is Widely Distributed and
Occurs in a Social Context Although it is understandable to speak of an
aha moment as a creative act by the person who experiences it, authorities in the field have long recognized (e.g., Simonton, 1975) that creative thinking is not so much an individual trait but rather a social phenomenon involving interactions among people within their specific group or cultural settings. “Creativity isn't just a property of individuals, it is also a property of social groups” (Sawyer, 2006). Indeed, Osborn introduced his brainstorming method because he was convinced that group creativity is always superior to individual creativity. He drew evidence for this conclusion from activities that demand collaborative output, for example, the improvisations of a jazz ensemble. Although each musician is individually creative during a
performance, the novelty and inventiveness of each performer's playing is clearly influenced, and often enhanced, by “social and interactional processes” among the musicians (Sawyer, 2006). Recently, Brophy (2006) offered evidence that for problem solving, the situation may be more nuanced. He confirmed that groups of interacting individuals were better at solving complex, multipart problems than single individuals. However, when dealing with certain kinds of single-issue problems, individual problem solvers produced a greater number of solutions than interacting groups, and those solutions were judged to be more original and useful.
Consistent with the findings of Brophy (2006) , many scholars acknowledge that creative discoveries in the real world such as solving the problems of cutting-edge science—which are usually complex and multipart—are influenced or even stimulated by social interaction among experts. The common image of the lone scientist in the laboratory experiencing a flash of creative inspiration is probably a myth from earlier days. As a case in point, the science historian Mara Beller analyzed the social processes that underlay some of the major discoveries of early twentieth-century quantum physics. Close examination of successive drafts of publications by members of the Copenhagen group revealed a remarkable degree of influence and collaboration among 10 or more colleagues, although many of these papers were published under the name of a single author (Beller, 1999). Sociologists Bruno Latour and Steve Woolgar's study (Latour and Woolgar, 1986) of a neuroendocrinology laboratory at the Salk Institute for Biological Studies make the related point that social interactions among the participating scientists determined to a remarkable degree what discoveries were made and how they were interpreted.
In sum, when an individual experiences an aha moment that feels like a singular creative act, it may rather have resulted from a multicomponent process, under the influence of group interactions and social context. The process that led up to what may be sensed as a sudden insight will probably have included at least three diverse, but testable elements: 1) divergent thinking, including ideational fluency or cognitive flexibility, which is the cognitive executive function that underlies the ability to visualize and accept many ideas related to a problem; 2) convergent thinking or the application of inhibitory control to focus and mentally evaluate ideas; and 3) analogical thinking, the ability to understand a novel idea in terms of one that is already familiar.

94 Teaching creativity and inventive problem solving in science
What Do We Know about How to Teach
Creativity? The possibility of teaching for creative
problem solving gained credence in the 1960s with the studies of Jerome Bruner, who argued that children should be encouraged to “treat a task as a problem for which one invents an answer, rather than finding one out there in a book or on the blackboard” (Bruner, 1965). Since that time, educators and psychologists have devised programs of instruction designed to promote creativity and inventiveness in virtually every student population: pre–K, elementary, high school, and college, as well as in disadvantaged students, athletes, and students in a variety of specific disciplines (for review, see Scott et al., 2004). Smith (1998) identified 172 instructional approaches that have been applied at one time or another to develop divergent thinking skills.
Some of the most convincing evidence that elements of creativity can be enhanced by instruction comes from work with young children. Bodrova and Leong (2001) developed the Tools of the Mind (Tools) curriculum to improve all of the three core mental executive functions involved in creative problem solving: cognitive flexibility, working memory, and inhibitory control. In a year-long randomized study of 5-yr-olds from low-income families in 21 preschool classrooms, half of the teachers applied the districts' balanced literacy curriculum (literacy), whereas the experimenters trained the other half to teach the same academic content by using the Tools curriculum (Diamond et al., 2007). At the end of the year, when the children were tested with a battery of neurocognitive tests including a test for cognitive flexibility (Durston et al., 2003; Davidson et al., 2006), those exposed to the Tools curriculum outperformed the literacy children by as much as 25% (Diamond et al., 2007). Although the Tools curriculum and literacy program were similar in academic content and in many other ways, they differed primarily in that Tools teachers spent 80% of their time explicitly reminding the children to think of alternative ways to solve a problem and building their executive function skills.
Teaching older students to be innovative also demands instruction that explicitly promotes creativity but is rigorously content-rich as well. A large body of research on the differences between novice and expert cognition indicates that creative thinking requires at least a minimal level of expertise and fluency within a knowledge domain (Bransford et al., 2000; Crawford and Brophy, 2006). What distinguishes experts from novices, in addition to their deeper knowledge of the subject, is their
recognition of patterns in information, their ability to see relationships among disparate facts and concepts, and their capacity for organizing content into conceptual frameworks or schemata (Bransford et al., 2000; Sawyer, 2005).
Such expertise is often lacking in the traditional classroom. For students attempting to grapple with new subject matter, many kinds of problems that are presented in high school or college courses or that arise in the real world can be solved merely by applying newly learned algorithms or procedural knowledge. With practice, problem solving of this kind can become routine and is often considered to represent mastery of a subject, producing what Sternberg refers to as “pseudoexperts” (Sternberg, 2003).
But beyond such routine use of content knowledge the instructor's goal must be to produce students who have gained the HOCS needed to apply, analyze, synthesize, and evaluate knowledge (Crowe et al., 2008). The aim is to produce students who know enough about a field to grasp meaningful patterns of information, who can readily retrieve relevant knowledge from memory, and who can apply such knowledge effectively to novel problems. This condition is referred to as adaptive expertise (Hatano and Ouro, 2003; Schwartz et al., 2005). Instead of applying already mastered procedures, adaptive experts are able to draw on their knowledge to invent or adapt strategies for solving unique or novel problems within a knowledge domain. They are also able, ideally, to transfer conceptual frameworks and schemata from one domain to another (e.g., Schwartz et al., 2005). Such flexible, innovative application of knowledge is what results in inventive or creative solutions to problems (Crawford and Brophy, 2006; Crawford, 2007). * Robert L. De Haan. Teaching Creativity and Inventive Problem Solving in Science. CBE Life Sci Educ. 2009 Fall; 8(3): 172–181
Column written by professor Valeriu Dulgheru, Ph.D. Dr. Sc. from Technical
University of Moldova

Personalities from the meridians of the engineering universe 95
PERSONALITIES OF THE SCIENTIFIC UNIVERSE: Hermann Oberth
Hermann Oberth was born on June 25, 1894 in Sibiu, in a family of Enlightenment. His grandfather Friedrich Krasser, wrote several progressive poems which include Antisyllabus and Tabula rasa published in the volume Open Awnings. History says that in July
1869 at a regular Sunday meeting in the house of Friedrich Krasser, who was Hermann Oberth' s grandfather, he said: “Folks, you can believe what you want, but beware that in a hundred years people will land on the moon”. One hundred years later, on July 22nd, 1969 the first man walked on the moon. Hermann's mother, Valerie Oberth was a wise and intelligent woman, endowed with an extraordinary memory. Valerie bought many books for her two young sons. Among them, Jules Verne's novels. Hermann's father was a famous surgeon, he was just, persevering and easily enthusiastic. He was the director of Sighisoara county hospital for 30 years, from 1896 to 1926. With a proverbial sense of duty he contributed to the formation of the bright spirit and remarkable character of his son.
Childhood Hermann's inventive spirit was manifested
from a tender age. It is said that at the age of four he built a wooden locomotive and asked the guests who had come to visit if he could use that engine to reach the moon, as his grandfather had said. He envisioned a water mill intended for the Niagara fall. He was then six years old.
At the age of six Hermann Oberth started studying at the famous "School on the Hill". The school is famous because it was documented in 1522 and because many important people studied here. Most of those passing through Sighisoara nowadays climb the 174 steps to the school.
Throughout the school, he studied the problem of space flight. He made calculations and experiments. In 1908, when he was fourteen, he built a centrifuge with 35 meter-long arms, rotating around a vertical shaft to check whether a man can withstand the force exerted at a rocket launch.
Higher education In 1913 he went to Munich to study medicine
as his father wanted, but he often went to hear technical college courses. Meanwhile war broke out and he went to the front. He was wounded and continued his military service as a health sergeant.
In 1917, he calculated the first long-distance missile, which had a length of 25 meters and a diameter of 5 m. As fuel he suggested a mixture of alcohol, water and liquid air. So - liquid fuel. It was the first project in the world of a long-range rocket using liquid fuel.
For what he wanted to do he needed thorough learning, so in February 1919 he joined the University of Cluj, and in autumn he was transferred to Munich. With new knowledge, but also based on the information he had already accumulated in the summer of 1920, he completed the project of a hydrogen and oxygen missile. On this occasion, he made a new invention: the multistage rocket. The lower stage used a mixture of alcohol and oxygen, and the upper stage, a mixture of hydrogen and oxygen. It was the first project in the world of a multi-stage missile with liquid fuel based on numerical calculations. He then designed a rocket for meteorological research and finally a rocket that was supposed to get into space with people on board, being the first which introduced mathematical calculations on the launch of a rocket to the moon and parachute landing. The project was presented as a dissertation at the University of Heidelberg, and then, on 23 May 1923 at the Faculty of Physics of Cluj. The Commission was chaired by Augustin Maior.
Rockets In 1923, Oldenbourg in Munich published the
book “A rocket to the interplanetary space” which had the same title as his dissertation. Many of the proposed solutions have already been implemented or are currently being applied: the optimum launch speed and the trajectory of the rising rocket from west to east, bell-shaped nozzles for high speed exhaust, regenerative cooling, hardening fuel tanks by slight overpressure, parachute landing, cleaning the air in the capsule through distillation. In 1925 Oberth family moved to Mediaș, where Hermann took a job teaching mathematics and physics at the Stephan Ludwig Roth secondary school. He continues his research, although financial resources were modest, and in 1929 Oldenbourg published the book called "Spatial navigation routes", which

96 Personalities from the meridians of the engineering universe
entered the history of science as a model work, often called “The Bible of astronautics”.
Hermann Oberth's life story began with Jules Verne's fiction. It also continued with fiction. In 1928 he participated as a scientific consultant to the shooting of the film "The Woman on the Moon" by UFA studios in Germany. The images in the film forecasted the real 1969 launch of a space missile from Cape Kennedy. The platform of the rocket, the inside of the ship, although fiction in 1928, were arranged as in today's spacecrafts. At that time, he devised the tapered engine and obtained several Patents: Propulsion of the vehicle with devices operated by reactive gas ejection, The rapid combustion process (1931).
After the premiere of The Woman on the Moon, he went back to Mediaș as a middle school teacher, but he continued his research with his own financial means. In 1932 he published in the Romanian magazine “Nature” the article „The missile flight and the vacuum flight”. In the same year he took over the gymnasium workshop where he was able to realize and experiment many of the solutions he had imagined. Hermann says in a letter that it managed to launch the first liquid fuel rocket. It can be said that Mediaș was the first city in which a missile was launched. The gates were open to space flight. People can now visit the Hermann Oberth Museum in Medias.
The cosmic mirror In 1923, he designed a cosmic mirror able
to concentrate the solar energy into specific points on earth. With an individual mirror facet an entire city could be lit at night, with no need for electrical installations for street lighting.
After 1938 there followed years of hardship for Hermann. There had been years of professional achievements but also psychological deceptions that were related to people's and officials' attitudes.
He passed away on December 28th 1989 in Feucht, Nuremberg, Germany.
Section which is performed by Prof. Dr. Engineer Gheorghe Manolea, University of Craiova, Doctor
Honoris Causa of the Technical University of Moldova in Chisinau

Wind energy conversion in Republic of Moldova 97
The first and only wind mega turbine installed in Moldova (v. Brătuşeni, Edineţ)
Power – 1100 kW
Height - 60 meters
Tower diameter - 5.4 meters
Blades length - 27 meters

98 The National Centre of Space Technologies

Solar energy - a safe energy source in Moldova 99
Photovoltaic park in Ungheni (450 kW): solar panels can generate about 3000 kWh per day.
The Centre Porsche, Chişinău (333 kW): first solar park in Moldova

100 The title of article (Format A4, Times New Roman, 11, bold, Italic, center)
(11 points) TITLE OF ARTICLE, MAXIMUM 3 ROWS, ON THE ENTIRE WIDTH OF THE PAGE,
(R_TIMES 14 POINTS, BOLD, CENTER, ALL CAPS) (11 points)
Aurel Bradu, dr.prof. (The name(s) of Authors(s), R_Times, 11 points, bold, Italic, center) University... (Name of the institution where the Author works, R_Times, 11 points, italic, normal, center)
(11 points) (11 points)
INTRODUCTION (R_TIMS 13 POINTS, BOLD, CENTER, ALL CAPS)
(11points) <Tab> The paper may contain an introduction of 20 lines maximum describing the general aspects the background of issues dealt with.
(11 points) (11 points)
1. TITLE OF THE FIRST CHAPTER, NUMBERED IN ARABIC NUMERALS (R_TIMS 13 POINTS, BOLD, CENTER,
TWO COLUMNS, ALL CAPS) (11 points)
<Tab> In front of each chapter title leave an empty space of two lines. The text of the paper (R_Times, 11 points, normal) begins after chapter titles, after leaving a blank line ( 11 points).
(11 points) 1.1. Sample of subtitle with 2 indexes (R_Times 13 points, bold, justify)
(11 points) <Tab> In front of the text of each title of sub-chapter with two indexes leave a one line empty space. In the text, each new paragraph is marked by the introduction of a „<Tab>”. (11 points) 1.1.1.Sample of subtitle with 3 indexes (R_Times 12 points, bold, justify) <Tab> If the work contains subtitles with three indexes, their text begins directly after subtitle without space. To emphasize the importance of certain words within the text they can be entered only by marking them with bold text (without underlining).
(11 points) (11 points)
2. INSTRUCTIONS FOR PAPER TYPEWRITING (11 points)
2.1. General aspects (11 points)
<Tab> The works that do not comply with the instructions exactly will be rejected. Paper typewriting is binding in word processor Microsoft Word for Windows ’95 / ’97 / ’98 / ’2000, Version 6.0, Version 7.0, Windows NT. Only fonts R_ Times (normal, bold, italic, ALL CAPS, or ALL CAPS) are used for typewriting. The paper is submitted in one copy, laser or ink get printed, and is accompanied by a floppy disk that will contain „doc files” of the paper and summary.
(11 points) 2.2. Page skeleton: (11 points) <Tab> Page skeleton is the following: Top: 2,0 cm; Bottom: 2,0 cm; Left: 2,0 cm; Right: 2,0 cm; Header: 1,75 cm; Footer: 0 (11 points) 2.3. Typewriting format of the paper text: 2.3.1. Writing in two-column format. The paper text, computing relations, figures and tables are inserted on two columns under this sample: Number of Columns: 2; Width: 8.15 cm; Spacing: 0.7 cm. <Tab> Where the text must contain embedded tables or figures that exceed the column width specified above, to maintain their clarity, you can enter on the page a work area in a single column (between two „session break”). (11 points) 2.3.2. The format of writing paragraphs <Tab> Text of the paper is drawn at a single line (single), all paragraphs are left / right aligned (justify). 2.3.3. Header <Tab> The „Header” contains the full title of the paper (R_Times, 11 points, bold, italic, centered), unless it exceeds one line, situation in which the title is written partially followed by....
(11 points) 2.3.4. Fonts <Tab> The text of the paper shall be written using only font R_Times,
11 points, normal, (eventual R_Times, 11 points, bold, if special highlights of text passages are necessary). Font R_TIMES, BOLD, ALL CAPS are used only for the title and the chapter titles of the paper.
(11 points) 2.3.5. Paper pagination <Tab> THE PAPER IS NOT PAGINATED, as it follows to be inserted in the journal. 2.4. Figures, tables and mathematical formulas 2.4.1. Figures <Tab> All figures are inserted in the file „paper.doc”. The maximum width of an inserted figure to the text (one column) cannot exceed the column width. All figures are numbered in Arabic numerals and presented according to the sample below. Before and after each figure inserted into the text leave one blank line. If images are inserted, they will be scanned with a minimum resolution of 300 dpi (600 dpi preferable), and will be edited such as to have good contrast. It is not allowed sticking photos or drawings on separate sheets. If the figures have annotations in the form of numbers or letters they should have a height of letters equivalent to font R_Times, 11 points, normal, and under the title of figure the legend is inserted with necessary explanations.
Figure 1. Systematic unitary concept of „R1 integrated in the environment...”. 1 – unity; 2 – ensemble...
(11 points) 2.4.2. Tables. Tables are numbered in Arabic numerals and presented according to the sample below. Table 1. Sample of titrating a table.
(6 points) Features /Measurements
Determ. Nr.1 Determ. Nr.2 Determ. Nr.3
(11 points) <Tab> Before and after each table included in the text leave one blank line... All grid lines forming the table have the same thickness (1 point). In the Table the text/figures are written using R_Times font, 11 points, and normal, except the head of the table.
(11 points) 2.4.3. Mathematical formulas. All mathematical formulas are written COMPULSORY with the equation editor of the word processor Micro-soft Word for Windows ’95/, 97/, 98/, 2000, (Version 6.0, / Version 7.0, 2000), bold, italic, centered according to the sample below. (6 points)
A2+B2=C2 (1) (6 points) 2.5. Reference. Before Reference leave two blank lines... (11 points). Between the title „Reference” and bibliographic references themselves leave one blank line. References are written according to the sample below:
Reference (R_Times, 11 points, italic (in bold only the surname and name of author), justify. Sources in Cyrillic characters will be transliterated)
(11 points) 1. Nicolescu, A., Stanciu, M. Static capacity and elastic deformations of the guides // TCMM Conference, Chişinău, pages 141...148, 1996. 2. Nicolescu, A., Enciu, G. Design of industrial robots. Meridian Ingineresc No.1, Chişinău, pag.11...20, 1995. 3. Nicolescu A. Industrial robot // Patent no. 1344MD. BOPI no. 10, 1999.
ABSTRACTS <Tab> For each paper submitted to be published in the journal, it is mandatory to draw up an abstract in ROMANIAN, ENGLISH, FRENCH and RUSSIAN. The abstract should contain a maximum of 10 lines and will be presented following the sample. Nicolescu A. Design of industrial robots. This paper..... <Tab> Abstracts are drawn SEPARATELY from the paper and are submitted all in one file.