chhindwara district at a glance - central …cgwb.gov.in/district_profile/mp/chhindwara.pdf ·...
TRANSCRIPT

CHHINDWARA DISTRICT MADHYA PRADESH
Ministry of Water Resources
Central Ground Water Board North Central Region
BHOPAL
September, 2013
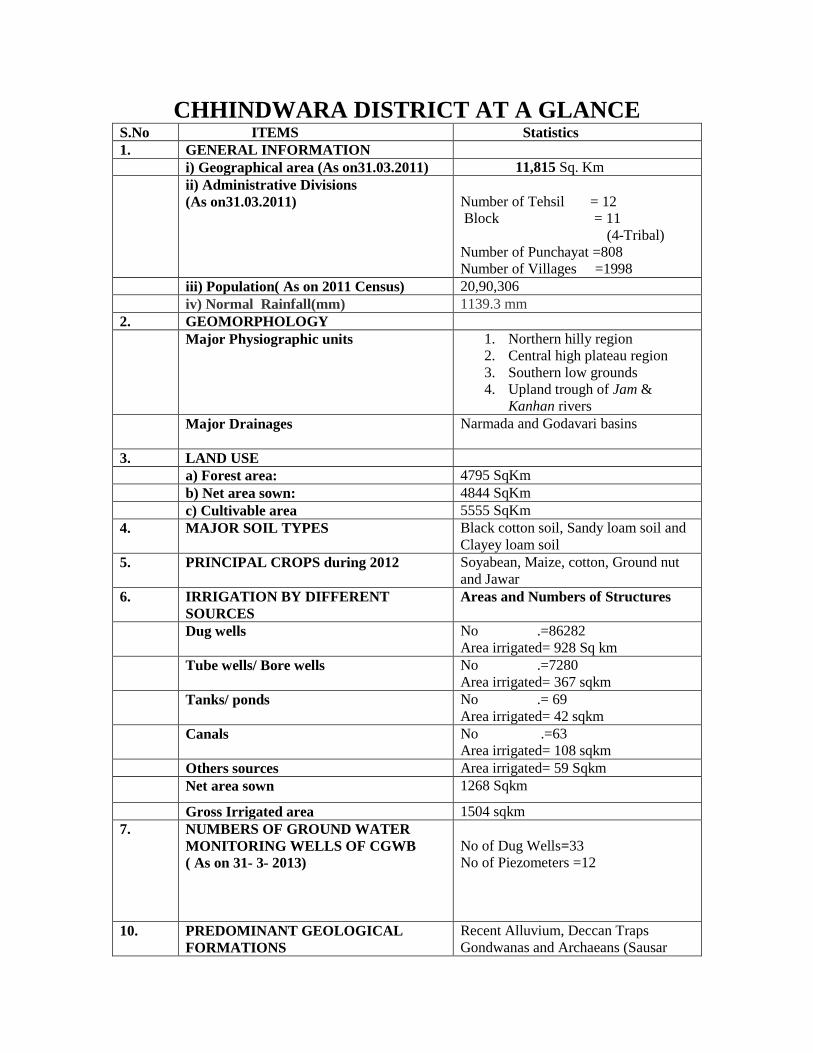
CHHINDWARA DISTRICT AT A GLANCE S.No ITEMS Statistics
1. GENERAL INFORMATION
i) Geographical area (As on31.03.2011) 11,815 Sq. Km
ii) Administrative Divisions
(As on31.03.2011)
Number of Tehsil = 12
Block = 11
(4-Tribal)
Number of Punchayat =808
Number of Villages =1998
iii) Population( As on 2011 Census) 20,90,306
iv) Normal Rainfall(mm) 1139.3 mm
2. GEOMORPHOLOGY
Major Physiographic units 1. Northern hilly region
2. Central high plateau region
3. Southern low grounds
4. Upland trough of Jam &
Kanhan rivers
Major Drainages Narmada and Godavari basins
Kanhan
3. LAND USE
a) Forest area: 4795 SqKm
b) Net area sown: 4844 SqKm
c) Cultivable area 5555 SqKm
4. MAJOR SOIL TYPES Black cotton soil, Sandy loam soil and
Clayey loam soil
5. PRINCIPAL CROPS during 2012 Soyabean, Maize, cotton, Ground nut
and Jawar
6. IRRIGATION BY DIFFERENT
SOURCES
Areas and Numbers of Structures
Dug wells No .=86282
Area irrigated= 928 Sq km
Tube wells/ Bore wells No .=7280
Area irrigated= 367 sqkm
Tanks/ ponds No .= 69
Area irrigated= 42 sqkm
Canals No .=63
Area irrigated= 108 sqkm
Others sources Area irrigated= 59 Sqkm
Net area sown 1268 Sqkm
Gross Irrigated area 1504 sqkm
7. NUMBERS OF GROUND WATER
MONITORING WELLS OF CGWB
( As on 31- 3- 2013)
No of Dug Wells=33
No of Piezometers =12
10. PREDOMINANT GEOLOGICAL
FORMATIONS
Recent Alluvium, Deccan Traps
Gondwanas and Archaeans (Sausar

series)
11. HYDROGEOLOGY
Major water bearing formation
(Pre- monsoon Depth to water
level Range during 2012)
(Post- monsoon Depth to water
level Range during 2012)
Long term water level trend
Range Range in 10 yrs (2001-
2010) in m/yr
Archaeans (Gneisses, Schist, Granites&
Pegmatite), Gondwanas, Deccan traps,
Alluvium
Min.= 1.60m, Max. =35.00m
Min.= 0.70m, Max. =17.19m
Pre monsoon -Rising 0.02 to 0.2 m
/year
Fall 0.02 to 0.2m /year
12. GROUND WATER EXPLOTION BY
CGWB(As on 31- 03- 2013)
No of wells drilled (EW, OW, PZ, Total) Exploratory Wells =31
Observation Wells = 09
Piezometers (H.P) =12
Total = 52
Depth range(m) (EW) 35.60-201.30 m
Discharge( litres per second) 0.10-10.00 lps
Storativity(s) -
Transmissivity 4.78 m2/ day
13. GROUND WATER QUALITY
Presence of Chemical constituent more
than permissible limit
Ground water in phreatic aquifer is
potable but excessive fluoride (1.60-
20.00 Mg/l ) is noticed in deeper
aquifers. EC- 280-1600, Nitrate- 1-243,
Fluoride - .09-.97 in phreatic aquifer
Type of water for irrigation purpose C3-S1and C3-S2 Type
14. DYNAMIC GROUND WATER
RESOURCES ( 2009 )
Ground Water availability 1385.94 MCM
Gross Annual Ground Water Draft 712.39 MCM
Projected Demand for Domestic and
industrial Uses for next 25 years (2033)
69.38 MCM
Stage of Ground water Development 51 %
15. EFFORTS OF ARTIFICIAL
RECHARGE & RAINWATER
HARVESTING
Recommended construction of
Artificial recharge structures in
Fluoride –affected areas and Artificial
Recharge through dug well
16. GROUND WATER CONTROL AND
REGULATION
17. AWARENESS AND TRAINING
ACTIVITY
Water Management Training
Programmes-1
Number of Semi-Critical Blocks 1 (Chhindwara)
18. Major Ground water problems Fluoride –affected District

1.0 INTRODUCTION
Chhindwara district was formed on 1st November 1956. It is located on the Southwest region
of 'Satpura Range of Mountains'. The district is spread over an area of 11,850 Sq. km and is
located at the southern boundary of the state, laying between North Latitudes 210 28’ and 22
0 50’
and East longitudes 780 15’ and 79
0 25’ falls under the Survey of India Topo Sheet No. 55 J, K,
N, & O. The district is bounded by Narsinghpur and Hoshangabad district in the north, Seoni
district in the east, Betul district in the west and by Maharashtra state in the south (Fig-1).
The District is divided into 12 Tahsils (Chhindwara, Tamia, Parasia, Jamai, Chourai, Amarwara,
Sausar, Bichhua Umreth, Mohkhed, Harrai and Pandhurna) and 11 Development Blocks
(Chhindwara, Mohkhed, Tamia, Parasia, Jamai, Amarwara, Harrai, Chourai, Sausar Bichhua,
and Pandhurna). There are 1984 villages in the district, out of which 1903 villages are habitated
(Table.1)
As per Census 2001, the total population of the district is 18, 48,882 out of which 76.90%
belong to rural areas. The Scheduled Caste and Scheduled Tribes population is 2, 14,201 and 6,
41,421 respectively.
Table 1. Administrative units of Chhindwara district.
S. No. Blocks Area in Sq. km.
1 Amarwara 1022
2 Bichhua 527
3 Chhindwara 683
4 Chourai 1172
5 Harrai 2107
6 Jamai 1424
7 Mohkhed 775
8 Pandhurna 972
9 Parasia 787
10 Sausar 808
11 Tamia 1538
Toatal 11815
The district lies in parts of the Narmada and the Godavari basin, Wainganga sub basins.
The total catchments areas of the Narmada & the Wainganga rivers falling in the district are
3,555 and 8,295 Sq. km respectively. The major tributaries of the Godavari River are Kanhan,
Pench and Wardha, while Sakkar, Sitarewa, Dudh are tributaries of Narmada River
Crops: Paddy, Barley, Maize, Tuar, Urad, Soyabean, Sugarcane, Groundnut, Cotton
(KHARIF) and Wheat, Gram & Vegetables (RABI) are the main crops. The total irrigated area is
1504 Sq. km., of which 108 Sq. km.was irrigated by canals, 367 Sq. km. by tube wells and 928
Sq. km. by open wells
N
I
P onc h R
S
H
T
R
A
To N
agpur
CHHINDWARA
M A H A R A
To M
ulloi
B E
T U
L
Pandhurna S ausar
Mohk hed
S E O
B ichhua
K ulbehra R
Chaurai
To Seoni
J amai
P arasia
Tamia
To pi paria
A marwara
Horo
R
Harrai
T o Narsimhapur
SCALE
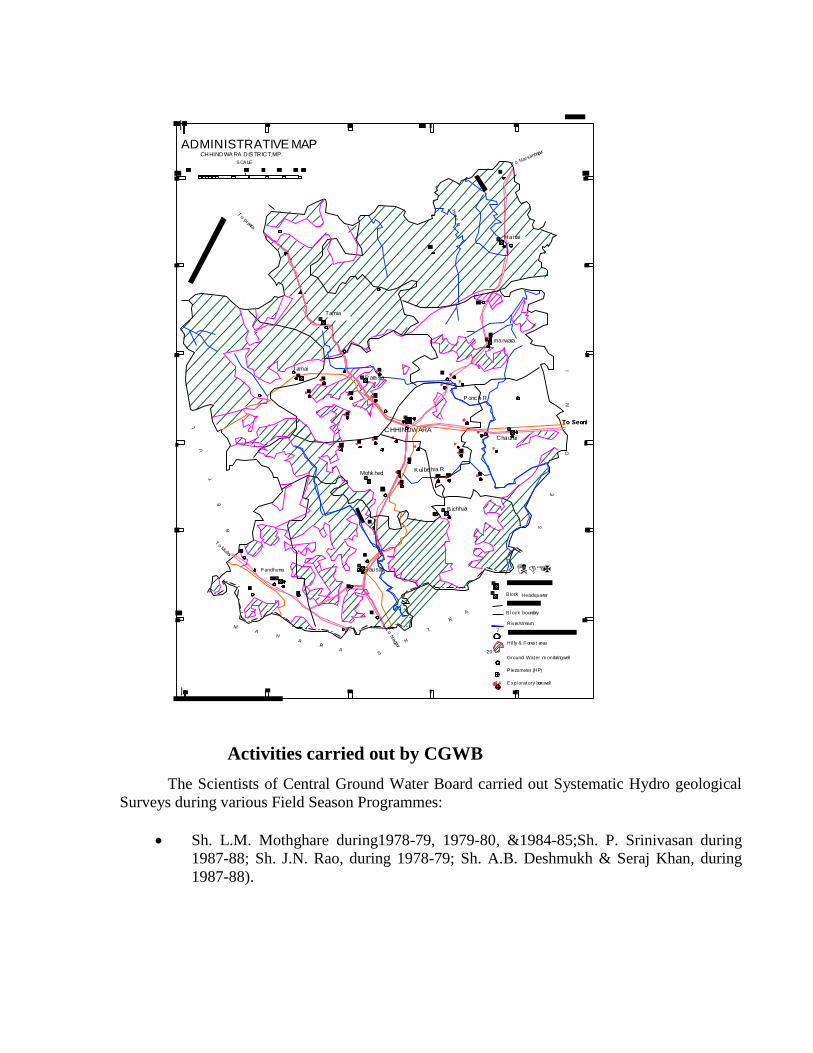
ADMINISTRATIVE MAP CHHINDWA RA DIS TRICT,M.P.
Expl oratory bore well
P iezometer (HP)
Ground Water m onitoring well
14
20
B l ock boundary
River/stream
Hil ly & F orest area
HeadquarterB lock
7
Activities carried out by CGWB
The Scientists of Central Ground Water Board carried out Systematic Hydro geological
Surveys during various Field Season Programmes:
Sh. L.M. Mothghare during1978-79, 1979-80, &1984-85;Sh. P. Srinivasan during
1987-88; Sh. J.N. Rao, during 1978-79; Sh. A.B. Deshmukh & Seraj Khan, during
1987-88).

Reappraisal Hydrogeolgoical Surveys were carried out by Sh. C. Paul Prabhakar
Scientist-B, in Mohkhed, Chhindwara & Chourai blocks of Chhindwara district
during Annual Action Plan 1991-1992.
Ground water management studies were carried out by G. Bhaskara Rao, Scientist-C,
in Mohkhed, Chhindwara & Chourai blocks of Chhindwara district during Annual
Action Plan 1999-2000.
Ground water management studies were carried out by G. Bhaskara Rao, Scientist-C,
in Amarwara and Harrai blocks of Chhindwara district during Annual Action Plan
2000-2001.
Ground water management studies were carried out by G. Bhaskara Rao, Scientist-C,
in Tamia, Parasia, and Jamai blocks of Chhindwara district during Annual Action
Plan 2001-2002.
Ground water management studies were carried out by G. Bhaskara Rao, Scientist-C,
in Bichhua, Sausar and Pandhurna blocks of Chhindwara district during Annual
Action Plan 2002-2003.
Exploratory drilling operations were carried out by the CGWB during AAP 1999-
2000, 2000-2001and 2001-2002 in the entire district area (S/Shri D.K.Rai, A.K.Jain
and S.K Shrivastava, Hydrogeologists attended drilling operations).
Technical guidance provided in Artificial recharge through dug well scheme
2.0 RAINFALL AND CLIMATE
A hot summer and general dryness characterize the climate of the area, except during the
southwest monsoon season. The year may be divided into four seasons. The cold season,
December to February is followed by the hot season from March to about the middle of June.
The period from the middle of June to September is the south-west monsoon season. October and
November form the post monsoon or transition period.
The normal annual rainfall of Chhindwara district is 1139.3 mm. The district receives
maximum rainfall during south-west monsoon period i.e. June to September. About 85.7 % of
the annual rainfall falls during monsoon season. Only 14.3 % of the annual rainfall takes place
between Octobers to May period. Thus, surplus water for ground water recharge is available only
during the southwest monsoon period.
The normal maximum temperature noticed during the month of May is 39.40
C and
minimum during the month of December 9.80 C The normal annual mean minimum and
maximum temperatures has been worked out as 18.20 C and 30.6
0 C respectively.

During the south-west monsoon season, the relative humidity generally exceeds 87%
(August month) and the rest of the year is drier. The driest part of the year is the summer season,
when relative humidity is less than 33%. May is the driest month of the year.
The wind velocity is higher during the pre-monsoon period as compared to post-
monsoon period. The maximum wind velocity, 9.5 km/hr observed during the month of June and
minimum, 3.3 km/hr during the month of November. The average annual wind velocity in is 5.4
km/hr.
3.0 GEOMORPHOLOGY AND SOIL TYPES Physiographically the district has been divided broadly in to two main geomorphic units -
one is Satpura plateau and other is Nagpur plateau. The hill ranges lying in the northern part of
the district belong to the Mahadeo hill ranges of the Satpura mountains stretching nearly east-
west. These hills form the water divide. The district can be further divided in to four parts. I)
Northern hilly region II). Central high plateau region III). Southern low grounds IV). Upland
trough of Jam and Kanhan rivers. Presence of fluvial units showing occurrences of alluvium in
the flood plains of all major streams and rivers, buried pediplains showing denudational hills of
sandstone as seen in western part of the district. Similarly structural hills, covered by
Gondwanas, are seen in northern part, denudational hills in southern part and dissected Deccan
plateau in eastern and northeastern parts of the district.
The soils in the district are generally of three types Viz., black cotton soil, sandy loam
soil and clayey loam soils. The black cotton soils occur mainly in Sausar Tahsil while sandy
loam soil is found in Chhindwara Tahsil. The clayey loam is predominant in Amarwara Tahsil.
The northern hilly region covered by loamy soils, are very shallow, somewhat excessively
drained, developed by moderately steep slopes and are marked by severe erosion.
4.0 GROUND WATER SCENARIO
4.1 Hydrogeology
i) Aquifer System
The major part of the district is occupied by Deccan Trap, consisting of different lava
flows whose thickness ranges between 7 to 21 m. The recent alluvium deposits are found at
places along the Pench and the Kanhan rivers with thickness varying from 5.00 to 20.00 m.
Alluvium comprises clayey material with intercalated layers of sand and gravels. Archaeans are
exposed in parts of Sausar, Bichhua, Chhindwara, Jamai and Mohkhed blocks whereas the Coal
bearing lower Gondwanas in parts of Jamai, Parasia and Jamai blocks. The upper Gondwanas
occupy parts of Harrai and Tamia blocks.
Ground water occurs under phreatic and semi-confined to confined conditions.
Alluvium, weathered granites/gneisses, lower Gondwana sandstones, weathered, fractured and
jointed massive basalts and vesicular basalts form the major phreatic aquifers; and weathered,

fractured granites are noticed as main water-bearing zones at deeper levels. It is observed that the
discharge of dug wells tapping alluvium and vesicular basalt ranges between 80 and 235 m3/day
respectively and jointed massive basalts and weathered gneisses range from 44 to 177 m3/day
and from 61 to 77 m3/day respectively. Hydrogeological details of some of CGWB exploratory
bore wells are given in Table 2. Water bearing fractured zones is encountered between the
depths of 71.00 and 176.00 m bgl at deeper levels. The discharge in weathered, fractured granite
at deeper levels ranges from 0.2 to 10.00 l/s (Fig-2).
Fig 2
HYDRAUL IC STRUCTURES
HYDRAUL IC F EATURES
Water tab le contour,mamsl
Direction o f grou nd water flow
HYDROGEOL OGICAL FEATURES
Spring
Hot Spring
Gro up o f springSu rface water divide
C.G.W.B. Mo nito ring Well
Fault
Limeament
STRUCTURAL FEATURES
Talchir sand ston e an d clay
Sau sar series, Gneisses,
Barakar san d stone and shale,L ower Gon dwan a sand stone,
Upp er Gon dwan a stone
Basalt,weathered,
Soi l,River al lu vium
Up p er T riassic
Permo carb oifero us
L ower Eocen ce to
Cretaceous
Arch aeans
AGE / GROUP
Recent
LITHOLOGY
Goo d to excel lent d ep ending
resid iu m,fractu re zon e having
M od erate to g oo d. Excel lent
M o d erate, GW restricted to weathered
HYDROLOGICAL CONDITIONS
restricted to weath ered residue, fractured
M od erate to g oo d. Gro un d water
seco nd ary po ro sity
alo ng fau lts an d Lineaments.
zon e having secon dary p orosity
LEGEND
u po n th ickn ess of soi lsan d an d clay ratio
2.0 - 8.0
1.0- 8.0
1.0 - 10.0
GROUND WATER
POTENT IAL (Yield-lps)
3.0 - 10.00
Amarwara
S ausar
Mohkhed
P andhurna
CHHINDWARA
Kul behra R
Bichhua
Tamia
Jamai
P arasia
Ponch R
Chaurai
Harrai
CHHINDWARA DISTRICT, M.P.
HYDROGEOLOGY
vesicu lar & fractured
an d clay
Gran ite/Pegmatite
P LATE -2

ii) Water levels
Water level data, including historical data, are essential for not only to know the present
ground water conditions but also for forecasting future trends in response to ground water
reservoir operations. Using the water level data of 34 monitoring wells of Chhindwara district,
Pre and Post monsoon depth to water level maps are reproduced.
iii) Pre- monsoon (May 2012)
Pre monsoon depth to water levels in the year 2012 range from 3.651.76 to 35 m bgl.
Shallow water levels (< 4.00m) occur in west the district. Water levels between 8.0-20.00 m
noticed in major part of the area and water levels between more than 20 m bgl is observed south
western part, where intense agricultural activities are noticed. The deepest water level of 35 m bgl
was recorded in the well at Pandurna. The long-term water level trend (2001 to 2010) shows
declining trend ranges from 0.02 to 0.2 m/year (Pre- monsoon). Water level fall is noticed
particularly in Sausar and Pandhurna block areas where a large-scale withdrawal of ground water
for irrigation purpose is observed (Fig-3).
iv) Post- monsoon (May 2012)
During post monsoon period, water levels ranges from 0 .70 to 15.00 m bgl. Shallow
water level (< 5.00 m) occurs in north, while deep water levels (>10.00m) observed in southern
part. The deepest water level of 15.00 m bgl was also recorded in the well at Sarangbheri and
Water level fluctuation between pre and post monsoon period ranges from 0.30-to7.60 m. (Fig3-
4).
Fig 3
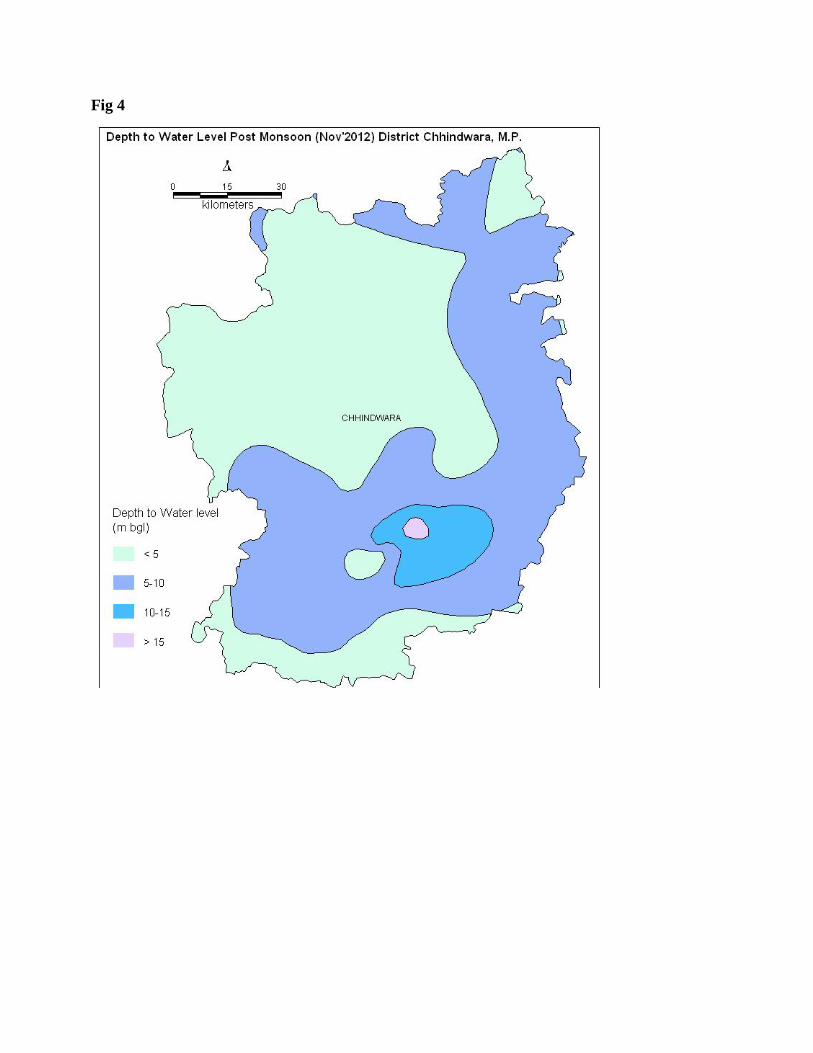
Fig 4
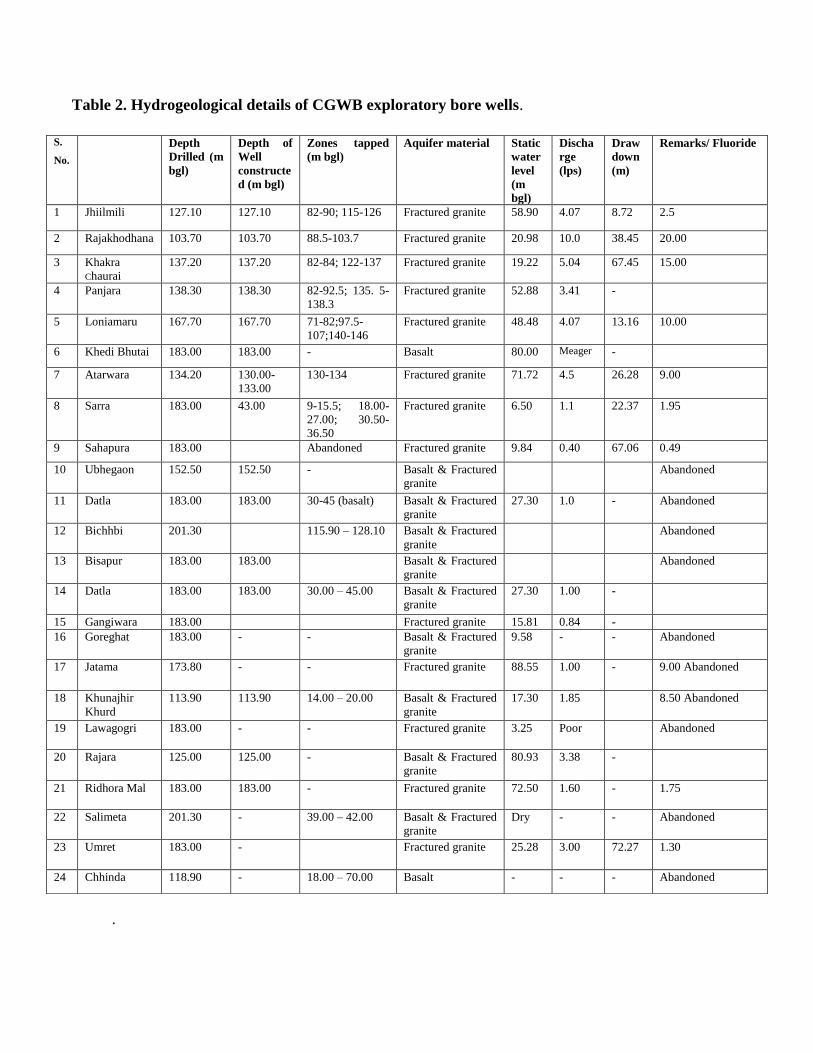
Table 2. Hydrogeological details of CGWB exploratory bore wells.
.
S.
No.
Location Depth
Drilled (m
bgl)
Depth of
Well
constructe
d (m bgl)
Zones tapped
(m bgl)
Aquifer material Static
water
level
(m
bgl)
Discha
rge
(lps)
Draw
down
(m)
Remarks/ Fluoride
1 Jhiilmili 127.10 127.10 82-90; 115-126 Fractured granite 58.90 4.07 8.72 2.5
2 Rajakhodhana 103.70 103.70 88.5-103.7 Fractured granite 20.98 10.0 38.45 20.00
3 Khakra
Chaurai
137.20 137.20 82-84; 122-137 Fractured granite 19.22 5.04 67.45 15.00
4 Panjara 138.30 138.30 82-92.5; 135. 5-
138.3
Fractured granite 52.88 3.41 -
5 Loniamaru 167.70 167.70 71-82;97.5-
107;140-146
Fractured granite 48.48 4.07 13.16 10.00
6 Khedi Bhutai 183.00 183.00 - Basalt 80.00 Meager -
7 Atarwara 134.20 130.00-
133.00
130-134 Fractured granite 71.72 4.5 26.28 9.00
8 Sarra 183.00 43.00 9-15.5; 18.00-
27.00; 30.50-
36.50
Fractured granite 6.50 1.1 22.37 1.95
9 Sahapura 183.00 Abandoned Fractured granite 9.84 0.40 67.06 0.49
10 Ubhegaon 152.50 152.50 - Basalt & Fractured
granite
Abandoned
11 Datla 183.00 183.00 30-45 (basalt) Basalt & Fractured
granite
27.30 1.0 - Abandoned
12 Bichhbi 201.30 115.90 – 128.10 Basalt & Fractured
granite
Abandoned
13 Bisapur 183.00 183.00 Basalt & Fractured
granite
Abandoned
14 Datla 183.00 183.00 30.00 – 45.00 Basalt & Fractured
granite
27.30 1.00 -
15 Gangiwara 183.00 Fractured granite 15.81 0.84 -
16 Goreghat 183.00 - - Basalt & Fractured
granite
9.58 - - Abandoned
17 Jatama 173.80 - - Fractured granite 88.55 1.00 - 9.00 Abandoned
18 Khunajhir
Khurd
113.90 113.90 14.00 – 20.00 Basalt & Fractured
granite
17.30 1.85 8.50 Abandoned
19 Lawagogri 183.00 - - Fractured granite 3.25 Poor Abandoned
20 Rajara 125.00 125.00 - Basalt & Fractured
granite
80.93 3.38 -
21 Ridhora Mal 183.00 183.00 - Fractured granite 72.50 1.60 - 1.75
22 Salimeta 201.30 - 39.00 – 42.00 Basalt & Fractured
granite
Dry - - Abandoned
23 Umret 183.00 - Fractured granite 25.28 3.00 72.27 1.30
24 Chhinda 118.90 - 18.00 – 70.00 Basalt - - - Abandoned

4.2 GROUND WATER RESOURCES (2009)
The entire district, command and Non Command areas, falls under Safe Category, except
Chhindwara block which is falling under Semi -Critical category where stage of ground water
development is 93%.
The net annual ground water availability in the district is 138594 ham and draft from all
uses is 71239 ham. Net ground water available for future irrigation use is 65615 ham (Table 3)
Table 3. Ground water availability and stage of development District/
Assessment
Unit
Sub-unit
Command/
Non-
Command/
Net
Annual
Ground
water
Availabili
ty (ham)
Existing
Gross
Ground
water Draft
for
Irrigation
(ham)
Existing
Gross
Ground
water Draft
for
Domestic &
Industrial
water
Supply
(ham)
Existing
Gross
Ground
water
Draft
for All
uses
(ham)
Provision
for
domestic,
and
industrial
requirement
supply to
next 25 year
(2033)
(ham)
Net Ground
water
Availability
for future
irrigation d
development
(ham)
Stage of
Ground
water
Development
(%)
Category
Chhindwara
Amarwara
Command
Non-
Command 16495 5415 638 6053 864 10216 37 Safe
Block Total 16495 5415 638 6053 864 10216 37 Safe
Bichhua
Command Non-
Command 6310 3035 195 3230 306 2969 51
Safe
Block Total 6310 3035 195 3230 306 2969 51 Safe
Chindwara
Command Non-
Command 12810 10811 1122 11933 1250 749 93
Semi
Critical
Block Total 12810 10811 1122 11933 1250 749 93
Semi Critical
Chourai
Command Non-
Command 19915 11648 427 12075 679 7589 61
Safe
Block Total 19915 11648 427 12075 679 7589 61 Safe
Harrai
Command Safe
Non-
Command 11910 2119 198 2317 279 9512 19
Safe
Block Total 11910 2119 198 2317 279 9512 19 Safe
Jamai
Command Non-
Command 15277 3278 499 3778 621 11378 25
Safe
Block Total 15277 3278 499 3778 621 11378 25 Safe
Mohkhed
Command 1080 245 23 267 68 68 25 Safe
Non-Command
11092 7822 383 8205 551 551 74 Safe
Block Total 12172 8067 405 8473 619 3486 70 Safe
Pandhurna
Command Non-Command
16879 10305 428 10733 594 5980 64 Safe
Block Total 16879 10305 428 10733 594 5980 64 Safe
Parasia
Command Non-
Command 10816 6654 642 7296 721 3441 67
Safe
Block Total 10816 6654 642 7296 721 3441 67 Safe
Sausar
Command 1001 186 34 220 62 753 22 Safe
Non-
Command 7596 3774 389 4164 623 3198 55
Safe
Block Total 8596 3961 423 4384 685 3951 51 Safe
Tamia
Command Non-
Command 7414 750 220 969 320 6345 13
Safe
Block Total 7414 750 220 969 320 6345 13 Safe
District
Total 138594 66042 5197 71239 6938 65615 51
Safe
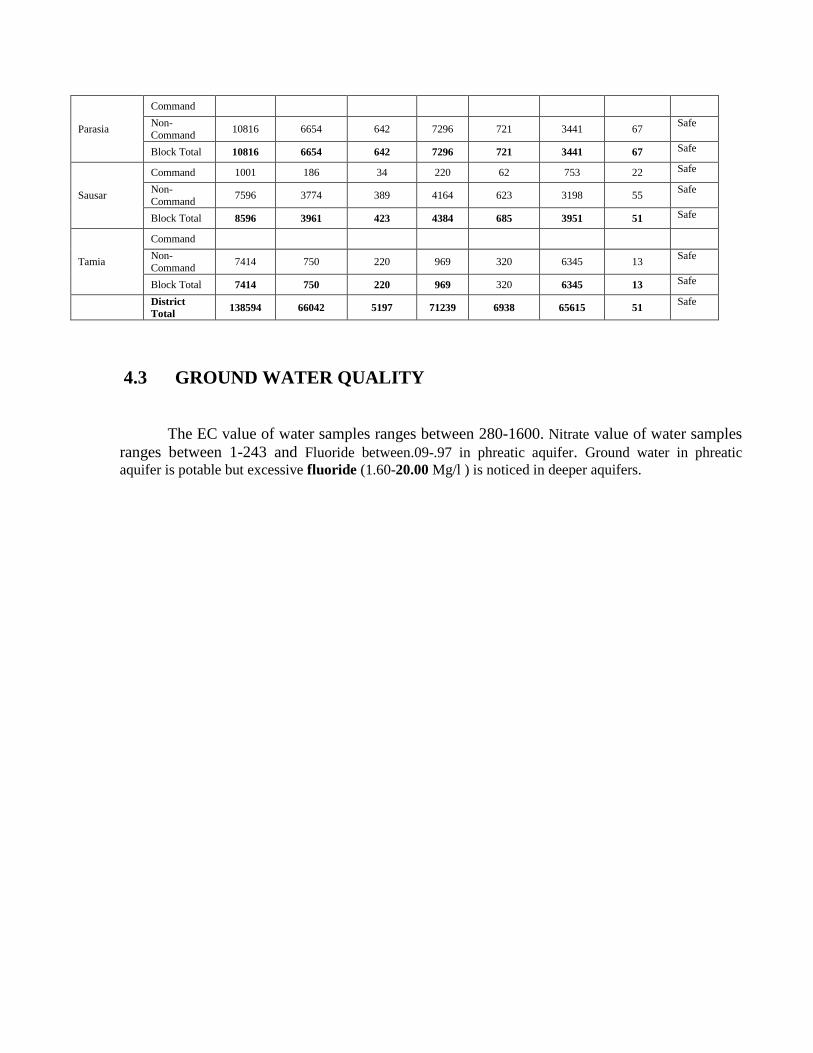
4.3 GROUND WATER QUALITY
The EC value of water samples ranges between 280-1600. Nitrate value of water samples
ranges between 1-243 and Fluoride between.09-.97 in phreatic aquifer. Ground water in phreatic
aquifer is potable but excessive fluoride (1.60-20.00 Mg/l ) is noticed in deeper aquifers.