chesapeake midstream partners - williams...
TRANSCRIPT

WELLS FARGO SYMPOSIUM CHESAPEAKE MIDSTREAM PARTNERS
PARTNERSHIP OVERVIEW
2
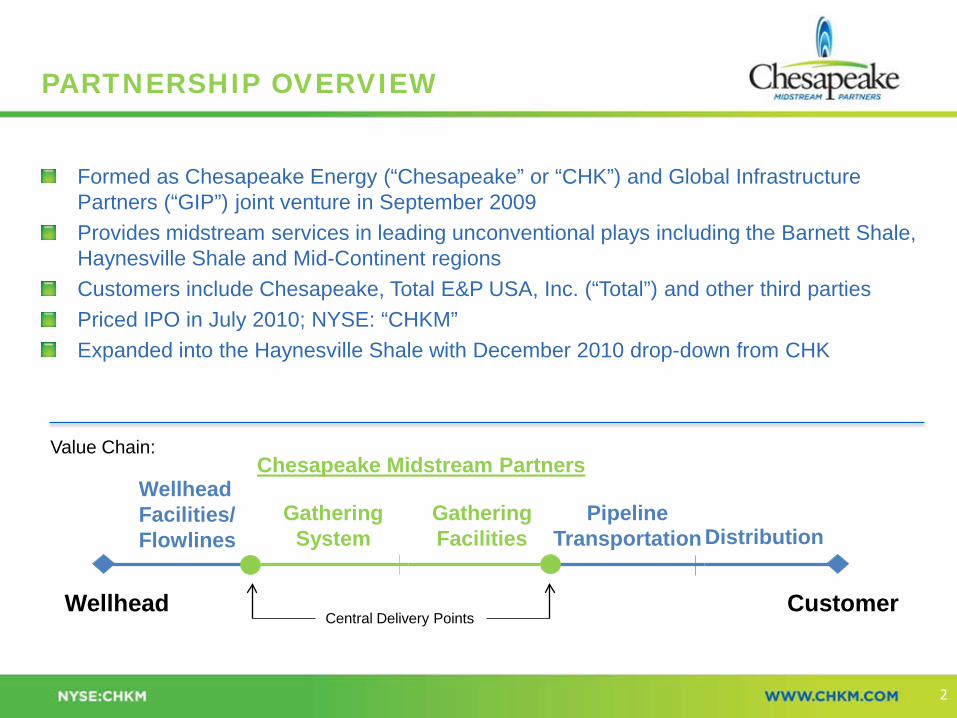
Formed as Chesapeake Energy (“Chesapeake” or “CHK”) and Global Infrastructure Partners (“GIP”) joint venture in September 2009 Provides midstream services in leading unconventional plays including the Barnett Shale, Haynesville Shale and Mid-Continent regions Customers include Chesapeake, Total E&P USA, Inc. (“Total”) and other third parties Priced IPO in July 2010; NYSE: “CHKM” Expanded into the Haynesville Shale with December 2010 drop-down from CHK
Wellhead Customer
Wellhead Facilities/ Flowlines
Gathering System
Gathering Facilities
Pipeline Transportation
Chesapeake Midstream Partners Value Chain:
Central Delivery Points
Distribution

6.6% 6.2% 5.7%
Long Haul Pipeline MLPs
G&P MLPs
CHKM
Annual Distribution Growth Current Yield
Moderate Risk Business Model
Best in Class Business Model
Low Risk Business Model
DISTRIBUTION GROWTH PERFORMANCE AND TOTAL RETURN
3
Distribution Growth (growth vs. prior quarter) Yield & Total Return
CHKM combines a low risk business model with a unique growth platform
*Data current through 11/18/11 (1) Long haul pipeline includes: EPB, BWP, SEP and TCLP. G&P includes: RGNC, MWE, NGLS, WES, CPNO, DPM, APL, XTEX, CMLP, MMLP and EXLP.
(1) (1)
(1)
(1)
2.4% 2.5%
1.2%
2.5%
3.9% 3.3%
3.7% 3.6% 3.4%
1Q 2011 2Q 2011 3Q 2011
Long Haul Pipeline MLPs
G&P MLPs
CHKM
CHKM distribution growth among highest in sector

1) Data for the three-month period ended 09/30/2011
STRATEGIC MIDSTREAM ASSET BASE
High-quality, scalable asset base
High growth unconventional plays
4
Key operating data(1) Enterprise value: ~$4.1 billion
Dedicated acreage: ~3.0 million acres
Miles of pipe: ~3,511
Volume (mmcf / d):
Barnett: ~1,075 (48%)
Haynesville: ~578 (26%)
Mid-Continent: ~573 (26%)
Total: ~2,226
Wells gathered: ~4,799
Direct employees: ~299
Chesapeake Midstream Partners (CHKM) Assets

BUSINESS RISK CONSIDERATIONS AND MITIGANTS
5
Mitigants Considerations
MVC and long-term acreage dedications Rate redetermination Conservative maintenance capital
Volume & Capital
100% fixed-fee revenues Commitment to maintain contract structure / business model as business grows Concentrated in low cost basins Total and other 3rd parties today – ~17% revenue Improving CHK financial profile (25/25 Plan) Core basins to CHK for cash flow generation
Arms-length, 10-20 year contracts at market rates Critical infrastructure providing access to market Dedicated acreage
Commodity & Basin
Counterparty Concentration
Re-contracting

Barnett Shale proved to be an excellent basin to pioneer best practices for use throughout Midstream
Route development Environmental permitting Construction techniques
Barnett solutions in action – At the end of 3Q 2011, the Barnett represented
50% of total CHKM volume 60% of CHKM revenue 65% of invested capital
Overcoming the most difficult challenges translates into competitive advantage
Difficult Challenges Establish Best Practices
COMPETITIVE ADVANTAGE FROM BARNETT EXECUTION
6

CHKM Urban Operations Conservative design Rigorous construction inspection Risk assessment Integrity Management philosophy Public Awareness
Application of Latest Technology Forward Looking Infrared (FLIR) cameras Helicopter flyovers Smart Pig
Innovative & Conservative Operations BEST IN CLASS OPERATIONS
7
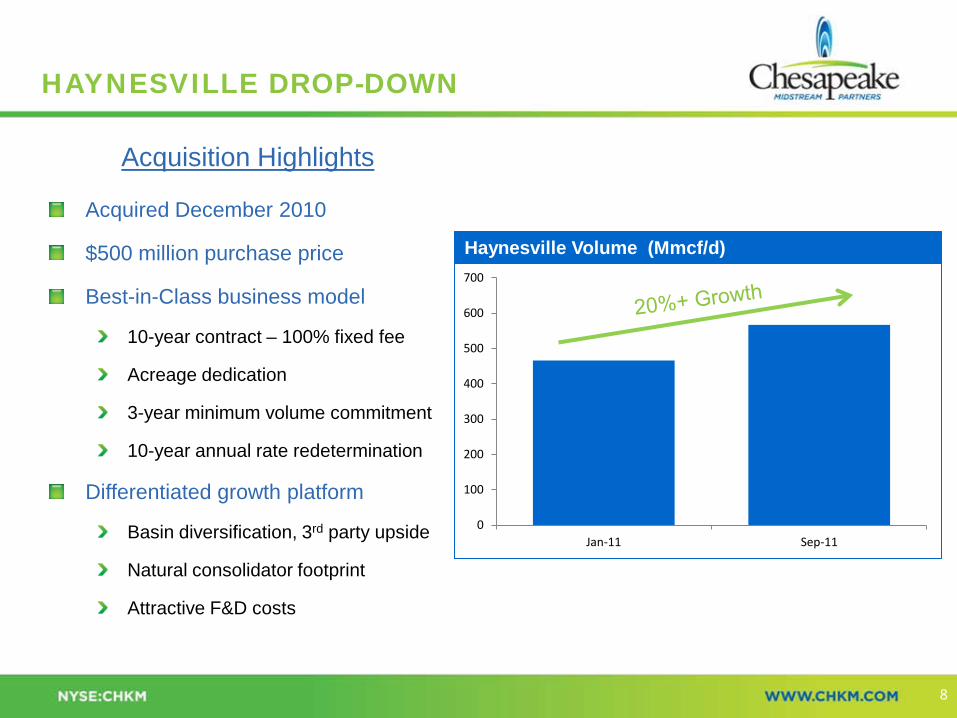
0
100
200
300
400
500
600
700
Jan-11 Sep-11
Acquired December 2010
$500 million purchase price
Best-in-Class business model
10-year contract – 100% fixed fee
Acreage dedication
3-year minimum volume commitment
10-year annual rate redetermination
Differentiated growth platform
Basin diversification, 3rd party upside
Natural consolidator footprint
Attractive F&D costs
HAYNESVILLE DROP-DOWN
8
Acquisition Highlights
Haynesville Volume (Mmcf/d)
CHKM’s unique relationship with CHK provides multiple benefits
Largest drilling company in the U.S. Increasing focus in oil and liquids rich plays Significant Natural Gas Liquids (NGL) production in multiple basins CHK serves as the anchor tenant for processing plants and NGL pipeline projects Diversification of supply provides secure returns on investment Minimum of five years of potential liquids projects
CHKM’s liquids strategy Own and operate processing plants for CHK and third-party gas Build or pursue joint ventures for NGL and crude oil pipelines to premium markets Participate in downstream fractionation and NGL upgrade opportunity
LIQUIDS UPDATE Leveraging the relationship with CHK
9

CHKM LIQUIDS CHKM has position in 5 of the top plays
Wolfcamp
Eagle Ford Shale Bone Spring
TX PH Granite Wash
Tonkawa
Mississippi Lime
Cleveland
Colony Granite Wash
CHKM Chesapeake
10

SIGNIFICANT ORGANIC GROWTH PLATFORM
11
Revenue Annual fee escalation MVC, redetermination growth Contractual top line growth >4%
Operating Expenses
Significant portion fixed/capped Operating leverage/productivity
Capital Expenditures
Large acreage dedications and incremental well opportunities Fee redetermination supports return on capital Third-party opportunities – scale positions in leading basins
Organic Growth Platform Organic EBITDA Growth
Organic Growth Capex
Top Line Drivers Expense Productivity Organic Growth Capex
$303
$146
$366
0 50
100 150 200 250 300 350 400
2009 2010 2011E
($ in millions)
$340
2011E Growing Organic EBITDA

$1.5B invested to date: In addition, CHK investing ~$2.5B over the next two years
Potential access to: Over 20,000 wells on current footprint ~10.5 million gross acres of high quality unconventional assets ~7.1 Tcfe of proved reserves ~1,660 miles of pipe
MidCon Compression an additional drop-down opportunity
975,000 hp 2,850 units
SUBSTANTIAL GROWTH POTENTIAL FROM DROP-DOWNS
12
Note: Reflects current views of CHK management. Drop-down transactions are negotiated at arm’s length and are subject to CHKM board and conflicts committee approval. They may not occur as and when described, or at all.
Basin
Miles of
Pipe Throughput
(Mmcf/d)
Gross Acreage
(thousands)
Haynesville – Mansfield GGS 290 900 350
Marcellus North 370 520 1,800
Marcellus South 655 250 1,600
Eagle Ford 180 45 900
Granite Wash 115 75 350
Mississippi Lime 0 0 800
Niobrara 15 2 1,600
Cleveland/ Tonkawa 30 5 1,450
Utica Shale 5 0 1,700
Total 1,660 1,797 10,550

DELIVERING ON EXPECTATIONS & FINANCIAL STRATEGY
13
Stable cash flow generation High quality assets Best in class business model
Conservative financial structure Strong liquidity and balance sheet Conservative maintenance capital Ample distribution coverage
Delivering distribution growth 11% increase YoY in 3Q ‘11 Poised for continued strong growth
Key Financial Metrics ($ in millions) 1Q ‘11 2Q ‘11 3Q ‘11
EBITDA $72 $79 $88
Adj. DCF* $57 $58 $68
Distribution Coverage 1.16x 1.13x 1.28x
Distribution/Unit .3500 .3625 .3750
- QoQ Growth 3.7% 3.6% 3.4%
- YoY Growth N/A N/A 11.1%
Liquidity $501 $752 $733
Debt/Ebitda 1.10x 1.10x 1.18x
Financial performance highlights strength of CHKM model
*Distributable cash flow includes quarterly MVC adjustment

Organic growth capital
Significant opportunities
Mid-teens return
CHK drop-down portfolio
Leading basins
#1 acreage positions
Third-party acquisitions
Opportunistic
WELL POSITIONED TO DELIVER GROWTH
Funding Capacity
Well positioned to deliver best-in-class total return
Unique asset base growth potential
Best-in-class distribution growth
Investment-grade risk profile
Unmatched low risk, high-return investment
Growth Opportunities Industry-
Leading Opportunity
Debt/2011E EBITDA
(1) Long haul pipeline includes: EPB, BWP, SEP and TCLP. G&P includes: RGNC, MWE, NGLS, WES, CPNO, DPM, APL, XTEX, CMLP, MMLP and EXLP.
14
CHKM – $700 MM of liquidity
3.5x 3.5x
1.2x
Long Haul Pipeline MLPs (1)
G&P MLPs (1)
CHKM

Chesapeake Midstream Partners remains committed to: Protecting our country’s natural resources Encouraging our employees, contractors, suppliers and vendors to work in the safest and most environmentally-friendly manner possible Continually evaluating and improving our operating practices to minimize our environmental footprint Being a good neighbor in the areas in areas where we live and work
Commitment to Safety and Environmental Excellence SAFE AND RESPONSIBLE OPERATIONS
15