chesapeake bay bridge and tunnel district · the chesapeake bay bridge and tunnel district’s (the...
TRANSCRIPT

CHESAPEAKE BAY BRIDGE AND TUNNEL DISTRICT
Basic Financial Statements and Management’s Discussion and Analysis, Required Supplementary Information,
Supplemental Schedules and Audit of Federal Awards Performed in Accordance with Uniform Guidance
June 30, 2019 and 2018
(With Independent Auditors’ Reports Thereon)

CHESAPEAKE BAY BRIDGE AND TUNNEL DISTRICT
Table of Contents
Page(s)
Introductory Section – Commission Members and Directors (Unaudited)
Financial Section:
Independent Auditors’ Report 1–3
Management’s Discussion and Analysis (Unaudited) 4–12
Basic Financial Statements:
Statements of Net Position 13
Statements of Revenues, Expenses, and Changes in Net Position 14
Statements of Cash Flows 15
Notes to Basic Financial Statements 16–52
Required Supplementary Information
Schedule of Pension Contributions (Unaudited) 53
Schedule of the Changes in Net Pension Liability and Related Ratios (Unaudited) 54
Schedule of the Changes in Net RHIP OPEB Liability and Related Ratios (Unaudited) 55
Schedule of GLI OPEB Contributions (Unaudited) 56
Schedule of District’s Share of Net GLI OPEB Liability (Unaudited) 57
Notes to Required Supplementary Information (Unaudited) 58
Modified Approach for Infrastructure Reporting – Capital Asset Activity (Unaudited) 59–63
Other Supplementary Information
Budgetary Comparison Schedule (Unaudited) 64
Schedule of Insurance Policies (Unaudited) 65
Schedule of Comparative Traffic and Revenue Statistics (Unaudited) 66
Schedule of Investments 67–70
Schedule of Expenditures of Federal Awards 71
Notes to Schedule of Expenditures of Federal Awards 72
Compliance Section
Independent Auditors’ Report on Internal Control over Financial Reporting and on Compliance
and Other Matters Based on an Audit of Financial Statements Performed in Accordance
with Government Auditing Standards 73–74
Independent Auditors’ Report on Compliance for the Major Federal Program; Report on
Internal Control Over Compliance; and Report on Schedule of Expenditures of Federal
Awards Required by the Uniform Guidance 75–76
Schedule of Findings and Questioned Costs 77

Commission Members
Frederick T. Stant, III, – Chairman
City of Virginia Beach
Thomas W. Meehan, Sr. – Vice Chairman
City of Newport News
John F. Malbon – Secretary-Treasurer
Commonwealth Transportation Board
Paul E. Bibbins, Jr., PhD
Northampton County
S. Keith Colonna
Accomack County
Rev. Gregory L. Duncan, Sr.
Accomack County
Karen S. James
City of Portsmouth
Reeves W. Mahoney
City of Norfolk
Jeffrey A. Rowland
City of Chesapeake
Christine O. Snead
City of Hampton
Jeffrey K. Walker
Northampton County
Executive Director
Jeffrey B. Holland
Deputy Executive Director, Finance and Operations
Thomas R. Anderson, III
Deputy Executive Director, Infrastructure
Michael T. Crist, P.E.

KPMG LLP is a Delaware limited liability partnership and the U.S. member firm of the KPMG network of independent member firms affiliated with KPMG International Cooperative (“KPMG International”), a Swiss entity.
KPMG LLPSuite 1900440 Monticello AvenueNorfolk, VA 23510
Independent Auditors’ Report
The Chairman and Members
Chesapeake Bay Bridge and Tunnel Commission:
Report on the Financial Statements
We have audited the accompanying financial statements of the Chesapeake Bay Bridge and Tunnel District
(the District), as of and for the years ended June 30, 2019 and 2018, and the related notes to the financial
statements, which collectively comprise the District’s basic financial statements as listed in the table of
contents.
Management’s Responsibility for the Financial Statements
Management is responsible for the preparation and fair presentation of these financial statements in
accordance with U.S. generally accepted accounting principles; this includes the design, implementation, and
maintenance of internal control relevant to the preparation and fair presentation of financial statements that are
free from material misstatement, whether due to fraud or error.
Auditors’ Responsibility
Our responsibility is to express an opinion on these financial statements based on our audits. We conducted
our audits in accordance with auditing standards generally accepted in the United States of America and the
standards applicable to financial audits contained in Government Auditing Standards, issued by the Comptroller
General of the United States. Those standards require that we plan and perform the audit to obtain reasonable
assurance about whether the financial statements are free from material misstatement.
An audit involves performing procedures to obtain audit evidence about the amounts and disclosures in the
financial statements. The procedures selected depend on the auditors’ judgment, including the assessment of
the risks of material misstatement of the financial statements, whether due to fraud or error. In making those
risk assessments, the auditor considers internal control relevant to the entity’s preparation and fair presentation
of the financial statements in order to design audit procedures that are appropriate in the circumstances, but
not for the purpose of expressing an opinion on the effectiveness of the entity’s internal control. Accordingly, we
express no such opinion. An audit also includes evaluating the appropriateness of accounting policies used and
the reasonableness of significant accounting estimates made by management, as well as evaluating the overall
presentation of the financial statements.
We believe that the audit evidence we have obtained is sufficient and appropriate to provide a basis for our
audit opinion.
Opinion
In our opinion, the financial statements referred to above present fairly, in all material respects, the financial
position of the Chesapeake Bay Bridge and Tunnel District as of June 30, 2019 and 2018, and the changes in
its financial position and its cash flows for the years then ended, in accordance with U.S. generally accepted
accounting principles.

2
Other Matters
Required Supplementary Information
U.S. generally accepted accounting principles require that the Management’s Discussion and Analysis on
pages 4 through 12, the Schedule of Pension Contributions on page 53, the Schedule of the Changes in Net
Pension Liability and Related Ratios on page 54, the Schedule of the Changes in Net RHIP OPEB Liability and
Related Ratios on page 55, the Schedule of GLI OPEB Contributions on page 56, Schedule of District’s Share
of Net GLI OPEB Liability on page 57, and the Modified Approach for Infrastructure Reporting – Capital Asset
Activity information on pages 59 through 63 be presented to supplement the basic financial statements. Such
information, although not a part of the basic financial statements, is required by the Governmental Accounting
Standards Board who considers it to be an essential part of financial reporting for placing the basic financial
statements in an appropriate operational, economic, or historical context. We have applied certain limited
procedures to the required supplementary information in accordance with auditing standards generally
accepted in the United States of America, which consisted of inquiries of management about the methods of
preparing the information and comparing the information for consistency with management’s responses to our
inquiries, the basic financial statements, and other knowledge we obtained during our audits of the basic
financial statements. We do not express an opinion or provide any assurance on the information because the
limited procedures do not provide us with sufficient evidence to express an opinion or provide any assurance.
Other Supplementary Information
Our audits were conducted for the purpose of forming an opinion on the financial statements that collectively
comprise the District’s basic financial statements. The Introductory Section, the Budgetary Comparison
Schedule, the Schedule of Insurance Policies, the Schedule of Comparative Traffic and Revenue Statistics, the
Schedule of Investments and Schedule of Expenditures of Federal Awards, as required by Title 2 U.S. Code of
Federal Regulations, Part 200, Uniform Administrative Requirements, Cost Principles, and Audit Requirements
for Federal Awards are presented for purposes of additional analysis and are not a required part of the basic
financial statements.
The Schedule of Investments and Schedule of Expenditures of Federal Awards is the responsibility of
management and was derived from and relates directly to the underlying accounting and other records used to
prepare the basic financial statements. Such information has been subjected to the auditing procedures applied
in the audit of the basic financial statements and certain additional procedures, including comparing and
reconciling such information directly to the underlying accounting and other records used to prepare the basic
financial statements or to the basic financial statements themselves, and other additional procedures in
accordance with auditing standards generally accepted in the United States of America. In our opinion, the
Schedule of Investments and Schedule of Expenditures of Federal Awards is fairly stated in all material
respects in relation to the basic financial statements taken as a whole.
The Introductory Section, the Budgetary Comparison Schedule, the Schedule of Insurance Policies, and the
Schedule of Comparative Traffic and Revenue Statistics have not been subjected to the auditing procedures
applied in the audit of the basic financial statements, and accordingly, we do not express an opinion or provide
any assurance on them.
3
Other Reporting Required by Government Auditing Standards
In accordance with Government Auditing Standards, we have also issued our report dated October 28, 2019 on
our consideration of the District’s internal control over financial reporting and on our tests of its compliance with
certain provisions of laws, regulations, contracts, and grant agreements and other matters. The purpose of that
report is solely to describe the scope of our testing of internal control over financial reporting and compliance
and the results of that testing, and not to provide an opinion on the effectiveness of the District’s internal control
over financial reporting or on compliance. That report is an integral part of an audit performed in accordance
with Government Auditing Standards in considering the District’s internal control over financial reporting and
compliance.
Norfolk, Virginia
October 28, 2019

CHESAPEAKE BAY BRIDGE AND TUNNEL DISTRICT
Management’s Discussion and Analysis (Unaudited)
June 30, 2019 and 2018
4 (Continued)
Overview of the Financial Statements
The Chesapeake Bay Bridge and Tunnel District’s (the District) annual financial report for the fiscal years
ended June 30, 2019 and 2018 provides long-term and short-term information about the District’s overall
financial status. The financial section of this report consists of four parts: management’s discussion and
analysis; basic financial statements, including notes to the basic financial statements; required supplementary
information; and other supplementary information. Management’s discussion and analysis introduces the basic
financial statements and provides an analytical overview of the District’s financial activities. The basic financial
statements are the statements of net position as of June 30, 2019 and 2018, and the related statements of
revenues, expenses, and changes in net position, and cash flows for the years then ended. The notes to the
basic financial statements consist of information that is essential to a user’s understanding of the basic financial
statements. The basic financial statements are followed by required supplementary information and other
supplementary information that provide the information augmenting the basic financial statements.
As it is considered a special-purpose government engaged only in business-type activities, the District follows
enterprise fund reporting; accordingly, the basic financial statements are presented using the economic
resources measurement focus and the accrual basis of accounting. Under this basis, revenues are recognized
in the period in which they are earned, expenses are recognized in the period in which they are incurred, and
depreciation of nonbridge-tunnel infrastructure assets is recognized in the statements of revenues, expenses,
and changes in net position. All assets and deferred outflows of resources and liabilities and deferred inflows of
resources resulting from the operation of the District are included in the statements of net position.
Financial Highlights for Fiscal Years ended June 30, 2019 and 2018
Toll revenues during fiscal year 2019 (FY2019) were $59,471,399 and were 5.6% more than fiscal year
2018 (FY2018) toll revenues. During FY2019, 4,001,697 total revenue vehicles crossed the District’s
facility. This represents a 1.0% increase in vehicular traffic over FY2018. Toll revenues during fiscal year
2018 (FY2018) were $56,297,673 and were 0.7% less than fiscal year 2017 (FY2017) toll revenues. During
FY2018, 3,962,762 total revenue vehicles crossed the District’s facility. This represents a 0.7% decrease in
vehicular traffic over FY2017.
Other revenues in FY2019 totaled $1,065,622, which is a decrease of 20.7% from other revenues in
FY2018. The decrease in other revenues is due to the closure and demolition of the Virginia Originals &
Chesapeake Grill restaurant and gift shop during parallel tunnel construction and the final transition of all
the leases for the District’s Little Creek property to Chesapeake Tunnel Joint Venture (CTJV) as a staging
area during the construction of the parallel tunnel. Other revenues in FY2018 totaled $1,344,550, which is
an increase of 7.2% over other revenues in FY2017. The increase in other revenues is due to programmed
increases in lease income in place for the full year FY2018 from the various tenants at the District’s Little
Creek property and the transition to a new lease for a portion of that same property to CTJV.
Operating expenses in FY2019, before District facility expenses, totaled $14,280,620, which is an increase
in operating expenses of $250,453 from FY2018. Operating expenses in FY2018, before District facility
expenses, totaled $14,030,167, which is an increase of $143,001 from FY 2017.
Operating expenses in FY2019, before District facility expenses, were 6.3% less than the legally adopted
budget for FY2019 operating expenses, before District facility expenses. Operating expenses in FY2018,
before District facility expenses, were 6.7% less than the legally adopted budget for FY2018 operating
expenses, before District facility expenses.

CHESAPEAKE BAY BRIDGE AND TUNNEL DISTRICT
Management’s Discussion and Analysis (Unaudited)
June 30, 2019 and 2018
5 (Continued)
Total net position at June 30, 2019 was $739,534,839, a 7.2% increase over total net position at June 30,
2018. Total net position at June 30, 2018 was $689,580,629, a 5.3% increase over total net position at
June 30, 2017.
Events for Fiscal Year 2020
On August 13, 2019, the District issued First Tier General Resolution Revenue Bond Anticipation Notes,
Series 2019 (“Series 2019 BANs”) in the aggregate principal amount of $378,140,000 pursuant to its General
Revenue Bond Resolution, adopted by the Commission on October 24, 2016 (the “General Resolution”) and its
Fourth Supplemental Resolution, adopted by the Commission on July 9, 2019 (the “Fourth Supplemental
Resolution”). The Series 2019 BANs will mature on November 1, 2023. The proceeds of the Series 2019 BANs
will be used to provide funds to pay capitalized interest on the Series 2019 BANs, finance a portion of the costs
of the Parallel Thimble Shoal Tunnel Project, and pay certain costs of issuing the Series 2019 BANs. The
Series 2019 BANs are being issued in anticipation of the proceeds to be received by the District from
disbursements requisitioned by the District in accordance with the terms of the TIFIA Loan Agreement and the
VTIB Loan Agreement (see Note 5 for more information). The issuance by the District of the Series 2019 BANs
as interim financing in anticipation of the receipt of the TIFIA Loan and VTIB Loan proceeds is expected to
provide substantial interest cost savings for the District.
Financial Analysis
Net Position
Net position is the difference between total assets and deferred outflows of resources and total liabilities and
deferred inflows of resources. As of June 30, 2019, net position was $739,534,839, a 7.2% increase over net
position at June 30, 2018. As of June 30, 2018, net position was $689,580,629, a 5.3% increase over net
position at June 30, 2017. Total assets and deferred outflows of resources increased 4.3% to $1,148,628,672
and total liabilities and deferred inflows of resources decreased 0.6% to $409,093,833 during FY2019. Total
assets and deferred outflows of resources increased 3.2% to $1,101,078,141 and total liabilities and deferred
inflows of resources decreased 0.1% to $411,497,512 during FY2018. The net position and increase in net
position are indicators of the District’s financial health. Table A-1 is a summary of the net position.
TABLE A-1
Summary of Net Position as of June 30, 2019, 2018, and 2017
Assets and deferred
outflows of resources 2019 2018 2017
Current assets $ 137,208,109 82,690,693 69,270,163
Restricted assets 137,069,766 191,943,452 324,594,703
Noncurrent investments 102,751,372 129,679,609 113,108,758
Long-term note receivable — — 23,648
Capital assets 767,147,505 692,501,034 554,751,897
Bond insurance costs, net 2,632,500 2,744,793 2,857,086
Deferred outflows of resources 1,819,420 1,518,560 1,860,444
Total assets and deferred outflows
of resources $ 1,148,628,672 1,101,078,141 1,066,466,699

CHESAPEAKE BAY BRIDGE AND TUNNEL DISTRICT
Management’s Discussion and Analysis (Unaudited)
June 30, 2019 and 2018
6 (Continued)
TABLE A-1
Summary of Net Position as of June 30, 2019, 2018, and 2017
Liabilities and deferred
inflows of resources 2019 2018 2017
Current liabilities $ 22,639,547 33,910,844 32,231,431
Long-term debt, net of current portion 368,862,824 359,750,023 361,285,777
Net GLI OPEB liability 643,000 637,000 —
Net pension liability 10,705,534 10,414,363 12,591,061
Other post employment benefit liability 5,195,292 5,148,033 5,367,423
Deferred inflows of resources 1,047,636 1,637,249 266,887
Total liabilities and deferred inflows
of resources $ 409,093,833 411,497,512 411,742,579
Net position 2019 2018 2017
Net investment in capital assets $ 469,320,744 439,758,391 427,027,701
Restricted for debt service 50,748,012 57,666,561 65,835,138
Restricted for forfeited property 11,421 11,007 9,905
Unrestricted 219,454,662 192,144,670 161,851,376
Total net position $ 739,534,839 689,580,629 654,724,120
Current assets include unrestricted cash and investments that mature in less than 12 months and receivables
due in less than 12 months. Restricted assets include cash and investments restricted for current debt service
and debt service reserves as required by revenue bond covenants and cash and investments restricted for
payment of construction of the Parallel Thimble Shoal Tunnel. Noncurrent investments are unrestricted
investments that mature in more than 12 months. Long-term receivables are receivables due in more than
12 months. Capital assets are the bridge and tunnel infrastructure assets, capitalized interest and financing
expenses during construction periods, construction in progress for the Parallel Thimble Shoal Tunnel Project
(the Project) and other capital assets, such as land, buildings, fleet vehicles, and equipment, net of
depreciation. Bond insurance costs are the unamortized costs associated with revenue bonds issued by the
District. Deferred outflows of resources include the unamortized portion of differences between expected and
actual pension plan and OPEB plan experience, the unamortized portion of differences between expected
earnings and actual earnings on pension plan investments and employer contributions to the pension plan and
the OPEB plan that occurred after the measurement dates of the net pension liability and total OPEB liability.
Current liabilities include accounts payable and accrued expenses, unearned revenue, bond principal that is
due within 12 months, and bond interest due within 12 months. Long-term debt, net of current portion, is the
principal amount of bonds payable that will mature after 12 months, net of unamortized discounts or premiums.
Net GLI OPEB liability represents the District’s proportionate share of the total liability for the group life
insurance plan for retirees. Net pension liability represents the amount by which the District’s total pension
liability exceeds the pension plan’s net position available for paying benefits. Other postemployment benefits
(OPEB) obligation represents the District’s total OPEB liability as the Commission has elected to fund the
healthcare benefits for retirees on a “pay-as-you-go” basis. Deferred inflows of resources are the unamortized

CHESAPEAKE BAY BRIDGE AND TUNNEL DISTRICT
Management’s Discussion and Analysis (Unaudited)
June 30, 2019 and 2018
7 (Continued)
portion of differences between the expected earnings and the actual earnings on pension plan investments and
GLI OPEB plan investments, the unamortized portion of changes in actuarial assumptions for pensions and
OPEB and the unamortized portion of differences between expected and actual pension plan and GLI OPEB
plan experience.
Unrestricted net position contains the revenue fund, reserve maintenance fund, and general fund net position.
The reserve maintenance fund and general fund are expended to preserve the capital assets by planned and
unplanned extraordinary maintenance projects. The general fund will be also utilized for current and future
construction projects.
Net position restricted for debt service is current debt service due on July 1, 2019, 2018, and 2017, if
applicable, and the debt service reserve assets restricted by bond covenants. Net position restricted for
forfeited property represents assets lawfully seized by the District’s police and restricted for expenditures in
accordance with the Virginia Department of Criminal Justice regulations.
In the current year, management determined that an immaterial correction should be made to record an OPEB
liability in FY2018.
Changes in Net Position
Net position increased $49,954,210 during FY2019. Net position increased $34,856,509 during FY2018. The
total operating revenues for FY2019 were $60,537,021, 5.0% more than FY2018 operating revenues, which
were $57,642,223, 0.5% under FY2017 operating revenues, which were $57,958,399. The total operating
expenses in FY2019, before District facility charges, were $14,280,620, an increase of 1.8% from FY2018. The
total operating expenses in FY2018, before District facility charges, were $14,030,167, an increase of 1.0%
from FY2017. Table A-2 is a summary of the changes in net position.
Table A-2
Summary of Statements of Revenues, Expenses, and Changes in Net Position during FY2019,
FY2018, and FY2017
Operating revenues 2019 2018 2017
Toll revenues $ 59,471,399 56,297,673 56,704,636
Other revenues 1,065,622 1,344,550 1,253,763
Total operating revenues 60,537,021 57,642,223 57,958,399
Operating expenses, before District facility
expenses 14,280,620 14,030,167 13,887,166
District facility expenses 6,420,439 4,493,406 5,300,792
Total operating expenses 20,701,059 18,523,573 19,187,958
Operating income 39,835,962 39,118,650 38,770,441

CHESAPEAKE BAY BRIDGE AND TUNNEL DISTRICT
Management’s Discussion and Analysis (Unaudited)
June 30, 2019 and 2018
8 (Continued)
Table A-2
Summary of Statements of Revenues, Expenses, and Changes in Net Position during FY2019,
FY2018, and FY2017
Operating revenues 2019 2018 2017
Net nonoperating revenues (expenses) $ 10,118,248 (3,904,403) (28,329,388)
Increase in net position 49,954,210 35,214,247 10,441,053
Total net position, beginning of fiscal year 689,580,629 654,724,120 644,283,067
Prior year adjustment of net position — (357,738) —
Total net position, end of fiscal year $ 739,534,839 689,580,629 654,724,120
There are many variables that affect the District’s vehicular traffic and resulting revenues. In evaluating FY2019
traffic compared to FY2018, the total traffic figure reflects an increase in the overall results. The
disproportionate increase in toll revenues compared to the increase in vehicles is due to an approximate 10%
increase in the toll rates on January 1, 2019.
Comparison of Toll Revenues and Vehicular Trafficduring FY2019, FY2018 and FY2017
Percentage change2019 vs. 2018 vs.
2019 2018 2017 2018 2017
Toll revenues $ 59,471,399 56,297,673 56,704,636 5.6 % (0.7)%
Vehicular traffic:Cars and light trucks 3,620,088 3,583,197 3,617,653 1.0 (1.0)Heavy trucks 369,131 366,378 357,267 0.8 2.6Busses 12,478 13,187 15,280 (5.4) (13.7)
Total vehicles 4,001,697 3,962,762 3,990,200 1.0 (0.7)
Operating expenses, before District facility charges, for FY2019 increased 1.8% from FY2018 expenses and
were 6.3% less than the budgeted expenses. The FY2019 increase in operating expenses can be attributed to
an increase in salary costs and employee health insurance costs with an offsetting decrease in consulting
engineers’ expense and pension expense. Operating expenses, before the District facility charges, for FY2018
increased 1.0% from FY2017 expenses and were 6.7% less than the budgeted expenses.
Facility expenses for FY2019 increased 42.9% when compared to FY2018. Facility expenses for FY2018
decreased 15.2% when compared to FY2017. District facility expenses primarily include preservation expenses
for bridge and tunnel assets. Preservation expenses are predominantly large complex repairs and renovations
that may take more than one year to complete. Depending on the nature of the preservation projects, the
amount of preservation expense can vary greatly from year to year. Preservation of bridge and tunnel assets
has been, and continues to be, a primary goal of the Commission. Refer to the Capital Asset and Debt
Administration section for more information regarding preservation expenses.
CHESAPEAKE BAY BRIDGE AND TUNNEL DISTRICT
Management’s Discussion and Analysis (Unaudited)
June 30, 2019 and 2018
9 (Continued)
Net non-operating revenues in FY2019 total $10,118,248 which represents an increase of $14,022,651
compared to FY2018. The increase was a result of three substantial changes from FY2018 to FY2019. In FY
2019, the District reported a gain on the change in fair value of investments of $4,549,873 but, conversely in
FY2018, the District reported a loss on the change in fair value of investments of $2,659,081. In FY2019,
interest expense decreased by $4,622,743. The decrease in interest expense, despite no change in
outstanding debt, is related to capitalization of $13,625,163 versus $8,739,161 in the prior year of interest
charges as part of the cost of the parallel tunnel construction project. Additionally, there was a one-time charge
for loss on asset disposal of $1,835,351 in FY2018 which reflects the Virginia Originals restaurant closure and
demolition.
The change in fair value of investments is inversely related to the overall change in interest rates. The District
invests its assets with the purpose of holding investments until maturity unless there is an infrequent need to
liquidate a portion for cash management purposes. Therefore, the change in fair value is considered to be a
“book entry” gain or loss and not a cash value or maturity gain or loss.
Capital Asset and Debt Administration
Capital Assets
As of June 30, 2019, the District has $767,147,505 of capital assets, net of accumulated depreciation. Capital
assets include bridge and tunnel assets, capitalized interest and financing expenses, construction in progress
and miscellaneous capital assets. The bridges, trestles, approach roads, Fisherman Island Causeway, tunnels,
portal islands with all attached improvements, toll plaza infrastructure and the rest area facility, and site-wide
utilities are classified as bridge and tunnel assets. Capitalized interest and financing expenses are the amounts
that were funded from the 1960 revenue bond issue to pay debt service and associated costs of the bonds
during construction until the opening of the Chesapeake Bay Bridge and Tunnel in 1964. Other capital assets
include all other capitalized assets such as land, buildings, fleet vehicles, and equipment.
In accordance with U.S. generally accepted accounting principles (GAAP), the District has elected to utilize the
modified approach to infrastructure reporting on both bridge and tunnel assets and capitalized interest and
financing expenses. Rather than reporting depreciation on any bridge and tunnel assets or capitalized interest,
the District reports, as preservation expense, the costs incurred for maintaining bridge and tunnel assets in
generally good condition on the statements of revenues, expenses, and changes in net position.
GASB Statement No. 34, Basic Financial Statements – and Management’s Discussion and Analysis – for State
and Local Governments, requires that governmental entities that utilize the modified approach for infrastructure
reporting must have their governing board set a policy for the condition levels at which modified approach
assets will be maintained. The Commission’s policy is to maintain 90% of its bridge and tunnel assets at a
maintenance-rating program (MRP) condition level of “good” or better. GASB also requires that the condition
levels for the current and prior two fiscal years be disclosed in the notes to the basic financial statements.
The modified approach to infrastructure reporting highlights the District’s proactive maintenance efforts by
disclosing the results of the annual condition level assessments performed by the District’s consulting
engineers at Jacobs Engineering, Inc. The District’s utilization of the modified approach for infrastructure
reporting makes it an industry leader within the Commonwealth of Virginia.
Jacobs Engineering, Inc. has inspected the bridge and tunnel assets and has determined that in FY2019,
FY2018 and FY2017, the overall infrastructure condition level is “good” (Level 7) or better. As shown in the
table following, the facility’s infrastructure condition level increased slightly from FY2017 to FY2018 and then
CHESAPEAKE BAY BRIDGE AND TUNNEL DISTRICT
Management’s Discussion and Analysis (Unaudited)
June 30, 2019 and 2018
10 (Continued)
stayed approximately the same in FY2019. The tunnels and portal islands are the only bridge and tunnel assets
that fall below the condition level specified in the Chesapeake Bay Bridge and Tunnel Commission’s
preservation policy. The tunnels and portal islands have an overall condition level of 7; however, Jacobs
Engineering, Inc. assigned some components of the tunnels, which includes the ventilation buildings, a
condition level of 6. Extraordinary reserve maintenance projects are planned to address the maintenance
requirements for all of these components.
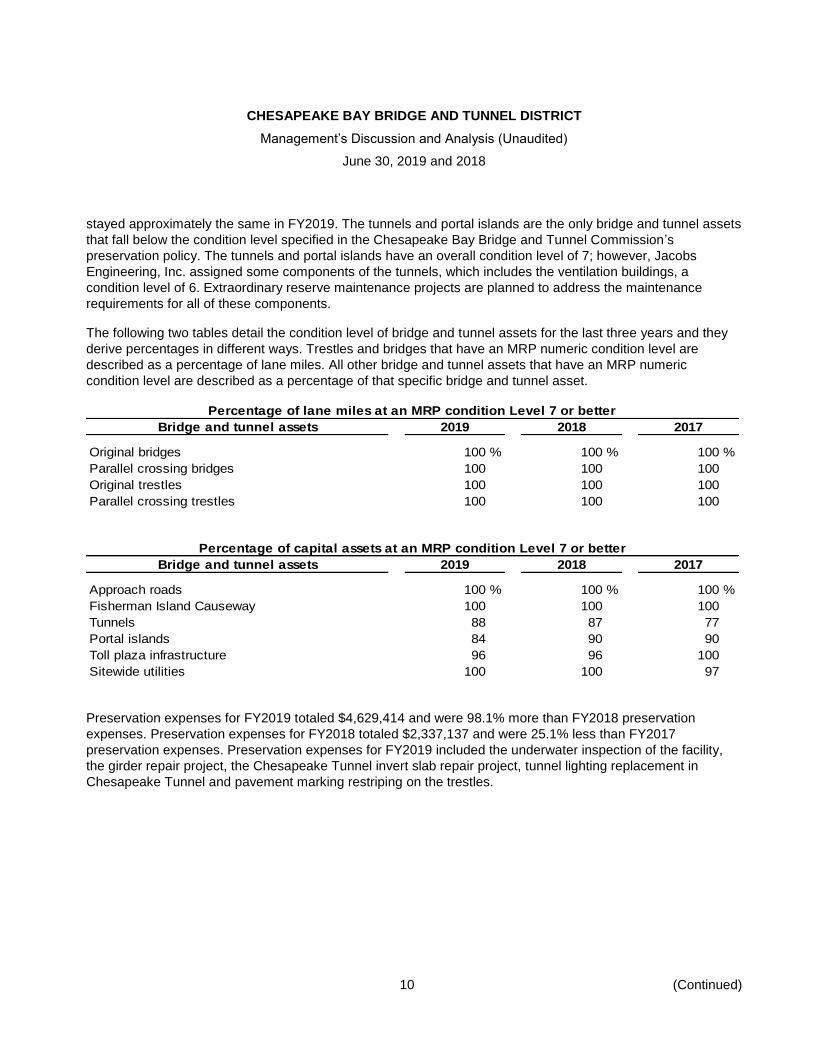
The following two tables detail the condition level of bridge and tunnel assets for the last three years and they
derive percentages in different ways. Trestles and bridges that have an MRP numeric condition level are
described as a percentage of lane miles. All other bridge and tunnel assets that have an MRP numeric
condition level are described as a percentage of that specific bridge and tunnel asset.
Percentage of lane miles at an MRP condition Level 7 or better
Bridge and tunnel assets 2019 2018 2017
Original bridges 100 % 100 % 100 %
Parallel crossing bridges 100 100 100
Original trestles 100 100 100
Parallel crossing trestles 100 100 100
Percentage of capital assets at an MRP condition Level 7 or better
Bridge and tunnel assets 2019 2018 2017
Approach roads 100 % 100 % 100 %
Fisherman Island Causeway 100 100 100
Tunnels 88 87 77
Portal islands 84 90 90
Toll plaza infrastructure 96 96 100
Sitewide utilities 100 100 97
Preservation expenses for FY2019 totaled $4,629,414 and were 98.1% more than FY2018 preservation
expenses. Preservation expenses for FY2018 totaled $2,337,137 and were 25.1% less than FY2017
preservation expenses. Preservation expenses for FY2019 included the underwater inspection of the facility,
the girder repair project, the Chesapeake Tunnel invert slab repair project, tunnel lighting replacement in
Chesapeake Tunnel and pavement marking restriping on the trestles.
CHESAPEAKE BAY BRIDGE AND TUNNEL DISTRICT
Management’s Discussion and Analysis (Unaudited)
June 30, 2019 and 2018
11 (Continued)
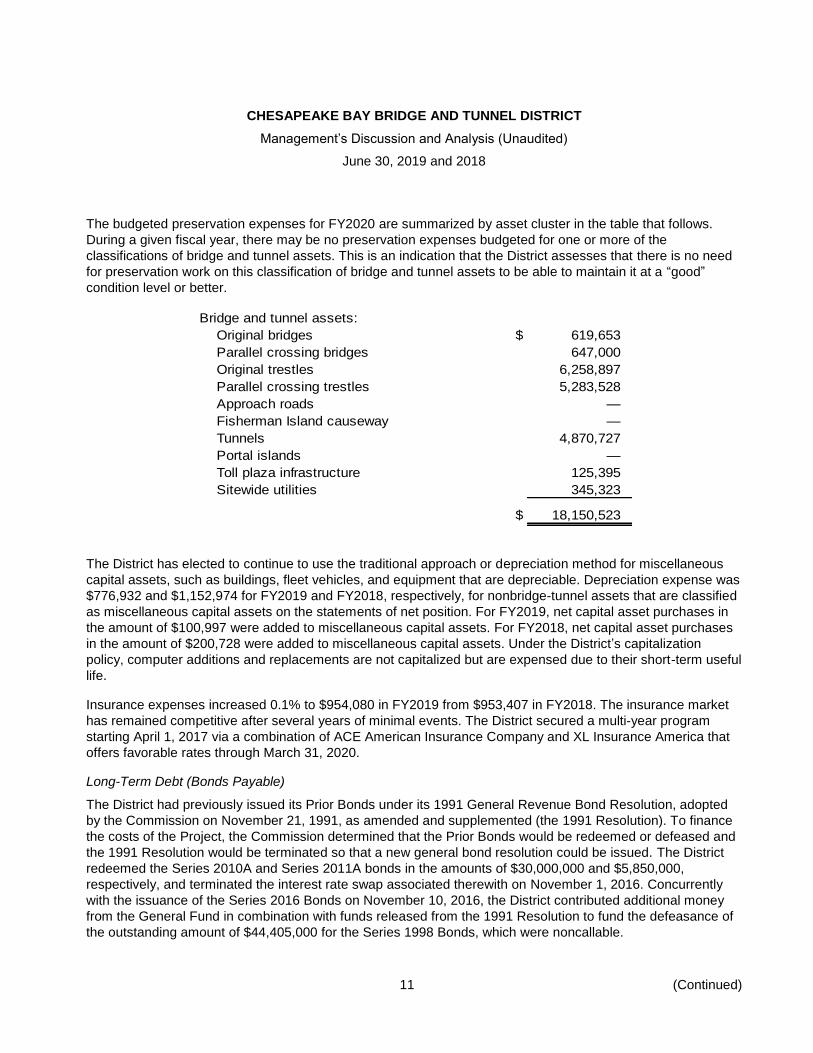
The budgeted preservation expenses for FY2020 are summarized by asset cluster in the table that follows.
During a given fiscal year, there may be no preservation expenses budgeted for one or more of the
classifications of bridge and tunnel assets. This is an indication that the District assesses that there is no need
for preservation work on this classification of bridge and tunnel assets to be able to maintain it at a “good”
condition level or better.
Bridge and tunnel assets:
Original bridges $ 619,653
Parallel crossing bridges 647,000
Original trestles 6,258,897
Parallel crossing trestles 5,283,528
Approach roads —
Fisherman Island causeway —
Tunnels 4,870,727
Portal islands —
Toll plaza infrastructure 125,395
Sitewide utilities 345,323
$ 18,150,523
The District has elected to continue to use the traditional approach or depreciation method for miscellaneous
capital assets, such as buildings, fleet vehicles, and equipment that are depreciable. Depreciation expense was
$776,932 and $1,152,974 for FY2019 and FY2018, respectively, for nonbridge-tunnel assets that are classified
as miscellaneous capital assets on the statements of net position. For FY2019, net capital asset purchases in
the amount of $100,997 were added to miscellaneous capital assets. For FY2018, net capital asset purchases
in the amount of $200,728 were added to miscellaneous capital assets. Under the District’s capitalization
policy, computer additions and replacements are not capitalized but are expensed due to their short-term useful
life.
Insurance expenses increased 0.1% to $954,080 in FY2019 from $953,407 in FY2018. The insurance market
has remained competitive after several years of minimal events. The District secured a multi-year program
starting April 1, 2017 via a combination of ACE American Insurance Company and XL Insurance America that
offers favorable rates through March 31, 2020.
Long-Term Debt (Bonds Payable)
The District had previously issued its Prior Bonds under its 1991 General Revenue Bond Resolution, adopted
by the Commission on November 21, 1991, as amended and supplemented (the 1991 Resolution). To finance
the costs of the Project, the Commission determined that the Prior Bonds would be redeemed or defeased and
the 1991 Resolution would be terminated so that a new general bond resolution could be issued. The District
redeemed the Series 2010A and Series 2011A bonds in the amounts of $30,000,000 and $5,850,000,
respectively, and terminated the interest rate swap associated therewith on November 1, 2016. Concurrently
with the issuance of the Series 2016 Bonds on November 10, 2016, the District contributed additional money
from the General Fund in combination with funds released from the 1991 Resolution to fund the defeasance of
the outstanding amount of $44,405,000 for the Series 1998 Bonds, which were noncallable.
CHESAPEAKE BAY BRIDGE AND TUNNEL DISTRICT
Management’s Discussion and Analysis (Unaudited)
June 30, 2019 and 2018
12
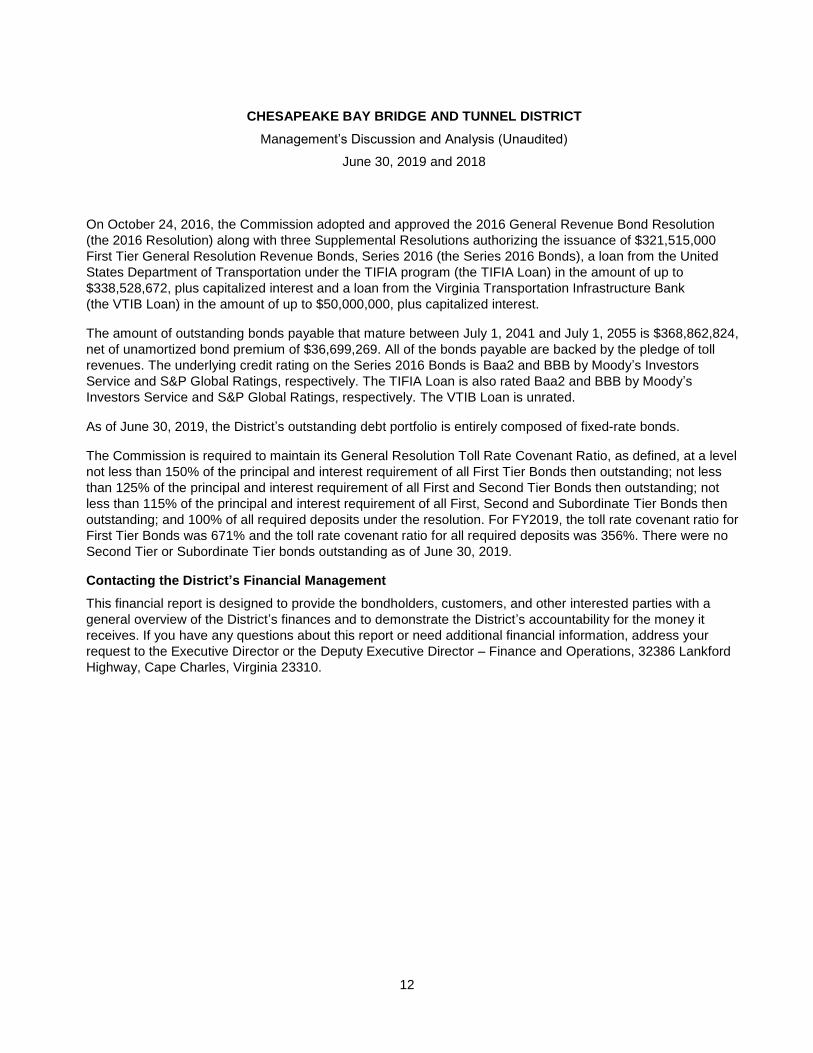
On October 24, 2016, the Commission adopted and approved the 2016 General Revenue Bond Resolution
(the 2016 Resolution) along with three Supplemental Resolutions authorizing the issuance of $321,515,000
First Tier General Resolution Revenue Bonds, Series 2016 (the Series 2016 Bonds), a loan from the United
States Department of Transportation under the TIFIA program (the TIFIA Loan) in the amount of up to
$338,528,672, plus capitalized interest and a loan from the Virginia Transportation Infrastructure Bank
(the VTIB Loan) in the amount of up to $50,000,000, plus capitalized interest.
The amount of outstanding bonds payable that mature between July 1, 2041 and July 1, 2055 is $368,862,824,
net of unamortized bond premium of $36,699,269. All of the bonds payable are backed by the pledge of toll
revenues. The underlying credit rating on the Series 2016 Bonds is Baa2 and BBB by Moody’s Investors
Service and S&P Global Ratings, respectively. The TIFIA Loan is also rated Baa2 and BBB by Moody’s
Investors Service and S&P Global Ratings, respectively. The VTIB Loan is unrated.
As of June 30, 2019, the District’s outstanding debt portfolio is entirely composed of fixed-rate bonds.
The Commission is required to maintain its General Resolution Toll Rate Covenant Ratio, as defined, at a level
not less than 150% of the principal and interest requirement of all First Tier Bonds then outstanding; not less
than 125% of the principal and interest requirement of all First and Second Tier Bonds then outstanding; not
less than 115% of the principal and interest requirement of all First, Second and Subordinate Tier Bonds then
outstanding; and 100% of all required deposits under the resolution. For FY2019, the toll rate covenant ratio for
First Tier Bonds was 671% and the toll rate covenant ratio for all required deposits was 356%. There were no
Second Tier or Subordinate Tier bonds outstanding as of June 30, 2019.
Contacting the District’s Financial Management
This financial report is designed to provide the bondholders, customers, and other interested parties with a
general overview of the District’s finances and to demonstrate the District’s accountability for the money it
receives. If you have any questions about this report or need additional financial information, address your
request to the Executive Director or the Deputy Executive Director – Finance and Operations, 32386 Lankford
Highway, Cape Charles, Virginia 23310.
13
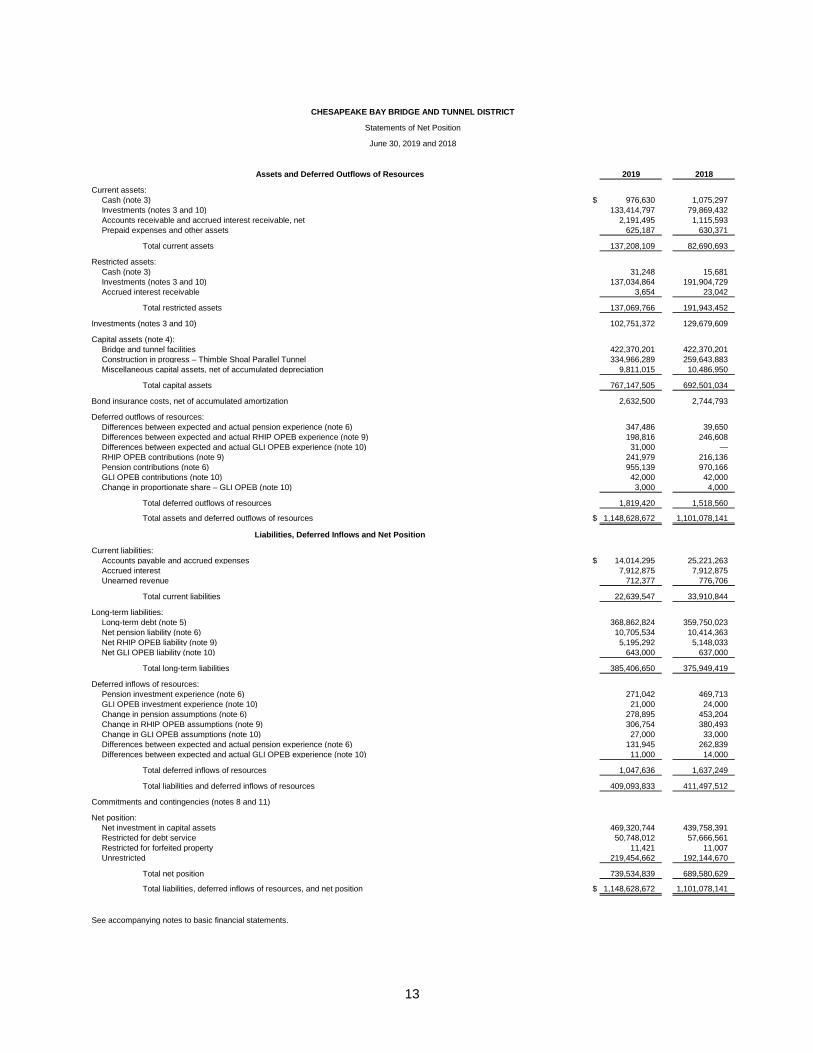
CHESAPEAKE BAY BRIDGE AND TUNNEL DISTRICT
Statements of Net Position
June 30, 2019 and 2018
Assets and Deferred Outflows of Resources 2019 2018
Current assets:
Cash (note 3) $ 976,630 1,075,297
Investments (notes 3 and 10) 133,414,797 79,869,432
Accounts receivable and accrued interest receivable, net 2,191,495 1,115,593
Prepaid expenses and other assets 625,187 630,371
Total current assets 137,208,109 82,690,693
Restricted assets:
Cash (note 3) 31,248 15,681
Investments (notes 3 and 10) 137,034,864 191,904,729
Accrued interest receivable 3,654 23,042
Total restricted assets 137,069,766 191,943,452
Investments (notes 3 and 10) 102,751,372 129,679,609
Capital assets (note 4):
Bridge and tunnel facilities 422,370,201 422,370,201
Construction in progress – Thimble Shoal Parallel Tunnel 334,966,289 259,643,883
Miscellaneous capital assets, net of accumulated depreciation 9,811,015 10,486,950
Total capital assets 767,147,505 692,501,034
Bond insurance costs, net of accumulated amortization 2,632,500 2,744,793
Deferred outflows of resources:
Differences between expected and actual pension experience (note 6) 347,486 39,650
Differences between expected and actual RHIP OPEB experience (note 9) 198,816 246,608
Differences between expected and actual GLI OPEB experience (note 10) 31,000 —
RHIP OPEB contributions (note 9) 241,979 216,136
Pension contributions (note 6) 955,139 970,166
GLI OPEB contributions (note 10) 42,000 42,000
Change in proportionate share – GLI OPEB (note 10) 3,000 4,000
Total deferred outflows of resources 1,819,420 1,518,560
Total assets and deferred outflows of resources $ 1,148,628,672 1,101,078,141
Liabilities, Deferred Inflows and Net Position
Current liabilities:
Accounts payable and accrued expenses $ 14,014,295 25,221,263
Accrued interest 7,912,875 7,912,875
Unearned revenue 712,377 776,706
Total current liabilities 22,639,547 33,910,844
Long-term liabilities:
Long-term debt (note 5) 368,862,824 359,750,023
Net pension liability (note 6) 10,705,534 10,414,363
Net RHIP OPEB liability (note 9) 5,195,292 5,148,033
Net GLI OPEB liability (note 10) 643,000 637,000
Total long-term liabilities 385,406,650 375,949,419
Deferred inflows of resources:
Pension investment experience (note 6) 271,042 469,713
GLI OPEB investment experience (note 10) 21,000 24,000
Change in pension assumptions (note 6) 278,895 453,204
Change in RHIP OPEB assumptions (note 9) 306,754 380,493
Change in GLI OPEB assumptions (note 10) 27,000 33,000
Differences between expected and actual pension experience (note 6) 131,945 262,839
Differences between expected and actual GLI OPEB experience (note 10) 11,000 14,000
Total deferred inflows of resources 1,047,636 1,637,249
Total liabilities and deferred inflows of resources 409,093,833 411,497,512
Commitments and contingencies (notes 8 and 11)
Net position:
Net investment in capital assets 469,320,744 439,758,391
Restricted for debt service 50,748,012 57,666,561
Restricted for forfeited property 11,421 11,007
Unrestricted 219,454,662 192,144,670
Total net position 739,534,839 689,580,629
Total liabilities, deferred inflows of resources, and net position $ 1,148,628,672 1,101,078,141
See accompanying notes to basic financial statements.

14
CHESAPEAKE BAY BRIDGE AND TUNNEL DISTRICT
Statements of Revenues, Expenses, and Changes in Net Position
Years ended June 30, 2019 and 2018
2019 2018
Operating revenues (note 5):
Tolls $ 59,471,399 56,297,673
Other 1,065,622 1,344,550
Total operating revenues 60,537,021 57,642,223
Operating expenses:
Administration 313,964 298,809
Finance 802,771 752,351
Operations 4,567,818 4,362,302
Maintenance and tunnel operations 3,752,541 3,857,902
General 3,626,236 3,451,466
Consultants 466,624 537,978
Utilities 750,666 769,359
Total operating expenses before District facility expenses 14,280,620 14,030,167
District facility expenses:
Insurance 954,080 953,407
Depreciation (note 4) 776,932 1,152,974
Bridge and tunnel preservation (note 4) 4,629,414 2,337,137
Other 60,013 49,888
Total District facility expenses 6,420,439 4,493,406
Total operating and district facility expenses 20,701,059 18,523,573
Operating income 39,835,962 39,118,650
Nonoperating revenues (expenses):
Change in fair value of investments (note 3) 4,549,873 (2,659,081)
Interest income 6,622,260 6,265,214
Interest expense (1,040,385) (5,663,128)
Loss on asset disposal — (1,835,351)
Other expenses, net (13,500) (12,057)
Total nonoperating expenses, net 10,118,248 (3,904,403)
Increase in net position 49,954,210 35,214,247
Total net position, beginning of year 689,580,629 654,724,120
Prior year adjustment of net position — (357,738)
Total net position, end of year $ 739,534,839 689,580,629
See accompanying notes to basic financial statements.
15
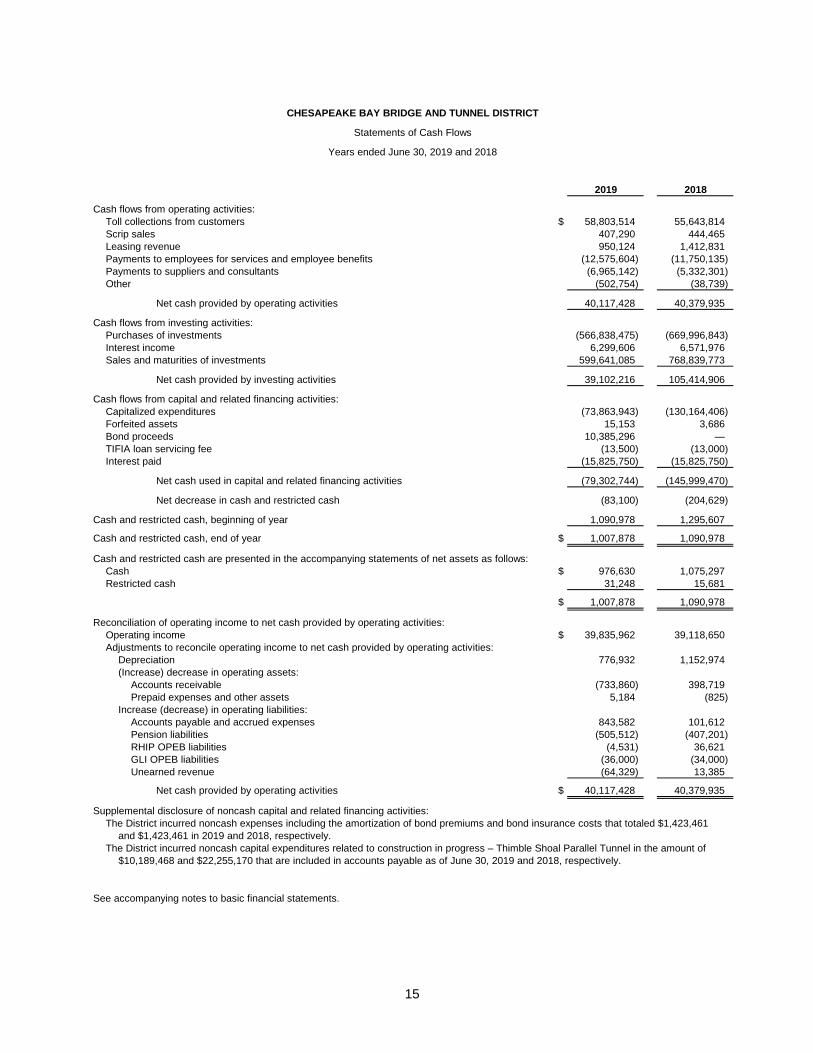
CHESAPEAKE BAY BRIDGE AND TUNNEL DISTRICT
Statements of Cash Flows
Years ended June 30, 2019 and 2018
2019 2018
Cash flows from operating activities:
Toll collections from customers $ 58,803,514 55,643,814
Scrip sales 407,290 444,465
Leasing revenue 950,124 1,412,831
Payments to employees for services and employee benefits (12,575,604) (11,750,135)
Payments to suppliers and consultants (6,965,142) (5,332,301)
Other (502,754) (38,739)
Net cash provided by operating activities 40,117,428 40,379,935
Cash flows from investing activities:
Purchases of investments (566,838,475) (669,996,843)
Interest income 6,299,606 6,571,976
Sales and maturities of investments 599,641,085 768,839,773
Net cash provided by investing activities 39,102,216 105,414,906
Cash flows from capital and related financing activities:
Capitalized expenditures (73,863,943) (130,164,406)
Forfeited assets 15,153 3,686
Bond proceeds 10,385,296 —
TIFIA loan servicing fee (13,500) (13,000)
Interest paid (15,825,750) (15,825,750)
Net cash used in capital and related financing activities (79,302,744) (145,999,470)
Net decrease in cash and restricted cash (83,100) (204,629)
Cash and restricted cash, beginning of year 1,090,978 1,295,607
Cash and restricted cash, end of year $ 1,007,878 1,090,978
Cash and restricted cash are presented in the accompanying statements of net assets as follows:
Cash $ 976,630 1,075,297
Restricted cash 31,248 15,681
$ 1,007,878 1,090,978
Reconciliation of operating income to net cash provided by operating activities:
Operating income $ 39,835,962 39,118,650
Adjustments to reconcile operating income to net cash provided by operating activities:
Depreciation 776,932 1,152,974
(Increase) decrease in operating assets:
Accounts receivable (733,860) 398,719
Prepaid expenses and other assets 5,184 (825)
Increase (decrease) in operating liabilities:
Accounts payable and accrued expenses 843,582 101,612
Pension liabilities (505,512) (407,201)
RHIP OPEB liabilities (4,531) 36,621
GLI OPEB liabilities (36,000) (34,000)
Unearned revenue (64,329) 13,385
Net cash provided by operating activities $ 40,117,428 40,379,935
Supplemental disclosure of noncash capital and related financing activities:
The District incurred noncash expenses including the amortization of bond premiums and bond insurance costs that totaled $1,423,461
and $1,423,461 in 2019 and 2018, respectively.
The District incurred noncash capital expenditures related to construction in progress – Thimble Shoal Parallel Tunnel in the amount of
$10,189,468 and $22,255,170 that are included in accounts payable as of June 30, 2019 and 2018, respectively.
See accompanying notes to basic financial statements.
CHESAPEAKE BAY BRIDGE AND TUNNEL DISTRICT
Notes to Basic Financial Statements
June 30, 2019 and 2018
16 (Continued)
(1) Organization and Summary of Operations
The Chesapeake Bay Bridge and Tunnel District (the District) was created as a political subdivision of the
Commonwealth of Virginia by Chapter 693 of the Acts of Virginia of 1954. Chapter 693 was subsequently
amended by the following Chapters of the Acts of Virginia: Chapters 462 and 714 of the 1956 Session,
Chapter 24 of the 1959 Extra Session, Chapters 228 and 605 of the 1962 Session, Chapter 348 of the
1964 Session, Chapter 203 of the 1990 Session, Chapter 548 of the 1998 Session, Chapters 238 and 705
of the 2000 Session, and Chapters 270 and 297 of the 2005 Session, (collectively, the Acts). All such Acts
have been codified into Title 33.2 Code of Virginia, Chapter 22. The District comprises the area, all within
the Commonwealth of Virginia, in Accomack and Northampton Counties, the Cities of Virginia Beach,
Hampton, Newport News, Chesapeake, Norfolk, and Portsmouth, and the area of the Chesapeake Bay
between these subdivisions.
By the Acts, the Chesapeake Bay Bridge and Tunnel Commission (the Commission) was created as the
governing body of the District. These Acts authorized the Commission to acquire, establish, construct,
maintain, repair, and operate a project comprising public ferry service over and across the waters between
any two points within the boundaries of the District, where such public ferry services would form a
connecting link in the system of state highways.
Under the Acts, the Commission was also authorized to establish, construct, maintain, repair, and operate
a bridge or tunnel or a bridge and tunnel project from any point within the boundaries of the District to a
point in the County of Northampton, including such approaches and approach highways as the
Commission deemed necessary to facilitate the flow of traffic in the vicinity of such project or to connect
such project with the highway system or other facilities in the state.
The Chesapeake Bay Bridge and Tunnel (the Bridge-Tunnel) is a 20-mile, four-lane trestle and bridge and
two-lane tunnel crossing at the mouth of the Chesapeake Bay between the City of Virginia Beach and
Northampton County on the Eastern Shore of Virginia. The Bridge-Tunnel consists principally of low-level
trestles, four bridges, two tunnels, approach highways, and an earth-fill causeway. The Bridge-Tunnel is
designated as part of U.S. Route 13, the main north-south highway on Virginia’s Eastern Shore and the
only direct link between Virginia’s Eastern Shore and the metropolitan area of South Hampton Roads,
Virginia.
The District sold a revenue bond issue of $200,000,000 (1960 Bonds) under a Trust Indenture dated July 1,
1960, and constructed the two-lane bridge and tunnel project. The project was opened to traffic on April 15,
1964. The Commission discontinued ferry service following the opening of the two-lane bridge and tunnel
project.
On April 15, 1964, the Bridge-Tunnel opened as a two-lane facility. A three-staged parallel crossing project
began in 1995. Stage 1 of this project was completed in April 1999. This stage included construction of
parallel trestles, bridges, roadways, and rehabilitation of the original two-lane facility. Stage 2 is ongoing
and will consist of construction of an additional two-lane tunnel under Thimble Shoal Channel. In the future,
Stage 3 will complete the parallel crossing with construction of an additional two-lane tunnel under
Chesapeake Channel.

CHESAPEAKE BAY BRIDGE AND TUNNEL DISTRICT
Notes to Basic Financial Statements
June 30, 2019 and 2018
17 (Continued)
(2) Summary of Significant Accounting Policies
The District is accounted for under the economic resources measurement focus and the accrual basis of
accounting as a special-purpose government engaged in business-type activities, which follows enterprise
fund reporting. Special-purpose governments engaged in business-type activities are used to account for
the ongoing activities that are financed and operated similar to those often found in the private sector.
Accordingly, revenues are recognized in the period earned and expenses are recognized when they are
incurred. The District distinguishes operating revenues and expenses from non-operating items. Operating
revenues and expenses generally result from the District’s ongoing operations. Operating revenues include
revenue from toll collection, recognized when travelers cross the bridge and tunnel, and lease income.
Operating expenses include District facility and administrative expenses. All revenues and expenses not
meeting these definitions are reported as non-operating revenues and expenses.
The statements of net position reports all assets, deferred outflows of resources, liabilities, deferred inflows
of resources, and the residual net position of the District. Deferred outflows of resources are defined as a
consumption of net position by the District that is applicable to a future reporting period. Similarly, deferred
inflows of resources are defined as an acquisition of net position by the District that is applicable to a future
reporting period.
(a) Cash and Investments
Cash includes cash on hand and various checking accounts.
In accordance with generally accepted accounting principles (GAAP), the District reports its investment
securities at fair market value. Fair market value is determined as of the statements of net position
date. The fair value is based on either quotations obtained from national security exchanges or on the
basis of quotations provided by a pricing service, which uses information with respect to transactions
on bonds, quotations from bond dealers, market transactions in comparable securities, and various
relationships between securities.
(b) Restricted Assets
In accordance with applicable covenants of certain bond issues, cash, investments, and accrued
interest receivables have been appropriately restricted. When both restricted and unrestricted
resources are available for use, it is the District’s policy to use restricted resources first, and then
unrestricted resources, as they are needed.
(c) Capital Assets
The bridge and tunnel assets and construction in progress are stated at cost and include capitalized
interest. No provision for depreciation or obsolescence of the Bridge-Tunnel facilities is provided as the
District has adopted the modified approach to account for these assets. All other assets excluding
bridges and tunnel assets are being depreciated straight-line over their estimated useful lives of
3 years up to 50 years.

CHESAPEAKE BAY BRIDGE AND TUNNEL DISTRICT
Notes to Basic Financial Statements
June 30, 2019 and 2018
18 (Continued)
(d) Restricted Net Position
Restricted net position, as defined by GAAP, is reported when constraints are placed on the use of
assets either externally by creditors (such as through debt covenants), grantors, contributors, or laws or
regulations of other governments or imposed by law through constitutional provisions or enabling
legislations. At June 30, 2019 and 2018, the District had net position restricted for debt service of
$50,748,012 and $57,666,561, respectively.
(e) Management’s Estimates
The preparation of financial statements in conformity with GAAP requires management to make
estimates and assumptions that affect the reported amounts of assets and deferred outflows and
liabilities and deferred inflows and disclosure of contingent assets and liabilities at the date of the
financial statements and the reported amounts of revenues and expenses during the reporting period.
Actual results could differ from those estimates.
(f) Revenue Recognition
Toll revenues represent the tolls collected, net of any deductions such as credit card fees, EZ Pass
fees and medical and educational toll discounts. Revenues are recognized when earned.
(g) Pensions
The Virginia Retirement System (VRS) Political Subdivision Retirement Plan is a multi-employer, agent
plan. For purposes of measuring net pension liability, deferred outflows of resources and deferred
inflows of resources related to pensions, and pension expense, information about the fiduciary net
position of the District’s Retirement Plan and the additions to/deductions from the District’s Retirement
Plan’s net fiduciary position have been determined on the same basis as they were reported by the
Virginia Retirement System (VRS). For this purpose, benefit payments (including refunds of employee
contributions) are recognized when due and payable in accordance with the benefit terms. Investments
are reported at fair value.
(h) Postemployment benefits other than pensions (OPEB)
District employees participate in two postemployment benefits plans other than pensions (other
postemployment benefits or OPEB):
The Chesapeake Bay Bridge and Tunnel District Retiree Health Insurance Plan (RHIP) is a single
employer, defined benefit plan that provides health, vision and dental benefit plans for eligible members
through a self-funded plan administered by the District. For purposes of measuring the net RHIP OPEB
liability, deferred outflows of resources and deferred inflows of resources related to RHIP OPEB, and
RHIP OPEB expense, information about the fiduciary net position of the RHIP and additions
to/deductions from the plan’s fiduciary net position have been determined on the same basis as they
are reported by the RHIP. For this purpose, the RHIP recognizes benefit payments when due and
payable in accordance with the benefit terms.
The Virginia Retirement System (VRS) Group Life Insurance Program is a multiple employer, cost
sharing plan. It provides coverage to state employees, teachers, and employees of participating
political subdivisions. The Group Life Insurance Program was established pursuant to §51.1-500 et
seq. of the Code of Virginia, as amended, and provides the authority under which benefit terms are

CHESAPEAKE BAY BRIDGE AND TUNNEL DISTRICT
Notes to Basic Financial Statements
June 30, 2019 and 2018
19 (Continued)
established or may be amended. The Group Life Insurance Program is a defined benefit plan that
provides a basic group life insurance benefit for employees of participating employers. For purposes of
measuring the net Group Life Insurance Program OPEB liability, deferred outflows of resources and
deferred inflows of resources related to the Group Life Insurance Program OPEB, and Group Life
Insurance Program OPEB expense, information about the fiduciary net position of the Virginia
Retirement System (VRS) Group Life Insurance program OPEB and the additions to/deductions from
the VRS Group Life Insurance Program OPEB’s net fiduciary position have been determined on the
same basis as they were reported by VRS. In addition, benefit payments are recognized when due and
payable in accordance with the benefit terms. Investments are reported at fair value.
(3) Cash Deposits and Investments
(a) Deposits
The carrying value of the District’s deposits (unrestricted and restricted) was $1,007,878 and
$1,090,978 at June 30, 2019 and 2018, respectively. The bank balance of these deposits was
$553,619 and $792,353 at June 30, 2019 and 2018, respectively. The entire bank balance was
covered for both fiscal years by federal depository insurance or collateralized in accordance with the
Virginia Security for Public Deposits Act (VSPD Act). In accordance with the VSPD Act, the District’s
depository institution pledged collateral in the form of federal agency obligations with a market value
equal to 110% of the District’s deposits with a third-party trustee in the name of the Treasurer of the
Commonwealth of Virginia. In the event that the banking institution fails, the Treasurer will take
possession of the collateral, liquidate it, and reimburse the District up to the value of its deposits. The
State Treasury Board is responsible for monitoring compliance with the collateralization and reporting
requirements of the VSPD Act and for notifying local governments of compliance by banks.
(b) Investments
The District is authorized to invest in obligations of the United States or agencies thereof; obligations of
any state or territory of the United States and any political subdivision thereof; obligations permitted by
the laws of the Commonwealth of Virginia; repurchase agreements with respect to the foregoing
obligations; certificates of deposit, time deposits, or interest in money market portfolios issued by any
bank, banking association, savings and loan association, or trust company insured by the FDIC or
Federal Savings and Loan Insurance Corporation; commercial paper, shares in one or more
open-ended investment funds provided that the funds are registered under the State Securities Act or
the Federal Investment Company Act; bankers’ acceptances; and units representing beneficial
interests in investment pools created pursuant to the Government Non-Arbitrage Investment Act of the
Commonwealth of Virginia.
(c) Credit Risk
Credit risk is defined as the risk that an issuer or other counterparty to an investment will not fulfill its
obligations. As required by state statute, the policy requires that commercial paper have a short-term
debt rating of no less than “A-1” (or its equivalent) from at least two of the following: Moody’s Investors
Service, Standard & Poor’s, Fitch Investors Service, and Duff and Phelps. Corporate notes, negotiable
certificates of deposit, and bank deposit, notes maturing in less than one year must have a short-term
debt rating of at least “A-1” by Standard & Poor’s and “P-1” by Moody’s Investors Service. Notes having
a maturity of greater than one year must be rated “AA” by Standard & Poor’s and “Aa” by Moody’s
Investors Service.
CHESAPEAKE BAY BRIDGE AND TUNNEL DISTRICT
Notes to Basic Financial Statements
June 30, 2019 and 2018
20 (Continued)
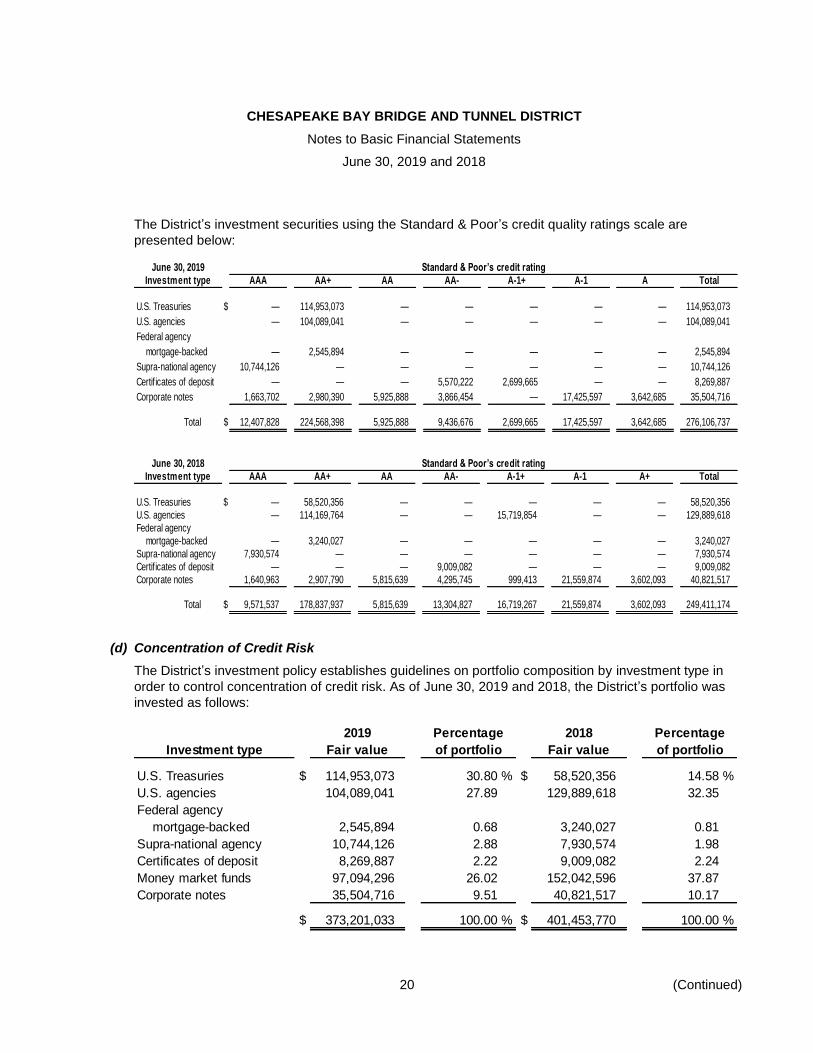
The District’s investment securities using the Standard & Poor’s credit quality ratings scale are
presented below:
June 30, 2019 Standard & Poor’s credit rating
Investment type AAA AA+ AA AA- A-1+ A-1 A Total
U.S. Treasuries $ — 114,953,073 — — — — — 114,953,073
U.S. agencies — 104,089,041 — — — — — 104,089,041
Federal agency
mortgage-backed — 2,545,894 — — — — — 2,545,894
Supra-national agency 10,744,126 — — — — — — 10,744,126
Certif icates of deposit — — — 5,570,222 2,699,665 — — 8,269,887
Corporate notes 1,663,702 2,980,390 5,925,888 3,866,454 — 17,425,597 3,642,685 35,504,716
Total $ 12,407,828 224,568,398 5,925,888 9,436,676 2,699,665 17,425,597 3,642,685 276,106,737
June 30, 2018 Standard & Poor’s credit rating
Investment type AAA AA+ AA AA- A-1+ A-1 A+ Total
U.S. Treasuries $ — 58,520,356 — — — — — 58,520,356
U.S. agencies — 114,169,764 — — 15,719,854 — — 129,889,618
Federal agency
mortgage-backed — 3,240,027 — — — — — 3,240,027
Supra-national agency 7,930,574 — — — — — — 7,930,574
Certif icates of deposit — — — 9,009,082 — — — 9,009,082
Corporate notes 1,640,963 2,907,790 5,815,639 4,295,745 999,413 21,559,874 3,602,093 40,821,517
Total $ 9,571,537 178,837,937 5,815,639 13,304,827 16,719,267 21,559,874 3,602,093 249,411,174
(d) Concentration of Credit Risk
The District’s investment policy establishes guidelines on portfolio composition by investment type in
order to control concentration of credit risk. As of June 30, 2019 and 2018, the District’s portfolio was
invested as follows:
2019 Percentage 2018 Percentage
Investment type Fair value of portfolio Fair value of portfolio
U.S. Treasuries $ 114,953,073 30.80 % $ 58,520,356 14.58 %
U.S. agencies 104,089,041 27.89 129,889,618 32.35
Federal agency
mortgage-backed 2,545,894 0.68 3,240,027 0.81
Supra-national agency 10,744,126 2.88 7,930,574 1.98
Certificates of deposit 8,269,887 2.22 9,009,082 2.24
Money market funds 97,094,296 26.02 152,042,596 37.87
Corporate notes 35,504,716 9.51 40,821,517 10.17
$ 373,201,033 100.00 % $ 401,453,770 100.00 %

CHESAPEAKE BAY BRIDGE AND TUNNEL DISTRICT
Notes to Basic Financial Statements
June 30, 2019 and 2018
21 (Continued)
(e) Interest Rate Risk
Interest rate risk is defined as the risk that changes in interest rates will adversely affect the fair value
of an investment. The District’s investment policy limits the investment of funds as a means of limiting
exposure to fair value losses. Investments in the General Resolution Debt Service Reserve Funds are
limited to investments with maturities that are consistent with the next interest or principal payment
date. Investments in the General Resolution Reserve Maintenance Fund are limited to investments with
maturities less than three years. Investments in the General Resolution General Fund are limited to
investments with maturities that are consistent with the schedule of planning, development, and
construction of parallel tunnels that would complete the parallel crossing. Investments are selected
based on the current perception of the direction of interest rates with a greater emphasis on yield and a
lesser emphasis on liquidity.
Proceeds from the sale of bonds issued by the District are invested in compliance with the specific
requirements of the bond covenants without further restriction as to the maximum term of securities
purchased.
As of June 30, 2019, the District had the following investments and maturities:
Investment maturities (in years)Fair Less Greater Not
Investment type value than 1 year 1 to 3 years than 3 years fixed
U.S. Treasuries $ 114,953,073 58,499,710 56,453,363 — — U.S. agencies 104,089,041 61,862,806 42,226,235 — — Federal agency mortgage-backed 2,545,894 — 301,928 2,243,966 — Supra-national agency 10,744,126 1,673,804 9,070,322 — — Certificates of deposit 8,269,887 2,699,666 5,570,221 — — Money market funds 97,094,296 — — — 97,094,296 Corporate notes 35,504,716 22,994,374 12,510,342 — —
Total $ 373,201,033 147,730,360 126,132,411 2,243,966 97,094,296
As of June 30, 2018, the District had the following investments and maturities:
Investment maturities (in years)Fair Less Greater Not
Investment type value than 1 year 1 to 3 years than 3 years fixed
U.S. Treasuries $ 58,520,356 14,244,619 39,538,662 4,737,075 — U.S. agencies 129,889,618 46,025,063 83,864,555 — — Federal agency mortgage-backed 3,240,027 — 64,886 3,175,141 — Supra-national agency 7,930,574 — 7,930,574 — — Certificates of deposit 9,009,082 3,733,714 5,275,368 — — Money market funds 152,042,596 — — — 152,042,596 Corporate notes 40,821,517 23,058,773 17,762,744 — —
Total $ 401,453,770 87,062,169 154,436,789 7,912,216 152,042,596

CHESAPEAKE BAY BRIDGE AND TUNNEL DISTRICT
Notes to Basic Financial Statements
June 30, 2019 and 2018
22 (Continued)
(f) Summary of Changes in Fair Value of Investments
The change in fair value of investments for the years ended June 30, 2019 and 2018 is calculated as
follows:
2019 2018
Fair value of investments at end of year $ 373,201,033 401,453,770
Add:
Proceeds from sales and maturities during the year 599,641,085 768,839,773
Less:
Cost of investments purchased during the year (566,838,475) (669,996,843)
Fair value of investments at beginning of year (401,453,770) (502,955,781)
Change in fair value of investments $ 4,549,873 (2,659,081)
(4) Capital Assets
Capital assets include bridge and tunnel assets, capitalized interest and financing expenses, and other
capital assets. The bridges, trestles, approach roads, Fisherman Island Causeway, tunnels, portal islands
with all attached improvements, toll plaza infrastructure and the rest area facility, and site-wide utilities are
classified as bridge and tunnel assets. Capitalized interest and financing expenses include the amount of
money that was funded from the 1960 Bonds issued for debt service and associated costs of the bonds
during construction until the opening of the Bridge-Tunnel in 1964. Miscellaneous capital assets include all
other assets that the District has capitalized such as land, buildings, fleet vehicles, and equipment.
The District utilizes the modified approach to infrastructure reporting on bridge and tunnel assets and
capitalized interest and financing expenses. In lieu of reporting depreciation on bridge and tunnel assets,
the costs incurred for maintaining bridge and tunnel assets at the condition level that is specified by
Commission policy are reported as preservation expenses on the accompanying statements of revenues,
expenses, and changes in net position.
The District has elected to continue to use the traditional approach or depreciation method for buildings,
fleet vehicles, and equipment that are depreciable, as stipulated in the District’s Capital Asset Policy.

CHESAPEAKE BAY BRIDGE AND TUNNEL DISTRICT
Notes to Basic Financial Statements
June 30, 2019 and 2018
23 (Continued)
Capital assets at June 30, 2019 and 2018 comprise the following:
2019 2018
Bridge and tunnel assets $ 381,488,453 381,488,453
Capitalized interest and finance expenses 66,447,538 52,822,375
Construction in progress – Parallel Thimble Shoal Tunnel 309,400,499 247,703,256
Miscellaneous capital assets 24,037,447 23,936,450
781,373,937 705,950,534
Less accumulated depreciation (14,226,432) (13,449,500)
Total $ 767,147,505 692,501,034
The following is a summary of the changes in capital assets for the year ended June 30, 2019:
Capital asset Capital Capital Capital Capital assetbalance, asset asset asset balance,
June 30, 2018 additions disposals depreciation June 30, 2019
Nondepreciable assets:Bridge and tunnel assets $ 381,488,453 — — — 381,488,453 Construction in progress 247,703,256 61,697,243 — — 309,400,499 Capitalized interest and finance
expenses 52,822,375 13,625,163 — — 66,447,538
682,014,084 75,322,406 — — 757,336,490
Depreciable assets:Miscellaneous capital assets 23,936,450 100,997 — — 24,037,447
Less accumulated depreciation (13,449,500) — — (776,932) (14,226,432)
10,486,950 100,997 — (776,932) 9,811,015
Total capital assets, net $ 692,501,034 75,423,403 — (776,932) 767,147,505
CHESAPEAKE BAY BRIDGE AND TUNNEL DISTRICT
Notes to Basic Financial Statements
June 30, 2019 and 2018
24 (Continued)
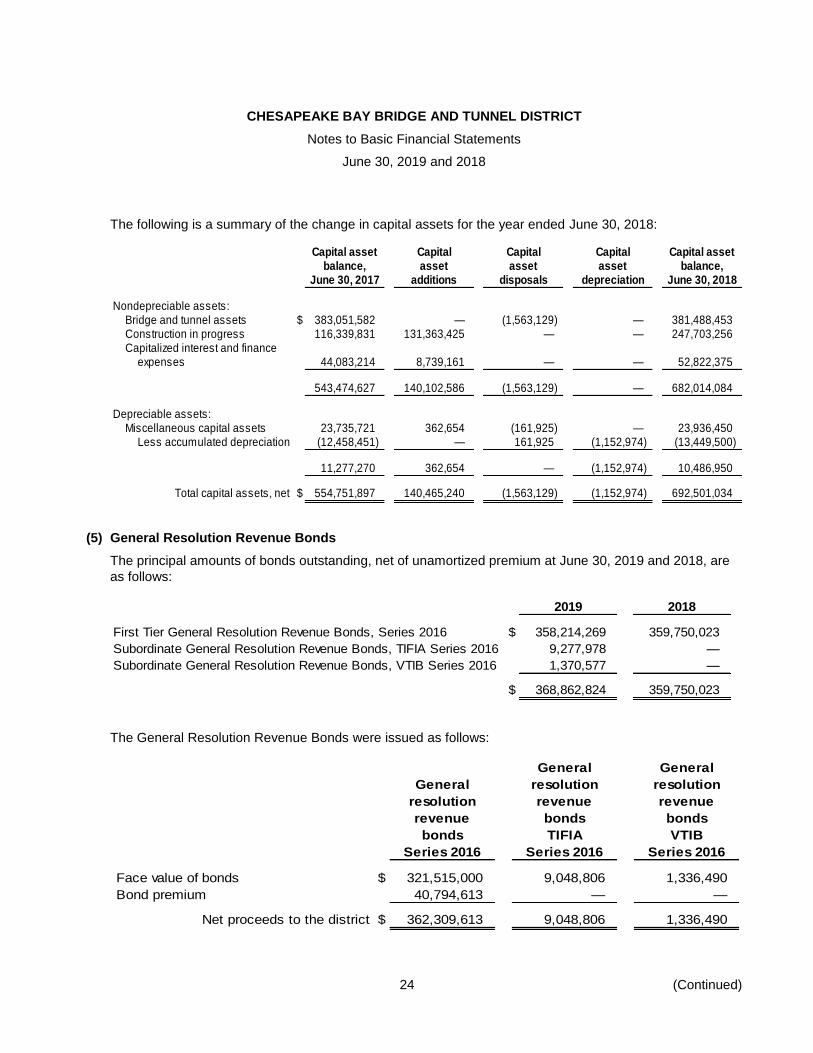
The following is a summary of the change in capital assets for the year ended June 30, 2018:
Capital asset Capital Capital Capital Capital assetbalance, asset asset asset balance,
June 30, 2017 additions disposals depreciation June 30, 2018
Nondepreciable assets:Bridge and tunnel assets $ 383,051,582 — (1,563,129) — 381,488,453 Construction in progress 116,339,831 131,363,425 — — 247,703,256 Capitalized interest and finance
expenses 44,083,214 8,739,161 — — 52,822,375
543,474,627 140,102,586 (1,563,129) — 682,014,084
Depreciable assets:Miscellaneous capital assets 23,735,721 362,654 (161,925) — 23,936,450
Less accumulated depreciation (12,458,451) — 161,925 (1,152,974) (13,449,500)
11,277,270 362,654 — (1,152,974) 10,486,950
Total capital assets, net $ 554,751,897 140,465,240 (1,563,129) (1,152,974) 692,501,034
(5) General Resolution Revenue Bonds
The principal amounts of bonds outstanding, net of unamortized premium at June 30, 2019 and 2018, are
as follows:
2019 2018
First Tier General Resolution Revenue Bonds, Series 2016 $ 358,214,269 359,750,023
Subordinate General Resolution Revenue Bonds, TIFIA Series 2016 9,277,978 —
Subordinate General Resolution Revenue Bonds, VTIB Series 2016 1,370,577 —
$ 368,862,824 359,750,023
The General Resolution Revenue Bonds were issued as follows:
General General
General resolution resolution
resolution revenue revenue
revenue bonds bonds
bonds TIFIA VTIB
Series 2016 Series 2016 Series 2016
Face value of bonds $ 321,515,000 9,048,806 1,336,490
Bond premium 40,794,613 — —
Net proceeds to the district $ 362,309,613 9,048,806 1,336,490
CHESAPEAKE BAY BRIDGE AND TUNNEL DISTRICT
Notes to Basic Financial Statements
June 30, 2019 and 2018
25 (Continued)
The District had previously incurred its General Resolution Refunding Bonds, Series 1998, Series 2010A
and Series 2011A (collectively, the Prior Bonds) under its General Revenue Bond Resolution, adopted by
the Commission on November 21, 1991, as amended and supplemented (the 1991 Resolution). In
July 2016, the Commission awarded a contract to Chesapeake Tunnel Joint Venture to design and build
the Project and to finance the costs of the Project, the Commission determined that the Prior Bonds would
be redeemed or defeased and the 1991 Resolution would be terminated so that a new general bond
resolution could be issued. The District redeemed the Series 2010A and Series 2011A Bonds in the
amounts of $30,000,000 and $5,850,000, respectively, and terminated the interest rate swap associated
therewith on November 1, 2016. Concurrently with the issuance of the Series 2016 Bonds, the District
contributed additional moneys in combination with funds released from the 1991 Resolution to fund the
defeasance of the Series 1998 Bonds, which are noncallable, on November 10, 2016.
On October 24, 2016, the Commission adopted and approved a new General Revenue Bond Resolution
(the 2016 Resolution) along with three Supplemental Resolutions authorizing the issuance of $321,515,000
First Tier General Resolution Revenue Bonds, Series 2016 (the Series 2016 Bonds), a loan from the
United States Department of Transportation under the TIFIA program (the TIFIA Loan) in the amount of up
to $338,528,672, plus capitalized interest and a loan from the Virginia Transportation Infrastructure Bank
(the VTIB Loan) in the amount of up to $50,000,000, plus capitalized interest.
The Series 2016 Bonds are term bonds maturing from July 1, 2041 through July 1, 2055 with coupon
interest rate ranging from 4.0% to 5.0%. The proceeds from the Series 2016 Bonds, along with the
proceeds of the TIFIA Loan and VTIB Loan and cash contributed by the District will be utilized to finance
the development and construction of the Project. The remaining portion of the proceeds from the
Series 2016 Bonds will be utilized to (i) pay capitalized interest on a portion of the Series 2016 Bonds to
and including July 1, 2021, (ii) to obtain a municipal bond debt service reserve surety policy for the
Series 2016 Bonds, and (iii) to pay the related issuance expenses, including bond insurance premiums.
Amortization of original issue premium and deferred costs of insurance related to the Series 2016 Bonds
was $1,423,461 for the year ended June 30, 2019.
The Series 2016 Bonds are subject to optional redemption prior to maturity by the District on or after July 1,
2026, in whole or in part, at par plus accrued interest. The Series 2016 Bonds are subject to mandatory
sinking fund redemption, in part, prior to maturity on July 1 of each year starting in 2035.
The 2041 Term Bond and the 2055 Term Bond are insured by Assured Guaranty Municipal Corporation.
The Series 2016 Bonds Debt Service Reserve Fund Requirement of $24,774,566 is secured by a debt
service reserve fund policy also issued by Assured Guaranty Municipal Corporation.
The TIFIA Loan and the VTIB Loan are issued on the Subordinate Lien of the 2016 Resolution and bear
interest rates of 2.88% and 2.90%, respectively. The loans do not incur interest until drawn which occurred
starting in August 2018. In August 2018, $9,048,806 and $1,336,490 was drawn on the TIFA and VTIB
loans, respectively. Both loans have first semi-annual interest repayments commencing January 1, 2021
and first annual principal repayments commencing on July 1, 2025. Final repayment on both loans is
July 1, 2054.
The underlying credit rating on the Series 2016 Bonds is Baa2 and BBB by Moody’s Investors Service and
S&P Global Ratings, respectively. The TIFIA Loan is also rated Baa2 and BBB by Moody’s Investors
Service and S&P Global Ratings, respectively. The VTIB Loan is unrated.

CHESAPEAKE BAY BRIDGE AND TUNNEL DISTRICT
Notes to Basic Financial Statements
June 30, 2019 and 2018
26 (Continued)
The bond premiums for General Resolution Revenue Bonds are being accreted using the straight line
method, which is not materially different from using the effective interest method, over the period the bonds
will be outstanding.
Tolls and other revenues derived from the operation of the Bridge Tunnel are pledged as security for the
General Resolution Revenue Bonds. The General Revenue Bond Resolution includes covenants such as
minimum toll rate covenant ratios and minimum debt service reserve requirements.
Bond activity for the years ended June 30, 2019 and 2018 was as follows:
Amortization
of costs,
premiums,
discounts, and Amounts
Balance, Bond deferred Capitalized Bond Balance, due within
June 30, 2018 proceeds losses, net interest payments June 30, 2019 one year
First Tier General Resolution
Series 2016 Bonds $ 321,515,000 — — — — 321,515,000 —
Issuance premiums 38,235,023 — (1,535,754) — — 36,699,269 —
Subordinate General Resolution
TIFIA Series 2016 — 9,048,806 — 229,172 — 9,277,978 —
VTIB Series 2016 — 1,336,490 — 34,087 — 1,370,577 —
$ 359,750,023 10,385,296 (1,535,754) 263,259 — 368,862,824 —
Amortization
of costs,
premiums,
discounts, and Amounts
Balance, Bond deferred Capitalized Bond Balance, due within
June 30, 2017 proceeds losses, net interest payments June 30, 2018 one year
First Tier General Resolution
Series 2016 Bonds $ 321,515,000 — — — — 321,515,000 —
Issuance premiums 39,770,777 — (1,535,754) — — 38,235,023 —
Subordinate General Resolution
TIFIA Series 2016 — — — — — — —
VTIB Series 2016 — — — — — — —
$ 361,285,777 — (1,535,754) — — 359,750,023 —

CHESAPEAKE BAY BRIDGE AND TUNNEL DISTRICT
Notes to Basic Financial Statements
June 30, 2019 and 2018
27 (Continued)
Maturities of bond principal and interest to be paid in subsequent fiscal years for all bonds outstanding at
June 30, 2019 were as follows:
General General
resolution resolution
revenue revenue
bonds bonds
Fiscal year principal interest
2020 $ — 7,912,875
2021 — 7,912,875
2022 — 15,825,750
2023 — 15,825,750
2024 — 15,825,750
2025–2056 332,163,555 323,414,300
$ 332,163,555 386,717,300
(6) Pension Plan
(a) Plan Description
All full-time, salaried permanent employees of the District are automatically covered by a VRS
Retirement Plan (the Plan) upon employment. This plan is administered by the Virginia Retirement
System (the System) along with plans for other employer groups in the Commonwealth of Virginia.
Members earn one month of service credit for each month they are employed and for which they and
the District pay contributions to VRS. Members are eligible to purchase prior service, based on specific
criteria as defined in the Code of Virginia, as amended. Eligible prior service that may be purchased
includes prior public service, active military service, certain periods of leave, and previously refunded
service.
Benefit provisions and all other requirements are established by state statute. VRS administers three
different benefit plans for local government employees – Plan 1, Plan 2, and Hybrid. Each plan has a
different eligibility and benefit structure as defined below:
VRS Plan 1 is a defined benefit plan. Members hired before July 1, 2010 and who have service
credits before July 1, 2010 are covered under Plan 1. The retirement benefit is based on a
member’s age, creditable service, and average final compensation at retirement using a formula.
Employees are eligible for an unreduced retirement benefit at age 65 with five years of service and
at age 50 with 30 years of service for participating employers. An optional reduced retirement
benefit is available to members of VRS as early as age 50 with at least 10 years of service credit or
age 55 with at least five years of service credit.
VRS Plan 2 is a defined benefit plan. Members hired or rehired on or after July 1, 2010 and who
have no service credits before July 1, 2010 are covered under Plan 2. The retirement benefit is
based on a member’s age, creditable service, and average final compensation at retirement using
a formula. Employees are eligible for an unreduced benefit beginning at their normal Social
CHESAPEAKE BAY BRIDGE AND TUNNEL DISTRICT
Notes to Basic Financial Statements
June 30, 2019 and 2018
28 (Continued)
Security retirement age with at least five years of service credit or when the sum of their age and
service equals 90. An optional reduced retirement benefit is available to Plan 2 members as early
as age 60 with at least five years of service credit.
The Hybrid Retirement Plan combines the features of a defined benefit plan and a defined
contribution plan. Members hired on or after January 1, 2014 are eligible for the Hybrid Plan. The
defined benefit is based on a member’s age, creditable service and average final compensation at
retirement using a formula. The benefit payment payable from the defined contribution plan
depends on the member and employer contributions made to the plan and the investment
performance of those contributions. Employees are eligible for an unreduced benefit beginning at
their normal Social Security retirement age with at least five years of service credit or when the
sum of their age and service equals 90. An optional reduced retirement benefit is available to
Hybrid Retirement Plan members as early as age 60 with at least five years of service credit.
The VRS Basic Benefit is a lifetime monthly benefit based on a retirement multiplier as a percentage of
the member’s average final compensation multiplied by the member’s total service credit. The
retirement multiplier for District employees is 1.7% for Plan 1 members, 1.65% for Plan 2 members,
and 1.0% for Hybrid Plan members. Under Plan 1, average final compensation is the average of the
member’s 36 consecutive months of highest compensation. Under Plan 2 and the Hybrid Plan, average
final compensation is the average of the member’s 60 consecutive months of highest compensation. At
retirement, members can elect the Basic Benefit, the Survivor Option, a Partial Lump-Sum Option
Payment (PLOP), or the Advance Pension Option. A retirement reduction factor is applied to the Basic
Benefit amount for members electing the Survivor Option, PLOP or Advance Pension Option, or those
retiring with a reduced benefit.
Retirees are eligible for an annual cost-of-living adjustment (COLA) effective July 1 of the second
calendar year of retirement. Under Plan 1, the COLA cannot exceed 5.00%; under Plan 2 and the
Hybrid Plan, the COLA cannot exceed 6.00%. During years of no inflation or deflation, the COLA is
0.00%. The VRS also provides death and disability benefits. Title 51.1 of the Code of Virginia (1950),
as amended, assigns the authority to establish and amend benefit provisions to the General Assembly
of Virginia.
Historical trend information gives an indication of the progress made in accumulating sufficient assets
to pay benefits when due. Historical trend information for the VRS system may be found in the VRS
Comprehensive Annual Financial Report for the fiscal year ended June 30, 2018. A copy of the report
may be obtained on the VRS Web site at
https://www.varetire.org/pdf/publications/2018-annual-report.pdf or by writing to the Chief Financial
Officer of the Virginia Retirement System at P.O. Box 2500, Richmond, Virginia 23218-2500.
CHESAPEAKE BAY BRIDGE AND TUNNEL DISTRICT
Notes to Basic Financial Statements
June 30, 2019 and 2018
29 (Continued)
(b) Employees Covered by Benefit Terms
As of the June 30, 2018 and 2017 actuarial valuations, the following employees were covered by the
benefit terms of the pension plan:
2018 2017
Inactive members or their beneficiaries currently receiving
benefits 129 121
Inactive members:
Vested inactive members 11 12
Nonvested inactive members 22 21
Inactive members active elsewhere in VRS 22 26
Total inactive members 55 59
Active members 151 149
Total covered employees 335 329
(c) Contributions
The contribution requirement for active employees is governed by §51.1-145 of the Code of Virginia, as
amended, but may be impacted as a result of funding options provided to political subdivisions by the
Virginia General Assembly. Employees are required to contribute 5.00% of their compensation toward
their retirement. Prior to July 1, 2012, all of the 5.00% member contribution were assumed by the
District. Beginning July 1, 2012, new employees were required to pay the 5% member contribution. In
addition, for existing employees, employers were required to begin making the employee pay the
5.00% member contribution. This could be phased in over a period of up to 5 years and the employer is
required to provide a salary increase equal to the amount of the increase in the employee-paid member
contribution. For District employees hired prior to July 1, 2012, the 5% member contribution was
allocated so that the entire 5% was paid by the employee during FY2018.
The District’s actuarially required contribution rates were 12.06% and 12.46% of covered employee
compensation for the years ended June 30, 2019 and 2018, respectively. This rate was based on an
actuarially determined rate from an actuarial valuation as of June 30, 2017 and 2015. This rate, when
combined with employee contributions, was expected to finance the costs of benefits earned by
employees during the year, with an additional amount to finance any unfunded accrued liability.
Contributions to the pension plan from the District, including the employer-paid member contributions,
were $955,139 and $970,166 for the years ended June 30, 2019 and 2018, respectively.
(d) Net Pension Liability
The District’s net pension liability as of June 30, 2019 and 2018 was measured as of June 30, 2018
and 2017, respectively. The total pension liability used to calculate the net pension liability was
determined by an actuarial valuation performed as of June 30, 2017 and 2016, using updated actuarial
CHESAPEAKE BAY BRIDGE AND TUNNEL DISTRICT
Notes to Basic Financial Statements
June 30, 2019 and 2018
30 (Continued)
assumptions, applied to all periods included in the measurement and rolled forward to the
measurement date of June 30, 2018 and 2017.
(e) Actuarial Assumptions
The total pension liability for General Employees in the Political Subdivision’s Retirement Plan was
based on an actuarial valuation as of June 30, 2017, using the Entry Age Normal actuarial cost method
and the following assumptions, applied to all periods included in the measurement and rolled forward to
the measurement date of June 30, 2018.
Inflation 2.5%
Salary increases, including inflation 3.5% – 5.35%
Investment rate of return 7.0%, net of pension plan
investment expense,
including inflation*
Cost-of-living adjustments 2.25% – 2.50%
* Administrative expenses as a percent of the market value of assets for the last experience study
were found to be approximately 0.06% of the market assets for all of the VRS plans. This would
provide an assumed investment return rate for GASB purposes of slightly more than the assumed
7.0%. However, the difference is considered minimal, therefore the 7.0% investment return
assumption provided a projected plan net position that exceeded the projected benefit payments,
the long-term expected rate of return on investments was assumed to be 7.0% to simplify
preparation of pension liabilities.
Mortality rates: 14% of deaths are assumed to be service related
Largest 10 – Non-Hazardous Duty: 20% of deaths are assumed to be service related
Pre-Retirement:
RP-2014 Employee Rates to age 80, Healthy Annuitant Rates at ages 81 and older
projected with scale BB to 2020; males 95% of rates; females 105% of rates.
Post-Retirement:
RP-2014 Employee Rates to age 49, Healthy Annuitant Rates at ages 50 and older
projected with scale BB to 2020; males set forward 3 years; females 1.0% increase
compounded from ages 70 to 90.
Post-Disablement:
RP-2014 Disability Mortality Rates projected with scale BB to 2020; males set
forward 2 years, 110% of rates; females 125% of rates.

CHESAPEAKE BAY BRIDGE AND TUNNEL DISTRICT
Notes to Basic Financial Statements
June 30, 2019 and 2018
31 (Continued)
All Others (Non 10 Largest) – Non-Hazardous Duty: 15% of deaths are assumed to be service
related:
Pre-Retirement:
RP-2014 Employee Rates to age 80, Healthy Annuitant Rates at ages 81 and older
projected with scale BB to 2020; males 95% of rates; females 105% of rates
Post-Retirement:
RP-2014 Employee Rates to age 49, Healthy Annuitant Rates at ages 50 and older
projected with scale BB to 2020; males set forward 3 years; females 1.0% increase
compounded from ages 70 to 90.
Post-Disablement:
RP-2014 Disability Mortality Rates projected with scale BB to 2020; males set
forward 2 years, 110% of rates; females 125% of rates.
The actuarial assumptions used in the June 30, 2017 valuation were based on the results of an
actuarial experience study for the period from July 1, 2012 through June 30, 2016. Changes to the
actuarial assumptions as a result of the experience study are as follows:
Largest 10 – Non-Hazardous Duty:
Mortality rates (Pre-retirement, Update to a more current mortality table –
post-retirement healthy, and disabled RP-2014 projected to 2020
Retirement rates Lowered rates at older ages and changed final
retirement from 70 to 75
Withdrawal rates Adjusted rates to better fit experience at each
year age and service through 9 years of service
Disability rates Lowered rates
Salary scale No change
Line of duty disability Increase rate from 14% to 20%
All Others (Non 10 Largest) – Non-LEOS:
Mortality rates (Pre-retirement, post-retirement Update to a more current mortality table – RP-2014
healthy, and disabled projected to 2020
Retirement rates Lowered rates at older ages and changed final
retirement from 70 to 75
Withdrawal rates Adjusted rates to better fit experience at each year
age and service through 9 years of service
Disability rates Lowered rates
Salary scale No change
Line of duty disability Increase rate from 14% to 15%
CHESAPEAKE BAY BRIDGE AND TUNNEL DISTRICT
Notes to Basic Financial Statements
June 30, 2019 and 2018
32 (Continued)
(f) Long-Term Expected Rate of Return
The long-term expected rate of return on pension system investments was determined using a
log-normal distribution analysis in which best-estimate ranges of expected future real rates of return
(expected returns, net of pension System investment expense and inflation) are developed for each
major asset class. These ranges are combined to produce the long-term expected rate of return by
weighting the expected future real rates of return by the target asset allocation percentage and by
adding expected inflation. The target asset allocation and best estimate of arithmetic real rates of return
for each major asset class are summarized in the following table:
Weighted
Arithmetic average
long-term long-term
Target expected expected
Asset class (strategy) allocation rate of return rate of return
Public equity 40.00 % 4.54 % 1.82 %
Fixed income 15.00 0.69 0.10
Credit strategies 15.00 3.96 0.59
Real assets 15.00 5.76 0.86
Private equity 15.00 9.53 1.43
Total 100.00 % 4.80
Inflation 2.50
*Expected arithmetic nominal return 7.30 %
* The above allocation provides a one-year return of 7.30%. However, one-year returns do not take
into account the volatility present in each of the asset classes. In setting the long-term expected
return for the system, stochastic projections are employed to model future returns under various
economic conditions. The results provide a range of returns over various time periods that
ultimately provide a median return of 6.83%, including expected inflation of 2.50%.
(g) Discount Rate
The discount rate used to measure the total pension liability was 7.00%. The projection of cash flows
used to determine the discount rate assumed that System member contributions will be made per the
VRS Statutes and the employer contributions will be made in accordance with the VRS funding policy
at rates equal to the difference between actuarially determined contribution rates adopted by the VRS
Board of Trustees and the member rate. Consistent with the phased-in funding provided by the General
Assembly for state and teacher employer contributions; political subdivisions were also provided with
an opportunity to use an alternate employer contribution rate. For the year ended June 30, 2018, the
alternate rate was the employer contribution rate used in FY2012 or 90% of the actuarially determined
employer contribution rate from the June 30, 2015, actuarial valuations, whichever was greater. From
July 1, 2018 on, participating employers are assumed to continue to contribute 100% of the actuarially
determined contribution rates. Based on those assumptions, the pension plan’s fiduciary net position

CHESAPEAKE BAY BRIDGE AND TUNNEL DISTRICT
Notes to Basic Financial Statements
June 30, 2019 and 2018
33 (Continued)
was projected to be available to make all projected future benefit payments of current active and
inactive employees. Therefore the Long-term expected rate of return was applied to all periods of
projected benefit payments to determine the total pension liability.
(h) Changes in Net Pension Liability
Increase (decrease)
Total pension Plan fiduciary Net pension
liability net position liability
(a) (b) (a) – (b)
Balances at June 30, 2017 $ 44,400,853 33,986,490 10,414,363
Changes for the year:
Service cost 597,397 — 597,397
Interest 3,032,147 — 3,032,147
Difference between expected and
actual experience 492,272 — 492,272
Contributions – employer — 970,550 (970,550)
Contributions – employee — 388,140 (388,140)
Net investment income — 2,495,933 (2,495,933)
Benefit payments, including refunds of
employee contributions (2,168,931) (2,168,931) —
Administrative expense — (21,765) 21,765
Other changes — (2,213) 2,213
Net changes 1,952,885 1,661,714 291,171
Balances at June 30, 2018 $ 46,353,738 35,648,204 10,705,534

CHESAPEAKE BAY BRIDGE AND TUNNEL DISTRICT
Notes to Basic Financial Statements
June 30, 2019 and 2018
34 (Continued)
Increase (decrease)
Total pension Plan fiduciary Net pension
liability net position liability
(a) (b) (a) – (b)
Balances at June 30, 2016 $ 43,634,041 31,042,980 12,591,061
Changes for the year:
Service cost 640,081 — 640,081
Interest 2,980,890 — 2,980,890
Changes of assumptions (627,513) — (627,513)
Difference between expected and
actual experience (126,846) — (126,846)
Contributions – employer — 948,676 (948,676)
Contributions – employee — 379,559 (379,559)
Net investment income — 3,740,285 (3,740,285)
Benefit payments, including refunds of
employee contributions (2,099,800) (2,099,800) —
Administrative expense — (21,889) 21,889
Other changes — (3,321) 3,321
Net changes 766,812 2,943,510 (2,176,698)
Balances at June 30, 2017 $ 44,400,853 33,986,490 10,414,363
(i) Sensitivity of the Net Pension Liability to Changes in the Discount Rate
The following presents the net pension liability as of June 30, 2019 and 2018 of the political subdivision
using the discount rate of 7.0%, as well as what the political subdivision’s net pension liability would be
if it were calculated using a discount rate that is one percentage point lower (6.00%) or one percentage
point higher (8.00%) than the current rate:
Current
discount
1% decrease rate 1% increase
(6.00%) (7.00%) (8.00%)
District’s net pension liability
As of June 30, 2019 $ 16,403,617 10,705,534 5,938,360
As of June 30, 2018 16,017,274 10,414,363 5,738,712
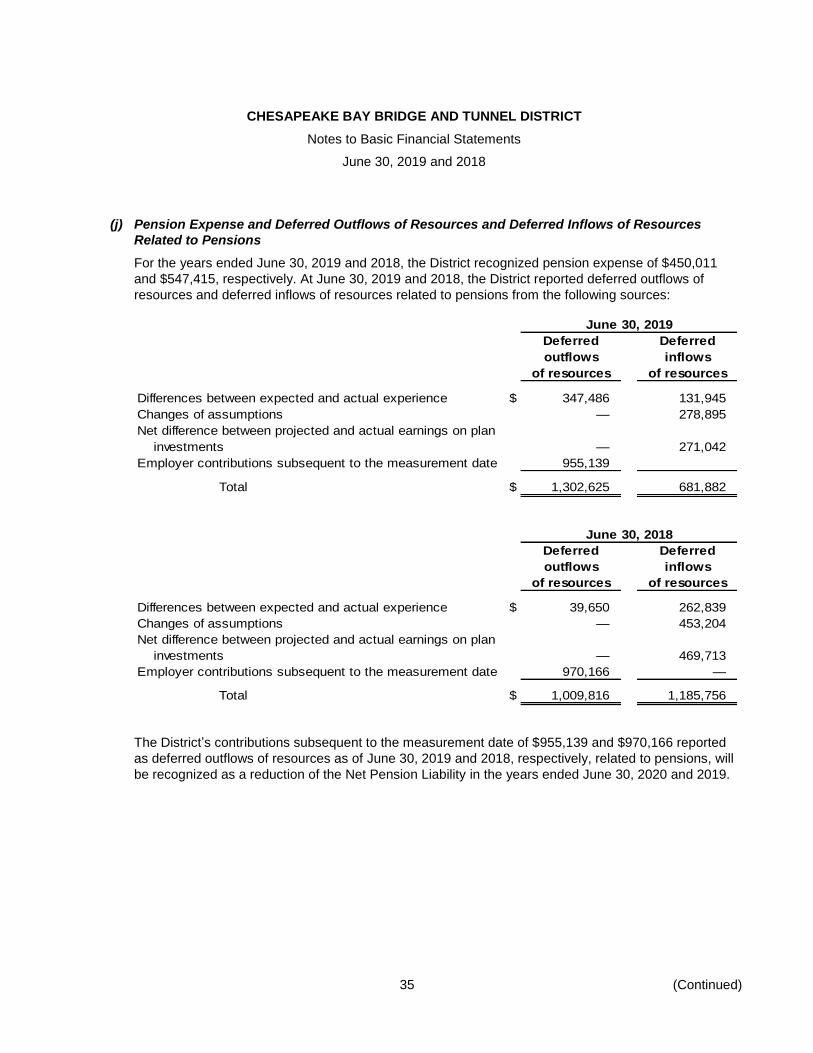
CHESAPEAKE BAY BRIDGE AND TUNNEL DISTRICT
Notes to Basic Financial Statements
June 30, 2019 and 2018
35 (Continued)
(j) Pension Expense and Deferred Outflows of Resources and Deferred Inflows of Resources
Related to Pensions
For the years ended June 30, 2019 and 2018, the District recognized pension expense of $450,011
and $547,415, respectively. At June 30, 2019 and 2018, the District reported deferred outflows of
resources and deferred inflows of resources related to pensions from the following sources:
June 30, 2019
Deferred Deferred
outflows inflows
of resources of resources
Differences between expected and actual experience $ 347,486 131,945
Changes of assumptions — 278,895
Net difference between projected and actual earnings on plan
investments — 271,042
Employer contributions subsequent to the measurement date 955,139
Total $ 1,302,625 681,882
June 30, 2018
Deferred Deferred
outflows inflows
of resources of resources
Differences between expected and actual experience $ 39,650 262,839
Changes of assumptions — 453,204
Net difference between projected and actual earnings on plan
investments — 469,713
Employer contributions subsequent to the measurement date 970,166 —
Total $ 1,009,816 1,185,756
The District’s contributions subsequent to the measurement date of $955,139 and $970,166 reported
as deferred outflows of resources as of June 30, 2019 and 2018, respectively, related to pensions, will
be recognized as a reduction of the Net Pension Liability in the years ended June 30, 2020 and 2019.

CHESAPEAKE BAY BRIDGE AND TUNNEL DISTRICT
Notes to Basic Financial Statements
June 30, 2019 and 2018
36 (Continued)
Other amounts reported as deferred outflows of resources and deferred inflows of resources related to
pensions will be recognized as a decrease to pension expense as follows:
2019
Year ended June 30:
2020 $ (13,646)
2021 (1,201)
2022 (290,332)
2023 (29,217)
2024 —
Thereafter —
$ (334,396)
(7) Deferred Compensation
Effective July 1, 1999, the District established a Deferred Compensation Plan (DCP) in accordance with
Internal Revenue Code Section 457 (IRC-457) that is administered by the VRS. Employees may voluntarily
elect to participate in the DCP and may defer a portion of their compensation until future years. The
deferred compensation is not available to employees until after termination, retirement, death, or
unforeseen financial emergency, as defined in IRC-457.
Salaried employees who elect to participate in the DCP can receive an employer cash match up to a
maximum of $100 per pay period. An hourly employee of the District may defer compensation, but does not
receive a cash match. The employer cash match is contributed to a separate Internal Revenue Service
Section 401(a) account. The District contributed approximately $176,905 and $181,654 to employees’
401(a) accounts during the years ended June 30, 2019 and 2018, respectively.
The defined contribution component of the Hybrid Retirement Plan provides the Hybrid 401(a) Cash Match
Plan. The District’s employees participating as Hybrid Retirement Plan members contribute a mandatory
1% of their creditable compensation each month to their 401(a) plan account. The District also contributes
a mandatory 1% as well as matching contributions on any voluntary contributions a member makes. The
District contributed $27,237 and $28,889 to Hybrid Retirement Plan employees’ 401(a) accounts during the
years ended June 30, 2019 and 2018, respectively.
(8) Risk Management
The District is exposed to various risks of loss related to torts; theft of, damage to, and destruction of
assets; employee dishonesty; injuries to employees; and natural disasters. The District purchases
insurance for specific types of coverage, including property, loss of revenue, liability, auto, crime, workers’
compensation, and public officials. Claims settlements and judgments not covered by insurance are
covered by operating resources. The amount of insurance settlements did not exceed insurance coverage
for any of the past three years. Claims expenses and liabilities are reported when it is probable that a loss
has occurred not otherwise covered by insurance and the amount of the loss can be reasonably estimated.

CHESAPEAKE BAY BRIDGE AND TUNNEL DISTRICT
Notes to Basic Financial Statements
June 30, 2019 and 2018
37 (Continued)
Effective July 1, 2013, the District changed the health insurance plans offered to employees and retirees for
medical and dental benefits from fully insured plans to self-insured plans. Stop-loss coverage for aggregate
and individual claims is utilized to protect the District from the potential effects of catastrophic medical
claims.
(9) Retiree Health Insurance Plan (RHIP) Other Postemployment Benefit Plan (OPEB)
(a) Plan Description
The District provides RHIP OPEB for its employees through a single employer defined-benefit plan
(the Plan). The Plan was established and may be amended by the Commission. No assets are
accumulated in a trust that meets the criteria in paragraph 4 of GASB Statement No. 75.
The Plan provides healthcare insurance for eligible retirees and their spouses through the District’s
group health insurance plans, which cover both active and retired members. Plan benefits vest for
employees after a minimum of 10 years of salaried service with the District, after obtaining age 50 and
after receiving a retirement benefit under the provisions of the VRS. Retirees with less than 20 years of
continuous, salaried service with the District are ineligible for a health insurance premium credit and
are, therefore, responsible for their entire health insurance premium. Retirees with more than 20 years
of continuous, salaried service with the District receive a credit of $8.50 per month for each complete
year of salaried service up to 40 years and a monthly premium credit of $340. Length of service means
the total length of service credited by the VRS for calculating the retiree’s pension benefits from VRS.
All credits cease upon the retiree’s death. Spouses may continue coverage under the plan after the
death of the retiree.
In no event will the premium credit exceed the actual monthly health cost for Individual coverage.
Spouses may be covered, but they must pay the full monthly rate for coverage. The only exception to
these rules is for Medicare-eligible retirees who have earned a credit in excess of their plan cost. In this
situation, credits earned in excess of the retiree-only cost can be used to pay for prescription drug
coverage and for spousal coverage.
The Commission establishes employer contribution rates for the plan participants and determines how
the plan will be funded as part of the budgetary process each year. The Commission has elected to
continue to fund the healthcare benefits for retirees on a “pay-as-you-go” basis.
Amounts paid by the District for RHIP OPEB during the years ended June 30, 2019 and 2018
amounted to $241,980 and $216,136, respectively.

CHESAPEAKE BAY BRIDGE AND TUNNEL DISTRICT
Notes to Basic Financial Statements
June 30, 2019 and 2018
38 (Continued)
(b) Employees Covered by Benefit Terms
As of the June 30, 2017 actuarial valuation, the following employees were covered by the benefit terms
of the pension plan:
2017
Inactive members or their beneficiaries
currently receiving benefits 72
Active members 157
Total covered employees
and retired members 229
(c) Net RHIP OPEB Liability
The District’s net RHIP OPEB liability as of June 30, 2019 and 2018 was measured as of June 30,
2018 and 2017, respectively. The total RHIP OPEB liability used to calculate the net RHIP OPEB
liability was determined by an actuarial valuation performed as of June 30, 2017 and rolled forward to
the measurement date of June 30, 2018.
(d) Actuarial Assumptions
The total RHIP OPEB liability in the June 30, 2017 actuarial valuation was determined using the
following actuarial assumptions and other inputs, applied to all periods included in the measurement,
unless otherwise specified:
Actuarial cost method: Entry Age Normal Cost Method; Level Percentage of Pay
Discount rate: 3.55%, based on yields for 20-year, tax-exempt general obligation
municipal bonds with an average rating of AA/Aa or higher. The rate
used in the current valuation is based on indices published by Bond
Buyer and Fidelity for 20-year general obligation bonds as
of June 30, 2017.
Healthcare cost trend rates: The medical trend assumptions used in the valuation were developed
using the Society of Actuaries (SOA) Long-Run Medical Cost
Trend Model. The SOA model was released in December 2007.
Version 2018_c was used for the 2017 valuation.

CHESAPEAKE BAY BRIDGE AND TUNNEL DISTRICT
Notes to Basic Financial Statements
June 30, 2019 and 2018
39 (Continued)
The following assumptions were used as input variables into the model:
Assumptions Model input
Rate of Inflation 2.50 %
Rate of Growth in Real Income/GDP per Capita 1.00 %
Income Multiplier for Health Spending 1.00
Health Share of GDP Resistance Point 25 %
Year for Limiting Cost Growth to GDP Growth 2075
The SOA Long-Run Medical Cost Trend Model and its baseline
projections are based on an econometric analysis of historical U.S.
medical expenditures and the judgements of experts in the field.
The long-run baseline projection and input variables have been
developed under the guidance of the SOA Project Oversight Group.
The following table shows the resulting medical cost trends used in the valuation:
Medical trend
Year ending June 30:
2019 5.40%
2020 5.30
2021 5.20
2022 5.09
2023 4.99
2024 4.88
2025 4.77
2026 4.67
2027–2048 4.56
2049–2074 4.48–3.59
2075+ 3.53
The actuarial assumptions used for employee decrements (e.g., mortality, turnover, retirement and
disability) are based on the results of an experience study on behalf of the Virginia Retirement System
for the four year period ending June 30, 2016. Specific assumptions are the same as those used for the
Pension Plan and are described more fully on pages 30–31.
Age difference and percentage
married: For active employees, male spouses were assumed to be two years
older than females. 100% of active employees are assumed to be
married at retirement. For retirees, actual spouse data was used
so no assumptions regarding marital status or age of spouse
were made.

CHESAPEAKE BAY BRIDGE AND TUNNEL DISTRICT
Notes to Basic Financial Statements
June 30, 2019 and 2018
40 (Continued)
Participation:
Assumed
rate of
Retiree group participation
Nondisabled retirees 85 %
Disabled retirees 100
Spouses 40
(e) Changes in the Total RHIP OPEB Liability
Total
RHIP OPEB
liability
Balance at June 30, 2017 $ 5,242,303
Changes for the year:
Service cost 132,336
Interest 146,368
Differences between expected and actual experience 294,400
Changes in assumptions or other inputs (454,232)
Benefit payments (213,142)
Net changes (94,270)
Balance at June 30, 2018 5,148,033
Changes for the year:
Service cost 104,240
Interest 178,574
Benefit payments (235,555)
Net changes 47,259
Balance at June 30, 2019 $ 5,195,292

CHESAPEAKE BAY BRIDGE AND TUNNEL DISTRICT
Notes to Basic Financial Statements
June 30, 2019 and 2018
41 (Continued)
(f) Sensitivity of the Total RHIP OPEB Liability to Changes in the Discount Rate
The following presents the total RHIP OPEB liability of the District as of June 30, 2017 and 2018 using
the discount rate of 3.55%, as well as what the District’s total RHIP OPEB liability would be if it were
calculated using a discount rate that is one percentage point lower (2.55%) or one percentage point
higher (4.55%) than the current rate:
Current
1% decrease discount rate 1% increase
(2.55%) (3.55%) (4.55%)
District’s total RHIP OPEB liability
as of June 30, 2019 $ 5,802,363 5,195,292 4,677,798
as of June 30, 2018 $ 5,764,078 5,148,033 4,623,905
(g) Sensitivity of the Total RHIP OPEB Liability to Changes in the Healthcare Cost Trend Rates
The following presents the total RHIP OPEB liability of the District as of June 30, 2017 and 2018 as
well as what the District’s total RHIP OPEB liability would be if it were calculated using healthcare cost
trend rates that are one percentage point lower or one percentage point higher than the current
healthcare cost trend rates:
Healthcare
1% decrease cost trend 1% increase
(4.5% rates (5.5% (6.5%
decreasing decreasing decreasing
to 2.53%) to 3.53%) to 4.53%)
District’s total RHIP OPEB liability
as of June 30, 2019 $ 5,011,932 5,195,292 5,409,862
as of June 30, 2018 $ 4,978,081 5,148,033 5,346,444

CHESAPEAKE BAY BRIDGE AND TUNNEL DISTRICT
Notes to Basic Financial Statements
June 30, 2019 and 2018
42 (Continued)
(h) RHIP OPEB Expense and Deferred Outflows of Resources and Deferred Inflows of Resources
Related to RHIP OPEB
For the years ended June 30, 2018 and 2019, the District recognized RHIP OPEB expense of
$252,757 and $256,867, respectively. At June 30, 2018 and 2019, the District reported deferred
outflows of resources and deferred inflows of resources related to RHIP OPEB from the following
sources:
June 30, 2019
Deferred Deferred
outflows inflows
of resources of resources
Differences between expected and actual experience $ 198,816 —
Changes of assumptions — 306,754
Employer contributions subsequent to the
measurement date 241,979 —
Total $ 440,795 306,754
June 30, 2018
Deferred Deferred
outflows inflows
of resources of resources
Differences between expected and actual experience $ 246,608 —
Changes of assumptions — 380,493
Employer contributions subsequent to the
measurement date 216,136 —
Total $ 462,744 380,493

CHESAPEAKE BAY BRIDGE AND TUNNEL DISTRICT
Notes to Basic Financial Statements
June 30, 2019 and 2018
43 (Continued)
The District’s contributions subsequent to the measurement date of $241,979 reported as deferred
outflows of resources as of June 30, 2019, related to RHIP OPEB, will be recognized as a reduction of
the total RHIP OPEB liability in the year ended June 30, 2020. Other amounts reported as deferred
outflows of resources and deferred inflows of resources related to RHIP OPEB will be recognized as an
decrease to RHIP OPEB expense as follows:
2019
Year ended June 30:
2020 $ (25,947)
2021 (25,947)
2022 (25,947)
2023 (25,947)
2024 (4,150)
Thereafter —
$ (107,938)
(10) VRS Group Life Insurance (GLI) OPEB Plan
(a) Plan description
All full-time, salaried permanent employees of the state agencies, teachers and employees of
participating political subdivisions are automatically covered by the VRS GLI Program upon
employment. This plan is administered by the VRS, along with pensions and other OBEB plans, for
public employer groups in the Commonwealth of Virginia.
In addition to the Basic Group Life Insurance benefit, members are also eligible to elect additional
coverage for themselves as well as a spouse or dependent children through the Optional Group Life
Insurance Program. For members who elect the optional group life insurance coverage, the insurer bills
employers directly for the premiums. Employers deduct these premiums from members’ paychecks and
pay the premiums to the insurer. Since this is a separate and fully insured program, it is not included as
part of the GLI Program OPEB.
The GLI Program was established July 1, 1960, for state employees, teachers and employees of
political subdivisions that elect the program. Basic group life insurance coverage is automatic upon
employment. Coverage ends for employees who leave their position before retirement eligibility or who
take a refund of their member contributions and accrued interest.
The benefits payable under the GLI Program have several components. The natural death benefit is
equal to the employee’s covered compensation rounded to the next highest thousand and then
doubled. The accidental death benefit is double the natural death benefit. In addition to the basic
natural and accidental death benefits, the program provides additional benefits provided under specific
circumstances. These include accidental dismemberment benefits, safety belt benefits, repatriation
benefits, felonious assault benefits and accelerated death benefit options. The benefit amounts
provided to members covered under the GLI Program are subject to a reduction factor. The benefit
amount reduces by 25% on January 1 following one calendar year of separation. The benefit amount
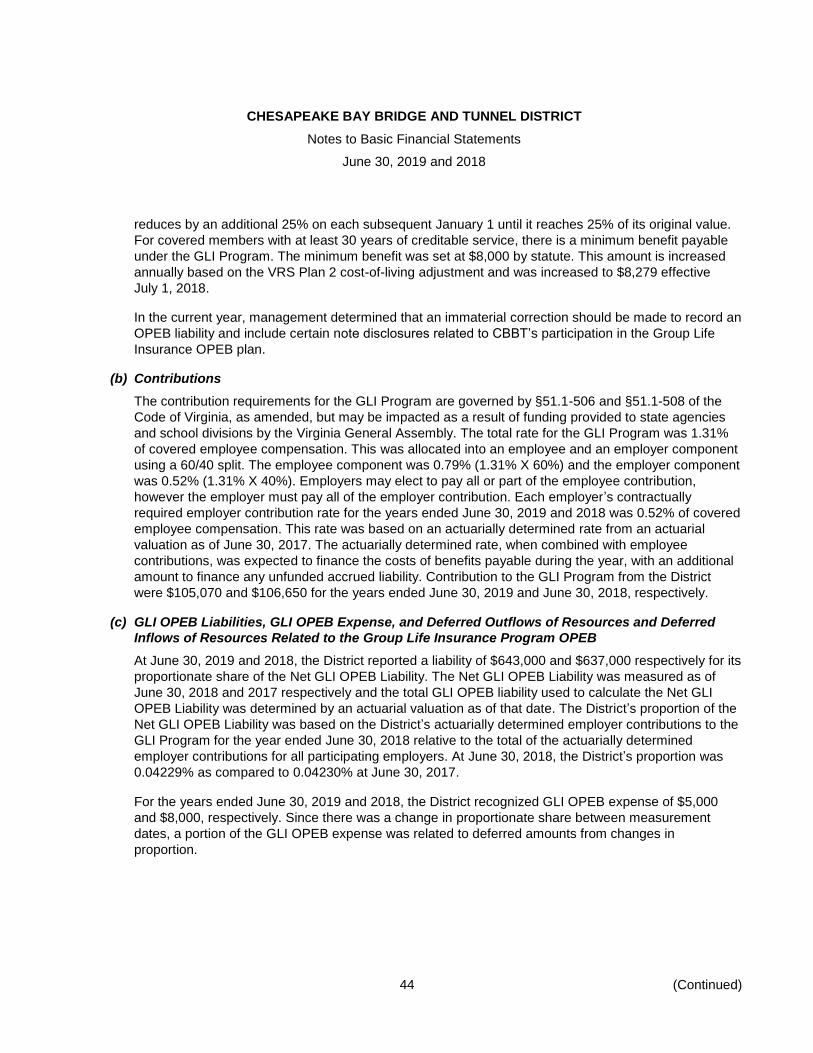
CHESAPEAKE BAY BRIDGE AND TUNNEL DISTRICT
Notes to Basic Financial Statements
June 30, 2019 and 2018
44 (Continued)
reduces by an additional 25% on each subsequent January 1 until it reaches 25% of its original value.
For covered members with at least 30 years of creditable service, there is a minimum benefit payable
under the GLI Program. The minimum benefit was set at $8,000 by statute. This amount is increased
annually based on the VRS Plan 2 cost-of-living adjustment and was increased to $8,279 effective
July 1, 2018.
In the current year, management determined that an immaterial correction should be made to record an
OPEB liability and include certain note disclosures related to CBBT’s participation in the Group Life
Insurance OPEB plan.
(b) Contributions
The contribution requirements for the GLI Program are governed by §51.1-506 and §51.1-508 of the
Code of Virginia, as amended, but may be impacted as a result of funding provided to state agencies
and school divisions by the Virginia General Assembly. The total rate for the GLI Program was 1.31%
of covered employee compensation. This was allocated into an employee and an employer component
using a 60/40 split. The employee component was 0.79% (1.31% X 60%) and the employer component
was 0.52% (1.31% X 40%). Employers may elect to pay all or part of the employee contribution,
however the employer must pay all of the employer contribution. Each employer’s contractually
required employer contribution rate for the years ended June 30, 2019 and 2018 was 0.52% of covered
employee compensation. This rate was based on an actuarially determined rate from an actuarial
valuation as of June 30, 2017. The actuarially determined rate, when combined with employee
contributions, was expected to finance the costs of benefits payable during the year, with an additional
amount to finance any unfunded accrued liability. Contribution to the GLI Program from the District
were $105,070 and $106,650 for the years ended June 30, 2019 and June 30, 2018, respectively.
(c) GLI OPEB Liabilities, GLI OPEB Expense, and Deferred Outflows of Resources and Deferred
Inflows of Resources Related to the Group Life Insurance Program OPEB
At June 30, 2019 and 2018, the District reported a liability of $643,000 and $637,000 respectively for its
proportionate share of the Net GLI OPEB Liability. The Net GLI OPEB Liability was measured as of
June 30, 2018 and 2017 respectively and the total GLI OPEB liability used to calculate the Net GLI
OPEB Liability was determined by an actuarial valuation as of that date. The District’s proportion of the
Net GLI OPEB Liability was based on the District’s actuarially determined employer contributions to the
GLI Program for the year ended June 30, 2018 relative to the total of the actuarially determined
employer contributions for all participating employers. At June 30, 2018, the District’s proportion was
0.04229% as compared to 0.04230% at June 30, 2017.
For the years ended June 30, 2019 and 2018, the District recognized GLI OPEB expense of $5,000
and $8,000, respectively. Since there was a change in proportionate share between measurement
dates, a portion of the GLI OPEB expense was related to deferred amounts from changes in
proportion.

CHESAPEAKE BAY BRIDGE AND TUNNEL DISTRICT
Notes to Basic Financial Statements
June 30, 2019 and 2018
45 (Continued)
At June 30, 2019 and 2018, the District reported deferred outflows of resources and deferred inflows of
resources related to the GLI OPEB plan from the following sources:
June 30, 2019
Deferred Deferred
outflows of inflows of
resources resources
Net difference between projected and actual earnings on
GLI OPEB plan investments $ — 21,000
Change of assumptions — 27,000
Differences between expected and actual experience 31,000 11,000
Changes in proportionate share 3,000 —
Employer contributions subsequent to the measurement date 42,000 —
Total as of June 30, 2019 $ 76,000 59,000
June 30, 2018
Deferred Deferred
outflows of inflows of
resources resources
Net difference between projected and actual earnings on
GLI OPEB plan investments $ — 24,000
Change of assumptions — 33,000
Differences between expected and actual experience — 14,000
Changes in proportionate share 4,000 —
Employer contributions subsequent to the measurement date 42,000 —
Total as of June 30, 2018 $ 46,000 71,000

CHESAPEAKE BAY BRIDGE AND TUNNEL DISTRICT
Notes to Basic Financial Statements
June 30, 2019 and 2018
46 (Continued)
Deferred outflows of resources related to GLI OPEB plans totaling $42,000 and $42,000 resulting from
the District’s contributions subsequent to the measurement dates of June 30, 2018 and 2017,
respectively, will be recognized as a reduction of the net GLI OPEB liability in the fiscal year ended
June 30, 2020 and 2019, respectively. Other amounts reported as deferred outflows of resources and
deferred inflows of resources related to the GLI OPEB plans will be recognized in the District’s GLI
OPEB expense in future reporting periods as follows:
Year ending June 30:
2020 $ (8,000)
2021 (8,000)
2022 (8,000)
2023 (3,000)
2024 2,000
Thereafter —
$ (25,000)
(d) Actuarial assumptions
The total GLI OPEB liability was based on actuarial valuations as of June 30, 2017, using the Entry
Age Normal actuarial cost method and the following assumptions, applied to all periods included in the
measurement and rolled forward to the measurement date of June 30, 2018.
Inflation 2.5 percent
Salary increases, including inflation: 3.5–5.35 percent
Investment rate of return 7.0 percent, net of investment expenses,
including inflation*
* Administrative expenses as a percent of the market value of assets for the last experience study
were found to be approximately 0.06% of the market assets for all of the VRS plans. This would
provide an assumed investment return rate for GASB purposes of slightly more than the assumed
rate. However, since the difference was minimal, and a more conservative investment return
assumption provided a projected plan net position that exceeded the projected benefit payments,
the long-term expected rate of return on investments was assumed to be 7.0% to simplify
preparation of the OPEB liabilities.

CHESAPEAKE BAY BRIDGE AND TUNNEL DISTRICT
Notes to Basic Financial Statements
June 30, 2019 and 2018
47 (Continued)
Mortality assumptions
Pre-retirement: RP-2014 Employee Rates to age 80,
Healthy Annuitant Rates at ages 81
and older projected with scale BB
to 2020; males 95% of Rates;
females 105% of rates
Post-retirement: RP-2014 Employee Rates to age 49,
Healthy Annuitant Rates at ages 50
and older projected with scale BB to
2020; males set forward 3 years;
females 1% increase compounded
from ages 70 to 90
Post-disablement: RP-2014 Disabled Mortality Rates
projected with scale BB to 2020;
males set forward 2 years, 110%
of rates; females 125% of rates
The actuarial assumptions used in the June 30, 2017 valuation were based on the results of an
actuarial experience study for the period from July 1, 2012 through June 30, 2016. Changes to the
actuarial assumptions as a result of the experience study for general employees include updating to a
more current mortality table, lowering retirement rates at older ages and extending final retirement
ages, adjusting termination rates, lowering disability rates, and increasing line of duty disability.
(e) Net GLI OPEB Liability
The net GLI OPEB liability for the Group Life Insurance Program represents the program’s total GLI
OPEB liability determined in accordance with GASB Statement No. 74, less the associated fiduciary
net position. As of the measurement dates of June 30, 2017 and 2018, Net GLI OPEB liability amounts
for the Group Life Insurance Program are as follows (dollar amounts in thousands):
2019 2017
Total OPEB liability $ 3,113,508 2,942,426
Plan fiduciary net position 1,594,773 1,437,586
Employers’ net OPEB liability $ 1,518,735 1,504,840
Plan fiduciary net position as a
percentage of the total OPEB liability 51.22 % 48.86 %
The total GLI OPEB liability is calculated by VRS’ actuary, and each plan’s fiduciary net position is
reported in the VRS’ financial statements. The net GLI OPEB liability is disclosed in accordance with
the requirements of GASB Statement No. 74 in the VRS’ notes to the financial statements and required
supplementary information.

CHESAPEAKE BAY BRIDGE AND TUNNEL DISTRICT
Notes to Basic Financial Statements
June 30, 2019 and 2018
48 (Continued)
(f) Long-Term Expected Rate of Return
The long-term expected rate of return on VRS’ investments for the GLI plan was determined using a
log-normal distribution analysis in which best-estimate ranges of expected future real rates of return
(expected returns, net of VRS’ investment expense and inflation) are developed for each major asset
class. These ranges are combined to produce the long-term expected rate of return by weighting the
expected future real rates of return by the target asset allocation percentage and by adding expected
inflation. The target asset allocation and best estimate of arithmetic real rates of return for each major
asset class are summarized in the following table:
Weighted
Arithmetic average
long-term long-term
Target expected expected
Asset class (strategy) allocation rate of return rate of return
Public equity 40.00% 4.54% 1.82%
Fixed income 15.00 0.69 0.10
Credit strategies 15.00 3.96 0.59
Real assets 15.00 5.76 0.86
Private equity 15.00 9.53 1.43
Total 100.00% 4.80
Inflation 2.50
* Expected arithmetic nominal return 7.30%
* The above allocation provides a one-year return of 7.30%. However, one-year returns do not take
into account the volatility present in each of the asset classes. In setting the long-term expected
return for the system, stochastic projections are employed to model future returns under various
economic conditions. The results provide a range of returns over various time periods that
ultimately provide a median return of 6.83%, including expected inflation of 2.50%.
(g) Discount rate
The discount rate used to measure the total GLI OPEB liability was 7.00%. The projection of cash flows
used to determine the discount rate assumed that member contributions will be made per the VRS
guidance and the employer contributions will be made in accordance with the VRS funding policy at
rates equal to the difference between actuarially determined contribution rates adopted by the VRS
Board of Trustees and the member rate. Through the fiscal year ending June 30, 2018, the rate
contributed by the District for the GLI OPEB will be subject to the portion of the VRS Board-certified
rates that are funded by the Virginia General Assembly which was 100% of the actuarially determined
contribution rate. From July 1, 2018 on, employers are assumed to contribute 100% of the actuarially
determined contribution rates. Based on those assumptions, the GLI OPEB’ fiduciary net position was
projected to be available to make all projected future benefit payments of eligible employees. Therefore
the long-term expected rate of return was applied to all periods of projected benefit payments to
determine the total GLI OPEB liability.

CHESAPEAKE BAY BRIDGE AND TUNNEL DISTRICT
Notes to Basic Financial Statements
June 30, 2019 and 2018
49 (Continued)
(h) Sensitivity of the District’s Proportionate Share of the Net GLI OPEB Liability to Changes in the
Discount Rate
The following presents the Districts proportionate share of the net GLI OPEB liability using the discount
rate of 7.00%, as well as what the employer’s proportionate share of the net GLI OPEB liability would
be if it were calculated using a discount rate that is one percentage point lower (6.00%) or one
percentage point higher (8.00%) than the current rate:
1% Current 1%
Decrease discount rate Increase
(6.00%) (7.00%) (8.00%)
The District’s proportionate share of
the GLI Net OPEB Liability:
as of June 30, 2019 $ 840,000 643,000 483,000
as of June 30, 2018 823,000 637,000 485,000
(i) Group Life Insurance Program Fiduciary Net Position
Detailed information about the Group Life Insurance Program’s Fiduciary Net Position is available in
the separately issued VRS 2018 Comprehensive Annual Financial Report (CAFR). A copy of the 2018
VRS CAFR may be downloaded from the VRS website at
https://www.varetire.org/pdf/publications/2018-annual-report.pdf, or by writing to the System’s Chief
Financial Officer at P.O. Box 2500, Richmond, VA, 23218-2500.
(11) Fair Value Measurements
The District utilizes valuation techniques that maximize the use of observable inputs and minimize the use
of unobservable inputs to the extent possible. The District determines fair value based on assumptions that
market participants would use in pricing an asset or liability in the principal or most advantageous market.
When considering market participant assumptions in fair value measurements, the following fair value
hierarchy distinguishes between observable and unobservable inputs, which are categorized in one of the
following levels:
Level 1 Inputs: Unadjusted quoted prices in active markets for identical assets or liabilities accessible
to the reporting entity at measurement date.
Level 2 Inputs: Other than quoted prices included in Level 1 inputs that are observable for the asset or
liability, either directly or indirectly, for substantively the full term of the asset or liability.
Level 3 Inputs: Unobservable inputs for the asset or liability used to measure fair value to the extent
that observable inputs are not available, thereby allowing for situations in which there is little, if any,
market activity for the asset or liability at measurement date.
The hierarchy gives the highest priority to unadjusted quoted prices in active markets for identified assets
or liabilities (Level 1 measurements) and the lowest priority to measurements involving significant
unobservable inputs (Level 3 measurements).

CHESAPEAKE BAY BRIDGE AND TUNNEL DISTRICT
Notes to Basic Financial Statements
June 30, 2019 and 2018
50 (Continued)
The level in the fair value hierarchy within which a fair value measurement, in its entirety falls in, is based
on the lowest level input that is significant to the fair value measurement in its entirety.
Portfolio investments are assigned a level based upon the observability of the inputs which are significant
to the overall valuation. The inputs or methodology used for valuing securities are not necessarily an
indication of the risk associated with investing in those securities.
All of the District’s investments in debt securities are in one of the four categories below and therefore the
entire portfolio of debt securities is Level 2.
Debt securities classified in Level 2 are valued using the following approaches:
U.S. Treasuries, U.S. agencies, and supranational: Quoted prices for similar securities in the market
are used to draw appropriate correlations
Corporate notes and municipal bonds: Relevant trade data, benchmark quotes, and surveys of the
dealer community are incorporated into the evaluation process
Certificates of deposit: Matrix pricing based on various market makers and dealers
Federal agency mortgage-backed: Solicited prices from market buy and sell side sources, including
primary and secondary dealers, portfolio managers, and research analysts are used
The fair value of investments in money market funds is based on the published net asset values (NAV) per
share of those funds.
The District has the following recurring fair value measurements as of June 30, 2019:
Fair value measurements using
Quoted prices Significant
in active other Significant
markets for observable unobservable
Fair value identical assets inputs inputs
2019 (Level 1) (Level 2) (Level 3)
Investments by fair value level:
U.S. Treasuries $ 114,953,073 — 114,953,073 —
Supra-national agency 10,744,126 — 10,744,126 —
U.S. agencies 104,089,041 — 104,089,041 —
Federal agency mortgage-backed 2,545,894 — 2,545,894 —
Certificates of deposit 8,269,887 — 8,269,887 —
Corporate notes 35,504,716 — 35,504,716 —
Total investments by
fair value level 276,106,737 $ — 276,106,737 —
Investments measured at the NAV:
Money market funds 97,094,296
Total investments
measured at fair value $ 373,201,033

CHESAPEAKE BAY BRIDGE AND TUNNEL DISTRICT
Notes to Basic Financial Statements
June 30, 2019 and 2018
51 (Continued)
The District had the following recurring fair value measurements as of June 30, 2018:
Fair value measurements using
Quoted prices Significant
in active other Significant
markets for observable unobservable
Fair value identical assets inputs inputs
2018 (Level 1) (Level 2) (Level 3)
Investments by fair value level:
U.S. Treasuries $ 58,520,356 — 58,520,356 —
Supra-national agency 7,930,574 — 7,930,574 —
U.S. agencies 129,889,618 — 129,889,618 —
Federal agency mortgage-backed 3,240,027 — 3,240,027 —
Certificates of deposit 9,009,082 — 9,009,082 —
Corporate notes 40,821,517 — 40,821,517 —
Total investments by
fair value level 249,411,174 $ — 249,411,174 —
Investments measured at the NAV:
Money market funds 152,042,596
Total investments
measured at fair value $ 401,453,770
(12) Commitments and Contingencies
The District is involved in various claims and legal actions that arose in previous years during the ordinary
course of business. In the opinion of management, the ultimate disposition of these matters will not have a
material adverse effect on the District’s statements of net position and statements of revenues, expenses,
and changes in net position.
Amounts received or receivable from grantor agencies are subject to audit and adjustment by such
agencies, principally the federal government. Any disallowed claims, including amounts already collected,
may constitute a liability of the applicable funds. The amount, if any, of expenditures which may be
disallowed by the grantor cannot be determined at this time although the District expects such amounts, if
any, to be immaterial.
At June 30, 2019, the total estimated remaining costs on the Parallel Thimble Shoal Tunnel Project are
$508,839,004.
CHESAPEAKE BAY BRIDGE AND TUNNEL DISTRICT
Notes to Basic Financial Statements
June 30, 2019 and 2018
52
(13) Subsequent Event
On August 13, 2019, the District issued First Tier General Resolution Revenue Bond Anticipation Notes,
Series 2019 (“Series 2019 BANs”) in the aggregate principal amount of $378,140,000. This issuance was
pursuant to its General Revenue Bond Resolution as adopted by the Commission on October 24, 2016 (the
“General Resolution”) and its Fourth Supplemental Resolution as adopted by the Commission on July 9,
2019 (the “Fourth Supplemental Resolution”). The Series 2019 BANs will mature on November 1, 2023.

REQUIRED SUPPLEMENTARY INFORMATION

53
CHESAPEAKE BAY BRIDGE AND TUNNEL DISTRICT
Schedule of Pension Contributions (Unaudited)
June 30, 2019
Contributions
Contributions as a
in relation to Employer’s percentage of
For the Contractually contractually Contribution covered covered
fiscal year required required deficiency employee employee
ended contribution contribution (excess) payroll payroll
June 30 (1) (2) (3) (4) (5)
2019 $ 954,678 954,678 — 8,162,058 11.7 %
2018 972,590 972,590 — 8,020,486 12.1
2017 950,993 950,993 — 7,786,589 12.2
2016 1,035,305 1,035,305 — 7,538,996 13.7
2015 1,024,089 1,024,089 — 7,378,844 13.9
See accompanying notes to required supplementary information.
Unaudited – See accompanying independent auditors’ report.
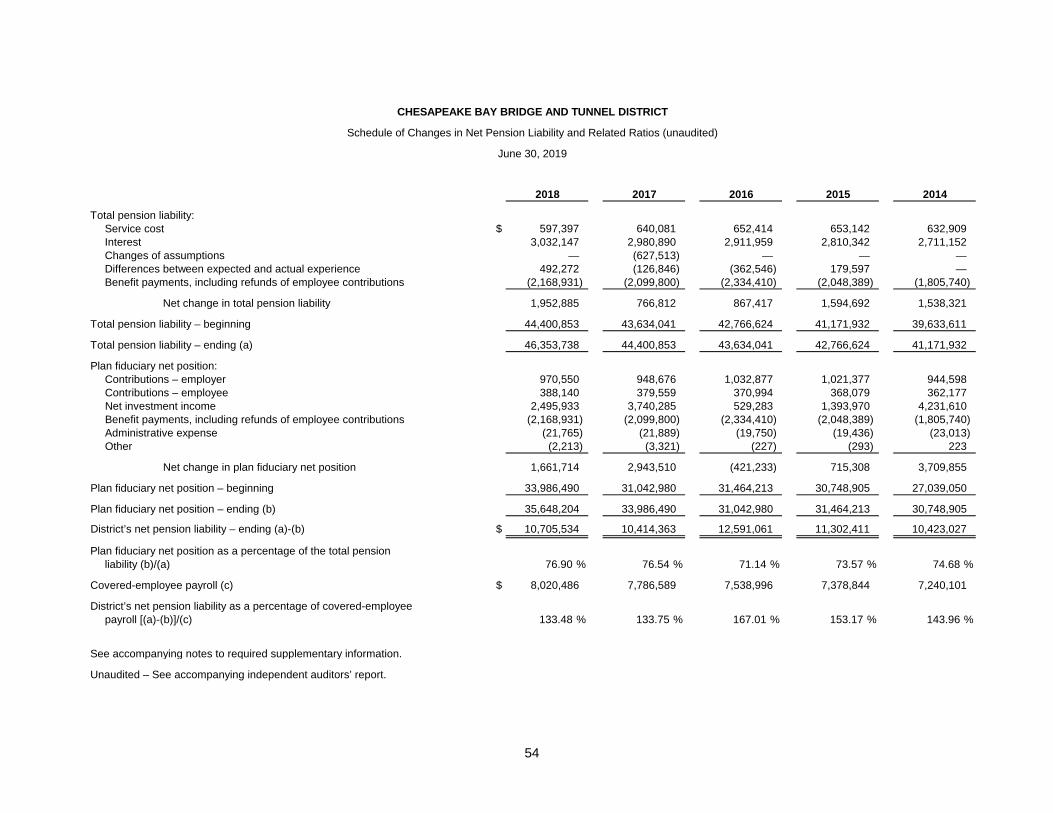
54
CHESAPEAKE BAY BRIDGE AND TUNNEL DISTRICT
Schedule of Changes in Net Pension Liability and Related Ratios (unaudited)
June 30, 2019
2018 2017 2016 2015 2014
Total pension liability:
Service cost $ 597,397 640,081 652,414 653,142 632,909
Interest 3,032,147 2,980,890 2,911,959 2,810,342 2,711,152
Changes of assumptions — (627,513) — — —
Differences between expected and actual experience 492,272 (126,846) (362,546) 179,597 —
Benefit payments, including refunds of employee contributions (2,168,931) (2,099,800) (2,334,410) (2,048,389) (1,805,740)
Net change in total pension liability 1,952,885 766,812 867,417 1,594,692 1,538,321
Total pension liability – beginning 44,400,853 43,634,041 42,766,624 41,171,932 39,633,611
Total pension liability – ending (a) 46,353,738 44,400,853 43,634,041 42,766,624 41,171,932
Plan fiduciary net position:
Contributions – employer 970,550 948,676 1,032,877 1,021,377 944,598
Contributions – employee 388,140 379,559 370,994 368,079 362,177
Net investment income 2,495,933 3,740,285 529,283 1,393,970 4,231,610
Benefit payments, including refunds of employee contributions (2,168,931) (2,099,800) (2,334,410) (2,048,389) (1,805,740)
Administrative expense (21,765) (21,889) (19,750) (19,436) (23,013)
Other (2,213) (3,321) (227) (293) 223
Net change in plan fiduciary net position 1,661,714 2,943,510 (421,233) 715,308 3,709,855
Plan fiduciary net position – beginning 33,986,490 31,042,980 31,464,213 30,748,905 27,039,050
Plan fiduciary net position – ending (b) 35,648,204 33,986,490 31,042,980 31,464,213 30,748,905
District’s net pension liability – ending (a)-(b) $ 10,705,534 10,414,363 12,591,061 11,302,411 10,423,027
Plan fiduciary net position as a percentage of the total pension
liability (b)/(a) 76.90 % 76.54 % 71.14 % 73.57 % 74.68 %
Covered-employee payroll (c) $ 8,020,486 7,786,589 7,538,996 7,378,844 7,240,101
District’s net pension liability as a percentage of covered-employee
payroll [(a)-(b)]/(c) 133.48 % 133.75 % 167.01 % 153.17 % 143.96 %
See accompanying notes to required supplementary information.
Unaudited – See accompanying independent auditors’ report.

55
CHESAPEAKE BAY BRIDGE AND TUNNEL DISTRICT
Schedule of the Changes in Net RHIP OPEB Liability and Related Ratios (Unaudited)
June 30, 2019
2018 2017
Total RHIP OPEB liability:
Service cost $ 104,240 132,336
Interest 178,574 146,368
Differences between expected and actual experience — 294,400
Changes in assumptions or other inputs — (454,232)
Benefit payments (235,555) (213,142)
Net change in total RHIP OPEB liability 47,259 (94,270)
Total RHIP OPEB liability – beginning 5,148,033 5,242,303
Total RHIP OPEB liability – ending (a) $ 5,195,292 5,148,033
Covered-employee payroll (b) $ 8,308,734 8,263,807
District’s total RHIP OPEB liability as a percentage of
covered-employee payroll ((a)/(b)) 62.53 % 62.30 %
See accompanying notes to required supplementary information.
Unaudited – See accompanying notes to basic financial statements.

56
CHESAPEAKE BAY BRIDGE AND TUNNEL DISTRICT
Schedule of GLI OPEB Contributions (Unaudited)
For the Year ended June 30, 2019
Contributions
in relation to Contributions
Contractually contractually Contribution Employer’s as a % of
required required deficiency covered covered
Year contribution contribution (excess) payroll payroll
2019 $ 42,443 42,443 — 8,162,058 0.52%
2018 41,820 41,820 — 8,042,257 0.52
2017 40,570 40,570 — 7,801,902 0.52
2016 40,028 36,252 3,776 7,552,374 0.48
2015 39,239 35,537 3,702 7,403,480 0.48
2014 38,372 34,752 3,620 7,240,101 0.48
2013 37,469 33,934 3,535 7,069,688 0.48
2012 30,190 19,212 10,978 6,861,518 0.28
2011 29,208 18,587 10,621 6,638,269 0.28
2010 23,751 13,322 10,429 6,597,474 0.20
Unaudited – See accompanying independent auditors’ report and notes to required supplementary information.

57
CHESAPEAKE BAY BRIDGE AND TUNNEL DISTRICT
Schedule of District's Share of GLI Net OPEB Liability (Unaudited)
For the Year ended June 30, 2019
2018 2017
District's Proportion of the Net GLI OPEB Liability 0.04229% 0.04230%
District's Proportionate Share of Net GLI OPEB Liability $ 643,000 637,000
Employer’s Covered Payroll 8,042,257 7,801,902
Employer’s Proportionate Share of the Net GLI OPEB Liability as a Percentage of its
Covered Payroll 8.00% 8.16%
Plan Fiduciary Net Position as a Percentage of the Total GLI OPEB Liability 51.22% 48.86%
See accompanying notes to required supplementary information.
Unaudited – See accompanying independent auditors’ report and notes to required supplementary information.
#

CHESAPEAKE BAY BRIDGE AND TUNNEL DISTRICT
Notes to Required Supplementary Information (Unaudited)
Year ended June 30, 2019
58
(1) Changes of Benefit Terms
There have been no actuarially material changes to the System benefit provisions since the prior actuarial
valuation.
(2) Changes of Assumptions
The following changes in pension and GLI OPEB actuarial assumptions were made effective June 30, 2016
based on the most recent experience study of the System for the four-year period ending June 30, 2016:
Updated to a more current mortality table – RP-2014
Lowered retirement rates at older ages and changed final retirement from 70 to 75
Adjusted withdrawal rates to better fit experience at each year age and service through 9 years of
service
Lowered disability rates for pension and OPEB general employees.
Increased line of duty disability from 14% to 15% for pension and OPEB general employees.
(3) Years Presented in Schedules
The Schedule of Changes in the District’s Net Pension Liability and Related Ratios and the Schedule of
Pension Contributions are required to be presented for the last ten fiscal years. However, the District has
only presented the required supplementary information for the last five years as fiscal year 2015 was the
first year of implementation of the requirement to provide such required supplementary information and
such information is not available for the prior years.
The Schedule of the Changes in Net RHIP OPEB Liability and Related Ratios and the Schedule of District’s
Share of Net GLI OPEB liability are required to be presented for the last ten fiscal years. However, the
District has only presented the required supplementary information for the last two years as fiscal year
2018 was the first year of implementation of the requirement to provide such required supplementary
information and such information is not available for the prior years.
Unaudited – See accompanying independent auditors’ report.

CHESAPEAKE BAY BRIDGE AND TUNNEL DISTRICT
Modified Approach for Infrastructure Reporting – Capital Asset Activity (Unaudited)
June 30, 2019
59 (Continued)
The following is a summary of the changes in capital assets for the year ended June 30, 2019:
Capital asset Capital Capital Capital Capital assetbalance, asset asset asset balance,
June 30, 2018 additions disposals depreciation June 30, 2019
Bridge and tunnel assets:Original bridges $ 8,474,789 — — — 8,474,789 Parallel crossing bridges 50,721,759 — — — 50,721,759 Original trestles 31,562,850 — — — 31,562,850 Parallel crossing trestles 117,324,020 — — — 117,324,020 Approach roads 11,269,645 — — — 11,269,645 Fisherman Island Causeway 8,722,510 — — — 8,722,510 Tunnels 60,182,509 — — — 60,182,509 Portal islands 52,695,162 — — — 52,695,162 Toll plaza infrastructure 6,069,397 — — — 6,069,397 Sitewide utilities 34,465,812 — — — 34,465,812
Total bridge andtunnel assets 381,488,453 — — — 381,488,453
Construction in progress – ParallelThimble Shoal Tunnel 247,703,256 61,697,243 — — 309,400,499
Capitalized interest and financeexpenses 52,822,375 13,625,163 — — 66,447,538
Miscellaneous capital assets:Land 5,232,907 — — — 5,232,907 Buildings 5,983,960 38,787 — — 6,022,747 Fleet vehicles and equipment 12,719,583 62,210 — — 12,781,793
Total miscellaneouscapital assets 23,936,450 100,997 — — 24,037,447
Less accumulated depreciation:Buildings (3,060,174) — — (167,321) (3,227,495) Fleet vehicles and equipment (10,389,326) — — (609,611) (10,998,937)
Total accumulateddepreciation (13,449,500) — — (776,932) (14,226,432)
Total capital assets,
net $ 692,501,034 75,423,403 — (776,932) 767,147,505
Unaudited – See accompanying independent auditors’ report.

CHESAPEAKE BAY BRIDGE AND TUNNEL DISTRICT
Modified Approach for Infrastructure Reporting – Capital Asset Activity (Unaudited)
June 30, 2019
60 (Continued)
The table below summarizes by asset clusters the budgeted preservation expenses to bridge and tunnel
assets for the last five fiscal years, as referenced in the Chesapeake Bay Bridge and Tunnel District’s
(the District) annually updated six-year reserve maintenance plan. The six-year reserve maintenance plan
is a planning tool that includes extraordinary maintenance projects to maintain the bridge and tunnel assets
at a condition level of “generally good” or better. Extraordinary maintenance projects include many
complex, multi-year contracts. The timing of actual project payments can vary from fiscal year to fiscal year
due to the complexity of the projects. Each fiscal year’s budgeted preservation expenses include the
budget for projects that actually commenced during that respective fiscal year.
2015 2016 2017 2018 2019
Bridge and tunnel assets:Original bridges $ 3,510 281,510 84,800 50,000 550,000Parallel crossing bridges 71,677 222,189 220,117 63,216 500,000Original trestles 717,892 5,221,721 3,034,282 1,486,283 3,336,982Parallel crossing trestles 352,269 89,536 303,172 878,713 3,615,025Approach roads 40,365 40,365 — — —Fisherman Island Causeway 15,795 15,795 — — —Tunnels 9,293,385 4,506,147 1,795,435 4,307,404 3,712,470Portal islands — 7,500 35,000 25,000 —Toll plaza infrastructure 43,000 250,000 778,050 204,047 82,080Sitewide utilities 8,847,255 134,500 51,500 240,000 499,258
$ 19,385,148 10,769,263 6,302,356 7,254,663 12,295,815
The table below summarizes by asset cluster the actual preservation expenses to bridge and tunnel assets
for the last five fiscal years:
2015 2016 2017 2018 2019
Bridge and tunnel assets:Original bridges $ 2,383 72,093 140,594 73,358 81,511 Parallel crossing bridges 52,135 87,622 — — 20,635 Original trestles 405,768 829,426 1,462,596 1,252,828 560,607 Parallel crossing trestles 138,911 47,609 290,020 384,886 432,334 Approach roads 27,399 — — — — Fisherman Island Causeway 10,721 — — — — Tunnels 4,324,085 3,970,261 592,744 527,581 3,316,363 Portal islands — 7,485 30,879 22,988 — Toll plaza infrastructure 20,138 202,325 511,806 55 88,216 Sitewide utilities 4,222,511 71,245 92,582 75,441 129,748
$ 9,204,051 5,288,066 3,121,221 2,337,137 4,629,414
Unaudited – See accompanying independent auditors’ report.

CHESAPEAKE BAY BRIDGE AND TUNNEL DISTRICT
Modified Approach for Infrastructure Reporting – Capital Asset Activity (Unaudited)
June 30, 2019
61 (Continued)
The budgeted preservation expenses for FY2020 are summarized by asset cluster in the table below.
During a given fiscal year, there may be no preservation expenses budgeted for one or more of the
classifications of bridge and tunnel assets. This is an indication that the District assesses that there is no
need for preservation work on this classification of bridge and tunnel assets to be able to maintain it at a
condition level of “generally good” or better.
Bridge and tunnel assets:
Original bridges $ 619,653
Parallel crossing bridges 647,000
Original trestles 6,258,897
Parallel crossing trestles 5,283,528
Approach roads —
Fisherman Island Causeway —
Tunnels 4,870,727
Portal islands —
Toll plaza infrastructure 125,395
Sitewide utilities 345,323
$ 18,150,523
U.S. GAAP requires that governmental entities that utilize the modified approach for infrastructure reporting
must have their governing board set a policy for the condition levels at which modified approach assets will
be maintained. GAAP also requires that a third party perform condition level assessments of the modified
approach assets annually and that the condition levels for the current and prior two fiscal years be
disclosed in the notes to the financial statements.
The Commission’s preservation policy is to maintain 90% of the bridge and tunnel assets at an MRP
condition level of “good” or better.
Unaudited – See accompanying independent auditors’ report.

CHESAPEAKE BAY BRIDGE AND TUNNEL DISTRICT
Modified Approach for Infrastructure Reporting – Capital Asset Activity (Unaudited)
June 30, 2019
62 (Continued)
Jacob’s Engineering, Inc., the District’s consulting engineer, has inspected the District’s bridge and tunnel
assets. Jacob’s Engineering, Inc. determines the MRP condition level for the bridge and tunnel assets as a
numeric scaled rating. The numeric scaled rating is based on a condition index utilized by the Virginia
Department of Transportation whereby 0 is a failed condition level and 9 is an excellent condition level. The
table below defines the numeric scaled ratings assigned by Jacob’s Engineering, Inc.:
MRP Numeric code scale
Numeric Narrative
code code Definition
9 Excellent Component has been recently put in service or remains in new condition
8 Very good No problems noted, potential exists for minor preventative maintenance
7 Good Potential exists for minor maintenance
6 Satisfactory Potential exists for major maintenance
5 Fair Potential exists for minor repair or rehabilitation
4 Poor Potential exists for major repair or rehabilitation
3 Serious Major repair or rehabilitation required immediately
2 Critical The need for repair or rehabilitation is urgent
1 Imminent failure Component is out of service; study feasibility for repair or rehabilitation
0 Failed Component is out of service and beyond repair, replacement required
The following two tables derive percentages in different ways. Trestles and bridges that have an MRP
numeric condition level are described as a percentage of lane miles. All other bridge and tunnel assets that
have an MRP numeric condition level are described as a percentage of that specific bridge and tunnel
asset.
The tunnels and portal islands are the only bridge and tunnel assets that falls below the condition level
specified in the Chesapeake Bay Bridge and Tunnel Commission’s preservation policy. The tunnels and
portal islands have an overall condition level of 7; however, Jacobs Engineering, Inc. assigned some
components of the portal islands and tunnels, which includes the ventilation buildings, a condition level of
6. Extraordinary reserve maintenance projects are planned to address the maintenance requirements for all
of these components.
The following tables detail the MRP condition level of bridge and tunnel assets for the last three years:
Percentage of lane miles at an MRP condition Level 7 or better
Bridge and tunnel assets 2019 2018 2017
Original bridges 100 % 100 % 100 %
Parallel crossing bridges 100 100 100
Original trestles 100 100 100
Parallel crossing trestles 100 100 100
Unaudited – See accompanying independent auditors’ report.

CHESAPEAKE BAY BRIDGE AND TUNNEL DISTRICT
Modified Approach for Infrastructure Reporting – Capital Asset Activity (Unaudited)
June 30, 2019
63
Percentage of capital assets at an MRP condition Level 7 or better
Bridge and tunnel assets 2019 2018 2017
Approach roads 100 % 100 % 100 %
Fisherman Island Causeway 100 100 100
Tunnels 88 87 77
Portal islands 84 90 90
Toll plaza infrastructure 96 96 100
Site-wide utilities 100 100 97
Unaudited – See accompanying independent auditors’ report.

OTHER SUPPLEMENTARY INFORMATION

CHESAPEAKE BAY BRIDGE AND TUNNEL DISTRICT
Budgetary Comparison Schedule (Unaudited)
Year ended June 30, 2019
64
Budgetary Accounting and Control
The Commission does not adopt a revenue budget.
Budgeted Actual Variance Percentage
amount amount over (under) variance
Operating expenses before district
facility expenses:
Administration $ 327,835 313,964 (13,871) (4.23)%
Finance 823,075 802,771 (20,304) (2.47)
Operations 4,570,227 4,567,818 (2,409) (0.05)
Maintenance and tunnel operations 4,057,435 3,752,541 (304,894) (7.51)
General 3,873,800 3,626,236 (247,564) (6.39)
Consultants 668,200 466,624 (201,576) (30.17)
Utilities 916,150 750,666 (165,484) (18.06)
Total operating expenses
before district facility
expenses $ 15,236,722 14,280,620 (956,102) (6.27)
The Chesapeake Bay Bridge and Tunnel Commission (the Commission) prepares a preliminary fiscal year
budget before April 20 for the ensuing fiscal year, which begins on July 1. This budget is required to be adopted
before June 1 of each year. The Commission covenants, in accordance with Section 504 of its General
Revenue Bond Resolution adopted October 24, 2016, that the expenses budgeted in any fiscal year will not
exceed the amounts that are reasonable and necessary to maintain, repair, and operate the facility in
accordance with the provisions of its enabling legislation. No provision is made in the budget for noncash items,
such as depreciation.
The District’s General Revenue Bond Resolution dated October 24, 2016 requires a ratio of 1.50x of net
revenues available for debt service to the principal and interest requirements for such fiscal year on account of
all First Tier Bonds then outstanding. This ratio is 6.71x for fiscal year 2019.
Unaudited – See accompanying independent auditors’ report.

65
CHESAPEAKE BAY BRIDGE AND TUNNEL DISTRICT
Schedule of Insurance Policies (Unaudited)
Year ended June 30, 2019
Amount of Expiration
Type Insurer/agent coverage date
Automobile liability and physical damage Virginia Municipal Liability Pool/Virginia
Municipal League Insurance Programs $ 1,000,000 June 30, 2019 *
Boiler and machinery Virginia Municipal Liability Pool/Virginia
Municipal League Insurance Programs 10,000,000 June 30, 2019 *
Bridge floater (bridges, tunnels, trestles, and loss of revenue) ACE American Insurance Company & XL
Insurance America/Aon Risk Solutions 225,000,000 March 31, 2020
Crime (theft, disappearance, and employee dishonesty) Virginia Municipal Liability Pool/Virginia
Municipal League Insurance Programs 700,000 June 30, 2019 *
General liability Virginia Municipal Liability Pool/Virginia
Municipal League Insurance Programs 1,000,000 June 30, 2019 *
Cyber liability Virginia Municipal Liability Pool/Virginia
Municipal League Insurance Programs 2,000,000 June 30, 2019 *
No fault property damage Virginia Municipal Liability Pool/Virginia
Municipal League Insurance Programs 10,000 June 30, 2019 *
Property direct damage Virginia Municipal Liability Pool/Virginia
Municipal League Insurance Programs 25,000 June 30, 2019 *
Excess liability Virginia Municipal Liability Pool/Virginia
Municipal League Insurance Programs 10,000,000 June 30, 2019 *
Wharfinger’s liability Atlantic Specialty Insurance/Brown &
Brown Flagship Group LTD 4,000,000 September 30, 2019
Workers’ compensation Virginia Municipal Liability Pool/Virginia
Municipal League Insurance Programs Statutory June 30, 2019 *
Line of Duty Act Virginia Municipal Liability Pool/Virginia
Municipal League Insurance Programs Statutory June 30, 2019 *
* The District has renewed these policies for fiscal year 2020.
See accompanying independent auditors’ report.

66
CHESAPEAKE BAY BRIDGE AND TUNNEL DISTRICT
Schedule of Comparative Traffic and Revenue Statistics (Unaudited)
Years ended June 30, 2019 and 2018
2019 2018 Increase (decrease)
Vehicles Revenue Vehicles Revenue Vehicles Revenue
Vehicle classifications:
Cars and light trucks 3,620,088 $ 46,785,077 3,583,197 $ 44,304,563 36,891 $ 2,480,514
Heavy trucks 369,131 13,618,650 366,378 12,856,449 2,753 762,201
Buses 12,478 375,923 13,187 384,643 (709) (8,720)
4,001,697 60,779,650 3,962,762 57,545,655 38,935 3,233,995
Nonrevenue 110,623 — 93,626 — 16,997 —
Deductions from toll revenues — (1,308,251) — (1,247,982) — (60,269)
4,112,320 $ 59,471,399 4,056,388 $ 56,297,673 55,932 $ 3,173,726
See accompanying independent auditors’ report.

67 (Continued)
CHESAPEAKE BAY BRIDGE AND TUNNEL DISTRICT
Schedule of Investments
June 30, 2019
Unrestricted investments at fair market value as of June 30, 2019 consist of the following:
Coupon Maturity Market
Description rate date value
Revenue Bond – Revenue Fund:
BB&T Trust Deposit Variable Not Fixed $ 4,458,116
4,458,116
General Revenue Bond – Operations &
Maintenance Reserve Fund:
US Treasury Notes 1.375% 12/15/19 3,887,660
BB&T Trust Deposit Variable Not Fixed 39,809
3,927,469
GR Reserve Maintenance Fund:
US Treasury Notes 0.750 07/15/19 2,098,809
Cooperative Rabobank Commercial Paper Variable 09/13/19 994,963
US Treasury Notes 1.250 10/31/19 2,243,320
US Treasury Notes 1.375 02/29/20 2,488,867
US Treasury Notes 3.500 05/15/20 3,003,106
BB&T Trust Deposit Variable Not Fixed 8,206,615
19,035,680
GR General Fund:
Federal Home Loan Mortgage Corp. Notes 0.875 07/19/19 919,256
Freddie Mac Global Notes 1.250 08/01/19 2,298,073
Federal Home Loan Bank 0.875 08/05/19 4,993,510
Freddie Mac Notes 1.375 08/15/19 1,962,905
MUFG Bank LTD/NY Commercial Paper Variable 08/26/19 5,478,644
Credit Agricole NY Commercial Paper Variable 08/26/19 5,479,694
US Treasury Notes 1.250 08/31/19 1,557,322
Cooperative Rabobank UA Commercial Paper Variable 09/13/19 5,472,297
US Treasury Notes 1.000 09/30/19 1,749,995
US Treasury Notes 1.750 09/30/19 1,957,932
Freddie Mac Global Notes 1.250 10/02/19 2,992,725
International Bank of Recon and Dev Global 1.875 10/07/19 1,673,804
Fannie Mae Global Notes 1.000 10/24/19 7,073,794
FNMA Benchmark Note 1.750 11/26/19 1,997,078
US Treasury Notes 1.500 11/30/19 5,017,033
US Treasury Notes 1.875 12/31/19 2,847,663
Freddie Mac Global Notes 1.500 01/17/20 1,843,442

68 (Continued)
CHESAPEAKE BAY BRIDGE AND TUNNEL DISTRICT
Schedule of Investments
June 30, 2019
Unrestricted investments at fair market value as of June 30, 2019 consist of the following:
Coupon Maturity Market
Description rate date value
General Resolution General Fund (Continued):
Freddie Mac Agency Notes 1.500% 01/17/20 $ 4,982,275
IBM Corporation Notes 1.900 01/27/20 3,642,685
US Treasury Notes 1.250 01/31/20 2,622,031
Microsoft Corp. 1.850 02/06/20 908,050
Federal Home Loan Bank Notes 2.125 02/11/20 3,211,332
Nordea Bank CD 2.720 02/20/20 2,699,665
Federal National Mortgage Assn. 1.500 02/28/20 7,570,793
US Treasury Notes 1.250 02/29/20 1,477,228
Toyota Motor Credit Corp. 1.950 04/17/20 1,018,042
Federal Home Loan Mortgage Corp. Notes 1.375 04/20/20 1,984,869
Federal Home Loan Mortgage Corp. Notes 1.375 04/20/20 8,954,298
Federal Home Loan Mortgage Corp. Notes 1.375 04/20/20 2,188,828
Federal Home Loan Mortgage Corp. Notes 1.375 04/20/20 4,342,835
Federal Home Loan Mortgage Corp. Notes 1.375 04/20/20 2,984,766
Federal Home Loan Mortgage Corp. Notes 1.375 04/20/20 1,562,028
FNMA Notes 1.500 07/30/20 3,731,280
US Treasury Notes 1.625 07/31/20 2,028,244
International Bank of Recon & Dev Global 1.561 09/12/20 3,338,134
Federal Home Loan Bank Notes 1.375 09/28/20 2,309,646
Federal Home Loan Bank Notes 2.625 10/01/20 776,601
HSBC Bank Certificate of Deposit 2.700 10/02/20 2,923,048
Proctor & Gamble Co. Corp. Notes 1.900 10/23/20 729,647
Swedbank New York CD 2.270 11/16/20 2,647,173
Johnson & Johnson Corp. Notes 1.950 11/10/20 755,652
Federal Home Loan Mortgage Corp. Notes 1.875 11/17/20 2,044,356
Walmart Stores Inc. Corp. Notes 1.900 12/15/20 3,393,893
Asian Development Bank Note 2.250 01/20/21 1,737,643
Freddie Mac Notes 2.375 02/16/21 2,476,258
Freddie Mac Notes 2.375 02/16/21 3,025,977
Berkshire Hathaway Inc. 2.200 03/15/21 2,531,994
African Development Bank Note 2.625 03/22/21 1,310,844
Toyota Motor Credit Corp. Notes 2.950 04/13/21 2,118,764
Federal Home Loan Mortgage Corp. Notes 6.000 06/01/21 32,283
US Treasury Notes 2.125 06/30/21 17,129,246
International Bank of Recon & Dev Global 2.750 07/23/21 2,683,700
US Treasury Notes 2.000 10/31/21 2,852,166
Federal National Mortgage Assn. 5.500 11/01/21 18,570

69 (Continued)
CHESAPEAKE BAY BRIDGE AND TUNNEL DISTRICT
Schedule of Investments
June 30, 2019
Unrestricted investments at fair market value as of June 30, 2019 consist of the following:
Coupon Maturity Market
Description rate date value
Federal Home Loan Bank Notes 2.625 10/12/21 $ 1,729,882
US Treasury Notes 2.875 11/15/21 5,029,007
Fannie Mae Notes 2.625 01/11/22 1,954,769
Fannie Mae Notes 2.625 01/11/22 2,112,988
US Treasury Notes 2.500 01/15/22 2,409,713
Federal Home Loan Mortgage Corp. Notes 5.500 02/01/22 48,270
Apple Inc. Bonds 2.500 02/09/22 2,980,390
US Treasury Notes 2.500 02/15/22 5,455,117
Fannie Mae Notes 1.875 04/05/22 4,858,691
Federal Home Loan Bank Notes 2.700 04/29/22 1,166,955
US Treasury Notes 1.875 04/30/22 2,831,345
US Treasury Notes 1.875 04/30/22 3,714,885
Federal Home Loan Bank Notes 2.650 05/23/22 3,000,867
US Treasury Notes 1.750 05/31/22 2,416,603
Fannie Mae Pool 3.000 06/01/22 202,804
Federal Home Loan Mortgage Corp. Notes 6.000 07/01/22 29,151
GNMA Pool #5276 3.000 01/01/27 424,445
GNMA Pool #794283 3.500 03/01/27 255,114
GNMA Pool #MA0007 3.000 04/01/27 714,453
Fannie Mae Pool #1084 3.500 06/01/32 820,804
BB&T Trust Deposit Variable Not Fixed 528,640
208,744,904
Total unrestricted investments $ 236,166,169

70
CHESAPEAKE BAY BRIDGE AND TUNNEL DISTRICT
Schedule of Investments
June 30, 2019
Restricted investments at fair market value as of June 30, 2019 consist of the following:
Coupon Maturity Market
Description rate date value
General Revenue Bond – TIFIA Debt Service
Reserve Fund:
US Treasury Notes 1.125% 12/31/19 $ 11,529,780
FNMA Benchmark Notes 1.875 12/18/20 11,358,228
BB&T Trust Deposit Variable Not Fixed 232,863
23,120,871
General Revenue Bond – VTIB Debt Service
Reserve Fund:
US Treasury Notes 1.125 12/31/19 1,706,693
FNMA Benchmark Notes 1.875 12/28/20 1,679,738
BB&T Trust Deposit Variable Not Fixed 38,916
3,425,347
General Revenue Bond – Series 2016
Interest Fund:
BB&T Trust Deposit Variable Not Fixed 7,573,021
7,573,021
2016 Thimble Shoal Project Fund:
Local Government Investment Pool Variable Not Fixed 75,799,515
BB&T Trust Deposit Variable Not Fixed 11,100
75,810,615
2016 Thimble Shoal Project Fund – TIFIA:
US Treasury Notes 1.875 12/31/19 9,122,513
BB&T Trust Deposit Variable Not Fixed 8,223
9,130,736
2016 Thimble Shoal Project Fund – VTIB:
US Treasury Notes 1.875 12/31/19 1,343,897
BB&T Trust Deposit Variable Not Fixed 4,724
1,348,621
2016 Capitalized Interest Fund:
US Treasury Notes 1.625 12/31/19 3,825,861
US Treasury Notes 1.625 06/30/20 3,852,319
US Treasury Notes — 12/31/20 3,894,821
US Treasury Notes 1.125 06/30/21 4,839,897
BB&T Trust Deposit Variable Not Fixed 192,755
16,605,653
Total restricted investments $ 137,014,864
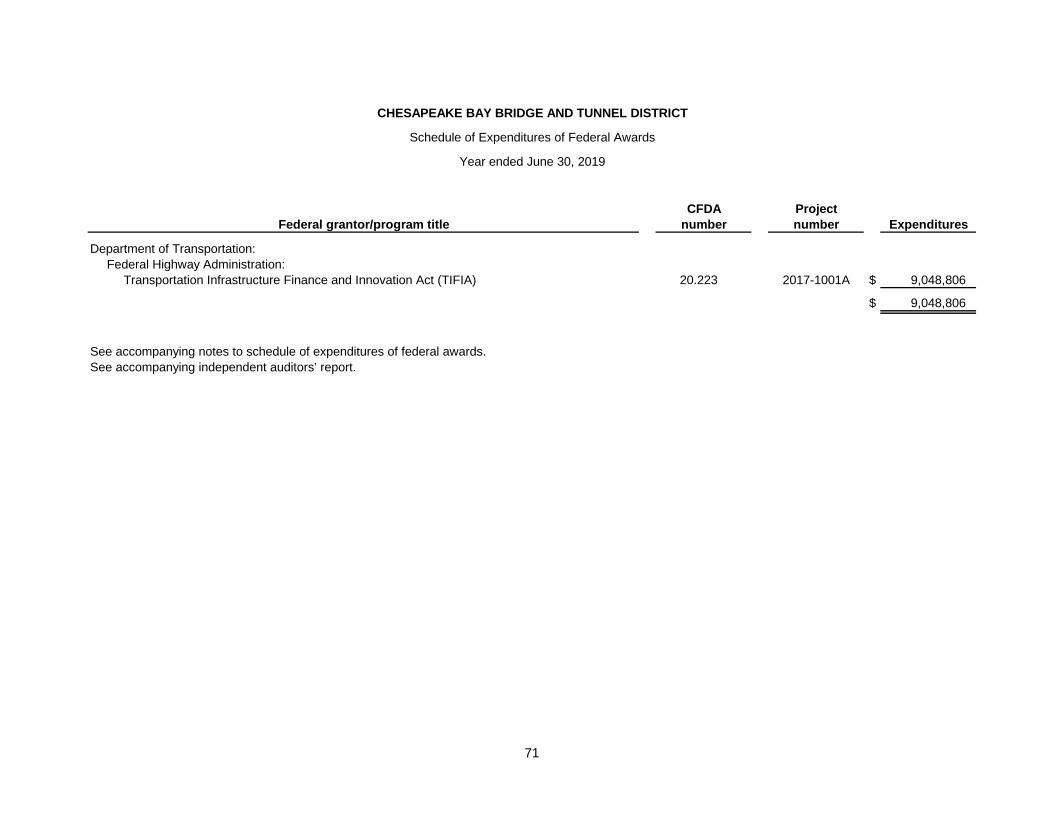
71
CHESAPEAKE BAY BRIDGE AND TUNNEL DISTRICT
Schedule of Expenditures of Federal Awards
Year ended June 30, 2019
CFDA Project
Federal grantor/program title number number Expenditures
Department of Transportation:
Federal Highway Administration:
Transportation Infrastructure Finance and Innovation Act (TIFIA) 20.223 2017-1001A $ 9,048,806
$ 9,048,806
See accompanying notes to schedule of expenditures of federal awards.
See accompanying independent auditors’ report.
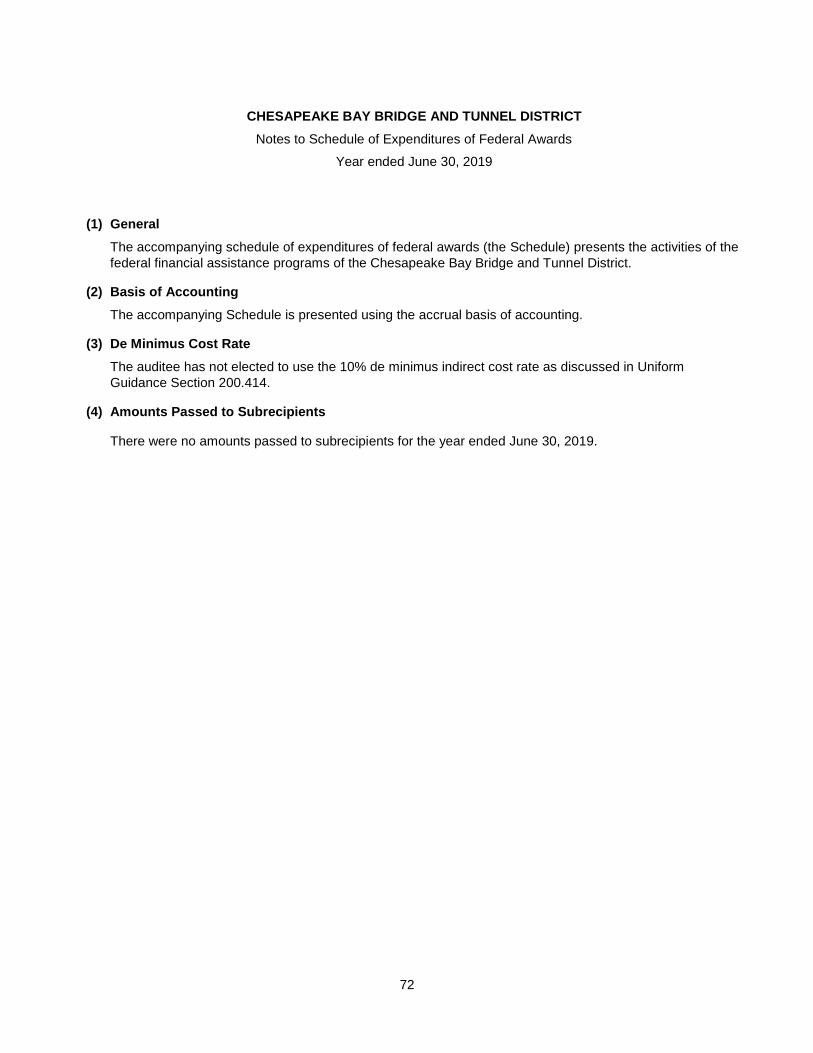
CHESAPEAKE BAY BRIDGE AND TUNNEL DISTRICT
Notes to Schedule of Expenditures of Federal Awards
Year ended June 30, 2019
72
(1) General
The accompanying schedule of expenditures of federal awards (the Schedule) presents the activities of the
federal financial assistance programs of the Chesapeake Bay Bridge and Tunnel District.
(2) Basis of Accounting
The accompanying Schedule is presented using the accrual basis of accounting.
(3) De Minimus Cost Rate
The auditee has not elected to use the 10% de minimus indirect cost rate as discussed in Uniform
Guidance Section 200.414.
(4) Amounts Passed to Subrecipients
There were no amounts passed to subrecipients for the year ended June 30, 2019.

KPMG LLP is a Delaware limited liability partnership and the U.S. member firm of the KPMG network of independent member firms affiliated with KPMG International Cooperative (“KPMG International”), a Swiss entity.
KPMG LLPSuite 1900440 Monticello AvenueNorfolk, VA 23510
73
Independent Auditors’ Report on Internal Control over Financial Reporting and on Compliance
and Other Matters Based on an Audit of Financial Statements Performed in Accordance
with Government Auditing Standards
The Chairman and Members
Chesapeake Bay Bridge and Tunnel Commission:
We have audited, in accordance with the auditing standards generally accepted in the United States of America
and the standards applicable to financial audits contained in Government Auditing Standards, issued by the
Comptroller General of the United States, the financial statements of Chesapeake Bay Bridge and Tunnel
District (the District), which comprise the statement of net position as of June 30, 2019, and the related
statements of revenues, expenses, and changes in net position, and cash flows for the year then ended, and
the related notes to the financial statements, and have issued our report thereon dated October 28, 2019.
Internal Control over Financial Reporting
In planning and performing our audit of the financial statements, we considered the District’s internal control
over financial reporting (internal control) to determine the audit procedures that are appropriate in the
circumstances for the purpose of expressing our opinion on the financial statements, but not for the purpose of
expressing an opinion on the effectiveness of the District’s internal control. Accordingly, we do not express an
opinion on the effectiveness of the District’s internal control.
A deficiency in internal control exists when the design or operation of a control does not allow management or
employees, in the normal course of performing their assigned functions, to prevent, or detect and correct,
misstatements on a timely basis. A material weakness is a deficiency, or a combination of deficiencies, in
internal control, such that there is a reasonable possibility that a material misstatement of the District’s financial
statements will not be prevented, or detected and corrected on a timely basis. A significant deficiency is a
deficiency, or a combination of deficiencies, in internal control that is less severe than a material weakness, yet
important enough to merit attention by those charged with governance.
Our consideration of internal control was for the limited purpose described in the first paragraph of this section
and was not designed to identify all deficiencies in internal control that might be material weaknesses or
significant deficiencies. Given these limitations, during our audit we did not identify any deficiencies in internal
control that we consider to be material weaknesses. However, material weaknesses may exist that have not
been identified.
Compliance and Other Matters
As part of obtaining reasonable assurance about whether the District’s financial statements are free from
material misstatement, we performed tests of its compliance with certain provisions of laws, regulations,
contracts, and grant agreements, noncompliance with which could have a direct and material effect on the
determination of financial statement amounts. However, providing an opinion on compliance with those
provisions was not an objective of our audit, and accordingly, we do not express such an opinion. The results of
our tests disclosed no instances of noncompliance or other matters that are required to be reported under
Government Auditing Standards.

74
Purpose of this Report
The purpose of this report is solely to describe the scope of our testing of internal control and compliance and
the results of that testing, and not to provide an opinion on the effectiveness of the District’s internal control or
on compliance. This report is an integral part of an audit performed in accordance with Government Auditing
Standards in considering the District’s internal control and compliance. Accordingly, this communication is not
suitable for any other purpose.
Norfolk, Virginia
October 28, 2019
KPMG LLP is a Delaware limited liability partnership and the U.S. member firm of the KPMG network of independent member firms affiliated with KPMG International Cooperative (“KPMG International”), a Swiss entity.
KPMG LLPSuite 1900440 Monticello AvenueNorfolk, VA 23510
75
Independent Auditors’ Report on Compliance for the Major Federal Program; Report on Internal Control
Over Compliance; and Report on Schedule of Expenditures of Federal Awards Required by the Uniform
Guidance
The Board of Commissioners
Chesapeake Bay Bridge and Tunnel District:
Report on Compliance for the Major Federal Program
We have audited the Chesapeake Bay Bridge and Tunnel District’s (the District) compliance with the types of
compliance requirements described in the OMB Compliance Supplement that could have a direct and material
effect on the District’s major federal program for the year ended June 30, 2019. The District’s major federal
program is identified in the summary of auditors’ results section of the accompanying schedule of findings and
questioned costs.
Management’s Responsibility
Management is responsible for compliance with federal statutes, regulations, and the terms and conditions of
its federal awards applicable to its federal program.
Auditors’ Responsibility
Our responsibility is to express an opinion on compliance for the District’s major federal program based on our
audit of the types of compliance requirements referred to above. We conducted our audit of compliance in
accordance with auditing standards generally accepted in the United States of America; the standards
applicable to financial audits contained in Government Auditing Standards, issued by the Comptroller General
of the United States; and the audit requirements of Title 2 U.S. Code of Federal Regulations Part 200, Uniform
Administrative Requirements, Cost Principles, and Audit Requirements for Federal Awards (Uniform Guidance).
Those standards and the Uniform Guidance require that we plan and perform the audit to obtain reasonable
assurance about whether noncompliance with the types of compliance requirements referred to above that
could have a direct and material effect on a major federal program occurred. An audit includes examining, on a
test basis, evidence about the District’s compliance with those requirements and performing such other
procedures as we considered necessary in the circumstances.
We believe that our audit provides a reasonable basis for our opinion on compliance for the major federal
program. However, our audit does not provide a legal determination of the District’s compliance.
Opinion on the Major Federal Program
In our opinion, the District complied, in all material respects, with the types of compliance requirements referred
to above that could have a direct and material effect on its major federal program for the year ended June 30,
2019.
Report on Internal Control Over Compliance
Management of the District is responsible for establishing and maintaining effective internal control over
compliance with the types of compliance requirements referred to above. In planning and performing our audit
of compliance, we considered the District’s internal control over compliance with the types of requirements that
could have a direct and material effect on the major federal program to determine the auditing procedures that
are appropriate in the circumstances for the purpose of expressing an opinion on compliance the major federal

76
program and to test and report on internal control over compliance in accordance with the Uniform Guidance,
but not for the purpose of expressing an opinion on the effectiveness of internal control over compliance.
Accordingly, we do not express an opinion on the effectiveness of the District’s internal control over
compliance.
A deficiency in internal control over compliance exists when the design or operation of a control over
compliance does not allow management or employees, in the normal course of performing their assigned
functions, to prevent, or detect and correct, noncompliance with a type of compliance requirement of a federal
program on a timely basis. A material weakness in internal control over compliance is a deficiency, or a
combination of deficiencies, in internal control over compliance, such that there is a reasonable possibility that
material noncompliance with a type of compliance requirement of a federal program will not be prevented, or
detected and corrected, on a timely basis. A significant deficiency in internal control over compliance is a
deficiency, or a combination of deficiencies, in internal control over compliance with a type of compliance
requirement of a federal program that is less severe than a material weakness in internal control over
compliance, yet important enough to merit attention by those charged with governance.
Our consideration of internal control over compliance was for the limited purpose described in the first
paragraph of this section and was not designed to identify all deficiencies in internal control over compliance
that might be material weaknesses or significant deficiencies. We did not identify any deficiencies in internal
control over compliance that we consider to be material weaknesses. However, material weaknesses may exist
that have not been identified.
The purpose of this report on internal control over compliance is solely to describe the scope of our testing of
internal control over compliance and the results of that testing based on the requirements of the Uniform
Guidance. Accordingly, this report is not suitable for any other purpose.
Report on Schedule of Expenditures of Federal Awards Required by the Uniform Guidance
We have audited the financial statements of the District as of and for the year ended June 30, 2019, and have
issued our report thereon dated October 28, 2019, which contained an unmodified opinion on those financial
statements. Our audit was conducted for the purpose of forming an opinion on the financial statements as a
whole. The accompanying schedule of expenditures of federal awards is presented for purposes of additional
analysis as required by the Uniform Guidance and is not a required part of the financial statements. Such
information is the responsibility of management and was derived from and relates directly to the underlying
accounting and other records used to prepare the financial statements. The information has been subjected to
the auditing procedures applied in the audit of the financial statements and certain additional procedures,
including comparing and reconciling such information directly to the underlying accounting and other records
used to prepare the financial statements or to the financial statements themselves, and other additional
procedures in accordance with auditing standards generally accepted in the United States of America. In our
opinion, the schedule of expenditures of federal awards is fairly stated in all material respects in relation to the
financial statements as a whole
Norfolk, Virginia
October 28, 2019
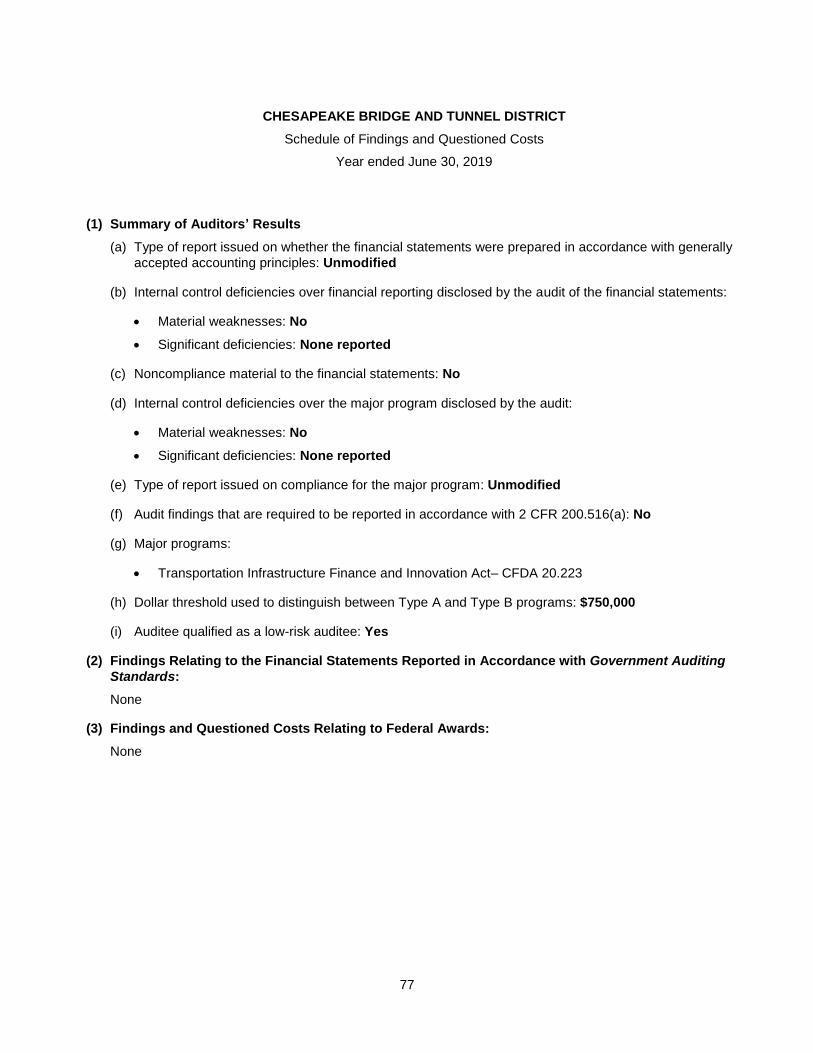
CHESAPEAKE BRIDGE AND TUNNEL DISTRICT
Schedule of Findings and Questioned Costs
Year ended June 30, 2019
77
(1) Summary of Auditors’ Results
(a) Type of report issued on whether the financial statements were prepared in accordance with generally
accepted accounting principles: Unmodified
(b) Internal control deficiencies over financial reporting disclosed by the audit of the financial statements:
Material weaknesses: No
Significant deficiencies: None reported
(c) Noncompliance material to the financial statements: No
(d) Internal control deficiencies over the major program disclosed by the audit:
Material weaknesses: No
Significant deficiencies: None reported
(e) Type of report issued on compliance for the major program: Unmodified
(f) Audit findings that are required to be reported in accordance with 2 CFR 200.516(a): No
(g) Major programs:
Transportation Infrastructure Finance and Innovation Act– CFDA 20.223
(h) Dollar threshold used to distinguish between Type A and Type B programs: $750,000
(i) Auditee qualified as a low-risk auditee: Yes
(2) Findings Relating to the Financial Statements Reported in Accordance with Government Auditing
Standards:
None
(3) Findings and Questioned Costs Relating to Federal Awards:
None