chesapeake bay 2006 early summer rain event: impact … · chesapeake bay region (figure 2). rain...
TRANSCRIPT

days, from Virginia into the New England states. The system traveled directly up the Chesapeake Bay watershed, causing flooding in many areas. Due to this five-day rain event, June 2006 became one of the wettest Junes on record (1895–2006) for the mid-Atlantic. A stream gauge at Conowingo Dam, at the mouth of the Susquehanna River, recorded the discharge for the entire event (Figure 1). In comparison to Hurricane Agnes, which hit the area in June 1972, this storm only produced about one-third of the amount of discharge (Table 1). Luckily, due to the dry spring conditions, the land was able to absorb the impact of the flooding better than during Hurricane Agnes. The impact to Chesapeake Bay and its tributaries included sediment and nutrient runoff, toxic contaminant runoff, standing water and damage to property. Sediment runoff could be seen in every tributary and within the mainstem. In the following pages, we describe the short-term water quality effects and aquatic grass response that scientists have been monitoring since late June.
EARLY SUMMER RAIN EVENT: IMPACT ON THE BAYThis newsletter describes some of the monitoring data and the response from the Chesapeake Bay community to the high rainfall event that moved through the Bay watershed from June 24 to June 28, 2006. In some areas of the watershed, up to 15 inches of rain fell and much of the area received 5 inches or more. The Chesapeake Bay Program quickly organized an effort to monitor and analyze dissolved oxygen, turbidity, chlorophyll a and aquatic grass in the Bay.
SECOND WETTEST JUNE ON RECORD
CHESAPEAKE BAY 2006
Produced by the Chesapeake Bay Program’s Tidal Monitoring and Analysis Workgroup
A wet winter followed by a dry spring in the Chesapeake Bay area (Figure 1), led the Chesapeake Bay Program to forecast typical summer conditions for dissolved oxygen, aquatic grass and harmful algal blooms (www.chesapeakebay.net/bayspringforecast2006.htm). However, in the third week of June, tropical storm Alberto passed over North Carolina and became a low tropical pressure off the coast of the mid-Atlantic. At the same time, the jet stream stalled west of the Appalachian Mountains and a warm, dry air system formed over the North Atlantic. This combination created heavy rain in the Chesapeake Bay region (Figure 2). Rain from this early summer system fell for approximately five
Sediment clouded the water from the Susquehanna River to below the Chesapeake Bay Bridge on July 8, 2006, 10 days after the rain event.
River system
Maximum mean-daily discharge(ft3 s-1)
Hurricane Agnes June 1972
Rain eventJune 2006
Susquehanna
Potomac
James
1,120,000
296,000
334,000
73,400
76,700
403,000
25%
23%
36%
% size of Agnes
Figure 1: Comparison of average flow in 2006 to 37-year average flow at Conowingo Dam, at the mouth of the Susquehanna River (Data source: www.waterdata.usgs.gov).
J. Th
omas
, UM
CES
Figure 2: Five inches or more of rain fell on the watershed during the rain event.
Table 1: Comparison of discharge from Hurricane Agnes with early summer rain event (Data source: J. Raffensperger, USGS).
20
15
10
8.0
6.0
5.0
4.0
3.0
2.0
1.5
1.0
0.50
0.25
0.10
0.01
Rainfall totals for June 21 to 28(inches)
ww
w.n
ws.n
oaa.
gov
Above average
050,000
100,000150,000200,000250,000300,000350,000400,000450,000
Flow
(cub
ic fe
et p
er s
econ
d)
2006 daily mean flow37-year daily mean flow
1/1/062/1/06
3/1/064/1/06
5/1/066/1/06
7/1/068/1/06
Date
Below average
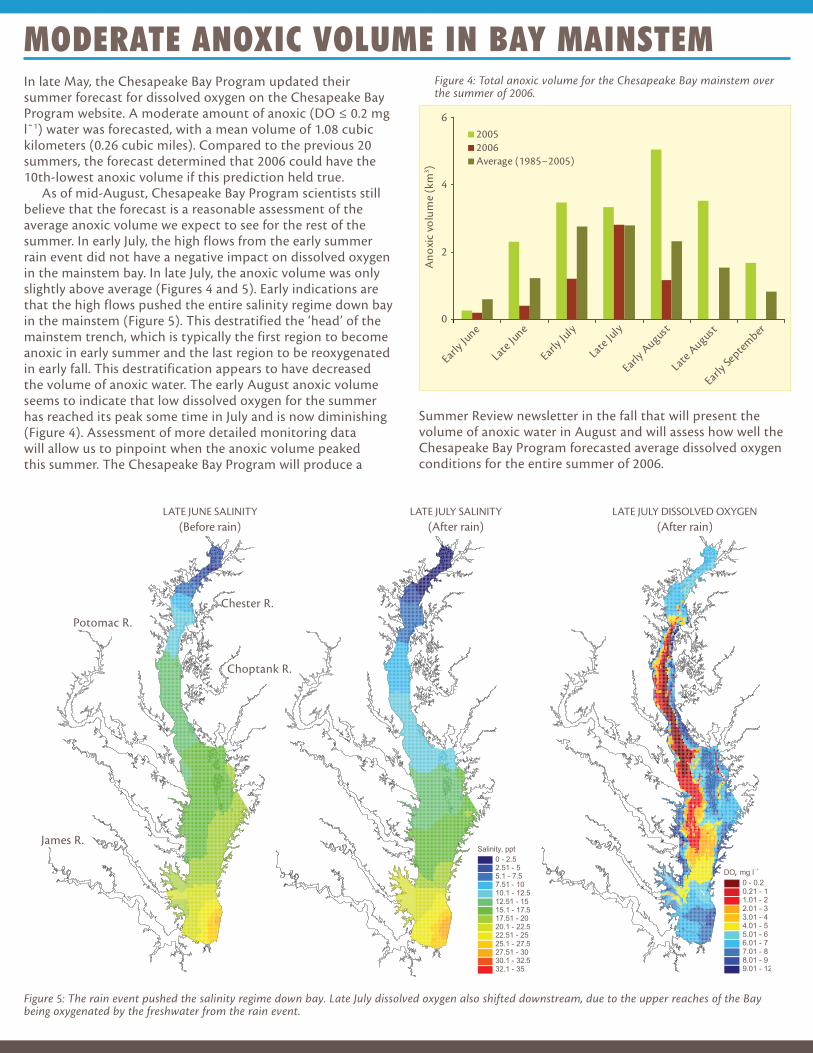
In late May, the Chesapeake Bay Program updated their summer forecast for dissolved oxygen on the Chesapeake Bay Program website. A moderate amount of anoxic (DO ≤ 0.2 mg lˉ1) water was forecasted, with a mean volume of 1.08 cubic kilometers (0.26 cubic miles). Compared to the previous 20 summers, the forecast determined that 2006 could have the 10th-lowest anoxic volume if this prediction held true.
As of mid-August, Chesapeake Bay Program scientists still believe that the forecast is a reasonable assessment of the average anoxic volume we expect to see for the rest of the summer. In early July, the high flows from the early summer rain event did not have a negative impact on dissolved oxygen in the mainstem bay. In late July, the anoxic volume was only slightly above average (Figures 4 and 5). Early indications are that the high flows pushed the entire salinity regime down bay in the mainstem (Figure 5). This destratified the ‘head’ of the mainstem trench, which is typically the first region to become anoxic in early summer and the last region to be reoxygenated in early fall. This destratification appears to have decreased the volume of anoxic water. The early August anoxic volume seems to indicate that low dissolved oxygen for the summer has reached its peak some time in July and is now diminishing (Figure 4). Assessment of more detailed monitoring data will allow us to pinpoint when the anoxic volume peaked this summer. The Chesapeake Bay Program will produce a
MODERATE ANOXIC VOLUME IN BAY MAINSTEM Figure 4: Total anoxic volume for the Chesapeake Bay mainstem over the summer of 2006.
0
2
4
6
Early J
une
Late Ju
ne
Early J
uly
Late Ju
ly
Early A
ugust
Late A
ugust
Early S
eptember
Ano
xic
volu
me
(km
3 )
20052006Average (1985−2005)
Figure 5: The rain event pushed the salinity regime down bay. Late July dissolved oxygen also shifted downstream, due to the upper reaches of the Bay being oxygenated by the freshwater from the rain event.
LATE JUNE SALINITY(Before rain)
LATE JULY SALINITY (After rain)
LATE JULY DISSOLVED OXYGEN (After rain)
Potomac R.
James R.
Chester R.
Choptank R.
, ¯¹
Summer Review newsletter in the fall that will present the volume of anoxic water in August and will assess how well the Chesapeake Bay Program forecasted average dissolved oxygen conditions for the entire summer of 2006.

RAIN EVENT
0
2
4
6
8
10
12
14
Dis
solv
ed O
xyge
n (m
g/l)
6/176/19
6/216/23
6/256/27
6/297/01
7/037/05
7/077/09
7/11
Date6/17
6/196/21
6/236/25
6/276/29
7/017/03
7/057/07
7/097/11
Turb
idit
y (N
TU)
Date
0
100
200
300
400
500
600
700
RAIN EVENT
Chl
orop
hyll
(ug/
l)
6/176/19
6/216/23
6/256/27
6/297/01
7/037/05
7/077/09
7/11
Date
0
10
20
30
40
RAIN EVENT
IMPROVED CAPABILITY TO CAPTURE STORM EVENTSRecent technological advances provide greater capability to capture storm events by providing real time images of the earth’s surface. The following images and data visually describe the early summer rain event in the Chesapeake Bay watershed. With remote sensing products, such as publicly-available satellite images, the before and after of the storm was captured (Figure 6). Combining these satellite images with approximately 50 continuous monitoring stations in Maryland and approximately 16 in Virginia allows scientists to compare and contrast the impact of meteorological events on
TURBIDITY
With low amounts of rainfall in the spring, the tributaries and mainstem were mostly clear before the rain event.
Sediment runoff can be seen in every subwatershed of the Chesapeake Bay system. The turbidity was especially strong in the Susquehanna, Potomac and James Rivers. Notice that Delaware Bay also received considerable runoff.
Two weeks after the high turbidity seen in the previous image, the Bay is mostly clear again. The turbidity from the Susquehanna and Potomac Rivers can still be seen in the upper reaches of the systems.
MO
DIS
Aqu
a Ra
pid
Resp
onse
Pro
ject
at
NA
SA/G
SFC
Figure 7: Maryland Department of Natural Resources’ continuous monitor at Otter Point Creek, located in the upper Bush River in Harford County, MD, shows the impacts of the rain. Location of monitoring station shown on left satellite image.
regional and local scales (Figure 7). Continuous monitoring allows for data acquisition at all times of the day, every day of the week, even during severe weather conditions. Additionally, in situ monitors can take more measurements than a person in a given time period, providing a more detailed description of environmental conditions. For continuous monitoring information and up-to-date satellite images of Chesapeake Bay, go to Maryland Department of Natural Resources’ website Eyes on the Bay (www.eyesonthebay.net).
Figure 6: Images from NASA’s MODIS Aqua satellite shows the regional impact of the early summer rain event.
Potomac R.
James R.
Mouth of Susquehanna R.
Delaware Bay
5 days before 4 days after 19 days after
Otter Point Creek
continuous monitoring
station
Remote sensing
Continuous monitoring — Otter Point Creek, Bush River
CHLOROPHYLL A DISSOLVED OXYGEN
Chlorophyll a levels decreased due to low light availability for photosynthesis during the rain event, but then spiked afterward ( ) due to nutrient additions.
Turbidity rose to high levels for about a week as a result of the extreme runoff from the watershed, then again ( ) as a result of the chlorophyll a spike.
Dissolved oxygen decreased during and after the rain event and again ( ) after the chlorophyll a spike, both a result of algal respiration and decay.

Newsletter produced by the Chesapeake Bay Program’s Tidal Monitoring and Analysis Workgroup. Comparison between Hurricane Agnes and early summer rain event provided by Jeff Raffensperger. Susquehanna River flow data provided by USGS with specific help from David Jasinski (UMCES). Dissolved oxygen data provided by David Jasinski (UMCES). Satellite images and water quality graphs provided by Mark Trice (MDDNR). Aquatic grass field observations provided by Mike Naylor (MDDNR) and Robert Orth (VIMS).
Based on the continuous monitoring gauges and surveys performed by Chesapeake Bay Program scientists, it appears that the Chesapeake Bay is resilient enough that no short-term (two months) negative effects can be seen from this rain event in the parameters that were investigated. Scientists will continue to monitor water quality, aquatic grass and fish populations to determine if any longer-term effects from this rain event will become apparent. While the rain event signal can be seen in the increase in volume of anoxic waters throughout July, the dry spring conditions may have buffered this response. Additionally, turbidity from the storm quickly returned to normal, minimally impacting aquatic grasses in
the upper Bay and not impacting aquatic grass in the middle Bay. The rainfall event did not affect the lower Bay aquatic grass, rather they are contending with high mid-summer temperatures. What will this rainfall event mean for the overall dissolved oxygen conditions in the mainstem, harmful algal blooms in the Potomac River and aquatic grasses? As scientists monitor the tributaries and mainstem of the Bay, the Summer Review newsletter (coming this fall) should help us to determine what, if any, longer-term effect the rain event had on the water quality and the living resources of Chesapeake Bay. Read our 2006 Forecast newsletter for the original forecast (www.chesapeakebay.net/bayforecastspring2006.htm).
WHAT WE EXPECT IN THE FUTURE
Ben ColeRenee KarrhBruce MichaelRebecca RavesWilliam D RomanMark TricePeter Tango
Bill Dennison - CoordinatorEva BaileyDavid JasinskiBen LongstaffCaroline WicksMichael Williams
Michael KoterbaJuarte LandwehrMary Ellen LeyJeff Raffensperger
Rick HoffmanJamie Bosiljevac Joe Beaman
Peter Bergstrom Carlton HaywoodClaire Buchanan
Daniel M. DauerRoberto Llanso
Ken MooreBob Orth
Rich Lacouture
Newsletter prepared by: • Caroline Wicks and Ben Longstaff, EcoCheck (NOAA-UMCES Partnership)• Bill Dennison, University of Maryland Center for Environmental ScienceFurther information located at:www.chesapeakebay.net/bayforecast.htmwww.eyesonthebay.net www.eco-check.orgwww.vims.edu/bio/sav
Current TMAW members and their affiliations:
AQUATIC GRASS OBSERVATIONS: CAUTIOUS OPTIMISMThe rain event was of special concern to aquatic grass scientists because the high amount of turbidity (from sediment and nutrient runoff) could cause a loss of aquatic grass by blocking light. Initial findings from field observations and aerial photos seem to indicate that aquatic grasses have not declined overall due to this rain event (Figure 8). However, there is high variability between systems, i.e. gains in some areas with complete losses in others. Salinity, associated with amount of precipitation, could be one part of this puzzle because different species have different salinity tolerances. We hope to provide a more comprehensive picture in our Summer Review newsletter (due out later this fall).
0 10 205
Miles
±
It appears there are some very robust populations of widgeongrass in some areas near Bloodsworth Island and eelgrass populations in the mid-bay have rebounded and are doing well.
Eelgrass populations are still recovering from the 2005 defoliation. Seedlings are populating areas, but there are few adult plants.
High variability among systems makes it difficult to determine whether the rain event affected aquatic grass in the upper Bay. But grasses at the Susquehanna Flats are doing well, regardless of the rain event.
Minimal effect
No apparent effect
No apparent effect
Water stargrass in Furnace Bay, near the Susquehanna Flats. Note accumulation of epiphytes and sediment on the leaves.
M. N
aylo
r, M
DD
NR
Figure 8: 2005 aquatic grass distribution with 2006 field observations.