chemistry and measurementteachers.sduhsd.net/kshakeri/ap_chemistry_pages/powerpoints/pdf...chemistry...
TRANSCRIPT
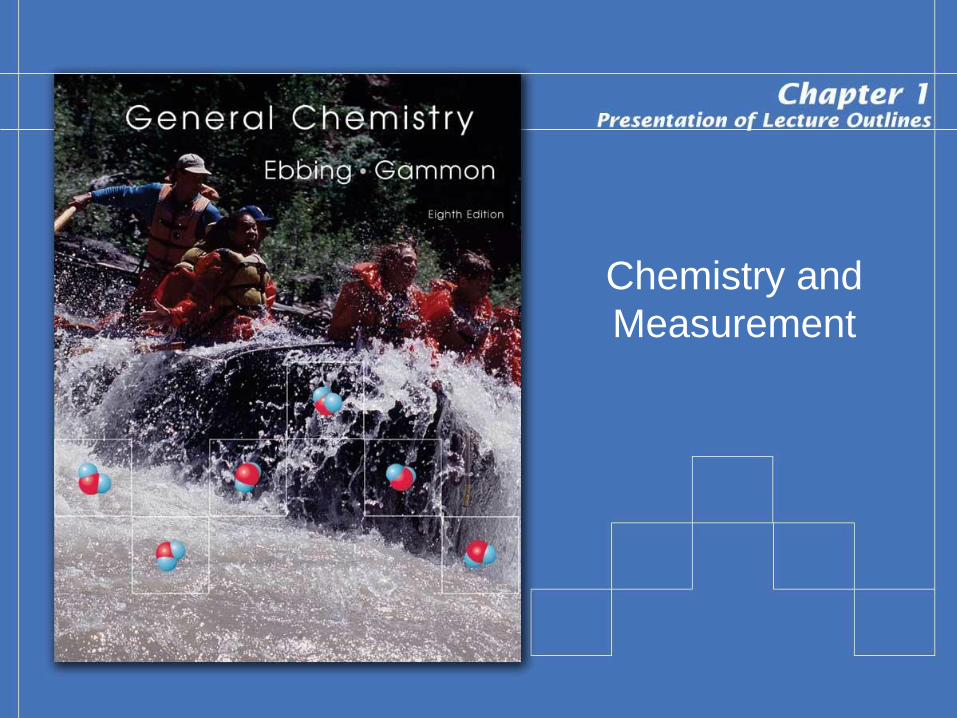
Chemistry and
Measurement

Copyright © Houghton Mifflin Company.All rights reserved. Presentation of Lecture Outlines, 1–2
What Is Chemistry?
• Chemistry is the study of the composition,
structure, and properties of matter and
energy and changes that matter undergoes.
– Matter is anything that occupies space and has
mass.
– Energy is the “ability to do work.”

Copyright © Houghton Mifflin Company.All rights reserved. Presentation of Lecture Outlines, 1–3
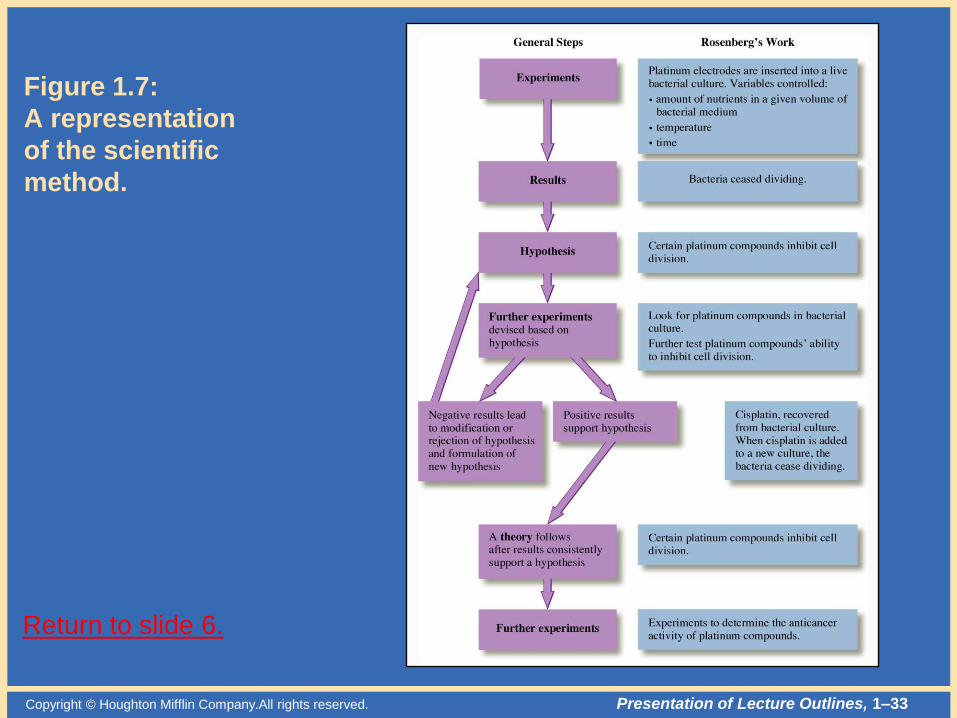
Experiment and Explanation
• The general process of advancing scientific
knowledge through observation, laws,
hypotheses, or theories is called the scientific
method. (See Figure 1.7)

Copyright © Houghton Mifflin Company.All rights reserved. Presentation of Lecture Outlines, 1–4
Matter: Physical State and
Chemical Constitution
• There are two principal ways of classifying
matter:
– By its physical state as a solid, liquid, or gas.
– By its chemical constitution as an element,
compound, or mixture.

Copyright © Houghton Mifflin Company.All rights reserved. Presentation of Lecture Outlines, 1–5
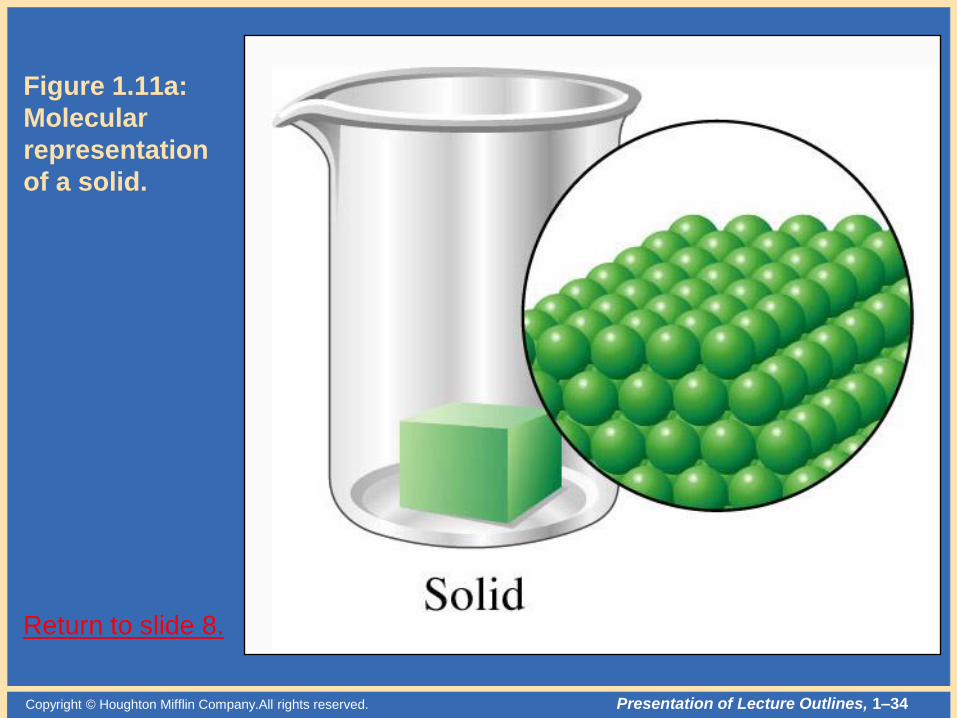
Solids, Liquids, and Gases
• Solid: the form of matter characterized by rigidity; a
solid is relatively incompressible and has a fixed
shape and volume. (See Figure 1.11a)
• Liquid: the form of matter that is a relatively
incompressible fluid; liquid has a fixed volume but no
fixed shape. (See Figure 1.11b)
• Gas: the form of matter that is an easily compressible
fluid; a given quantity of gas will fit into a container of
almost any size in shape. (See Figure 1.11c)

Copyright © Houghton Mifflin Company.All rights reserved. Presentation of Lecture Outlines, 1–6
Elements, Compounds, and Mixtures
• To understand how matter is classified by its
chemical constitution we must first look at
physical and chemical changes.
– A physical change is a change in the form of
matter but not in its chemical identity.
– Physical changes are usually reversible.
– No new compounds are formed during a physical
change.
– Melting ice is an example of a physical change.

Copyright © Houghton Mifflin Company.All rights reserved. Presentation of Lecture Outlines, 1–7
Elements, Compounds, and Mixtures (cont’d)
• A chemical change, or chemical reaction, is a
change in which one or more kinds of matter
are transformed into a new kind of matter or
several new kinds of matter.
– Chemical changes are usually irreversible.
– New compounds are formed during a chemical
change.
– The rusting of iron is an example of a chemical
change.

Copyright © Houghton Mifflin Company.All rights reserved. Presentation of Lecture Outlines, 1–8
• A physical property is a characteristic that can be observed for material without changing its chemical identity.
• Examples are physical state (solid, liquid,or gas), melting point, and color.
• A chemical property is a characteristic of a material involving its chemical change.
– A chemical property of iron is its ability to react with oxygen to produce rust.
Elements, Compounds, and Mixtures (cont’d)
Copyright © Houghton Mifflin Company.All rights reserved. Presentation of Lecture Outlines, 1–9
• Millions of substances have been
characterized by chemists. Of these, a very
small number are known as elements, from
which all other substances are made.
– An element is a substance that cannot be
decomposed by any chemical reaction into simpler
substances. (See Figure 1.14)
– The smallest unit of an element is the atom.
Elements, Compounds, and Mixtures (cont’d)

Copyright © Houghton Mifflin Company.All rights reserved. Presentation of Lecture Outlines, 1–10
• Most substances are compounds.
– A compound is a substance composed of two or
more elements chemically combined.
– The smallest unit of a compound is the molecule.
– The law of definite proportions states that a pure
compound, whatever its source, always contains
definite or constant proportions of the elements by
mass.
Elements, Compounds, and Mixtures (cont’d)

Copyright © Houghton Mifflin Company.All rights reserved. Presentation of Lecture Outlines, 1–11
• Most of the materials we See around us are mixtures.
– A mixture is a material that can be separated by physical
means into two or more substances. (See Figure 1.12 and
Figure 1.19)
– Unlike a pure compound, a mixture has variable
composition.
– Mixtures are classified as heterogeneous if they consist of
physically distinct parts or homogeneous when the
properties are uniform throughout. (See Figure 1.15a ,
Figure 1.15b)
Elements, Compounds, and Mixtures (cont’d)

Copyright © Houghton Mifflin Company.All rights reserved. Presentation of Lecture Outlines, 1–12
Measurement and Significant Figures
• Measurement is the comparison of a physical quantity to be measured with a unit of measurement -- that is, with a fixed standard of measurement.
– The term precision refers to the closeness of the set of values obtained from identical measurements of a quantity.
– Accuracy is a related term; it refers to the closeness of a single measurements to its true value.

Copyright © Houghton Mifflin Company.All rights reserved. Presentation of Lecture Outlines, 1–13
Measurement and Significant Figures (cont’d)
• To indicate the precision of a measured
number (or result of calculations on
measured numbers), we often use the
concept of significant figures.
– Significant figures are those digits in a measured
number (or result of the calculation with a
measured number) that include all certain digits
plus a final one having some uncertainty.

Copyright © Houghton Mifflin Company.All rights reserved. Presentation of Lecture Outlines, 1–14
• To count the number of significant figures in a measurement, observe the following rules:
– All nonzero digits are significant.
– Zeros between significant figures are significant.
– Zeros preceding the first nonzero digit are not significant.
– Zeros to the right of the decimal after a nonzero digit are significant.
– Zeros at the end of a nondecimal number may or may not be significant. (Use scientific notation.)
Measurement and Significant Figures (cont’d)

Copyright © Houghton Mifflin Company.All rights reserved. Presentation of Lecture Outlines, 1–15
• Number of significant figures refers to the number of digits reported for the value of a measured or calculated quantity, indicating the precision of the value.
– When multiplying and dividing measured quantities, give as many significant figures as the least found in the measurements used.
– When adding or subtracting measured quantities, give the same number of decimals as the least found in the measurements used.
Measurement and Significant Figures (cont’d)

Copyright © Houghton Mifflin Company.All rights reserved. Presentation of Lecture Outlines, 1–16
14.0 g /102.4 mL = 0.137 g/mL
only three significant figures
Measurement and Significant Figures (cont’d)

Copyright © Houghton Mifflin Company.All rights reserved. Presentation of Lecture Outlines, 1–17
• An exact number is a number that arises
when you count items or when you define a
unit.
– For example, when you say you have nine coins in
a bottle, you mean exactly nine.
– When you say there are twelve inches in a foot,
you mean exactly twelve.
– Note that exact numbers have no effect on
significant figures in a calculation.
Measurement and Significant Figures (cont’d)

Copyright © Houghton Mifflin Company.All rights reserved. Presentation of Lecture Outlines, 1–18
SI Units and SI Prefixes
• In 1960, the General Conference of Weights
and Measures adopted the International
System of units (or SI), which is a particular
choice of metric units.
– This system has seven SI base units, the SI units
from which all others can be derived.

Copyright © Houghton Mifflin Company.All rights reserved. Presentation of Lecture Outlines, 1–19
Table 1.2 SI Base Units
Quantity Unit Symbol
Length Meter m
Mass Kilogram Kg
Time Second S
Temperature Kelvin K
Amount of substance Mole mol
Electric current Ampere A
Luminous intensity Candela cd
Copyright © Houghton Mifflin Company.All rights reserved. Presentation of Lecture Outlines, 1–20
SI Units and SI Prefixes
• The advantage of the metric system is that it
is a decimal system.
– A larger or smaller unit is indicated by a SI prefix --
that is, a prefix used in the International System to
indicate a power of 10.
– Table 1.3 lists the SI prefixes. The next slide
shows those most commonly used.

Copyright © Houghton Mifflin Company.All rights reserved. Presentation of Lecture Outlines, 1–21
Table 1.3 SI Prefixes
Multiple Prefix Symbol
106 mega M
103 kilo k
10-1 deci D
10-2 centi C
10-3 milli m
10-6 micro m
10-9 nano n
10-12 pico p
Copyright © Houghton Mifflin Company.All rights reserved. Presentation of Lecture Outlines, 1–22
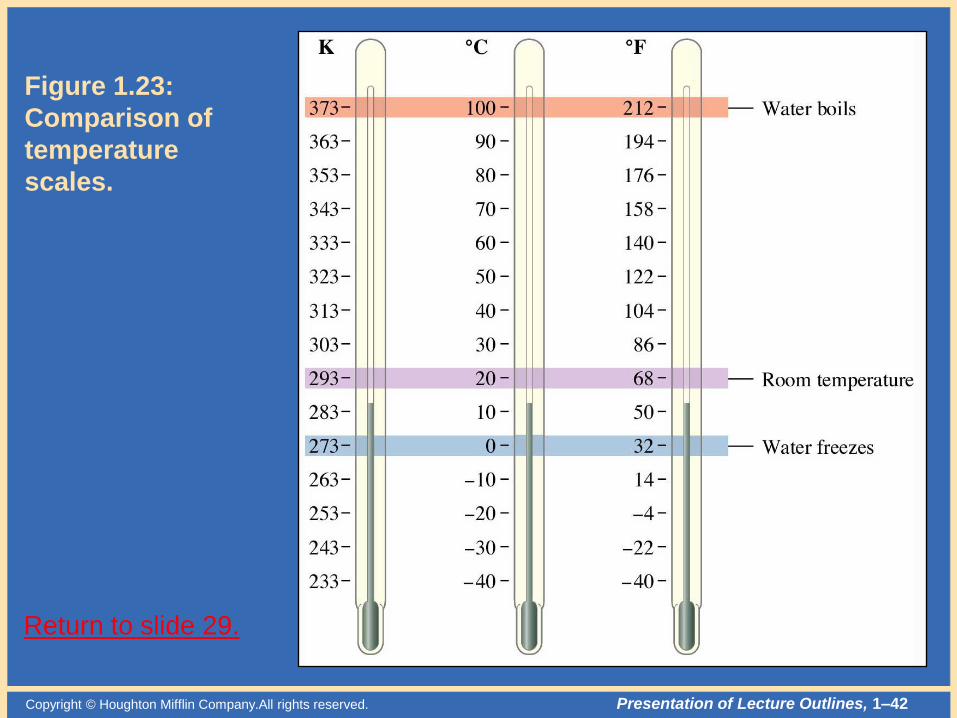
Temperature
• The Celsius scale (formerly the Centigrade
scale) is the temperature scale in general
scientific use.
– However, the SI base unit of temperature is the
kelvin (K), a unit based on the absolute
temperature scale.
– The conversion from Celsius to Kelvin is simple
since the two scales are simply offset by 273.15o.
15.273C o K
Copyright © Houghton Mifflin Company.All rights reserved. Presentation of Lecture Outlines, 1–23
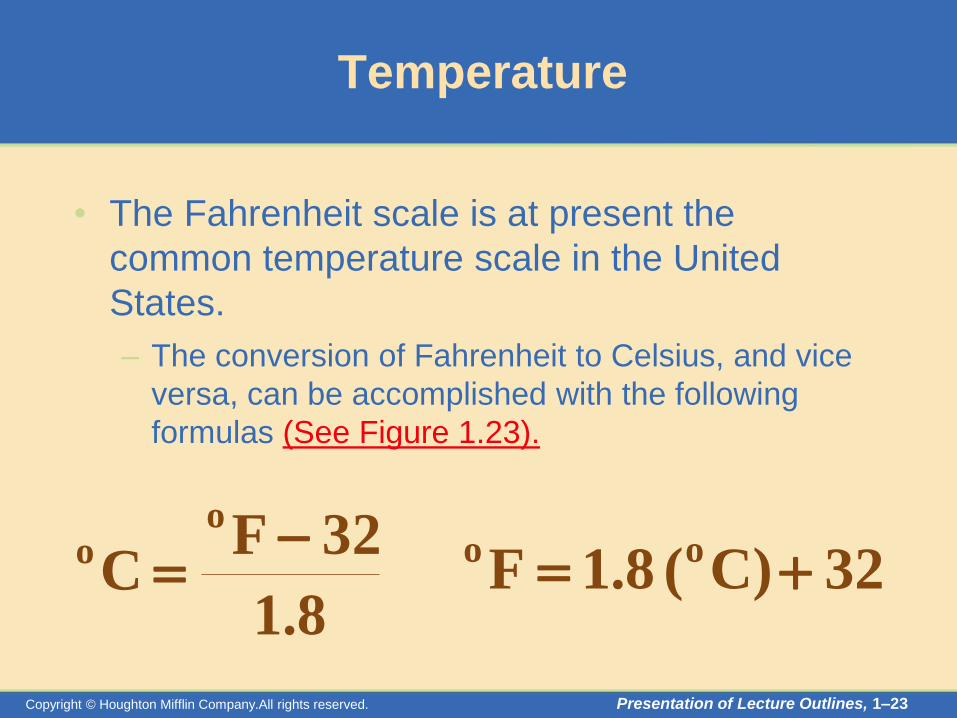
Temperature
• The Fahrenheit scale is at present the
common temperature scale in the United
States.
– The conversion of Fahrenheit to Celsius, and vice
versa, can be accomplished with the following
formulas (See Figure 1.23).
8.1
32FC
oo
32C)( 8.1Foo

Copyright © Houghton Mifflin Company.All rights reserved. Presentation of Lecture Outlines, 1–24
Derived Units
– Volume is defined as length cubed and has an SI
unit of cubic meters (m3).
– Traditionally, chemists have used the liter (L),
which is a unit of volume equal to one cubic
decimeter.
33cm 1 mL 1 and dm 1 L 1

Copyright © Houghton Mifflin Company.All rights reserved. Presentation of Lecture Outlines, 1–25
where d is the density, m is the mass, and V is the
volume. (See Figure 1.25)
• Generally the unit of mass is the gram.
• The unit of volume is the mL for liquids; cm3 for
solids; and L for gases.
Derived Units
• The density of an object is its mass per unit
volume,
V
md

Copyright © Houghton Mifflin Company.All rights reserved. Presentation of Lecture Outlines, 1–26
A Density Example
• A sample of the mineral galena (lead sulfide)
weighs 12.4 g and has a volume of 1.64 cm3.
What is the density of galena?
Density = mass
volume =
12.4 g
1.64 cm3

Copyright © Houghton Mifflin Company.All rights reserved. Presentation of Lecture Outlines, 1–27
A Density Example
• A sample of the mineral galena (lead sulfide)
weighs 12.4 g and has a volume of 1.64 cm3.
What is the density of galena?
Density = mass
volume =
12.4 g
1.64 cm3 = 7.5609 = 7.56 g/cm3

Copyright © Houghton Mifflin Company.All rights reserved. Presentation of Lecture Outlines, 1–28
Units: Dimensional Analysis
• Dimensional analysis (or the factor-label
method) is the method of calculation in which
one carries along the units for quantities.
– Suppose you simply wish to convert 20 yards to
feet.
– Note that the units have cancelled properly to give
the final unit of feet.
feet 60 yard 1
feet 3 yards 20
Copyright © Houghton Mifflin Company.All rights reserved. Presentation of Lecture Outlines, 1–29
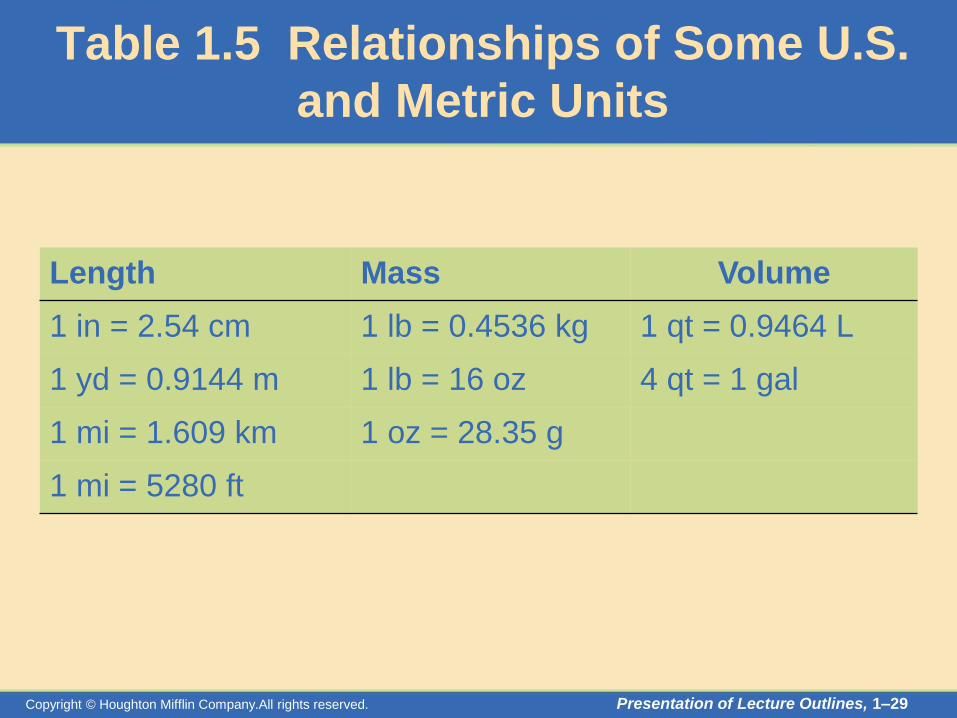
Table 1.5 Relationships of Some U.S.
and Metric Units
Length Mass Volume
1 in = 2.54 cm 1 lb = 0.4536 kg 1 qt = 0.9464 L
1 yd = 0.9144 m 1 lb = 16 oz 4 qt = 1 gal
1 mi = 1.609 km 1 oz = 28.35 g
1 mi = 5280 ft

Copyright © Houghton Mifflin Company.All rights reserved. Presentation of Lecture Outlines, 1–30
Unit Conversion
• Sodium hydrogen carbonate (baking soda)
reacts with acidic materials such as vinegar
to release carbon dioxide gas. Given an
experiment calling for 0.348 kg of sodium
hydrogen carbonate, express this mass in
milligrams.
x 0.348 kg x 103 g
1 kg
103 mg
1 g = 3.48 x 10⁵ mg
Copyright © Houghton Mifflin Company.All rights reserved. Presentation of Lecture Outlines, 1–31
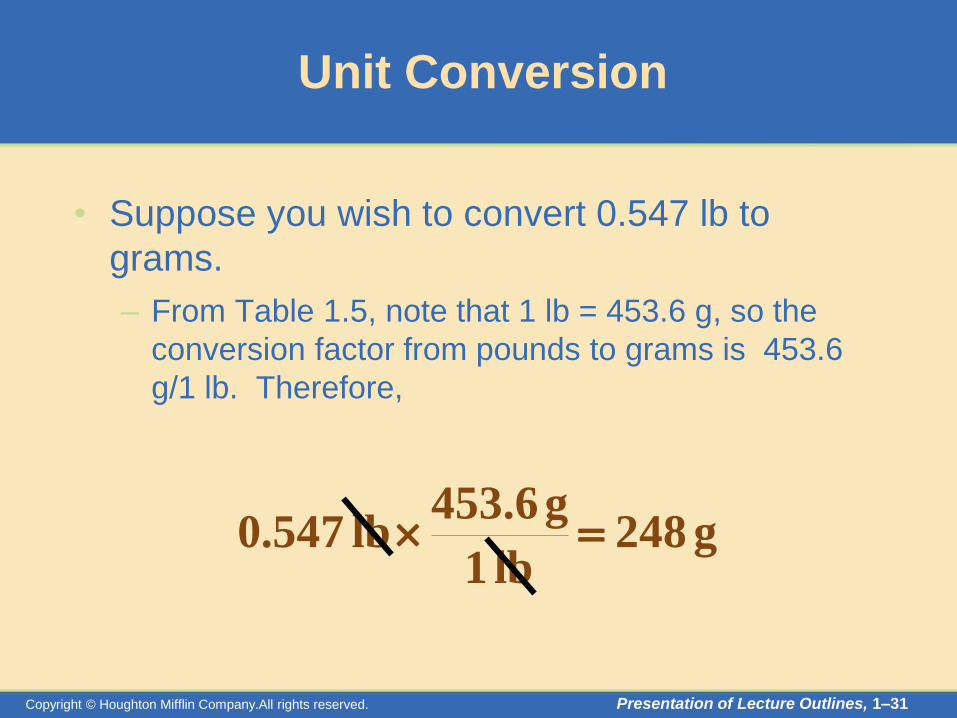
Unit Conversion
• Suppose you wish to convert 0.547 lb to
grams.
– From Table 1.5, note that 1 lb = 453.6 g, so the
conversion factor from pounds to grams is 453.6
g/1 lb. Therefore,
g 248 lb 1
g 453.6 lb 547.0
Copyright © Houghton Mifflin Company.All rights reserved. Presentation of Lecture Outlines, 1–32
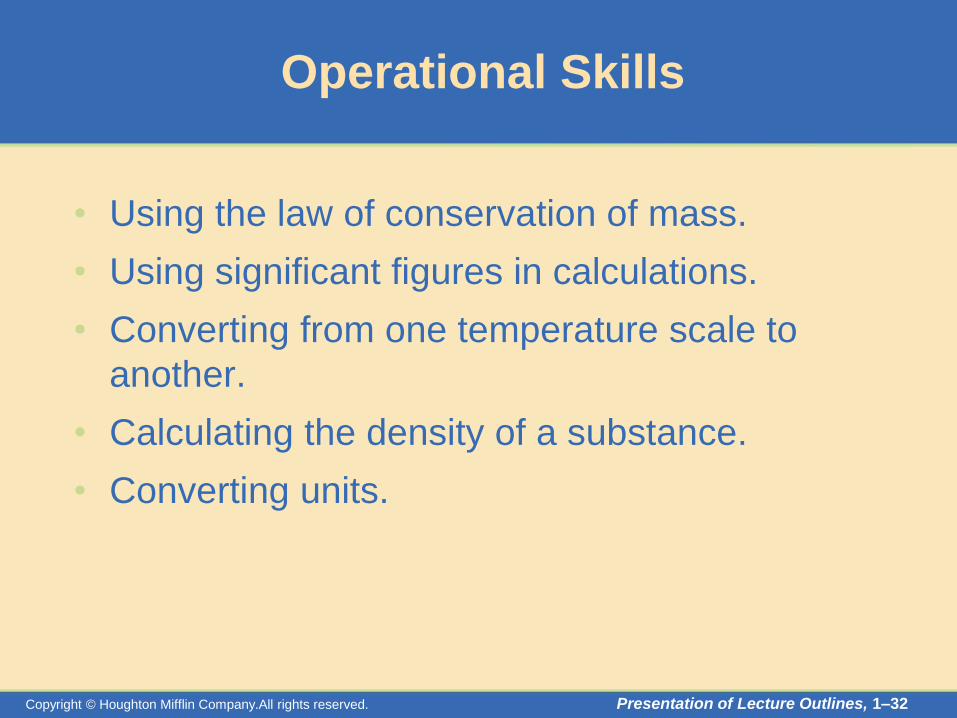
Operational Skills
• Using the law of conservation of mass.
• Using significant figures in calculations.
• Converting from one temperature scale to
another.
• Calculating the density of a substance.
• Converting units.
Copyright © Houghton Mifflin Company.All rights reserved. Presentation of Lecture Outlines, 1–33
Figure 1.7:
A representation
of the scientific
method.
Return to slide 6.
Copyright © Houghton Mifflin Company.All rights reserved. Presentation of Lecture Outlines, 1–34
Figure 1.11a:
Molecular
representation
of a solid.
Return to slide 8.

Copyright © Houghton Mifflin Company.All rights reserved. Presentation of Lecture Outlines, 1–35
Return to slide 8.
Figure 1.11b:
Molecular
representation
of a solid.

Copyright © Houghton Mifflin Company.All rights reserved. Presentation of Lecture Outlines, 1–36
Return to slide 8.
Figure 1.11c:
Molecular
representation
of a solid.

Copyright © Houghton Mifflin Company.All rights reserved. Presentation of Lecture Outlines, 1–37
Figure 1.12:
Separation by
distillation.
Return to slide 14.

Copyright © Houghton Mifflin Company.All rights reserved. Presentation of Lecture Outlines, 1–38
Figure 1.14:
Elements:
sulfur,
arsenic,
iodine,
magnesium,
bismuth,
mercury. Photo
courtesy of
American
Color.
Return to
slide 12.

Copyright © Houghton Mifflin Company.All rights reserved. Presentation of Lecture Outlines, 1–39
Figure 1.15: A mixture of potassium dichromate and iron
fillings. Photo courtesy of James Scherer.
Return to slide 15.

Copyright © Houghton Mifflin Company.All rights reserved. Presentation of Lecture Outlines, 1–40
Figure 1.15:
A magnet
separates
the iron
filling from
the mixture. Photo
courtesy of
James
Scherer.
Return to slide 15.

Copyright © Houghton Mifflin Company.All rights reserved. Presentation of Lecture Outlines, 1–41
Figure 1.19:
Gas chromatography
Return to slide 14.
Copyright © Houghton Mifflin Company.All rights reserved. Presentation of Lecture Outlines, 1–42
Figure 1.23:
Comparison of
temperature
scales.
Return to slide 29.

Copyright © Houghton Mifflin Company.All rights reserved. Presentation of Lecture Outlines, 1–43
Figure 1.25:
The relative
densities of
copper and
mercury. Photo courtesy
of James
Scherer.
Return to slide 31.