chemiluminescence strategy electronic supplementary
TRANSCRIPT

1
Electronic supplementary information for:
Ultrasensitive detection of transcription factors with highly-
efficient diaminoterephthalate fluorophore in electrogenerated
chemiluminescence strategy
Zhenqiang Fan,‡, a, b Jianfeng Wang,‡, a Nan Hao,‡, c Yihao Li,a Yuhang Yin,a Zepeng
Wang,a Yuedi Ding,b Jianfeng Zhao,*, a Kai Zhang,*, b Wei Huang*, a, d
aKey Laboratory of Flexible Electronics (KLOFE) & Institute of Advanced Materials
(IAM), Jiangsu National Synergetic Innovation Center for Advanced Materials
(SICAM), Nanjing Tech University (NanjingTech), 30 South Puzhu Road, Nanjing
211816, P.R. China.
bKey Laboratory of Nuclear Medicine, Ministry of Health, Jiangsu Key Laboratory of
Molecular Nuclear Medicine, Jiangsu Institute of Nuclear Medicine, Wuxi, Jiangsu
214063, China.cSchool of Chemistry and Chemical Engineering, Jiangsu University, Zhenjiang,
Jiangsu 212013, P.R. China
dShaanxi Institute of Flexible Electronics (SIFE), Northwestern Plytechnical
University (NPU), 127 West Youyi Road, Xi’an 710072, Shaanxi, P. R. China.
* Corresponding author. Fax: +86-510-85508775; Tel: +86-510-85508775
E-mail addresses: [email protected]; [email protected]; [email protected]
Electronic Supplementary Material (ESI) for Chemical Communications.This journal is © The Royal Society of Chemistry 2019

2
1. Experimental section
1.1 Materials and chemicals
Gold chloride hydrate (HAuCl4·xH2O) was purchased from Aladdin Biochemical Technology Co.
Ltd. (Shanghai, China). Sodium borohydride, Acetic Acid and Ethylene Diamine Tetraacetic Acid
(EDTA) were obtained from Sinopharm Chemical Reagent Co. Ltd. (Shanghai, China).
Triethylamine was from Acros Organics (France). Trisodium citrate dihydrate was purchased from
Sigma (USA). Silver nitrate were provided by Boer Chemical Reagent Co. Ltd. (Shanghai, China).
Dimethyl 2,5-dioxocyclohexane-1,4-dicarboxylate was from Energy Chemical (Shanghai, China).
Dichloromethane and petroleum ether were provided by Aopuqi Pharmaceutical Technology Co.
Ltd. (Nanjing). 2,6-diisopropylaniline and Pluronic P123 came from Heowns (Tianjin, China).
Oligonucleotides purified through HPLC method were purchased from Genscript Bio-technology
Co. Ltd. (Nanjing, China) and in Table S1 the sequences depicted. NF-κB p50 (human
recombinant) with N-terminal His Tag purchased from Hengfei Biotechnology Co. Ltd.
(Shanghai). Exonuclease III (Exo III), threo-1,4-dimercapto-2,3-butandioland (DTT), 6-Hydroxy-
1-hexanethiol (MCH), tris(2-carboxyethyl) phosphine hydrochloride (TCEP), Tris–HCl and PBS
(phosphate buffer saline) buffer solution were available in Sangon Biotech Co. Ltd. (Shanghai).
The water during the whole progresses was purified by Milli-Q purification system (Branstead).
1.2 Synthesis and purification of illuminator (I) and preparation of Au@I
Dimethyl 2,5-dioxocyclohexane-1,4-dicarboxylate (10 mmol) and 2,6-diisopropylaniline (25
mmol) were dissolved in the mixture solution of ethanol/ acetic acid (2:1) and stirred at 90 °C in a
one-neck flask for 4 hours. When it was cooled to room temperature, it was filtered and washed
with ethanol for several times. Finally, the crude product was purified by column chromatography
using dichloromethane and petroleum ether (Rf = 0.4).
We successfully synthesized Au@I nanocomposites by modifying the methods in the literature.1
Briefly, we dissolved 10 mg of I in tetrahydrofuran followed by sonication, and then the solution
3
was added to 50 mL prepared solution containing 1 mg mL-1 Pluronic P123. At the same time, 5
mL HAuCl4·xH2O solution (0.01 M) was injected into the mixture with stirring. After that, the
mixture was heated to 100 ℃ under agitation. At the boiling temperature of water for 30 seconds,
the mixture turned burgundy when 5 mL trisodium citrate dihydrate solution (0.03 M) was added
to the mixture. After reacting at 100 °C for 15 min, the mixture was centrifuged at 7000 rpm for
10 min when cooled to room temperature. Followed by washed twice by ethanol and ultrapure
water, we obtained Au@I nanocomposites dispersed in ultrapure water. Finally, the Au@I
nanocomposites was stored in a refrigerator at 4 °C for future use.
1.3 Preparation of Ag nanocluster
According to the literature, we successfully synthesized Ag nanoclusters.2 Firstly, we added 2 μL
of AgNO3 (25 mM) solution to 450 μL of template DNA solution (10 μM, pH 7.5, 5.0 mM Mg2+
in 20 mM PBS buffer solution), making the relative concentration ratio of Ag+ to nucleic acid in
the solution was about 8:1 and then the mixture was violently oscillated for 1 min. After that, 3 μL
of freshly prepared NaBH4 solution (25 mM) was added to the solution under ice bath conditions
and shaken vigorously for 15 min. Finally, the mixture was placed in the dark at 4 °C overnight to
form the Ag nanoclusters.
1.4 ECL Biosensor preparation
Glassy carbon electrode (GCE) was firstly sanded on a nylon cloth with 0.05 μm Al2O3, then it
was dipped in 0.1 M aqueous solution of sulfuric acid containing 0.2 M hydrogen peroxide for two
hours to remove the adsorbed material. Finally, it was washed by ultrapure water for several times.
6 μ of suspended solution was applied onto the cleaned glassy carbon electrode. Followed by
drying in the air for one hour, the Au@I/GCE was immersed in a PBS buffer solution of 20 mM
(pH 7.5).
1 mL PBS buffer (pH 7.5) with a concentration of 20 mM containing 0.2 μM hairpin DNA was
activated with 2 μL of 10 mM TCEP at 4 °C for one hour to cut off the S-S bond. Then
Au@I/GCE was immersed in 100 μL of the already activated HP solution at 4°C overnight in
4
order that Au@I/GCE was modified by HP DNA. After that, the electrode was immersed in 60 μL
of 20 mM PBS buffer containing 100 μM MCH (pH 7.5) for one hour to passivate the active site
on the electrode surface and make the hairpin DNA oriented perpendicular to the electrode surface
which is advantageous for further hybridization reaction. Additionally, it is necessary to rinse non-
specific adsorbed substances with 20 mM PBS buffer solution from the electrode surface for each
step.
1.5 Detection of NF-κB p50
In order to get the DNA duplexes, DNA1 and DNA2 with the same concentration of 20 μM were
hybridized in the buffer which contained 50 mM Tris–HCl (pH 8.0), 100 mM NaCl and 1 mM
EDTA. Then the buffer solution was heated at 90 ℃ for 5 min, then it was cooled to room
temperature for 3 hours. A range of different concentrations of NF-κB p50 (20 μL) and DNA
duplexes (50 μL) were incubated in protein binding buffer containing 10 mM Tris-HCl (pH 8.0),
100 mM KCl, 2 mM MgCl2, 0.1 mM EDTA, 10% glycerol, 0.25 mM DTT at room temperature
for 30 min. The transcription factor in the dilution of cell nuclear extracts (20 μL) to be detected
was mixed with DNA duplexes (50 μL) and incubated for 30 min at room temperature in protein
binding buffer. The DNA duplexes bound with transcription factor were digested with 2 U μL-1
(50 μL) of Exo III for 5 min at 37 °C followed by heated to 70 °C for 20 min to stop the
digestion.
For the amplification reach of Exo III, Au@I/GCE was immersed in 100 μL protein binding
buffer solution containing the digested DNA duplexes treated by different concentrations of NF-
κB p50 and 10 μL (10 U μL-1) Exo III to incubate at room temperature for 40 min. Followed by
rinsed with 20 mM of PBS buffer (pH 7.5), 100 μL Ag nanoclusters (0.2 μM) was used to
quench the signal at 37 °C for 30 min. Finally, ECL response was tested for with 0.1 M PBS (pH
8.5) containing 18 mM co-reactant triethylamine. The scan range was -1 V to 1.3 V.
1.6 Cell culture and preparation of cell nuclear extracts

5
Cell culture and preparation of cell nuclear extracts were implemented according the literature.3
First of all, cells (A549) were cultured in cell culture medium containing 10% fetal calf serum,
100 μg mL-1 penicillin and streptomycin at humid atmosphere including 5% CO2. Cell number
was calculated by PetroffHaussercell counter (USA). Then, 5×10⁷ cells were put into 1.5 mL EP
tube and washed by PBS buffer solution (0℃, pH 7.5) twice. Followed by incubation with 20 ng
mL-1 TNF-α (PeproTech) for 25 min, cell nuclear extracts were obtained by nuclear extract kit
(Active Motif, Carlsbad, CA). Finally, they were diluted to 200 μL and stored at -80 ℃for future
detection.
1.7 Nondenaturing polyacrylamide gel electrophoresis (PAGE).
The DNA solution mixed with loading buffer (TEK buffer, 0.25% bromophenol blue; 60%
glycerol) was analyzed in nondenaturing polyacrylamide gel electrophoresis (PAGE) (15%).
PAGE was run in TBE (89 mM Tris-boric-acid, 2 mM EDTA, pH 8.0) buffer at 120 V for 2 h at 4
℃. Then the image was obtained by UV light (ChemiDoc MP, Bio-Rad) after staining with
GelRed for 30 min.
2. Results and discussion
2.1 Characterization of stepwise modification of electrode
For stepwise modification of the electrode, cyclic voltammetry (CV), electrochemical impedance
spectroscopy (EIS) were used to characterize the construction of the biosensor. As depicted in the
Fig. S6A, with Au@I nanocomposites (curve b), HP DNA (curve c), MCH (curve d) and NF-κB
p50 (curve e) successively modified on the electrode, the redox peaks continued to decline, which
was due to the resistance of electron transfer. However, with Ag nanoclusters (curve f) bound to
the modified electrode, an increased redox peak was observed for the conductivity of it. The same
is true with the EIS (Fig. S6B), electron transfer resistance (Ret) increased with stepwise
modification from a to e. While with Ag nanoclusters bound the modified electrode, the Ret
decreased obviously. Both CV and EIS reflected the actual modification stages of the proposed

6
biosensor.
2.2 Optimization of detection conditions
In order to get a good assay condition, we use univariate analysis involved in the concentration of
the co-reactant, the pH value of the PBS buffer solution, the targets reaction time, and the
quenching time of the Ag nanoclusters. As shown in Fig. S4A, the ECL intensity increases with
the concentration of triethylamine until the concentration reaches 18 mM. The impact of pH value
(Fig. S4B, ESI†) was also investigated which indicated that the ECL intensity reached its
maximum when the value got 8.5. Meanwhile, Fig. S4C and Fig. S4D showed that the most
suitable incubation time of targets reaction and quenching time of Ag nanoclusters were 40 min
and 30 min respectively, which indicated that 40 min was enough for reporter DNA to open the
stem-loop structure and at least 30 min for Ag nanoclusters to quench the ECL signal. Therefore,
the assays conditions were confirmed.
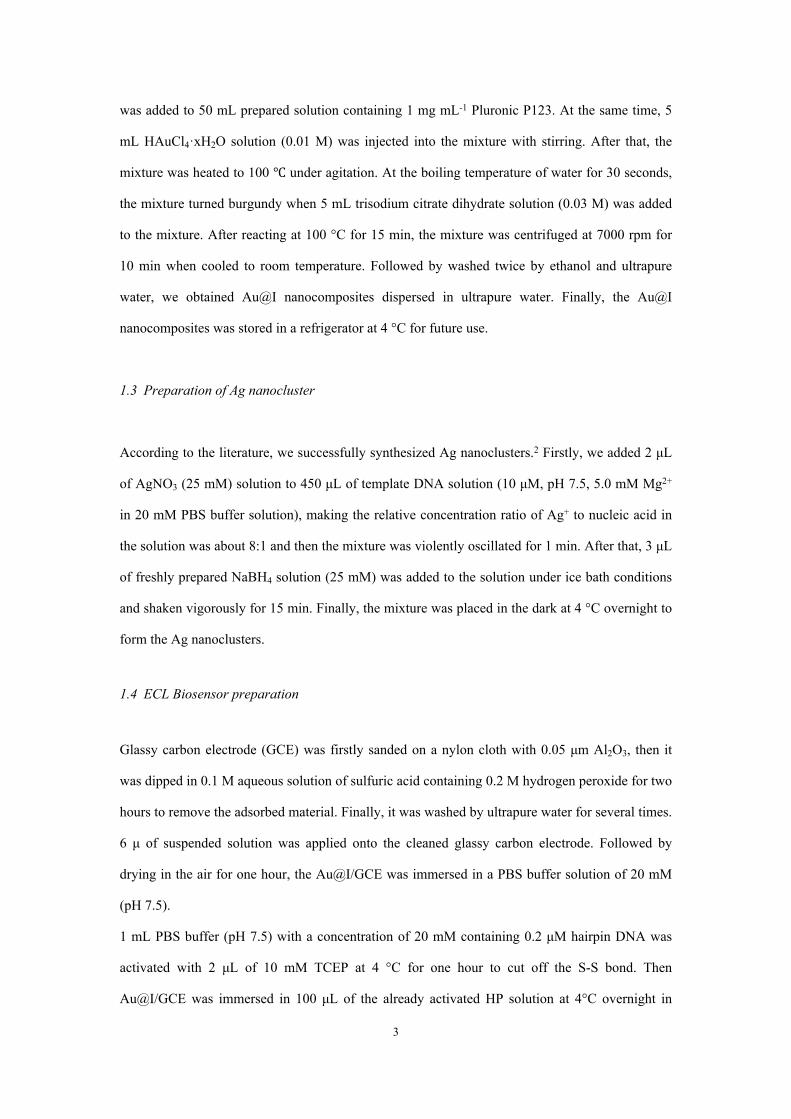
2.3 Nondenaturing PAGE for the analytical process
To further verify the detection strategy, we applied nondenaturing polyacrylamide gel
electrophoresis (PAGE) to monitor the analytical process as shown in Fig. S7. The ssDNA DNA2
(lane 1) and HP DNA (lane 2) were served as reference bands. The hybridization of DNA1 and
DNA2 led to a bright dsDNA probe stripe (lane 3). Then the dsDNA probe was incubated with
Exo III (lane 4). It can be observed that the stripe of the dsDNA probe disappeared indicating the
digestion effect of Exo III. However, dsDNA bound by NF-κB p50 followed by the digestion of
Exo III (lane 7) shown that the stripe of DNA1 was digested by Exo III and the stripe of DNA2
protected by NF-κB p50 was remained. We could also infer that the binding of NF-κB p50 with
dsDNA probe was destroyed during the running of nondenaturing PAGE which was consistent
with the previous reports.4, 5 When Exo III was added into ssDNA DNA2 solution (lane 5), the
stripes of DNA2 were clearly observed, showing that Exo III would not digest ssDNA. Lane 6 was
used to verified that ssDNA DNA2 could open up the stem-loop structure and form double-
stranded DNA which could further for the amplification process. In lane 8, the quick migrated

7
stripe was from HP DNA which was hybridized with DNA2 and cut by Exo III. The slow migrated
stripe was the DNA2 which was free from being digested.
2.4 Possible ECL mechanism and electrochemical activity of Au@I nanocomposite
In order to confirm the ECL mechanism of Au@I nanocomposites, a serial of systematic
experiments was carried out. Firstly, ECL response and its corresponding CV measurements with
and without the co-reactant (TEA) were investigated, respectively, which had been showed in Fig.
S9. Obviously, in the typical PBS buffer solution without co-reactant, the ECL signal is feeble, the
max current of CV curve between -0.1 to 1.1 V was only 10-6 A. However, in the PBS buffer
solution containing 18 μM TEA, the ECL signal raised to 2000 a.u. and the oxidation peak current
was raised about 200 folds, which indicating that TEA was oxidized to TEA•+ and participated in
the ECL process of the illuminators. Therefore, two possible ECL mechanism of Au@I is
predicted by us as showed below. In a nutshell, TEA loses an electron to generate TEA radical
cations (TEA•+), and then acts with I to form the electronically excited state of I* via the different
routes depicted simply in reactions A and B, respectively.
A
TEA – e– TEA•+ TEA• + H+
I + TEA• I* + product
I* I + hν
B
TEA – e– TEA•+ TEA• + H+
I + TEA• I–+ product
I – e– I+
I+ + I– I*
I* I + hν
Besides, we had compared the ECL intensity of TEA and TrPA as co-reactants, respectively, as
depicted in Fig. S10. We could see that TEA as co-reactant was better than TrPA as co-reactant
when detecting different concentrations of NF-κB p50.

8
Table S1. Oligonucleotides sequence used in this method. The colors of the sequences are
corresponding to scheme 1. The underline bases of DNA1 and DNA2 are the binding sites of NF-
κB p50. The double underline bases are the sequences of stem loop structure. The bold sequences
of template DNA can hybridize with the matching sequences of HP DNA. And the italic
sequences with wavy line are used to form Ag nanoclusters.
note sequence (5’-3’)DNA1 GGG ACT TTC CA TAT TTA CGC GCG TGC TACDNA2 GTA GCA CGC GCG TAA ATA TGG AAA GTC CC
HP DNAHS-TTT TTTTT TTT ATA AGG GTA GCA AT ATT TAC GCG CGT GCT AC
Template DNA
TGC TAC CCT TAT CCC CTA ACT CCC C
Table S2. The crystal cell parameters of compound I
Fig. S1. Synthesis step of compound I.

9
Fig. S2. Single crystal structure (A), and 1H NMR (B), and HiRes MALDI-TOF MS spectrum (C) of compound I: 1H NMR (400 MHz, CDCl3) δ/ppm = 7.35-7.31 (m, 2H), 7.28-7.26 (m, 4H), 6.89(s, 2H), 3.80 (s, 6H), 3.17 (m, 4H), 1.16 (t, J = 6.4 Hz, 24H); HiRes MALDI-TOF MS (m/z): [M+H]+ calcd for C34H45N2O4: 545.7360, found: 545.3382.

10
Fig. S3. (A) FL spectra of (black line) I dissolved in tetrahydrofuran, (red line) emulsified I in
aqueous solution. (B) FL spectra of emulsified I (red line) and ECL emission spectra of Au@I
(blue line) in aqueous solution. (C) CV curves of emulsified I (black line) and Au@I (red line) in
the presence of 18 mM TEA. (D) ECL-potential plot of emulsified I (black line) and Au@I (red
line) in the presence of 18 mM TEA.

11
Fig. S4. (A) ECL intensity at different concentrations of triethylamine and (B) pH of detection
solution in the presence of 10 nM NF-κB p50. (C) ECL intensity versus the time of targets
reaction and (D) quenching in the presence of 100 nM NF-κB p50.
Fig. S5. Practical detected samples (red point) from dilution of cell nuclear extracts and spiked
samples (black point) with the same concentration of NF-κB p50 (0, 10, 30, 60, 100, 200, 300 pM)
in PBS buffer solution (pH 8.5) containing 18 mM triethylamine.
Fig. S6. (A) CV, (B) EIS and for the stepwise fabrication of the electrode. (a) Bare GCE, (b)
GCE/Au@I nanocomposites, (c) GCE/Au@I nanocomposites/HP DNA, (d) GCE/Au@I
nanocomposites/HP DNA/MCH, (e) GCE/Au@I nanocomposites/HP DNA/MCH/dsDNA treated
by 400 pM NF-κB p50 and Exo III, (f) GCE/Au@I nanocomposites/HP DNA/MCH/dsDNA
treated by 400 pM NF-κB p50 and Exo III/Ag nanoclusters. The electrolyte is 0.1 M PBS
phosphate solution (pH 7.5) containing 5 mM [Fe(CN)6]3−/4−.
12
Fig. S7. Nondenaturing PAGE for the verification of the analytical process. Lane 1,2 and 3 were 1
μM of pure DNA2, HP DNA and dsDNA probe, respectively. Lane 4 was 1 μM dsDNA probe
incubated with 20 U mL-1 Exo III for 30 min. Lane 5 was 1 μM DNA2 incubated with 20 U mL-1
Exo III. Lane 6 was 0.5 μM DNA2 incubated with 1 μM HP DNA. Lane 7 was 1 μM of dsDNA
probe incubated with 1.5 μM NF-κB p50 for 30 min, then the mixture was incubated with Exo III
for 30 min. Lane 8 was 1 μM of dsDNA incubated with 1.5 μM NF-κB p50 for 30 min, followed
by 30 min digestion of Exo III, and then reacted with 1 μM HP DNA for 1 h.
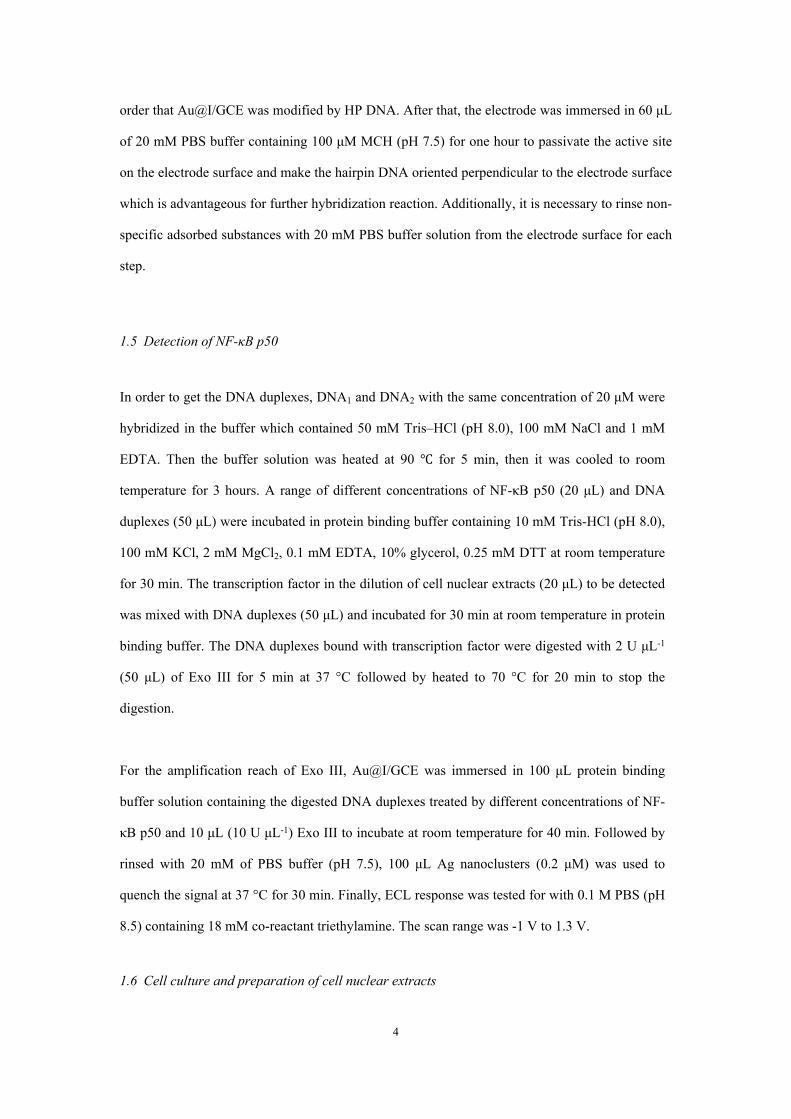
Fig. S8. UV−vis absorption of Ag nanoclusters (black curve) and ECL emission spectra (red curve)
of Au@I.

13
Fig. S9. CV curve (black curve) and ECL emission spectra (red curve) of Au@I nanocomposites
in (A) PBS solution, (B) PBS+18 mM TEA solution
Fig. S10. Histogram of ECL intensity while detecting different concentrations of NF-κB p50 in
0.1 mM PBS buffer containing 18 mM TEA (a) and TrPA (b) as co-reactant, respectively.

14
Fig. S11. Stabilization of ECL emission from the proposed biosensor with 5 pM NF-κB p50 under
a continuous cyclic voltammetry for 20 cycles. The scan rate is 100 mV s-1.
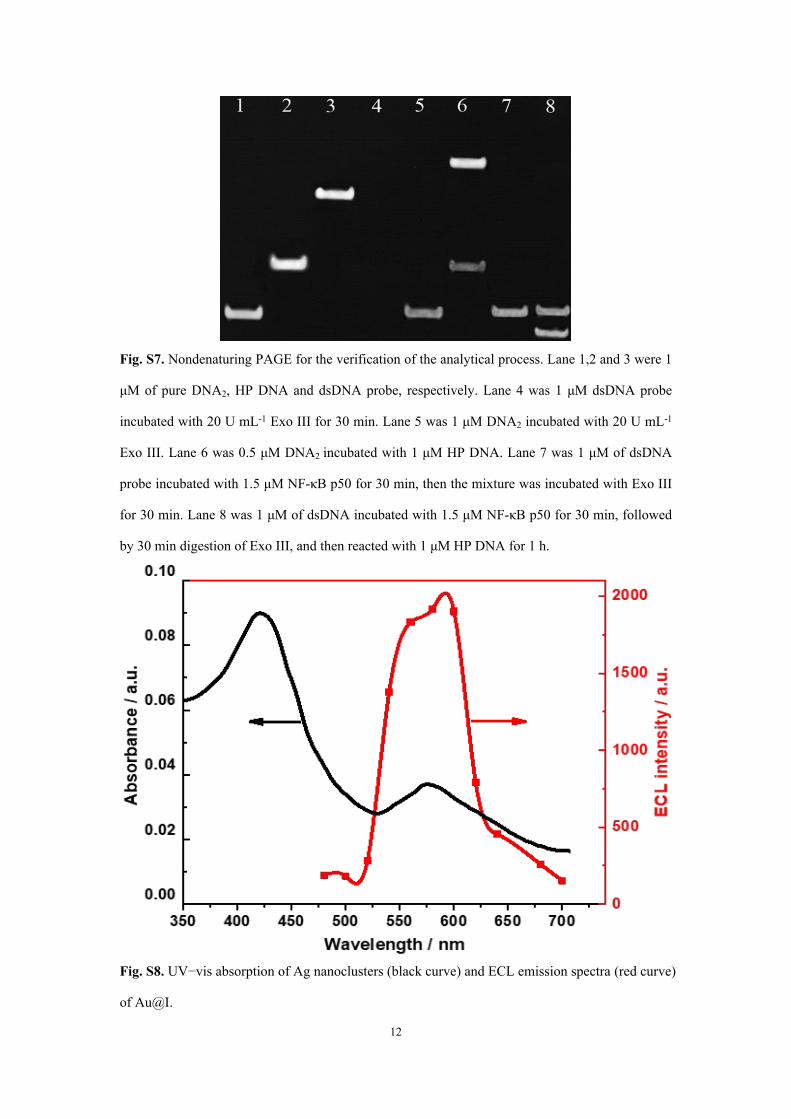
Table S3. Comparison of sensitivity and detection means of transcription factor reported in recent
years.
Detection method Linear range Detection limit
Ref.
Sensitive Detection of Transcription Factors by Isothermal Exponential Amplification-Based Colorimetric Assay
5 to 2000 pM 3.8 pM 6
Sensitive Detection of Transcription Factors Using Near-Infrared Fluorescent Solid-Phase Rolling Circle Amplification
0 to 50 fM 10 fM 7
Silver ion-stabilized DNA triplexes for completely enzyme-free and sensitive fluorescence detection of transcription factors via catalytic hairpin assembly amplification
5 to 150 pM 1.5 pM 8
Sensitive and Label-Free Fluorescent Detection of Transcription Factors Based on DNA-Ag Nanoclusters Molecular Beacons and Exonuclease III-Assisted Signal Amplification
30 pM to 1.5 nM
10 pM 9
15
Amplified probing of protein/DNA interactions for sensitive fluorescence detection of transcription factors
10 to 50 pM 0.54 pM 10
A highly selective, label-free, homogenous luminescent switch-on probe for the detection of nanomolar transcription factor NF-kappaB
10 to 220 nM 30 nM 11
Specific DNA-Binding Protein via a Gold Nanoparticle-Based Colorimetric Biosensor
0 to 120 nM 10 nM 12
Protein binding-protected DNA three-way junction-mediated rolling circle amplification for sensitive and specific detection of transcription factors
8 pM to 15 nM
6.8 pM 13
Label-free electrochemiluminescent detection of transcription factors with hybridization chain reaction amplification
50 pM to 2 nM
17 pM 14
Ultrasensitive Homogeneous Electrochemical Detection of Transcription Factor by Coupled Isothermal Cleavage Reaction and Cycling Amplification Based on Exonuclease III
10 pM to 30 nM
10 pM 4
Notes and references
1. X. Feng, N. Gan, H. Zhang, Q. Yan, T. Li, Y. Cao, F. Hu, H. Yu and Q. Jiang, Biosens.
Bioelectron., 2015, 74, 587-593.
2. G. Li and Y. Luo, Inorg. Chem., 2008, 47, 360-364.
3. K. Zhang, K. Wang, X. Zhu and M. Xie, Biosens. Bioelectron., 2016, 77, 264-269.
4. L. Lu, H. Su and F. Li, Anal. Chem., 2017, 89, 8328-8334.
5. Y. Zhang, D. Xiang, B. Tang and C.-Y. Zhang, Anal. Chem., 2017, 89, 10439-10445.
6. Y. Zhang, J. Hu and C.-Y. Zhang, Anal. Chem., 2012, 84, 9544-9549.
7. J. Yin, P. Gan, F. Zhou and J. Wang, Anal. Chem., 2014, 86, 2572-2579.
8. Y. Qin, D. Li, R. Yuan and Y. Xiang, J. Mater. Chem. B, 2019, 7, 763-767.
9. B. Li, L. Xu, Y. Chen, W. Zhu, X. Shen, C. Zhu, J. Luo, X. Li, J. Hong and X. Zhou, Anal.
Chem., 2017, 89, 7316-7323.
10.J. Li, J. Tang, B. Jiang, Y. Xiang and R. Yuan, J. Mater. Chem. B, 2018, 6, 6002-6007.
11.D.-L. Ma, T. Xu, D. S.-H. Chan, B. Y.-W. Man, W.-F. Fong and C.-H. Leung, Nucleic Acids

16
Res., 2011, 39, e67-e67.
12.L.-J. Ou, P.-Y. Jin, X. Chu, J.-H. Jiang and R.-Q. Yu, Anal. Chem., 2010, 82, 6015-6024.
13.K. Li, L. Wang, X. Xu, T. Gao, P. Yan and W. Jiang, RSC Advances, 2016, 6, 68846-68851.
14.Y. Xiong, L. Lin, X. Zhang and G. Wang, RSC Advances, 2016, 6, 37681-37688.