chemical speciation and bioavailability of rare earth ... · chemical speciation and...
TRANSCRIPT

RECENTADVANCES IN ASSESSMENT ON CLEARWATER, SOIL AND AIR
Chemical speciation and bioavailability of rare earth elements(REEs) in the ecosystem: a review
Aysha Masood Khan1& Nor Kartini Abu Bakar2 & Ahmad Farid Abu Bakar1 &
Muhammad Aqeel Ashraf2,3
Received: 11 November 2015 /Accepted: 4 August 2016# Springer-Verlag Berlin Heidelberg 2016
Abstract Rare earths (RE), chemically uniform group of ele-ments due to similar physicochemical behavior, are termed aslanthanides. Natural occurrence depends on the geological cir-cumstances and has been of long interest for geologist as toolsfor further scientific research into the region of ores, rocks, andoceanic water. The review paper mainly focuses to provide sci-entific literature about rare earth elements (REEs) with potentialenvironmental and health effects in understanding the research.This is the initial review of RE speciation and bioavailabilitywith current initiative toward development needs and researchperceptive. In this paper, we have also discussed mineralogy,extraction, geochemistry, analytical methods of rare earth ele-ments. In this study, REEs with their transformation and verticaldistribution in different environments such as fresh and seawa-ter, sediments, soil, weathering, transport, and solubility havebeen reported with most recent literature along key methods offindings. Speciation and bioavailability have been discussed in
detail with special emphasis on soil, plant, and aquatic ecosys-tems and their impacts on the environment. This review showsthat REE gained more importance in last few years due to theirdetrimental effects on living organisms, so their speciation, bio-availability, and composition are much more important to eval-uate their health risks and are discussed thoroughly as well.
Keywords Rare earths . Speciation . Bioavailability .
Abundance . Techniques . Environmental impacts
Introduction
The term rare earth (RE) is actually a misnomer that shows acursory view of these metals good enough for a 5-min review(Hurst 2010). Lanthanide series include rare earth elements(REEs) along with scandium and yttrium, being similar inchemical properties and deposited in ores same like REEs(Connelly 2005; Zdzislaw and Agnieszka 2015). Promethiumoccurs in trace quantities due to no long lived and stable isotope(Castor and Hedrick 2006; Borovicka et al. 2011).
For many years, human activities have been a significantsource of trace metallic elements eventually contaminating theearth’s surface. Such actions overburdened the regime of eco-system in aquatic and terrestrial environments with largequantities of trace metallic pollutants and contaminants.Mining, extraction, and utilization of trace elements in highvalue goods and as major component of infrastructure becamecorners tone in human development civi l izat ion.Consequently, at local, national, and universal scale, humanawareness and individual role on the environmental compo-nents to manage and improve degraded terrestrial and aquaticsystem have been enhanced (Ozdes et al. 2011; Adamu et al.2013).
Responsible editor: Philippe Garrigues
* Muhammad Aqeel [email protected]
Aysha Masood [email protected]; [email protected]
Nor Kartini Abu [email protected]
Ahmad Farid Abu [email protected]
1 Department of Geology, Faculty of Science, University of Malaya,50603 Kuala Lumpur, Malaysia
2 Department of Chemistry, Faculty of Science, University of Malaya,50603 Kuala Lumpur, Malaysia
3 University Malaya Centre for Ionic Liquids (UMCiL), University ofMalaya, 50603 Kuala Lumpur, Malaysia
Environ Sci Pollut ResDOI 10.1007/s11356-016-7427-1

Rare earth elements (REEs) speciation in the geochemicalsamples provides potential hazards and pathways for remedi-ation. Factors like time and environmental conditions affect-ing speciation provide challenging and great opportunity forenvironmental science and technology to study rare earth ele-ments. Evaluation of contaminants, assessment, and remedia-tion processes is recent in modern research (Adamu et al.2013; Ashraf et al. 2015).
Different species of ecosystem have 99 % REEs bioavail-able in bound to suspended matter and sediment form.Bioavailability of rare earth elements (REEs) in different en-vironments varies with change in ionic concentration and li-gands and decrease among dissolved species as in the order:free ion, organic or inorganic complexes (Sun et al. 2003;Borrego et al. 2012). It also depends on equilibrium andchange when there is a disturbance in equilibrium.Sediments may become a source of available rare earths inwater which also become available to other biotic organismsfeeding on them. Rare earth elements (REEs) released fromsoil and sediments become significant as bioavailable to thealgae. Sequential extraction method is commonly applied tostudy bioavailability of rare earths in geochemical sampleanalysis. Bioaccumulation of rare earth elements inorganisms depends in part upon their bioavailability. Fewinvestigations describe the relationship between rare earthelements species and plant bioavailability. Sun et al. (2003)reported that most of the rare earths in soil and sediments arepresent in extractable species and increase with increase inspiking of REEs. Generally, total concentration of rare earthelements (REEs) in soil is very small in milligrams per kilo-gram (Ebrahim et al. 2009) and in plants more than 10 mg/kg(Cao et al. 2000; Wood et al. 2004; Ebrahim et al. 2009). Thisconcentration is quite low to detect. Still, no correlation in thestudies is found between REEs species in natural soil systemand their bioavailability. The current review paper provides anoverview of contents relating to geochemistry, bioavailability,and speciation of REEs in the ecosystem and describes tracemetal speciation and bioavailability in achieving result-oriented remediation methods and risk in approaching pollu-tion source (Haque et al. 2014).
Mineralogy
Rare earth elements (REEs) consisting of both heavy rareearth elements (HREEs) and light rare earth elements(LREEs) exhibit in mineral form. REEs naturally occur indiversity of mineral types. HREEs and Yare mostly associatedwith minerals such as xenotime, euxenite, yttrotantalite, sa-marskite, and gadolinite, while LREEs are found in monazite,bastnasite, ancylite, lanthanite, stillwellite, allanite, cerianite,britholite, and loparite (Chakhmouradian and Wall 2012).Bastnasite, monazite, and xenotime ores are mostly extracted
around the world in commercially operating mines. High con-centration of REEs produces its own minerals. Despite ofmore than 200 REE minerals, only three ores are consideredsuitable for extraction: bastnasite, xenotine and monazite(Gupta and Krishnamurthy 2004; Weng et al. 2013).Bastnasite, a carbonate mineral [(Ce,La,Y)CO3F] quite simi-lar to the mineral parasite [Ca(Ce,La)2(CO3)3F2], is found inpale white, tan, gray, brown, yellow, or pink, with a pearly,vitreous, or greasy to dull luster form and mostly found withmineral hydroxyl-bastnasite [(Ce,La)CO3(OH,F)], vein de-posits, pegmatite’s and contact metamorphosis zones. It ishighly enriched in LREEs such as cerium, lanthanum, andyttrium (Keith et al. 2010; Haque et al. 2014). Xenotine andMonazite, two phosphate minerals, found together, crystallizeunder different temperature and pressure regimes containingany of HREEs or LREEs. Monazite, an enriched LREE andthorium-bearing phosphate mineral [(Ce,La,Y,Th)PO4], ischaracterized by low crystallization temperature and pressurewith 60–62 % RE oxides. Crystalline forms of monazite areusually yellow to brown or orange-brown with a vitreous andresinous luster. Thorium present with monazite makes it ra-dioactive, and wastes produced from such mineral need spe-cial disposal methods, accounts serious impediment to eco-nomic extraction. Generally, minerals with radioactive prop-erties are not easy to handle and process (Keith et al. 2010;Sprecher et al. 2014). Xenotine, an yttrium phosphatemineral (YPO4), crystallizes under high temperature andpressure with enriched HREEs and minor component ofgranitic and gneissic rocks. It occurs as yellowish brownto reddish brown crystals with a vitreous to resinous lusterin acidic and alkaline rocks (Keith et al. 2010; Melfos andVoudouris 2012).
Uranium ores have also been found to contain REEs inappreciable amounts. Processing of such radioactive min-erals for REEs is very challenging to the world’s producerand supplier countries. Four countries—China, USA,Australia, and Malaysia—are well-known for REE de-posits. China has bastnasite and xenotime deposits, whileUSA principally contains bastnasite deposits. Australia hasmajor RE-bearing minerals such as monazite andxenotime, whereas Malaysia is known for xenotime de-posits only (Fig. 1) (Geoscience Australia 2012; Haxelet al. 2014).
Lynas corporation’s for rare earth elements (REEs) pro-cessing plant in Malaysia has become a current issue of inter-est in the sense that the radioactive waste generated duringprocessing will create long-term health and environmentalimpacts that dates back to Asian rare earths refinery 2 decadesago. However, International Atomic Energy Agency arguedthat the radiations generated from the current Malaysian REproducing plant would be in certain limit not to have impacton normal life of humans and other components of environ-ment (Heber 2013).
Environ Sci Pollut Res

Geochemistry of rare earth elements
The low concentrations of REEs (ng/L or ng/kg) hinder theirgeochemical fate in many environmental mediums (Kynickyet al. 2012; Williams-Jones et al. 2012). Previous researchwork on biogeochemistry of rare earth elements (REEs) insoil/plant system and their effects on agricultural ecosystemhas been widely studied (Wyttenbach and Tobler 1998; Zhangand Shan 2001; Zawisza et al. 2011). Work done can be cat-egorized into four phases: First includes study on efficacy ofrare earths-based fertilizers, second geochemical behavior ofrare earth in ecosystem, third practices employment of rareearth-based fertilizer, and fourth comprises of physiologicalprocesses of enhanced yield. Ferns show high enrichment ofREEs in the soil by inductively coupled plasma mass spec-trometry (ICP-MS) and instrumental neutron activation anal-ysis (INAA) which are strongly recommended techniques forsuch determination. Physicochemical properties of the soilaffect the exchangeable fractions of speciationwhich ultimate-ly put large impact on REE bioavailability. Study also indi-cates average content of rare earth elements (REEs) in the soilranging 85–522.7 mg/kg. LREEs show abundance in the soil(83–95 %) with average value and mean ratio of 89 % and 8,respectively. Cerium is correlated with 42 % of all the REEsand 48 % with LREEs. Wheat seeds found with rare earthelements ranging from 10−4 to 10−8 g/g much lower than insoil but with similar distribution. Generally in roots andleaves, rare earth concentration increases with dressing(Skarpelis 2002; Tsirambides and Filippidis 2012). Lot ofstudies has been done on geochemistry of rare earths in dif-ferent coals as potential economic value of rare earths tookmuch attention in this century. Rare earth elements (REEs)have largely been used in modern technology as tracers toidentify source and epigenetic modification especially in coalmining. Some coal deposits due to different geological
settings and paleoenvironments show enrichment of HREEsas compared to LREEs. Different plies from same coal due todifferent depositional microenvironments have variable rareearth distribution patterns. Rare earth elements (REEs) arefound bound to minerals which are associated in large extentas organics. HREEs have more organic-bound affinity thanLREEs and extracted humic substances found enriched withMREEs (PePiper and Piper 2002;Wenfeng et al. 2008; Bonevet al. 2012).
Study conducted on Antaibo surface mine in China forrare earth distribution shows three patterns: shale like,LREEs enriched, and HREE rich which were recognizedfrom peat swamps, extent of aquatic control, and rare earthresources. Results indicate that extract was relativelyenriched in HREEs and depleted in middle rare earth ele-ments (MREEs) with negative anomaly. LREEs found inorganic matter of coal are mainly controlled by land-derived debris and partially with coal organic constituents,associated with hydrogen-containing functional groupswhich eventually influenced by seawater (Bonev et al.2012).
Extraction methods
Since the start of REE industry in the world, China has beenthe major producer and supplier until nowadays. If we look onthe present status of REEs in the world, limited literature isavailable, but it may be because apart from China, the rest ofthe world is not focusing on discovering new resources. Onereason could be on account for its waste generation, storage,and safe disposal because of its harmful radiations that havelong-lasting impacts on the whole ecosystem (Weber andReisman 2012; Liao et al. 2013; de Boer and Lammertsma2013).
Fig. 1 Rare earth elements distribution in a Bayan Obo, China, bMountain pass, USA, cMount Weld, Australia, and d Lahat, Malyasia (USGS 2013)
Environ Sci Pollut Res

Mining technique in the processing of REE depends ontheir oxide diversity. Different methods employed for REEare the following:
Surface mining: considered one of the best methods forREE extraction. For near surface deposits with lower grade,steeply dipping, or massive ore bodies, less than 100 m, open-pit mining is suitable involving digging or blasting ore, re-moving by truck or conveyer for stockpiling before process-ing. Shallow and deep parts of ores mined at single mine(combination of surface and underground mining).Bastanasite extracted by these methods. Banyan Obo depositin China and mountain pass deposits in California were minedfrom two large open pits (Jackson and Christiansen 1993). X-ray fluorescence for rare earth oxide mining involved blastholes drilled at 3–4 m spacing (Castor and Hedrick 2006).Mount Weld deposits in Western Australia, mined by openpit method. Dry and wet mining methods also encountered.Dry mining is suitable for hard bands of rocks, shallow de-posits and discontinuous ore bodies. Dredger typically usedfor submerged placer deposit extraction.
In situ mining: In Southern China, near surface and uncon-solidated nature, low grade ion adsorption deposits involvesimple mining and processing, reducing extraction cost(Kanazawa and Kamitani 2006). Deposits mined using openpit method, Jiangxi south rare earth Hi- Tech (SREC) devel-oped technique, involves drilling holes, leach reagent, enablerare earth rich reagent to collect in tank containing ammoniumcarbonate as precipitating reagent. Ninety percent REE recov-ered by leaching, followed by oxalic acid precipitate as oxa-lates, filtration, and finally roasting to rare earth oxide (Roskill2007).
Underground mining: depend on ore characteristic involv-ing standard mining methods with labor intensive drilling andblast techniques. Room and pillar, one of underground miningmethod, involve ore blasted, transportation to shaft by under-ground rail system. Russia mined Loparite using underground
and open pit method (Castor and Hedrick 2006). Elliot takemine in Canada extracted REE as a by-product in uraniumproduction by underground room and pillar methods(Bourzac 2010; Eliopoulos et al. 2012).
By-product production: Mineral sand deposit in Brazilworked exclusively on Monazite for thorium content andREE also extracted by sandmining as a byproduct in titanium,zirconium, and tin extraction. Mountain pass in WesternAustralia operated for REE rarely mined as basic or primaryproduct of mine (Gupta and Krishnamurthy 2005; LynasCorporation 2013). Main steps involved are shown in Fig. 2.
Most common chemical extraction method of rare earthoxides (REOs) separation is hydrometallurgy. Differentmethods employed for REOs production include solid-liquidextraction, liquid-liquid extraction, ion-exchange, super criti-cal extraction, solid phase, electro wining, electro refining,and electro slag refining (Meyer and Bras 2011). Bastnasiteextraction: Typical processes that increase REO percentagefrom 60 to 90 % include washing, leaching, filtering, calcin-ing, or drying. For every trace metal, calcination is performedto convert trace metal such as cerium to +4 valences leavingothers in +3 states, followed by acid digestion. High purityrare earth compounds (neodymium-praseodymium carbonate,lanthanum hydrate, cerium concentrate, samarium oxide,gadolinium oxide, terbium oxide, europium oxide) were ob-tained by running the resulting solution on multistage solventextraction (Kulaksiz and Bau 2011a). Monazite/xenotineextraction: Rare earth hydroxides beneficent produced byconcentrating ore digested with 70 % NaOH. RE chloridesrecovered by leaching with HCl, processed using multistagesolvent extraction to produce 95–99.995 % pure REOs.Tailing extraction: Mineral processing operations producetailing waste, acts as potential source of REOs. Apatite fromPea Ridge produces REOs by selective acid extraction andphysical separation techniques. US Bureau of Mines, recover90 % REOs and 70 % lanthanide concentrate by gravimetric
Fig. 2 Main steps in rare earthextraction, mining, andprocessing (Doris et al. 2011)
Environ Sci Pollut Res

processes (USGS 2010; Fornadel et al. 2011). Reductionprocesses: Three primary methods such as decrease in anhy-drous chlorides or fluorides, reduction of REOs, oxides-fluoride mixture, or fused salt electrolysis of RE chlorides,employed for the extraction of rare earth metals from com-pounds such as oxides or chlorides. Less common methodsemployed in the reduction include electrolysis, mercury amal-gamate oxidation and reduction, gaseous diffusion, vacuumdistillation, Si-octyl phenyloxy acetic acid treatment, and highperformance centrifugal partition chromatography.Reductants react with oxidants (oxygen, sulfide, carbonates)in the furnace to separate and free the metal (Gupta andKrishnamurthy 2004).
Analytical methods REE concentration in the environment isanalyzed by using different advanced spectroscopic tech-niques such as atomic absorption spectroscopy (AAS), induc-tively coupled plasma mass spectrometry (ICP-MS), isotopic-dilution thermal ionization mass spectrometry (ID-TIMS),and neutron activation analysis (NAA). Preconcentration suchas iron hydroxide precipitation, ion-exchange chromatogra-phy, or liquid-liquid extraction required for REEs as in unpol-luted water system ranged from ppm to ppt (Lawrence andGreig 2006; Makreski et al. 2011; Li et al. 2013). A highlyprecise and sensitive technique, i.e., neutron activation analy-sis for qualitative and quantitative detection, was discoveredby Hevesy and Levi in 1938. They found that samples ana-lyzed for REEs become radioactive after exposure to a sourceof neutrons and can be detected at low concentrations.Neutron activation analysis provides detection limits up to10−15 g/g (Krivan 1985; Li et al. 2013), whereas ICP-MSworks in high-temperature plasma.
Speciation and solubility of rare earths
Speciation of REEs usually determines solubility and bio-availability of a substance. It depends on salinity, pH, andpresence of anions (Liang et al. 2005; Ashraf et al. 2015).These parameters cause difference in REEs speciation in saltwater compared to fresh water which contains 70–96% of rareearth elements (REEs) as carbonate complexes, while freshwater is mostly impacted by humate complexes. At high pHcompared to LREEs, strong complexes with carbonate ionsare significantly made by HREEs, as with increase in atomicnumber, stability constant also increases, whereas at low pH,REE3+ and (REE)SO4
+ are more common. When hydrolysisis carried out at high pH (10), products such as REE(OH)2
+,REE(OH)3(aq), and REE(OH)4
− are more common.Generally, complex formation and low solubility product(Ksp) make the solubility of REEs low. Ksp of rare earthsphosphate can be as low as 10−25 mol2/I2 (Liu et al. 1997),while Ksp of RE carbonates and hydroxides at 25 °C is lowestas 10−30 mol5/I5 and 10−24 mol4/I4 respectively. Solubility
depends on pH and temperature. Each factor reduces the con-centration of dissolved rare earth element. In broad term, free-ly distributed ligands in the aquatic environment are consid-ered carbonates, phosphates, and hydroxides, as these de-crease concentration of rare earth elements (Delgado et al.2012a; Foucault-Collet et al. 2013; Pfau et al. 2013).
Speciation analysis is widely acknowledged in environ-mental chemistry as importance tool for metals state in anymedium. Chemical speciation encompasses functionally andoperationally defined speciation. Functionally definedspeciation determines speciation for plants in exchangeableform, while extractable forms of elements are determined byoperationally defined speciation. Many geochemical fractionsamong the sequential extraction schemes developed byTessier et al. (1979) and Kersten and Forstner (1986), respec-tively followed by five or six steps, were analyzed for metalsin soil and sediments (Clough et al. 2012; Ashraf et al. 2015).
Speciation study in soil
Heavy metal-contaminated soil in Sfax, Tunisia, was used forspeciation study using four steps BCR sequential extraction(Wali et al. 2014). Speciation could be helpful in developingeffective management strategies to control metal pollution inaffected area. First step involves extraction of exchangeableand soluble fractions, reducible fraction in the second step,while oxidizable fraction and residues were extracted in thirdand fourth step, respectively. Study indicates contamination oftop soil than other deep layers. Zn was mostly bound withnonresidual fractions of the soil, while Pb was bound to nearlyall fractions with 60 %. Other heavy metals (Cr, Cu, Ni, Fe)were also found in considerable amounts in all fractions ofsequential extraction (Clough et al. 2012; Dołegowska andMigaszewski 2013).
Qingsong et al. (2013) studied the contaminated soilaround the mining area to evaluate heavy metals by using foursteps BCR sequential extraction procedure. Procedure 1 con-sists of five steps, i.e., exchangeable, carbonates, iron- man-ganese oxide bound, organic bound, and residuals, while thesecond procedure includes all steps except organic matter. Inthe third procedure, exchangeable, water and acid soluble,reducible, oxidizable, and residual fractions were studied. Inthe fourth procedure, soluble and exchangeable, Mn oxides,organic matter, crystalline Fe oxides, and residuals were ana-lyzed. The results predicted that Fe and Zn mainly recoveredin the recalcitrant soil fractions, while Cd in the exchangeablefraction. Copper was found highly bound with soil organicmatter. Tessier and BCR procedures classify amorphous Fefraction in Silveira associated with Fe-Mn oxide fractions,while the crystalline Fe oxide fraction as residual fraction inSposito.
Speciation of rare earth elements (REEs) in lateritic profilesfrom Southern China was also conducted.Mobilization of rare
Environ Sci Pollut Res
earth elements (REEs) during weathering processes is alsowell recognized, but less data was found on REEs speciationin weathering profiles (Naji et al. 2011; Aiju et al. 2012). Dataanalysis describes fractionation during weathering. Light rareearth elements (LREEs) leached from top zone, extremelyenriched in the middle of profile, whereas heavier rare earthelements (HREEs) are found more depleted from bottom totop. Strong cerium anomalies are found in the oxidized soilzone. Exchangeable fractions are the highest carrier of rareearth elements with 40–90 %, while 10–30 % are Fe-Mn-bound oxides and 35 % in oxidized soil zone. Upper zonecontains 10–25 % organic-bound rare earths and 30 % inhumus layer. Positive cerium anomaly in this zone was foundwith greater than 50 % exchangeable in clayey zone, while upto 70 % bound to Fe-Mn oxides and in same percent ratio ofCe/Ce+ found in organic fractions. Study concludes that insoil clay minerals, Fe-Mn oxides and organic materials actas main trap for rare earth elements and carrier of ceriumanomalies.
Duan et al. (2002) determined REE in soil and sedimentswith NaOH-Na2O2 as flux, preconcentration technique forti tanium and iron hydroxides [Ti(OH)4-Fe(OH)3]coprecipitation, and ICP-MS as concise for multielement so-lutions batch analysis. Accuracy of the results was recognizedby Chinese soil (six samples) and sediments certified refer-ence materials (GSS and GSD) with less than 10 % relativestandard errors.
Results showed that in geological samples, tightlycoexisting Ti with Nb, Zr, Ta, and Hf causes completecoprecipitation and recoveries of these metals become lesswith a decreased trend in basicity.
Liu et al. (2013) determined rare earth elements (REEs) inChinese soil and clay reference material especiallyGBW03102 and GBW03102a by using mixture of HF andHNO3 acids in high temperatures and high pressures closedvessel digestion technique and detection of thirty seven (37)elements by ICP-MS. Results show precision lower than 5 %RSD, significantly different with reference values, reflectingthe existence of >70-μm coarse grained fractions in the sam-ple and formation of fluorides.
Zhang and Shan (2001) conquered rare earth elements(REEs) speciation in soil and their accumulation in wheat byusing RE-based fertilizers. Winter wheat variety, Triticumaestivm L., was investigated in the current study. It was foundthat accumulation behavior of La, Pr, Ce, and Nd varies de-pending on the concentration of fertilizer. Three stages se-quential extraction procedure adopted for the fractionation offertilized and unfertilized soil into three distinct fractions: wa-ter soluble, exchangeable and carbonate bound (B1), Fe-Mn-bound oxide (B2), and organic sulfide bound (B3). Significantnegative correlation was found between rare earth contents inroots and soil pH (r = −0.5787 to −0.8442 for La). Roots andshoots of wheat show considerable amounts of rare earth
elements. A significant correlation was obtained betweenREEs in B1 fraction and in the roots. In fertilized soil, rareearth elements were present in B2 and B3, while small amountin B1. Results show correlation coefficient ranging from0.6519 to 0.7410 when application of fertilizer was lower than20 mg/kg of the soil.
Tao et al. (2005) environmentally studied the biogeochem-ical activities of REEs in wheat and soil under different soilplant system in China due to increased utilization of REEs forindustrial and agricultural purposes by INAA and ICP-MS.Results indicate mean REE soil value 176.8 mg/kg withΣLREE/ΣHREEmean ratio of 8.0. REE in wheat seed rangedbetween 10−11 and 10−8 g/g in rye grass roots significantlyrelated to soil. REE contents in the spring wheat at maturingstage show ordered in roots > leaf > stem > crust.
Germund (2003) reviewed REEs in primary and secondarysoil minerals, surface soil, their solubility, and transport and inplant systems with distribution and localization in differentorgans, growth rate, crop production, plant physiology andbiochemical study, and soil-plant relationship and interac-tions. Study also focuses on some of the factors influencingadsorption and vertical distribution in soil profiles along withREE concentration. Due to weathering and leaching process-es, REE concentrations in surface soil of humid climate werefound lower than in parental material. Transfer ratio from soilto plant was observed low. Roots generally show high affinitythan shoots, and their uptake capacity was highly associatedwith soil acidity. Low concentration of REE favors plantgrowth and productivity. Due to increased Analytical tech-niques in environmental sciences, use of REEs as fertilizersin East Asian agriculture soil and in both pedagogical andphysiological processes contributes great interest for tracemetals.
Zhang et al. (2001) made possible the use of RE oxides forsoil erosion and aggregation studies as tracers. RE oxides wereapplied by examining the binding capabilities with soil andquick acid extraction procedures, as direct mixing of REEoxides not substantially alters the physicochemical propertiesof soil particles and aggregates. In the study, five REE oxidesin powder formmixed withMiami Silt Loam soil leachedwithwater to find the mobility of REES by simple acid leachingmethod. Samples analyzed on ICP-MS showed maximum co-efficient variation of <10 % for all REEs. Results also indicatethat direct application of REE oxides would be better compar-ative to other REEs.
Xinde et al. (2001) studied the REEs released from soil fortheir effect of redox potential and pH. Three pH values of 3.5,5.5, and 7.5 along with redox potential of 400, 0, and−100 Mv were applied by allowing oxygen and nitrogen toflow into the soil suspension. Results showed rapid release ofLa, Ce, Gd, and Y, which correlated positively with Fe-Mnindicating Fe-Mn oxyhydroxides under low pH conditionsand reduction, but Ce was remarkably influenced by redox
Environ Sci Pollut Res

potential. Low pH and redox potentials were found more fa-vorable. In exchangeable fractions, contents of La, Ce, Gd andY, and Fe-Mn fractions in solid phase release decrease as pHand redox potential decrease from soil solution.
Speciation study in water
When dealing with solutions like seawater, compounds inspecific oxidation states in speciation analysis can be recog-nized. However, it becomes very difficult to characterize ac-tual chemical form of elements. Rare earth metals detectedand evaluated in chemical speciation are important from en-vironmental point of view. Chemical speciation has been animportant method for metals chemical form detection and hasgained much attention in recent years. ICP-MS and GC-ICP-MS HPLC are known as best in all techniques. Two differenttypes of techniques such as nonnuclear and nuclear analyticaltechniques are used in speciation. In comparison with non-NATs, nuclear activation analysis techniques have unique fea-tures such as good accuracy, high sensitivity, precision, non-destructiveness, and reduced matrix effect. Sometimes, inchemical speciation, nonnuclear analytical techniques (non-NATs) and nuclear analytical techniques such as molecularactivation analysis (MAA), proton-induced X-ray emissiontechnique (PIXE), Mossbauer, and spectrometry or synchro-nous radiation-based analytical techniques are applied but dueto user’s difficult and expensive nuclear facilities specificallylimited to certain laboratories of the world.
Table 1 describes the essential features of these techniquesalong with ICP-MS for speciation study.
In recent years, rare earth elements (REEs) are extensivelyused in industries such as fertilizer and feed industry, agricul-tural, forestry, and animal husbandry. Due to large-scale use,rare earth elements (REEs) are getting into the environmentthrough many pathways, but their chemical speciation formsand biological effects have not been yet evaluated. Molecular
activation analysis (MAA) technique is based on instrumentalneutron activation analysis (INNA) that has been applied tostudy rare earth absorption, subcellular distribution, and rareearth element-binding macromolecules, e.g., DNA, proteins,polysaccharides in human beings, plants, and liver of rats.
Recent study was done on surface water speciation in exmining area, in Malaysia by Ashraf et al. (2015). Metal detec-tion for their speciation patterns was done by adsorptive strip-ping voltammeter (ASV), but metal particularly oxidationstate was determined by using new leaching sequential extrac-tion procedure involving five steps. Study indicates heavymetals such as Cu, Pb, Zn, Cr, As, and Sn bound with reduc-ible fractions, while Pb and Sn were also found in organicfractions of sequential extraction.
Butnariu et al. (2015) studied sorption capacity of rare earthpollutants using organic natural sorbents and proposed profi-cient and cost-effective environmental purposes. For deter-mining equilibrium sorption data, Langmuir, Freundlich, andRedlich-Peterson isotherms were used. The order for theseisotherms obtained in experimental data based on their coef-ficient of determination values is as follows: Langmuir >Redlich-Peterson > Freundlich. Bone powder was tested forits sorption capacity prepared in laboratory. Some of the char-acteristics of bone powder measured include humidity, proteincontent (14%), complex lipids (4.93 ± 0.01), Ca (13.4%), andP (7.2 %) after proximate analysis (Butu et al. 2014). Dataindicate higher adsorption capacity of bone powder in theremoval process of Nd(III), Eu(III), and La(III) from aqueoussolutions than Cs(I), Sr(II), and Tl(I).
Johannesson et al. (2004) predicted rare earth concentrationand speciation analysis in organic-rich black waters of theGreat Dismal Swamps in USA. REEs were found in highconcentration in the lake with acidic DOC-rich inflow andoutflow water. Middle REEs were in high concentration thanLREEs and HREEs. Speciation analysis significantly showsdissolved REEs bound with organic matter, and to determine
Table 1 Features of the mainNATs for chemical speciationstudy
Method Accuracy Sensitivity Spaceresolution
In situanalysis
Nondestructiveanalysis
Matrixeffect
Timeresponse
MAA Excellent High Low No No Less Slow
PIXE Middle Middle Middle-good
possible No Yes Fast
SRXRF Middle Middle Good possible No Yes Fast
EXAFS Middle Poor Good Yes Yes Yes Slow
XANES Middle Poor Good Yes Yes Yes Slow
Möss.Sp. Limited Poor Poor Yes Yes Yes Fast
IT Good High Possible Possible Yes Less Fast
ICP-MS Good High Low No No Severe Slow
MAA molecular activation analysis, which, in fact, is a combination of conventional neutron activation analysiswith chemical or biological separation; PIXE proton-induced X-ray emission; SPM scanning proton microscopy;SRXRF synchronous radiation X-ray fluorescence; EXAFS X-ray absorption fine structure spectrometry; XANESX-ray absorption near edge spectrometry; Möss.Sp. Mössbauer spectrometry; IT isotopic tracer
Environ Sci Pollut Res

REE complexation with natural organic l igands,ocresolphthalexon (OCP) ligand was used in adsorptive cath-olic stripping voltammetry (ACSV). pH and DOC were alsocorrelated to REEs and found DOC strongly related than pH.DOC was found to increase with increase in atomic number.
Mohammad et al. (1990) determined the trace lanthanidesand yttrium in the seawater after preconcentration by solventextraction and back extraction. Sample preparation needs only30 min using two internal standards, indium and cadmium.Method determines parts per trillion levels of REEs and yttri-um (Y). The standard deviation obtained for triplicate separa-tion of 100–1000-mL samples of the same seawater was betterthan 5 % for all REE. Contamination below 1 % appears,accuracy calculated to be less than 2.5 %. Results comparedwith isotope dilution with mass spectrometry coupled with Feco precipitation indicate good accuracy.
Renie and Janssen (2003)worked on geochemistry of REEin groundwater in the Netherlands. Samples taken from sevenbore holes. Results show shale normalized patterns generallyflat and REE probably of natural origin, behavior understoodby speciation and statistical data. Complexation and precipi-tation reactions including dissolved organic compounds(DOC) and inorganic compounds are encountered for specia-tion. The REE speciation showed REE3+, REE(SO4)
+,REE(CO3)
+, and REE(DOC) being the major species.Variation in REE concentration in groundwater affected bypH approved by statistical data (multiple linear regressions)is found successful.
Gwendy et al. (1994) studied the development and appli-cation of new, sensitive method ICP-MS to identify REE insurface water. Sensitivity ranges from 0.2 to 1 ng/L. Methodfollows automated preconcentration using Dionex Met PacCC-1 resin of iminodiacetate functionality. The 0.8 M HNO3
as eluant provides medium for analysis. Method applied on135 samples indicates no contamination from sampling bot-tles, during filteration and acidification. High degree of cor-relation in element distribution pattern between lake andcenter lake sediments for Yb and Tb was observed.Chondrite normalized plots show consistent pattern withgeological unit.
Hathorne et al. (2012)) worked on preconcentration of REEin Seawater by using 69 samples by using BseaFAST^ system(Elemental Scientific Inc.). Preconcentration of REEs wasdone using a resin with ethylenediaminetriacetic acid andiminodiacetic acid functional groups. Usually, a small samplevolume is used, but large data can be obtained for REEs withefficient separation by using ICP-MS.
Colin Neal (2007) studied the variations in REE concen-tration in the rivers of eastern England and borders withScotland’s known in relation to dissolved fraction(<0.45 μm) and AAP. Yttrium and lanthanum were foundin linear correlation. Lanthanum shows high concentration inthe rivers such as Great Ouse, Thames, and Wear linked to
pollutant sources. The Swale, one of tributaries of Ousewithin catchment and contamination of flood plains, wasconnected with mineralization that shows high samariumconcentration.
Leybourne et al. (1998) described detailed study of twoundisturbed sulfide deposits (Zn-Pb) to explain the processof controlling oxidation and dissolution of sulfide minerals,precipitation of secondary minerals, and subsequent disper-sion of metals in ground and surface waters of Restigoucheand Halfmile Lake deposits, Bathurst Mining Camp, NewBrunswick. Halfmile Lake waters show lower metal content.Depth and geometry of the massive sulfides and host litholo-gies for ground and surface waters show variation in theircomposition. The Restigouche groundwaters ranged up to21,000 mg/LTDS (Na–Cl waters) and display heavier oxygenand hydrogen isotopic compositions than local surface waters.Groundwater REE patterns, flat to LREE enriched and similarto host lithologies, unlike the surface waters were LREE-depleted compared to shale.
Leybourn et al. (2003) studied the stream water and sedi-ment geochemistry around volcanogenic massive sulfide(VMS) in the Bathurst Mining Camp, New Brunswick de-posits in Canada following partial extraction process formetals and REEs by using ICP-MS. Stream sediment compo-sition indicates the same behavior as surface water suggestingsurface water for mineral exploration purpose. Ionic compo-sition and hydrology of groundwater and surface water controlmagnitude of metals. A single partial extraction allows iden-tification of most labile phases (adsorbed and bound to amor-phous Mn and Fe oxyhydroxides) that yields greater anomalycontrast for some metals (e.g., Pb, Zn, Tl). At elevated metalcontents, Zn, Pb, and Tl are primarily hydromorphicallydispersed.
de Boer et al. (1996) determined the level of REE in Dutchdrinking water samples by ICP-MS with respect to isotopeselection, matrix effect, precision, spectral interferences, anddetection limits. Samples were taken from surface water,groundwater, two rivers Rhine and Meuse, and a lakeIjsselmeer. Results show more REE concentration in rawand drinking water. Phreatic winning of moderate depths hav-ing low carbonate contents and high concentration of REEwas found and at a pH of 5.44 and 6.13, REE totallydissolved.
Qiang et al. (2007) worked on the preconcentration of sol-uble REEs in seawater by newly synthesized alkyl phosphonicacid resin (APAS), determined by ICP-MS with detection lim-it from 1.43 pg/L of holmium to 12.7 pg/L of lanthanum.REEs recovered more than 97.9 % with 5 % precision ofrelative standard deviation (R.S.D., n = 6). For 200 samplevolume of REEs, enrichment factor of 400 achieved by onlinepreconcentration with APAR packed column (4.6 mmi.d. × 500 mm in length) eluted with 0.5 mL 0.1 mol/LHNO3 within 30 s.
Environ Sci Pollut Res

Results are shown in Figs. 3 and 4:Mohammad et al. (1992) developed a new and reliable
method for the separation of REEs from seawater sample bypreconcentration with minimum time consumption and laborby using ICP-MS. Adsorption of bis(2-ethylhexyl) hydrogenphosphate (HDEPH) and (2-ethylhyexyl) dihydrogen phos-phate on C8, due to complexing agent matrix elements passthrough to the drain and REEs removed through acid eluant.Method permits large enrichment factor 200–1000-fold.Technique used eight-channel peristaltic pumps with 1-L sam-ple at flow rate of 20 mL/min within 1 h. Contaminationdetermined less than 1 %. Average precision is calculated tobe 2.72 and 1.04 % respectively.
Kara et al. (2005) preconcentrated and analyzed the traceelements in natural waters and solid particles by using minicolumn packed with 2,6-diacetylpyridine functionalizedAmberlite XAD-4 on inductively coupled plasma mass spec-trometry (ICP-MS) or flame atomic absorption spectrometry(FAAS). Analysis showed good agreement with certifiedvalues. Metals eluted with 0.1 M HNO3 directly to detectionsystem. Resin work best at 5.5 pH. After digestion with NaF,sample contains large concentration of iron. Detection limitsobtained for trace elements for FI-ICP-MS systems are de-scribed as Ni = 0.30 μg/L, Pb = 0.43 μg/L, U = 0.067 μg/Land Zn = 0.20 μg/L, Cd = 0.33 μg/L, Co = 0.094 μg/L,Cu = 0.34 μg/L, Mn = 0.32 μg/L and for the FI-FAASCd = 22 μg/L, Co = 60 μg/L, Cu = 10 μg/L, andNi = 4.8 μg/L.
Cennet et al. (2012) determined REE (La, Ce, Pr, Nd, Sm,Eu, Gd, Tb, Dy, Ho, Er, Tm, Yb, and Lu) in the seawater byICP-MS with off-line preconcentration using micro columnpacked with 2,6-diacetyl pyridine functionalized amberliteXAD-4. Technique involves passing 2–10 mL of sample so-lution through column, residual matrix removal by ultrapurewater and removal of adsorbed cations on the resin by 0.1 mol/L HNO3 with 10 ng/mL indium as internal standard. Limits of
detection (3σ), without any preconcentration ranged from 2 to10.3 ng/L (for Tm and Lu, respectively). Sorption capacity ofresin determined by batch process for 4 h at pH 6 at 26 °Cfound between 47.3 and 136.7 μg/mol.
Yoshiyuki and Jing (1995) measured yttrium and all thelanthanides in seawater in mixing zone of Tokyo Bay watersand the Kuroshio by ICP-MS. Relative abundance of rareearth elements changes gradually and systematically. REEsinside the Bay removed by scavenging in the order of lightREEs > middle REEs > heavy REEs. Positive anomaly at Gdand negative at Tb and Tm is indicated by shale normalizedREE patterns, due to complexation with carbonate ions in thewater. REEs in Tokyo Bay waters enriched up to 10–34 timesand 6.6 times yttrium relative to Kuroshio surface water.Results also indicate yttrium best correlated with Ho, in agree-ment with previous observation in open ocean profile indicat-ed by Zhang et al. 1994.
Speciation study in plants
Scheme 1 shows chemical speciation study of rare earth ele-ments (REEs) in plants. REEs were found more susceptible toliver while they go into the blood stream of human or animalbody (Li et al. 2006; KulaksIz and Bau 2011b). Distributionpatterns of all rare earth elements in subcellular fractions inliver cells of human and rats were found comparable withhighest in microsomal fractions and lowest in systosolic frac-tions but in rare earth ions cultured rat cells, lanthanum, ceri-um, and gadolinium found mostly in nuclear fractions and cellmembrane (Lawrence 2010). Molecular activation analysistechnique also shows three lanthanum-binding proteins, threecerium-binding protein, and four samarium-binding proteinsin supernatant fraction of human liver sample. It also foundthat water-soluble rare earth elements (REEs) in the soil easilyassimilated in plant root firmly bound with cell wall while inmesophyll protoplast of Brassia napus, rare earth elements
Fig. 4 Comparison of REE concentrations in seawater with thosereported in the literature and the chondrite normalization pattern forREEs in Xiamen seawater
Fig. 3 Column effect of pH on percent recovery of rare earth elements(REEs): concentration of REE each, 1.0g/L; sample volume, 10 mL;sampling flow rate, 2.0mL/min; elution time, 0.5 min
Environ Sci Pollut Res

accumulated in chloroplast and show enhanced photosynthet-ic rate of crops because every 200 chlorophyll molecules con-tain single rare earth atom (Zhang et al. 2001). Dicronapterisdichotama, a highly rare earth enriched fern, show two rareearth element-binding proteins, four rare earth-binding poly-saccharides, and one rare earth element-binding DNA in theirleaves (Schuler et al. 2011).
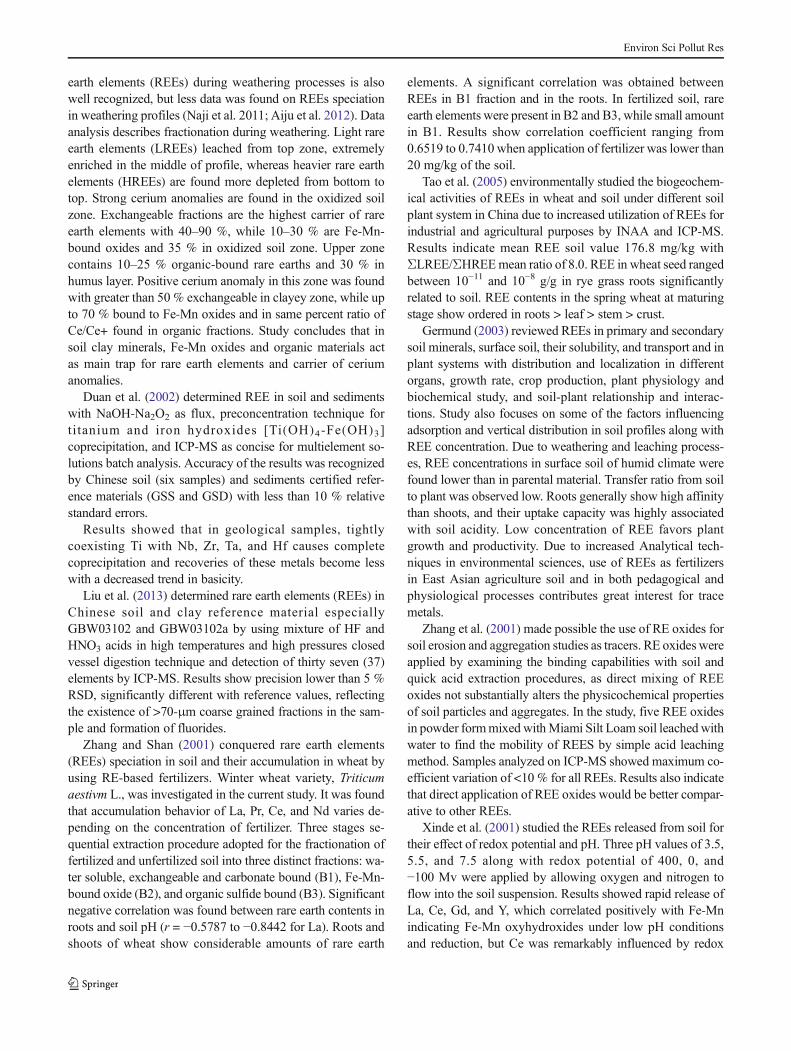
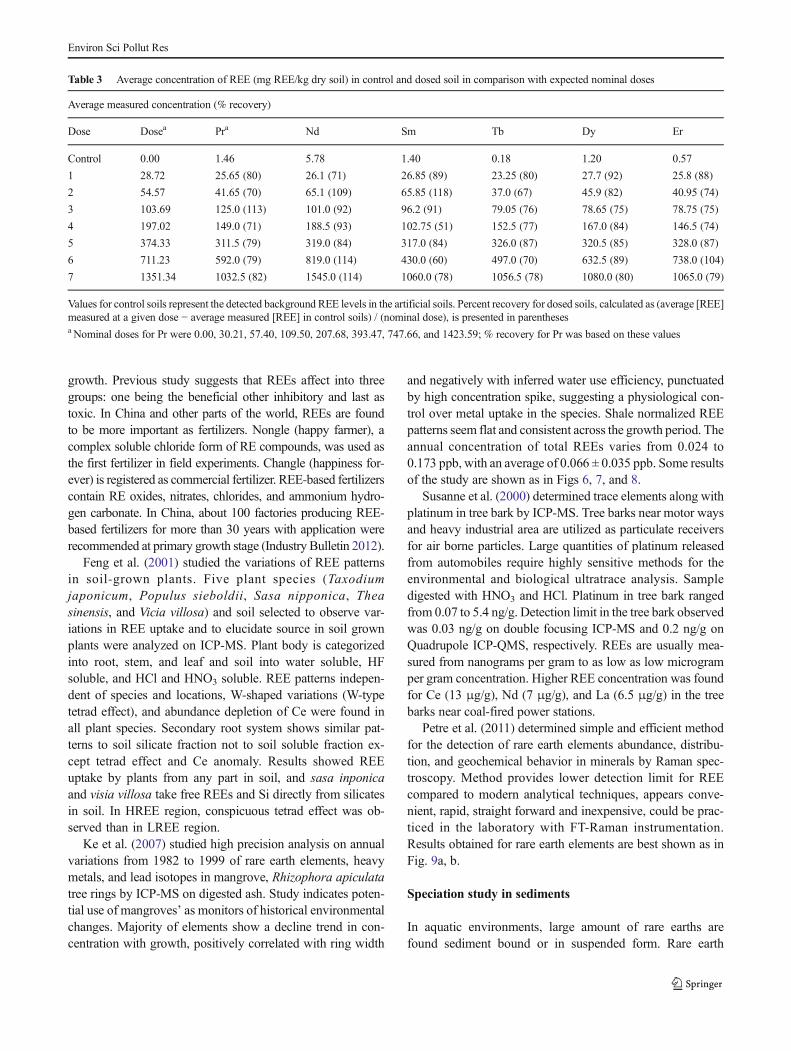
Carpenter et al. (2015) recently investigated REE-basedphosphate fertilizers that may increase the probability of en-vironmental contamination by these metals. Phytotoxicity anduptake capacity of rare earths from contaminated soil on threenative plants species and two crop species in separate dose-response experiments under growth chamber conditions weredetermined. REE uptake by plants was higher in the below-ground parts than in the aboveground plant tissues. Differentinhibition concentrations (IC25 and IC50) were measured be-cause of their tendency to reduce plant biomass. For the nativespecies, the majority of aboveground biomass IC25s (11 outof 18) ranged from 100 to 300 mg REE/kg of the dry soil. Thecrops were found greater than 400 mg REE/kg, with maxi-mum value of 700 mg REE/kg. Results are described inTables 2 and 3 and Fig. 5 as follows.
D. canadense was found with all REEs having major effecton root biomass ranging from 146.50 (Er) to 430.00 mg REE/kg (Sm). Although the dose at which the effects were prominentvaried greatly between the REEs ranging from 40.95 mg/kg forEr to 819.00mg/kg for Nd,A. syriaca show no effects observedin Nd or Dy, from 146.50 (Er) to 819.00 mg REE/kg (Nd),whereas P. virgatum also show no effects for Sm, Tb, or Dy,and from 152.50 (Tb) to 819.00 mg REE/kg (Nd) for S.lycopersicum, with no effects observed in Dy.
Cai (2012) studied the contents of heavy metals in lotusseeds and soil from REE-mining areas in China by using ICP-MS. The results showed that the contents of the heavy metalsCr, Mn, Cu, Zn, As, Cd, Hg, and Pb in lotus seeds were 0.25,86.94, 8.32, 19.76, 0.13, 0.08, 0.01, and 0.20 lg/g in lotusseeds, respectively, and corresponding contents in soil were27.68, 168.71, 20.23, 47.16, 1.83, 0.13, 0.04, and 23.15 lg/g.Data show the contents of heavy metals in lotus seeds fromREE-mining area not higher than reference area and meetnational food safety standards of China.
Tobacco and peach tree species and pasture grasses weresubjected to the application of REEs (20 μmol/L La or Ce) onpollens which demonstrate pollen tube germination and
Scheme 1 Speciation patternsfor studying rare earth elements(REEs) in soil plant system
Table 2 Plant species used inrare earth examination Species Common name Crop/
nativeFamily CC score
Asclepias syriaca L. Common milkweed Native Asclepiadaceae 0
Desmodium canadense (L.) DC Showy tickfrefoil Native Fabaceae 5
Panicum virgatum L. Switchgrass Native Poaceae 6
Raphanus sativus L. var. Sparkler Radish Crop Brassicaceae N/A
Solanum lycopersicum L. var. Beefsteak Tomato Crop Solanaceae N/A
a CC Score − coefficient of conservation. Available only for native (wild) species. Scores range between 0 and 10higher numbers indicate plants of higher conservation value as they have higher fidelities to specific sets ofecological/habitat variables
Environ Sci Pollut Res
growth. Previous study suggests that REEs affect into threegroups: one being the beneficial other inhibitory and last astoxic. In China and other parts of the world, REEs are foundto be more important as fertilizers. Nongle (happy farmer), acomplex soluble chloride form of RE compounds, was used asthe first fertilizer in field experiments. Changle (happiness for-ever) is registered as commercial fertilizer. REE-based fertilizerscontain RE oxides, nitrates, chlorides, and ammonium hydro-gen carbonate. In China, about 100 factories producing REE-based fertilizers for more than 30 years with application wererecommended at primary growth stage (Industry Bulletin 2012).
Feng et al. (2001) studied the variations of REE patternsin soil-grown plants. Five plant species (Taxodiumjaponicum, Populus sieboldii, Sasa nipponica, Theasinensis, and Vicia villosa) and soil selected to observe var-iations in REE uptake and to elucidate source in soil grownplants were analyzed on ICP-MS. Plant body is categorizedinto root, stem, and leaf and soil into water soluble, HFsoluble, and HCl and HNO3 soluble. REE patterns indepen-dent of species and locations, W-shaped variations (W-typetetrad effect), and abundance depletion of Ce were found inall plant species. Secondary root system shows similar pat-terns to soil silicate fraction not to soil soluble fraction ex-cept tetrad effect and Ce anomaly. Results showed REEuptake by plants from any part in soil, and sasa inponicaand visia villosa take free REEs and Si directly from silicatesin soil. In HREE region, conspicuous tetrad effect was ob-served than in LREE region.
Ke et al. (2007) studied high precision analysis on annualvariations from 1982 to 1999 of rare earth elements, heavymetals, and lead isotopes in mangrove, Rhizophora apiculatatree rings by ICP-MS on digested ash. Study indicates poten-tial use of mangroves’ as monitors of historical environmentalchanges. Majority of elements show a decline trend in con-centration with growth, positively correlated with ring width
and negatively with inferred water use efficiency, punctuatedby high concentration spike, suggesting a physiological con-trol over metal uptake in the species. Shale normalized REEpatterns seem flat and consistent across the growth period. Theannual concentration of total REEs varies from 0.024 to0.173 ppb, with an average of 0.066 ± 0.035 ppb. Some resultsof the study are shown as in Figs 6, 7, and 8.
Susanne et al. (2000) determined trace elements along withplatinum in tree bark by ICP-MS. Tree barks near motor waysand heavy industrial area are utilized as particulate receiversfor air borne particles. Large quantities of platinum releasedfrom automobiles require highly sensitive methods for theenvironmental and biological ultratrace analysis. Sampledigested with HNO3 and HCl. Platinum in tree bark rangedfrom 0.07 to 5.4 ng/g. Detection limit in the tree bark observedwas 0.03 ng/g on double focusing ICP-MS and 0.2 ng/g onQuadrupole ICP-QMS, respectively. REEs are usually mea-sured from nanograms per gram to as low as low microgramper gram concentration. Higher REE concentration was foundfor Ce (13 μg/g), Nd (7 μg/g), and La (6.5 μg/g) in the treebarks near coal-fired power stations.
Petre et al. (2011) determined simple and efficient methodfor the detection of rare earth elements abundance, distribu-tion, and geochemical behavior in minerals by Raman spec-troscopy. Method provides lower detection limit for REEcompared to modern analytical techniques, appears conve-nient, rapid, straight forward and inexpensive, could be prac-ticed in the laboratory with FT-Raman instrumentation.Results obtained for rare earth elements are best shown as inFig. 9a, b.
Speciation study in sediments
In aquatic environments, large amount of rare earths arefound sediment bound or in suspended form. Rare earth
Table 3 Average concentration of REE (mg REE/kg dry soil) in control and dosed soil in comparison with expected nominal doses
Average measured concentration (% recovery)
Dose Dosea Pra Nd Sm Tb Dy Er
Control 0.00 1.46 5.78 1.40 0.18 1.20 0.57
1 28.72 25.65 (80) 26.1 (71) 26.85 (89) 23.25 (80) 27.7 (92) 25.8 (88)
2 54.57 41.65 (70) 65.1 (109) 65.85 (118) 37.0 (67) 45.9 (82) 40.95 (74)
3 103.69 125.0 (113) 101.0 (92) 96.2 (91) 79.05 (76) 78.65 (75) 78.75 (75)
4 197.02 149.0 (71) 188.5 (93) 102.75 (51) 152.5 (77) 167.0 (84) 146.5 (74)
5 374.33 311.5 (79) 319.0 (84) 317.0 (84) 326.0 (87) 320.5 (85) 328.0 (87)
6 711.23 592.0 (79) 819.0 (114) 430.0 (60) 497.0 (70) 632.5 (89) 738.0 (104)
7 1351.34 1032.5 (82) 1545.0 (114) 1060.0 (78) 1056.5 (78) 1080.0 (80) 1065.0 (79)
Values for control soils represent the detected background REE levels in the artificial soils. Percent recovery for dosed soils, calculated as (average [REE]measured at a given dose − average measured [REE] in control soils) / (nominal dose), is presented in parenthesesa Nominal doses for Pr were 0.00, 30.21, 57.40, 109.50, 207.68, 393.47, 747.66, and 1423.59; % recovery for Pr was based on these values
Environ Sci Pollut Res

elements have high affinity to sediments (Hursthouse 2001;Li et al. 2013). Distribution coefficient of rare earth ele-ments in suspended matter and river water is about 31/kgdescribed by Maas and Botterweg (1993). Oceans havevalue around 4 with exception for Ce which is about 5due to low solubility main form of Cerium, i.e., CeO2 inwhich it is present in Ce4+ state, far away from normaltrivalent oxidation states of other rare earth elements. LogKp values (sediment to pore water) for rare earth elementsare much higher than other heavy metals. Variables likepH, salinity, organic carbon content, composition ofsuspended matter, and Fe-Mn-bound hydroxides constantlychange the equilibrium among sediment, pore water, andsurface water due to tidal movements causing change inrare earth concentration in each partition. Rare earth ele-ment concentration varies in the ecosystem compared toother metals. Concentration of La, Ce, and Nd tend to behigher than lead, while Tm and Lu (less abundant REEs)
have high concentration than cadmium in earth crust.Generally, odd numbered rare earth elements have lowerconcentration than even numbered elements. Cerium isfound highest in concentration, while Tm and Lu are abouttwo orders of magnitude lower than cerium. Main anthro-pogenic emission of rare earth elements is to the surfacewater, while most lanthanides accumulated in sediments. Inthe Netherlands, study indicates rare earths elements depo-sition associated with phosphatic fertilizers, and dischargefrom industries resulted in contamination of sediments inRhine R estuary with 170 mg/kg Ce, 80 mg/kg Nd, 30 mg/kg Pr, and 20 mg/kg Sm (Sneller et al. 2000). In Australia,lanthanum modified clay phoslock for phosphate removalfrom wastewater shows 400 μg/L La.
Fagbote and Lanipekun (2010) did speciation study on thesediments from Agbabu Bitumen deposit area, Nigeria, onheavy metals. Sequential extraction procedure consisting offive steps was adopted during dry and wet season. By
Fig. 5 Plant species showing dose response curves for roots grown in REE-contaminated soil
Environ Sci Pollut Res

comparing the results obtained from two seasons (dry seasonand rainy season), Cr was found in fraction 1 with 30 and35.82 % in dry and rainy seasons, respectively. Mn was alsofound high (23.73 %) in this fraction. In dry season and rainyseason, Zn was high in fraction 3 in 30.97 and 36.71 %, whileCu was found high in fraction 4 with 45.14 % in dry seasonand 29.28 % in rainy season. Other metals were found boundto fraction 5. Metals having high abundance in fraction 5
indicate lithogenic origin of metals, low mobility, low degreeof pollution, and bioavailability. Results are also indicated inFig. 10.
Wenfeng et al. (2008) studied the geochemistry of REE inaquatic influenced and organic solvent extracts coal fromAntaibo mining district in China. Twenty-six samples werecollected, analyzed by solid and organic solvent extracts oninductively coupled plasma atomic emission spectroscopy
Fig. 6 Mangrove tree ringsshowing annual trace elementvariations. Shadow barshighlighted show peaks.Correlation coefficients (R) anddashed lines presenting changingtrend over the mangrove growthperiod for trace elements
Environ Sci Pollut Res

(ICP-AES). Different distribution patterns observed shale like,LRRE rich, HREE rich, etc. Detrimental minerals mainly con-trol REEs in the coal, but seawater has considerable effect on it.
Kumar et al. (2014) deliberated the concentration of rareearth elements (REEs) in the surface mangrove sediments
collected from ten locations throughout the west coastMalaysia by instrumental neutron activation analysis(INAA). Samples were dried, crushed to powder, and weight-ed 150 mg for short irradiation and 200mg for long irradiationtime. REEs in the sample study were Dy, Sm, Eu, Yb, Ln, Tb,La, and Ce. Level of concentration of all REE varies in therange of 0.35–117.4 mg/kg by irradiation with neutron flux of4 × 1012/cm2/S1 at MINT TRIGA Mark II research reactor at750 kW by pneumatic transport facility. Results showed 0.75–6.75 enrichment factor and high LREE abundance than HREEdue to heavy mineral deposits in the current study area.
Mathew and Karen (2008) determined rare earth elementsand yttrium (REE + Y) in 500 stream water and sedimentsamples by total digestion and leaching with 0.25 M hydrox-ylamine hydrochloride in 0.05 M HCl and Fe-Mnoxyhydroxides phases with fractionation, speciation, and con-trols over REE + Y patterns in surface environment. REEpartitioned into dissolved (<0.45μm), labile (hydroxylamine),and detrimental sediment fractions in particular with respect toCe and Eu anomalies in oxygenated surface environments.Partial extraction recovered 20 % Fe in total sediments,80 % of Mn, and 21–29 % of REEs. Two main sources ofREE + Y in stream sediments found the hostile lithologies(mechanical dispersion) and hydromorphically transported(labile fractions) by comparison between REEs in water, par-tial extraction, and total sediment analysis. Results suggestsediment organic matter and δ-MnO2 (FeOOH) likely pre-dominant sinks for Ce and to lesser extent to other REE instream sediments. Results also indicate REEs normalized tothe North America Shale Composite, showing strongly nega-tive Ce anomalies ([Ce/Ce*] NASC ranged from 0.02 to 1.25,average = 0.277, n = 354) and positive Eu anomalies ([Eu/Eu*] NASC ranged from 0.295 to 1.77, average = 0.764,n = 84). Sediment have flatter REE + Y patterns relative toNASC ([La/Sm] NASC ranging from 0.352 to 1.12, aver-age = 0.778, n = 451) and are slightly middle REE-enriched([Gd/Yb] NASC ranged from 0.55 to 3.75, average = 1.42).
Germain et al. (2009) determined the rare earths elements,Sc, Y, Zr, Ba, Hf, and Th in geological samples by ICP-MSafter Tm spike addition and alkaline fusion (NaOH-Na2O2)and coprecipitation on iron hydroxides. Different rock-typesamples consist of basalt, ultramafic rock, sediment, soil,granite along with low trace element abundances (sub ng/g).Nine different geological samples were tested. Precision ratewas found better than 10 % observed for most samples and5 % below for the rare earth elements.
Tsuyoshi et al. (2003) determined REEs in the rock sampleby an improved high-performance ion chromatography.Technique provides cheaper means of obtaining high-qualityresults of all the 14 REE in sample as small as <50 mg andshowed potential as alternative to ICP-MS. Rare earth ele-ments (REEs) analyzed without any interference from yttriumand other transition metals by using high-resolution HPLC
Fig. 7 Solid line shows annual ring-width normalized element variationsin mangrove, while reference is indicated by dotted lines
Environ Sci Pollut Res

column. Japanese geological survey of 12 reference sampleswith variable element composition analyzed for REE showedreliable results in agreement with recommended values ob-tained by ICP-MS. REEs in the rock samples were measuredby HPIC with eluant used as α-hydroxyisobutyric acid and apost-column Asrenazo III.
Adam et al. (2003) studied the isotope dilution MC-ICP-MS rare earth elements concentration of 11 international geo-chemical reference materials NIST SRM 610, SRM 612,
SRM 614, BHVO-2G, BHVO-2, BCR-2G, JB-2, WS-E,W-2, AGV-1, and AGV-2. Rock powder and synthetic silicateglass material were analyzed in the study. Data gives abun-dance of mono-isotopic Pr, allowing precise check on anom-alous redox related behavior of Ce. For NIST SRM 610,USGS BHVO-2, AGV-1, and AGV-2, measured REEs abun-dance ranged typically <2 %. Results for some glass materialsand powders recommend concentration or dilution of REEcontents during glass manufacture and little fractionation.
Fig. 9 Raman spectra of aspessartine found by visible (488and 532 nm) and b almandinefound by visible (488, 514.5,532 nm) and near infrared(1064 nm) excitation
Fig. 8 Chinese loess normalizedREEs patterns and PAAS of themangrove tree rings. All ringsfrom different years includingthose not shown in the figureshave the similar REE pattern.Weak positive Ce anomalies andstrong positive Y anomalies arehighlighted shadow bars
Environ Sci Pollut Res

Materials analyzed in replicate provide data better than 1 % asreproducibility.
Bioavailability of REE
Bioavailability of REE in soil
REE is widely distributed in the biosphere. REEs can be ac-cumulated in different areas of the environment followinganthropogenic inputs because of the low mobility of theseelements. Life processes (physiological and biochemical) ofplants, soil, and living organisms are effected by rare earthe lements (Liu e t a l . 2011 ; Laveuf e t a l . 2008;Balabanova1et al. 2013; Rollinson 2014; Balabanova et al.2015). There is a scarcity of information on REE bioavailabil-ity in soil. REE content in soil range from 30 to 700 mg/kg(Bohn et al. 1985) moves through roots and abovegroundorgans in plants. Cerium, as the most dominant of the REEs,shows a certain variation compared with data from similarinvestigations; for example, in Australian soil, Ce ranges from21.0 to 120.3 mg/kg in Japanese soil and from 2.46 to 116mg/kg, and in Swiss forest soil, it ranges from 10.4 to 100.8 mg/kg. The contents of La in E. citriodora planted in La-treatedsoil were significantly higher than those grown in soil withoutaddition of La. This implies that the plant could take up La.Rare earth elements (REEs) distribution in automorphic andalluvial soil (top and subsoil samples) in the environs ofBregalnica River was studied by Balabanova et al. 2015.The distribution of the LREEs (La, Ce, Pr, Nd, Pm, Sm, Eu,and Gd) is predominantly related to the quaternary terracesand the Paleogene flysch. The element contents were deter-mined using inductively coupled plasma mass spectrometry.The mean value of the sum total of rare earth elements(ΣREEs) was determined to amount to 79.3 mg/kg. The con-tent of the light rare earth elements (LREEs) in the wholeinvestigated area ranges from 8.6 to 225 mg/kg, while the
content of the heavy rare earth elements (HREEs) ranges from0.92 to 33.7 mg/kg. Some of the results are described inTables 4 and 5 where the basic statistics for the REEs contentsin the topsoil layer are presented (Balabanova et al. 2015).
The distribution of this group of REEs shows signifi-cant differences in their contents in automorphic and allu-vial soils in areas with different geological bases shown inTable 5.
From the above table, it is indicated that the lanthanumcontents vary in the range of 1.6–42 mg/kg, with medianvalues of 19 mg/kg in the Kamenica–Zletovska RiversQuarter terraces. Lanthanum distribution is specifically corre-lated with the older volcanic formations of Paleogene flysch(with a median of 15 mg/kg). Cerium contents vary from 3.6to 65 mg/kg in the topsoil sample, with no significant varia-tions between the contents in the topsoil versus the subsoillayer. The HREEs (Tb-Dy-Ho-Er-Tm-Yb-Lu) are depositedas a geochemical association predominantly in automorphicsoil types on the terraces in the Bregalnica Basin (Balabanovaet al. 2013; Rollinson 2014; Balabanova1et al. 2015).
Bioavailability of REEs in the soil depends in exchange-able fractions that range from trace to 24 mg/kg and watersoluble content from 10 to 20 mg/kg (Zhu and Xi 1992; Zhuet al. 1997). The contents of REE, their distribution, and trans-formation in soil strongly affected by physicochemical prop-erties of the soil (Liang et al. 2005) including soil cation ex-change capacity (Li et al. 2001; Alonso et al. 2004), pH, or-ganic matter, and organic acids. At a higher pH level, theimmobilization by soil was found more rapid, and insolublecompounds would be formed when REEs reacted with hy-droxides or oxides. However, at low pH, they dissolved andso released the bound REEs (Shan et al. 2002; Ghaderi et al.2014).
In extracted soil, REE fractions are water soluble fractions,carbonate bound fractions, the exchangeable fractions, thesulfide bound fractions, the Fe-Mn oxide bound and organicmatter, and residual fractions (Wang et al. 2001c; Wali et al.
Fig. 10 Variations in heavymetals fraction in differentseasons in studied area
Environ Sci Pollut Res

2014). Higher concentration of rare earths in the soil maycause changes in the ecological system of microorganisms.REM concentration in soil solution mostly controlled byadsorption and desorption process acts as indicator of bio-availability of rare earths (Wang et al. 2003a). Adsorption
capacity varies with clay type and amount of amorphousiron and manganese oxides (Wen et al. 2001). Fast reactionsof REE with soil followed by sorption but slow desorptionrate results in low bioavailability with time and reduceduptake by plants.
Table 5 Distribution of REEs with significant differences in their contents in automorphic and alluvial soils in areas with different geological bases
Distribution of REEs in different geologic basin units and subareas in the investigated area (median values in mg/kg)
Element B-1(Q)
B-2(Q)
K-Z(Q)
T(Q)
S(Ng)
Basic geological formations F-ratio Sign
Pyroclastite(Ng)
Flysch(Pg)
Schist(Pz)
Schist(R)
Schist(Pt)
Gneisses(Pt)
Granite(Mz-Pt)
La 12 12 19 18 13 13 15 14 8.8 10 11 10 3.47 *
Ce 28 27 43 43 28 28 34 29 21 24 25 23 3.43 *
Pr 3.5 3.3 5.2 5.1 3.4 3.6 4.1 3.6 2.9 3.1 3.3 3.0 2.59 *
Nd 14 13 20 21 14 15 17 14 12 13 13 12 2.39 *
Sm 3.1 2.6 4.0 4.5 3.0 3.2 3.4 3.0 2.9 2.8 2.9 2.7 2.03 *
Eu 0.86 0.69 1.1 1.2 0.75 0.92 0.85 0.72 0.80 0.69 0.71 0.67 2.46 *
Gd 4.0 3.4 4.7 5.3 3.6 3.7 4.1 3.6 3.6 3.5 3.5 3.2 1.62 NS
Tb 0.57 0.49 0.64 0.75 0.50 0.52 0.56 0.51 0.53 0.51 0.50 0.45 1.41 NS
Dy 3.3 2.7 3.4 4.2 2.7 2.9 3.0 2.8 3.0 2.9 2.8 2.5 1.39 NS
Ho 0.65 0.55 0.64 0.81 0.53 0.55 0.57 0.54 0.59 0.56 0.53 0.47 1.39 NS
Er 1.7 1.4 1.7 2.3 1.5 1.6 1.6 1.5 1.7 1.6 1.5 1.3 1.32 NS
Tm 0.26 0.23 0.27 0.33 0.21 0.23 0.23 0.21 0.24 0.23 0.22 0.19 1.30 NS
Yb 1.6 1.4 1.7 2.1 1.4 1.5 1.5 1.4 1.6 1.5 1.4 1.3 1.18 NS
Lu 0.26 0.23 0.29 0.36 0.23 0.27 0.25 0.23 0.26 0.26 0.24 0.22 1.26 NS
Q quarter, Ng neogene, pg paleogene, Pz paleozoic, R Rifey (Late Precambrian), Pt proterozoic, Mz mesozoic, T terraces, S sediment
Table 4 The basic statistics for the REE contents in the topsoil layer (Balabanova et al. 2015)
Basic statistics for REEs contents (in mg/kg) in the top soil layer
Element X X (BC) Md Min Max P25 P75 S Sx CV A E A (BC) E (BC)
La 13 12 12 1.6 42 8.7 18 6.7 0.53 50 0.72 1.02 0.04 0.32
Ce 30 27 28 3.6 65 20 39 14 1.1 47 0.37 −0.64 0.02 0.11
Pr 3.8 3.4 3.7 0.48 7.8 2.6 4.8 1.7 0.13 44 0.36 −0.45 0.04 0.33
Nd 15 14 15 1.9 34 10 20 6.7 0.54 43 0.40 −0.19 0.04 0.46
Sm 3.3 3.1 3.2 0.43 8.2 2.3 4.3 1.4 0.11 42 0.58 0.50 0.06 0.70
Eu 0.85 0.78 0.84 0.12 2.3 0.58 1.0 0.37 0.030 44 0.83 1.43 0.06 0.81
Gd 4.0 3.7 3.8 0.56 11 2.9 4.8 1.7 0.13 42 0.83 1.41 0.09 1.04
Tb 0.57 0.52 0.54 0.088 1.7 0.40 0.67 0.25 0.020 44 1.20 2.76 0.09 1.24
Dy 3.2 2.9 2.9 0.50 10 2.2 3.8 1.5 0.12 47 1.49 3.69 0.09 1.44
Ho 0.62 0.55 0.56 0.099 2.1 0.42 0.72 0.30 0.024 49 1.64 4.23 0.08 1.53
Er 1.7 1.5 1.6 0.29 5.9 1.2 2.0 0.84 0.068 49 1.64 4.12 0.08 1.55
Tm 0.25 0.23 0.23 0.043 0.82 0.17 0.29 0.12 0.010 48 1.56 3.68 0.10 1.74
Yb 1.7 1.5 1.5 0.29 5.0 1.1 2.0 0.75 0.061 46 1.41 2.94 0.09 1.55
Lu 0.27 0.25 0.25 0.046 0.74 0.18 0.33 0.12 0.009 43 1.13 1.84 0.12 1.60
X average of not transformed values, BC average of the Box-Cox transformed values,Mdmedian,Minminimum,Maxmaximum, P25 25 percentile, P75
75 percentile, S standard deviation, Sx standard error deviation, CV coefficient of variation, A skewness, E kurtosis
Environ Sci Pollut Res

Bioavailability of REEs in plants
Mobility differs in different parts. The total REE concentrationincluded not only the portion available to plants but also thosestrongly bound within crystal structure of soil. EDTA en-hances the REEs uptake. Degree of translocation of REE inplants is 20 %, mostly present in roots, in intracellular andextracellular parts forming chelates with the components ofmetabolism (Tai et al. 2010). REEs in plants stimulate uptakeof certain elements and act like calcium by inhibiting calciumuptake. REE also effect enzyme activity, production, and in-tensity of photosynthesis, content of phytohormones, waterregime of plants, and water deficiency resistance, and putfavorable effects on seed germination (Liu et al. 2013).Some crops like sugar cane, sugar beet, and rice are favorablyaffected by REE. Rare earth elements in the grass roots de-pend on soil. Lots of research on biogeochemical behaviors(Zhang and Shan 2001) and effect of REEs on agriculturalecosystems divided into four periods include study on theefficiency of REE-based fertilizers, geochemical behavior ofREEs in ecosystem, practices on employing REE-based fer-tilizers, and physiological process of enhanced yield. REE-based fertilizers applied on tea plant for a safety interval of25 days between spraying and picking suggest REE boundwith polysaccharides which decreases with time (Wang et al.2003a). Rare earth-based fertilizers show increased concentra-tion of REE in roots, stem, and leaves (Wen et al. 2001). REEcontent in wheat seed ranged between 10−11 and 10−8g/g(Liang et al. 2005). REE-based fertilizers increased the yieldand quality of crops mostly used in China since the 1990’s.Every year, about 50–100 million tons of REE-basedsalvolatile and phosphate fertilizers enter the agriculture sys-tem causing adverse health effects and detrimental environ-mental issues through bioaccumulation through the food chain(Xiong et al. 2001). A lower pH favors the uptake of REEs byplants. Rhizosphere has a lower pH than the soil far away fromplant roots as root secretes acidic substances such as organicacids to facilitate the metal uptake. The result of the presentstudy shows that the final pH was lower than the preset pHwhich may be explained by the secretion. This would help thedissolution of metals, so more REEs appeared as free ions forplant assimilation. Organic matter in soil plays an importantrole in providing REEs to plants. Dissolved organic matterhad the highest affinity to REEs and was easily assimilatedby plants.
A study conducted by Tyler (2004) in a forest in Germanycomprises different varieties of plant materials, and concentra-tion of all REEs was also reported. Commercially grown cab-bage (Brassica oleracea var. capitata) shows very low con-centration with transfer factor 0.04–0.09, and also grassAgrostis capillaries grown in soil from the A-horizon of anacid Cambisol was also found with low concentrations.However, roots of plants such as maize and mung bean
indicate 20–150 times high La if grown in culture media(Tyler and Olsson 2001b), while root tips of rice and peaplants significantly show La and Yb in the xylem and endo-derm (Tyler 2004). Pteridophytes (ferns) are also well-knownas RE accumulators. Strong positive concentration anomaliesof La and Ce were reported in at least nine species of thegenera Dryopteris, Asplenium, Adiantum, and Dicranopterisin a Japanese study comprising 96 species of ferns (Ozakiet al. 2000). Norwegian mosses containing La and Y indicatetheir main origin from windblown minerals particles with lesscontribution from anthropogenic pollution. Leaf mesophylltissue contained 10–40 μg/g dry weight of La and 3–30 μg/g of Ce in the accumulators. Eichhornia crassipes root hairsadsorb Eu3+ on their root hairs surface. This is also supportedby the fact that carboxyl acid groups bind the Eu3+ on root hairsurface (Kelley et al. 2000). Pseudomonas aeruginosa havingcarboxylic and phosphate groups seem active in binding Eu3+
on extracellular sites (Tyler 2004).
Bioavailability of REE in aquatic environment
A key way for contaminants such as pharmaceuticals, person-al care products, steroids, and hormones to enter aquatic eco-systems is considered sewage treatment plants (STP).However, it is important to identify technologies that can min-imize the amount of these contaminants released. Previousstudies in chemical sediments have provided insights intothe composition of ancient seawater and the evolution of theenvironmental system based on the distribution of rare earthelements (REEs). In aquatic environments, total REE concen-tration provides low interpretation of REE potential interac-tion with biotic and abiotic components (Alexander et al.2009; Viehmann et al. 2014).
In organisms, bioaccumulation of REE depends on itsbioavailability. The physicochemical characteristics of or-ganisms influence the bioavailability of contaminant.Sediments are considered as major pollutants and wateras carrier and transporter. Fate of REE in aquatic environ-ments studied on different kinds of fishes (fish, daphnia,duckweed, shellfish) shows higher level of light REEs thanmedium and high REEs. Phytoplankton shows high-levelbioaccumulation of REE, suggesting that REEs have beenreleased in aquatic environment, phytoplankton prolifera-tion, eutrophication, and origination of algal flowers caus-ing acute or chronic changes in aquatic ecosystems. Mostof the available forms to plants are water soluble and ex-changeable forms (Zhang and Shan 2001; Cao et al. 2000;Wen et al. 2001; Xu et al. 2001). A precise correlation wasobserved between bioaccumulation values of rare earth el-ements (REEs) in plants and the enzyme activity ofglutamic oxaloacetic transaminase (GOT) that gives usefulinformation on the bioavailability and accumulation of rareearth elements (REEs) (Wen et al. 2002).
Environ Sci Pollut Res

Twelve-year study performed using foliar dressing of cornwith 15 mg/m2 of RE indicates no increase in REE concen-tration in treated areas rather than other parts (Wyttenbachet al. 1998a). REE concentration in plants reported to be verylow varies with plant species and growing conditions (Fenget al. 2001). For ordinarily plants, REE concentration range innanograms per gram. Higher REE concentration was found inrice than corn due to higher accumulation ability, but bothplants show high concentration in roots. Plants growing onmineralized grounds were reported to have high REE content.Beet and apple act as biological stores of REEs. Plants likeferns and hickory trees are capable of accumulating REE,called hyper accumulators (Wei et al. 2001; Xu et al. 2002).
By determining gadolinium content (more in top than inroots), safety level of agricultural application of REE wasestimated. REEs accumulate in the aquatic environment dueto increased industrial and agricultural application. REE entersthe groundwater by two means (Keasler and Loveland 1982):already present in soil dissolve in groundwater and reachingonto soil surface and migrate through soil layer to groundwa-ter. An inverse correlation between concentration of RE andriver water pH was also reported (Moermond et al. 2001;Astrom and Corin 2003). Alkalinity negatively correlates withlanthanide uptake that indicates reduced bioavailability. REEsconcentrate in the surface water up to 1 μg/L. In river water,high concentration of REE was found due to increased solu-tion complexation with ligands (F−, CO3
−2, OH−, HPO4−2).
Concentration of REE by a factor of seven in drinking watershows possible health risk to humans. Aquatic plants alsoshow susceptibility to REEs like general plants. Leaves ofthe plants exposed to atmospheric contaminants were foundable to take REE. It may conclude that high concentration ofREE in substrate water impairs aquatic flora. REE in substratewater at 0.4 ppm concentration shows accumulation in theplants 8.8 times higher especially leaves concentration ratioof 13.9 (Wyttenbach and Tobler 2002).
Bioaccumulation of REE in humans
In China, REE-accumulated plants enter the human foodchain through different pathways causing danger to publichealth (Naczynski et al. 2013). Small concentration ratio(CR) shows low transfer of REE from soil to plants. A fieldstudy reports mean concentration ratio (×10−4) for edible veg-etables of 22.5 for lanthanum, 16.8 for neodymium, and 9 forcerium (Zhang et al. 2000a). Different vegetable food stuffsshow REE concentration ranging from 0.5 to 2 ppm. Forhumans, sample’s acceptable daily intake (ADI) of rare earthnitrates is 0.2–2 mg/kg (Hutchison and Albaaj 2005), a safetystandard range of 12–120 mg/person/day (Zhu et al. 2002).Low level of REE in human tissues and fluids supports lowtransfer level of REE through food chain. Workers in REEmining area show high concentration in hairs, although
0.6 mg/mg3 concentration reported in atmosphere. Values de-fined in former Soviet Union account only one fifth of themaximum acceptable concentration of 5 mg/m3 (Hutchisonand Albaaj 2005). In areas with high REE concentration,humans show high deviation of blood parameters includingalbumin,β-globulin, serum triglycerides, and decrease in totalprotein, glutamic pyrovic transaminase, and increase in cho-lesterol. Study indicates irreversible blood changes in menthan in women (Krivans 1985).
In Jiangxi Province of China, rare earths mining activitiesare highly done and show strong correlation between the hairsof the mothers and their young children. Pair-comparison anal-ysis for the means showed that the average hair level of fivekinds of REEs in the young children was two times high astheir mothers. Results indicate children living in nearby areafound with maximum mean La concentration of 2202.9 ng/gthat decreases with increase in distance from the mining sites.The levels of REEs in the hairs can be used as a biomarker toreflect body’s level of exposure to REEs (Pang et al. 2002).
Bioavailability of REE in aquatic microcosm
The concentration of REEs in aquatic biota depends on up-take, elimination kinetic, and biologically active fraction, andthese fractions suggest that at organism level, physiologicalprocesses can also partly explain differences between species(Delgado et al. 2012b.
Xingye et al. (1999) studied the distribution and bioavail-ability of REE in static laboratory aquatic microcosm by ICP-AES. Results indicate adsorption of REEs by sediment anddesorption in water. Different aquatic species like Duckweedrepresented phytoplankton. Shellfish represented benthic spe-cies, gold fish represented fishes, and daphnia representedcrustacean in aquatic environment also studied for REE.Bioconcentration order in the species is as follows: duckweed> daphnia > shellfish > goldfish. In most of previous literature,La and Ce were found in aquatic ecotoxicity, while othersdescribe in relation with fish, algae, and arthropods(Veronica et al. 2014). For Potamogeton pectinatus, BCFvalues calculated in the same way were also similar acrossREEs but varied among sampling locations. Furthermore, adecrease in BCFs with increasing atomic number was ob-served when they were calculated as the ratio between con-centrations in biota vs. pore waters (Veronica et al. 2014). Lain different fish organs found with decreased bioconcentrationin the order: internal organs > gill > skeleton > muscle inCyprinus carpio, whereas muscles of flying squid(Sthenoteuthis oualaniensis) accumulate high REEs com-pared to liver which show decrease in bioaccumulation withincrease in atomic number (the Oddo-Harkins law).
Mussels and their shells have increasingly gained impor-tance as bioarchives of proxies that record physicochemicalchanges in their marine or freshwater habitat (Yang et al.
Environ Sci Pollut Res

2013; Merschel and Bau 2015). A new and more efficientprotocol for sample preparation and determination of REEconcentrations in bivalve shells was established byPonnurangam et al. (2015). The method proves quicker andcleaner and includes sample treatment with NaOCl followedby REE separation and preconcentration. Trace elements suchas the rare earths and yttrium (REY) have been shown to beuseful indicators of environmental change (Bau et al. 2010;Viehmann et al. 2014). The Mytilus edulis shells from theNorth Sea have Nd concentrations of 8.0 μg/kg (average forODAS), 6.1 μg/kg (Jade), and 8.7 μg/kg (Roter Sand), respec-tively (Zuykov et al. 2013).
Verplanck et al. (2010) studied the behavior of gadoliniumas tracer and contrasting agent in magnetic resonance imaging(MRI). Influent and effluent waters display large enrichmentsin Gd compared to other REEs. The excess concentration ofGd appears to retain in the liquid phase throughout the STPoperations.
Role of metal speciation in risk insight and remediation
Remediation of rare earths contaminated site is a compositedilemma due to different oxidation states, organic and inor-ganic complexes, and their toxicity that depends largely onchemical forms. Rare earth removal from contaminated siteis achieved by ensuring that said conditions can be sustainedfor a specific time (Morgan 2008). In soil, sediments andwater samples removal of trace elements need to consider allthe aspects of metallic contaminants transfer, speciation, andbioaccumulation (Tangahu et al. 2011).
The importance of metal speciation and bioavailability re-search to the development of pollution law and control tech-niques is increasingly evident (USEPA 2008a). These tech-niques have been appraised to be among the prerequisite ap-proach to determine fast and cheapmethods for remediating ofREEs from different contaminants. However, remediationtechniques and procedures are becoming increasingly morecostly. Speciation helps in developing effective and economicremediation strategies and governs its fate, mobility, toxicity,and bioavailability in sediment and water. Rare earth element(REE) detection and concentration in geological samples haveno longer been a curiosity but a substantial deal of interest forresearchers, industrialists, governmental agencies, and legis-lative bodies for environmental pollution/ contaminationmon-itoring and management.
When speciation is applied, we get information and inter-pretation which is not less than a powerful mean for consid-ering any remediation technique. Physiological and toxicolog-ical effects and bioavailability of trace metal contaminantsdepend on actual species present rather than total concentra-tion. Organometallic species of some metals are consideredmore toxic than organics (Tangahu et al. 2011; Kingsnorth2012). In a nutshell, chemical speciation and bioavailability
have played pivoted role in risk and hazard estimation, theirremoval techniques, and very time-consuming managementof REE-contaminated areas.
Environmental impacts of REEs
According to EPA, rare earth elements processing wastedumped in stream water possess hazardous potential, classi-fied as waste solvent due to ignitability, zinc waste with mer-cury contamination, spent lead filter cake due to toxicity, andsolvent extraction crud Eliseeva and Bunzli (2011). Duringmining and processing of REE, major environmental risk re-lated with the behavior and removal of tailings, due to waste-water, process chemicals, and high surface area particles. REEaffected areas, if not properly managed and controlled whenexposed to weathering, contaminate air, soil, and water. Thesolids, radionuclides, radons, and ore-associated metals act aspollutants in areas affected with REEs. Fugitive dust contam-inates air and soil in the surroundings. Precipitate events anddam overtopping transfer the pollutants from catchment tosurroundings soil and surface water bodies through surfacerunoff water. A serious long-term environmental damage oc-curred when dam fails due to poor construction or from cata-strophic events, termed as worst case scenario. Poor operation,design, handling, management of REEs mine, and concernedpollution control system collectively decrease the danger ofREEs contamination due to mining activities. Environmentalcomponents of sustainability are discussed in REEs operatingtechniques, both positively in terms of energy and negativelyas waste (Yang et al. 2013; Ichihara and Harding 1995); how-ever difficult to trace environmental aspects of REE comparedto others, situation becomes unclear and limited. In China,environmental degradation due to leaching has become a sig-nificant issue (Cui et al. 2009). Some industrial, hazardouswaste, when disposed off causes unrecovered REE. China ashigh in REE production causes serious environmental damagein areas with mining and processing, if in agreement withlimited environmental regulations. Bayan Obo mine after its40 years of operation radioactively contaminates soil, water,and vegetation. Chinese society of RE stated, every tons ofREE produced generate 8.5 kg of fluorine and 13 kg of dustalong with 9600–12,000 m3 of waste gases with dust concen-trate, SO2, 75 m
3 acidic wastewater, HF and 1 t of radioactivewaste residue. Saponification process produces harmfulwastewater. By estimation, up until 2005, process generates20–25,000 t of wastewater and 300–5000mg/L total ammonianitrogen concentration (Eliseeva and Bunzli 2011).
Radioactive elements like uranium and thorium associatedwith RE deposits pose key issue with processing and dispos-ing of waste. In the USA, Molycorp mountain pass site ob-served for wastewater and tailings as primary environmentalpollution source. To reduce its effects, dams used to disposetailings cause increase in TDS and neutralization of HCl in
Environ Sci Pollut Res

water with NaOH. TDS range 10,000 mg/L with low concen-tration barium, boron, strontium, and radiological constitu-ents. Metals, nutrients, and radiological constituents in waste-water and tailings show negative impact on groundwater qual-ity. From a social sustainability perspective point of view, ex-mining sites of REE were adequately rehabilitated for otheruses like Lynas corporation plant in Malaysia (Government ofJapan 2013). REE development puts social contribution to-ward green economy. After great centralization of supply inChina, efforts made on the development of optional re-sources—predictable resources like USA and Australia—re-duced China dominance of production of REEs to 86 % in2012 and unconventional resources like coal, coal ash, andrecycling and deep sea deposits that will be examined byJapan until 2018 (Calvert 2003; Richter and Schermanz.2006). Risks of REEs mining without any sufficient environ-mental protection schemes are shown in Fig. 11.
Conclusion
Rare earth elements will continue to be of considerable inter-est in future. Geological and mineralogical research must con-tinue for exploring REE ore deposits and extraction, importantto ensure funding of research from exploration, mining,
manufacturing, recycle, reuse, and disposal and together es-sential to maintain reliable and comprehensive information onREE geology, reserves, resources, production, trade, and con-sumption. This review briefly overlooks on different areas ofrare earths elements (REEs) showing any superior researchabout sustainability across many aspects, leaving significantgap in knowledge to future examination. Different techniquesand methods are available for finding REE in soil, sediment,and water samples. In mining processes, environment con-cerns must be paid, as all REE deposits contain radioactiveelements especially Thorium. Different methods of speciationin different samples have been discussed in detail coveringprevious research until recent times. Bioavailability of REEis also found in consideration. There is a need to remediatehazards of REE from our ecosystem.
US Geological survey (USGS 2010) estimates a sum of allRE oxides to 99,000,000 t quite high to estimated worldsproduction of 124,000 t in 2009. The major global reservesof REEs are spread in the USA, China, Australia, India,Canada, South Africa, Malawi, states from former SovietUnion, and other countries. Primarily, all deposits were foundto contain more LREE than HREE. Up to date, no data onoverall reserves of HREE is available, but large deposits ofHREE are found in China (97 % REEs), whereas mall amountis produced inMalaysia, Brazil, India, and Russia. Due to high
Fig. 11 Risks of REEs mining inmining areas without any propersafety and disposal. (Doris et al.2011)
Environ Sci Pollut Res

demand, many projects are aimed at opening of mines. Mostadvanced byMolycorp Minerals is the Mountain pass mine inCalifornia. In USA, complete REE supply chain is currentlylacking and must be developed nationally or in conjunctionwith other allies. China being the highest producer of REE stillneeds educated labor, technicians, scientists, and engineers.Generally, human capital investment in expertise and techni-cal capacity must be maintained and improved to reduce thegap between China and other countries. Green technologiescurrently use REE in magnets, energy efficient lightening,industrial catalysts, and batteries, for e-mobility, automotivecatalysts, metal alloys, ceramics, polishing, electronics, andglass additives. The global demand estimated in 2014 in-creases up to 170,000–200,000 t. High application of REEleads to high environmental risks. Main risk concerns withtailings are related to minute particles, wastewater, and chem-ical flotation which cause increase in concentration of mineore. Tailing exposed to risks like overtopping due to stormwater, seismic events, or poor construction. Recycling consid-ered much complex process, with no large-scale recyclingoperation. If no any reuse process is adopted, then physicaland chemical treatment must be done. Advantage of REErecycling includes utilization of resources, release from exter-nal resources, and environmental benefits. To carry on withREEs, still many obstacles are needed to cross. Time span formining operation takes 6–10 years. Increasing demand forREE production leads to increase in prices.
Acknowledgments This research is supported by High ImpactResearch MoE Grant UM.C/625/1/HIR/MoE/SC/04 from the Ministryof Education Malaysia. Thanks also for the support by UMRG(RG257-13AFR) and FRGS (FP038-2013B).
Compliance with ethical standards
Conflict of interest The authors certify that there is no conflict ofinterest with any financial organization regarding the material discussedin the paper.
References
Adam JR, Benjamin J, David WP, Tod EW, Joel AB (2003) Isotopedilution MC-ICP-MS isotope dilution MC-ICP-MS rare earth ele-ment analysis of geo-chemical reference materials NIST SRM 610,SRM 612, SRM 614, BHVO-2G, BHVO-2, BCR-2G, JB-2, WS-E,W-2, AGV-1, and AGV-2. Geo standard and Geo AnalyticalResearch 28:417–429
Aiju L, Yanchu G, Honghai W, Gao Peiling G (2012) An assessment ofheavy metals contamination in Xiaofu River sediments throughchemical speciation study. Int J Earth Sci 5(5):1235–1240
Alexander BW, Bau M, Andersson P (2009) Neodymium isotopes inArchean seawater and implications for the marine Nd cycle inEarth’s early oceans, earth planet. Sc Lett 283:144–155
Alonso ES, Callejon MA, Jimenez JC (2004) Speciation as a screeningtool for the determination of heavy metal surface water pollution inthe Guadiamar river basin. Chemosphere 56:561–570
Ashraf AM, Maah JM, Yusoff I, Ghararibreza M (2015) Speciation ofheavy metals in the surface waters of a former tin mining catchment.Taylor & Francis 24:1–12
AstromM, Corin N (2003) Distribution of rare earth elements in anionic,cationic and particulate fractions in boreal humus-rich streams af-fected by acid sulphate soils. Water Res 37(2):273–280
Balabanova B, Stafilov T, Sajn R (2015) Lithological distribution of rareearth elements in automorphic and alluvial soils in the Bregalnicariver basin. Maced J Chem Chem Eng 34:201–212
Balabanova B, Stafilov T, Šajn R, Bačeva K (2013) Spatial distributionand characterization of some toxic metals and lithogenic elements intopsoil and subsoil from copper mine environs, int. J Environ Protect3:1–9
BauM, Balan S, Schmidt K, KoschinskyA (2010) Rare earth elements inmussel shells of theMytilidae Family as tracers for hidden and fossilhigh-temperature hydrothermal systems, earth planet. Sc Lett 299:310–316
Bohn RL, Mc Neal BL, Conner OGA (1985) Soil chemistry, 2nd edition.York, John Wiley & Sons New
Bonev N, Dilek Y, Hanchar JM, Bogdanov K, Klain L (2012) Nd-Sr-Pbisotopic composition and mantle sources of triassic rift units in theSerbo-Macedonian and the western Rhodope massifs (Bulgaria–Greece). Geol Mag 149:146–152
Borovicka J, Kubrova J, Rohovec R, Randa Z, Dunn CE (2011) Uranium,thorium and rare earth elements in macrofungi: what are the genuineconcentrations? Biometals 24:837–845
Borrego J, Carro N, Lopez-Gonzalez N, de la Rosa J, Grande JA, GomezT, de la Torre ML (2012) Effect of acid mine drainage on dissolvedrare earth elements geochemistry along a fluvial–estuarine system:the Tinto-Odiel estuary (S.W. Spain). Hydrol Res 43:262–274
Bourzac K (2010) Can the US rare earth industry rebound. TechnologyReview, Boston: MIT
Bulletin I (2012) Chinese Ministry of Commerce Announces Rare-EarthExport-Quota Allocations for. http://avalonraremetals.comA reviewJ Plant Nutr 27:183–220
Butnariu M, Negrea P, Lupa L, Ciopec M, Negrea A, Pentea M, Sarac I,Samfira I (2015) Remediation of rare earth element pollutants bysorption process using organic natural sorbents. Int. J. Environ. Res.Public Health 12:11278–11287
Butu M, Rodino S, Pentea M, Negrea A, Petrache P, Butnariu M (2014)IR spectroscopy of the flour from bones of European hare. Dig JNanometer Biostruct 9:1317–1322
Cai D (2012) Contents of heavy metals in lotus seed from REEs miningarea. Journal of Saudi Chemical Society 16:175–176
Calvert JB (2003) Rare Earths. World Wide Web. http://www.du.edu/jcalvert/phys/rare
Cao X, Wang X, Zhao G (2000) Assessment of the bioavailability of rareearth elements in soils by chemical fractionation and multiple re-gression analysis. Chemosphere 40(1):23–28
Carpenter D, Boutin C, Allison JE, Parsons JL, Ellis DM (2015) Uptakeand effects of six rare earth elements (REEs) on selected native andcrop species growing in contaminated soils. PLoS One 10(6)
Castor, S. B., & Hedrik, J. B. (2006). Em Industrial Minerals and Rocks:Commodities, Markets, and Uses.
Cennet K, Derya K, Andrew F (2012) Determination of rare earth ele-ments in seawater by inductively coupled plasma mass spectrometrywith off-line column preconcentration using 2,6-diacetylpyridinefunctionalized Amberlite XAD-4. Anal Chim Acta 689:184–189
Chakhmouradian AR, Wall F (2012) Rare earth elements: minerals,mines, magnets (and more). Elements 8(5):333–340
Clough R, Lindsay R, Drennar H, Harrington CF, Hill SJ, Tyson JF(2012) Atomic spectrometry update: elemental speciation. J AnalAtomic Spectr 27:1185–1224
Environ Sci Pollut Res

Connelly NG (2005) Nomenclature of inorganic chemistry: IUPAC rec-ommendations. The red book Royal Society of Chemistry,Cambridge
Cui YC, Liu JH, Ren XW, Shi XF (2009) Geochemistry of rare earthelements in cobalt-rich crusts from the mid-Pacific M seamount. JRare Earths 27:169–176
de Boer MA, Lammertsma K (2013) Scarcity of rare earth elements.Chem Sus Chem 6:2045–2055
de Boer JLM, Verweij W, van der Velde-Koerts T, Mennes W (1996)Levels of rare earth elements in Dutch drinking water and itssources. Determination by inductively coupled plasma mass spec-trometry and toxicological implications. A pilot study. Water Res30(1):190–198
Delgado J, Perez-Lopez R, Galvan L, Nieto JM, Boski T (2012a)Enrichment of rare earth element as environmental tracers of con-tamination by acid mine drainage in salt marshes: a new perspective.Mar Pollut Bull 64:1799–1808
Delgado J, Perez-Lopez R, Galvan L, Nieto JM, Boski T (2012b)Enrichment of rare earth element as environmental tracers of con-tamination by acid mine drainage in salt marshes: a new perspective.Mar Pollut Bull 64:1799–1808
Dołegowska S, Migaszewski ZM (2013) Anomalous concentrations ofrare earth elements in the moss–soil system from south-CentralPoland. Environ Pollut 178:33–40
Doris S, Mattias B, Ran L, Georgr SD, Cornelia M (2011) Study on RareEarths and their Recycling. Oko- Institut eV institute for appliedEcology
Duan T, Chen H, Zeng X (2002) Determination of rare and rare earthelements in soils and sediments by ICP-MS using Ti(OH)4–Fe(OH)3 co-precipitation preconcentration. J Anal At Spectrom17:410–413
Ebrahim R, Khadijeh S, Saion B, Wood EAK, Reza AM (2009) Rareearth elements distribution in marine sediments ofMalaysia coasts. JRare Earths 27(6):1066
Eliopoulos DG, Economou-Eliopoulos M, Apostolikas A, Golightly JP(2012) Geochemical features of nickel-laterite deposits from theBalkan peninsula andGordes Turkey: the genetic and environmentalsignificance of arsenic. Ore Geol Rev 48:413–427
Eliseeva SV, Bunzli JCG (2011) Rare earths: jewels for functional mate-rials of the future. New J Chem 35:1165–1176
Fagbote EO, Lanipekun EO (2010) Speciation of heavy metals in sedi-ment of Agbabu bitumen deposit area Nigeria. J Appl Sci EnvironManage 14(4):47–51
Feng FF, Tasuku A, Sadayo Y, Masaya I (2001) The variation of REE(rare earth elements) patterns in soil-grown plants: a new proxy forthe source of rare earth elements and silicon in plants. Plant Soil 235:53–64
Fornadel AP, Spry PG, Melfos V, Vavelidis M, Voudouris P (2011) Is thePalea Kavala Bi-Te-Pb-Sb ± Au district, northeastern Greece, anintrusion-related system? Ore Geol Rev 39:119–133
Foucault-Collet A, Gogick KA,White KA, Villette S, Pallier A, Collet G,Kieda C, Li T, Geib SJ, Rosi NL, et al. (2013) Lanthanide nearinfrared imaging in living cells with Yb3+ nano metal organicframeworks. Proc Natl Acad Sci 110:17199–17204
Geoscience Australia (2012) Australia’s Identified Mineral Resources.Commonwealth of Australia Canberra
Germain B, Jean AB, Joel E, Mathieu B, Claire B, Sidonie R (2009)Determination of rare earth elements, Sc, Y, Zr, Ba, Hf and Th ingeological samples by ICP-MS after Tm addition and alkaline fu-sion. Geostandards and Geoanalytical Research 33(1):51–62
Germund T (2003) Rare earth elements in soil and plant systems – areview. Plant Soil 267:191–206
Ghaderi AA, Abduli MA, Karbassi AR, Nasrabadi T, Khajeh M (2014)Evaluating the effects of fertilizers on bioavailable metallic pollutionof soils, case study of Sistan farms Iran. International Journal ofEnvironmental Research 6(2):565–570
Government of Japan (2013) Basic plan on ocean policy. Headquartersfor Ocean Policy Government of Japan, Tokyo
Gupta CK, Krishnamurthy N (2004) Extractive Metallurgy of RareEarths. CRC Press Tylor and Francis
Gupta CK, Krishnamurthy N (2005) Extractive Metallurgy of RareEarths. CRC Press, Tylor and Francis p508
Haque N, Hughes A, Lim S, Vernon C (2014) Rare earth elements: over-view of mining, mineralogy, uses, sustainability and environmentalimpact. Resources 3:614–635
Hathorne EC, Haley B, Stichel T, Grasse P, Zieringer M, Frank M (2012)Online preconcentration ICPMS analysis of rare earth elements inseawater. Geochemistry, Geophysics, Geosystems 13(1).doi:10.1029/2011GC003907
Haxel GB, Hedrick JB, Orris GJ (2014) Rare earth elements criticalresources for high technology. USGS Fact Sheet:087–002
Heber A (2013) Solving a sticky situation: mineral processing is turninggreen to extract rare earths at cheaper rates. Australian Mining 60
Hurst C (2010) China’s Rare Earth Elements Industry: What Can theWest Learn?. Institute for the Analysis of Global SecurityWashington DC.
Hursthouse AS (2001) The relevance of speciation in the remediation ofsoil and sediments contaminated by metallic elements an overviewand examples from Central Scotland, UK. J Environ Monit 3:49–60
Hutchison AJ, Albaaj F (2005) Lanthanum carbonate for the treatment ofhyperphosphataemia in renal failure and dialysis patients. ExpertOpin Pharmacother 6(2):319–328
Ichihara M, Harding A (1995) Human rights, the environment and radio-active waste: a study of the Asian rare earth case in Malaysia. RevEur Community Int Environ Law 4:1–14
Jackson WD, Christiansen G (1993) International strategic minerals in-ventory summary report; rare-earth oxides (No. 930-N). US Dept. ofthe Interior, Geological Survey
Johannesson KH, Tang J, Daniels JM, Bounds WJ, Burdige DJ (2004)Rare earth element concentrations and speciation in organic-richblackwaters of the great dismal swamp, Virginia, USA. ChemGeol 209:271–294
Kanazawa Y, Kamitani M (2006) Rare earth mineral and resources in theworld. J Alloys Compd:408–412
Kara D, Fisher A, Hill SJ (2005) Preconcentration and determination oftrace elements with 2, 6-diacetylpyridine functionalized AmberliteXAD-4 by flow injection and atomic spectroscopy. Analyst 130(11):1518–1523
Ke FY, Balz SK, Michael GL, Alan G, Jian-Xin Z (2007) High-precisionanalysis on annual variations of heavy metals, lead isotopes and rareearth elements inmangrove tree rings by inductively coupled plasmamass spectrometry. Nuclear Instruments and Methods in PhysicsResearch B-beam Interactions With Materials And Atoms 255:399–408
Keasler KM, Loveland WD (1982) Rare earth elemental concentrationsin some Pacific northwest rivers. Earth Planet Sci Lett 61:68–72
Keith R, Long BS, Van G, Nora KF, Daniel C (2010) The Principal RareEarth Elements Deposits of the United States. A Summary ofDomestic Deposits and a Global Perspective U.S. GeologicalSurvey Reston Virginia, Scientific Investigations Report 2010-5220, p 1–96
Kelley C, Curtis AJ, Uno JK, Berman CL (2000) Spectroscopic studies ofthe interaction of Eu (III) with roots of water hyacinth. Water AirSoil Poll 119:171–176
Kersten M, Forstner U (1986) Water Sci Technol 18:121–130Kingsnorth D (2012) The rare earths industry: a delicate balancing act
technology metals summit, Centre for Research in energy and min-erals economics (Curtin University. Industrial Minerals Company ofAustralia Pty Ltd, Western Australia)
Krivan V (1985) Analytiker Taschenbuch, Frenius W, Gunzler Huber W,Luderwald I, Tolg G, Wisser H. Eds Springer Verlag Berlin, pp. 35
Environ Sci Pollut Res

Kulaksiz S, Bau M (2011a) Anthropogenic gadolinium as amicrocontaminant in tap water used as drinking water in urban areasand megacities. Applied Geochemistry 26(11) :1877–1885
KulaksIz S, Bau M (2011b) Rare earth elements in the Rhine River,Germany: first case of anthropogenic lanthanum as a dissolvedmicrocontaminant in the hydrosphere. Environ Int 37(5):973–979
Kumar K, Saion E, Halimah MK, Yap CK, Hamzah S (2014) Rare earthelement (REE) in surface mangrove sediment by instrumental neu-tron activation analysis. J Radioanal Nucl Chem 301:667–676
Kynicky J, Smith MP, Xu C (2012) Diversity of rare earth deposits: thekey example of China. Elements 8(5):361–367
Laveuf C, Cornu S, Juillot F (2008) Rare earth elements as tracers ofpedogenetic processes. Compt Rendus Geosci 340:523–532
Lawrence MG (2010) Detection of anthropogenic gadolinium in theBrisbane River plume in Moreton Bay, Queensland. Australia MarPollut Bull 60(7):1113–1116
LawrenceMG, Greig A (2006) Direct quantification of rare earth elementconcentrations in natural waters by ICP-MS. Appl Geochem 21:839–848
Leybourne MI, Goodfellow WD, Boyle DR (1998) Hydrogeochemical,isotopic, and rare earth element evidence for contrasting water–rockinteractions at two undisturbed Zn–Pb massive sulphide deposits,Bathurst mining camp, N.B. Canada Journal of GeochemicalExploration 64:237–261
Li X, Chen X, Chen Z, Zhang Y (2013) A human health risk assessmentof rare earth elements in soil and vegetables from a mining area inFujian Province, Southeast China. Chemosphere 93:1240–1246
Li D, Huang S, Wang W, Peng A (2001) Study on the kinetics of cerium(III) adsorption-desorption on different soils of China. Chemosphere44(4):663–669
Li G, Jiang J, et al. (2006) Effects of rare earth elements on soil faunacommunity structure and their ecotoxicity to Holotrichia Parallela.Ying Yong Sheng Tai Xue Bao 17(1):159–162
Liang T, Zhang S, Wang L, Kung HT, Wang Y, Hu A, Ding S (2005)Environmental biogeochemical behaviors of rare earth elements insoil-plant systems. Environ Geochem Health 27(4):301–311
Liao CS, Wu S, Cheng FX, Wang SL, Liu Y, Zhang B, Yan CH (2013)Clean separation technologies of rare earth resources in China. JRare Earths 31:331–336
Liu Y, Diwu C, Zhao Y, Liu X, Yuan H, Wang J (2013) Determination oftrace and rare-earth elements in Chinese soil and clay referencematerials by ICP-MS. Chin J Geochem 33:095––102
Liu Y, Peng Z, et al. (2011) Interannual variation of rare earth elementabundances in corals from northern coast of the South China Sea andits relation with sea-level change and human activities. Mar EnvironRes 71(1):62–69
Liu S, Wang L, Zhang S (1997) Effect of long-term foliage-dressing rareearth elements on their distribution, accumulation and transportationin soil-spring wheat system. Chin J Appl Ecol 8(1):55–58
Lynas Corporation (2013) Investor Presentation 1 August 2013.Available online:http://www.lynascorp.com/Pages/home.aspx(accessed on 16 Sept 2014). Lynas Malaysia Sdn Bhd. JalanGebeng 3, 26080 Kuantan, Pahang, Malaysia
Maas JL, Botterweg J (1993). Milieubezwaarlijkheid van zeldzameaardmetalen (lanthaniden, yttrium, scandium) in oppervlaktewater.Report No. RIZAnota 93.018
Makreski P, Jovanovski G, Runcevski T, Jacimovic R (2011) Simple andefficient method for detection of traces of rare earth elements inminerals by Raman spectroscopy instrumentation. Maced J ChemChem Eng 30(2):241–250
Melfos V, Voudouris P (2012) Geological, mineralogical and geochemi-cal aspects for critical and rare metals in Greece. Minerals 2:300–317
Merschel G, Bau M (2015) Rare earth elements in the aragonitic shell offreshwater mussel Corbicula fluminea and the bioavailability of
anthropogenic lanthanum, samarium and gadolinium in river water.Sci. Total Environ 533:91–101
Meyer L, Bras B (2011) Rare earth metal recycling. 2011 I.E.International Symposium on Sustainable Systems and Technology(ISSST), pp 1–6
Moermond CT, Tijink J, van Wezel AP, Koelmans AA (2001)Distribution, speciation and bioavailability of lanthanides in theRhine-Meuse estaury, the Netherlands. Environ Toxicol Chem20(9):1916–1926
Mohammad B, Shabani TA, AkimasaM (1992) Preconcentration of tracerare-earth elements in seawater by complexation with bis(2-ethylhexyl) hydrogen phosphate and 2-ethylhexyl dihydrogen phos-phate adsorbed on a C,8 cartridge and determination by inductivelycoupled plasma mass spectrometry anal. Chem 1002(64):737–743
Mohammad B, Shabani TA, Hiroshi S AkimasaM (1990) rDeterminationof Trace Lanthanides and Yttrium in Seawater by InductivelyCoupled Plasma Mass Spectrometry after Preconcentration withSolvent Extraction and Back-Extraction. Analytical Chemistry62(24):3964–3968
Morgan P (2008) Contaminated land remediation technology. Land re-mediation yearbook Retrieved from www. eic-yearbook.co.uk p39–42
Naczynski DJ, Tan MC, Zevon M, Wall B, Kohl J, Kulesa A, Chen S,Roth CM, Riman RE, Moghe PV (2013) Rare-earth-doped biolog-ical composites as in vivo shortwave infrared reporters. NatCommun 4:2190–2199
Neal C (2007) Rare earth element concentrations in dissolved and acidavailable particulate forms for eastern UK rivers. Hydrol Earth SystSa 11(1):313–327
Ozaki T, Enomoto S, Minai Y, Ambe S, Makide Y (2000) A survey oftrace elements in pteridophytes. Biol Trace Elem Res 74:259–273
Ozdes D, Diran C, Senturk BH (2011) Adsorptive removal of Cd (II) andPb (II) ions from aqueous solutions by using Turkish illitic clay. JEnviron Manag 92(12):3082–3090
Pang X, Wang DH, Xing XY, Peng A, Zhang FS, Li CJ (2002) Effect ofLa3+ on the activities of antioxidant enzymes in wheat seedlingsunder lead stress in solution culture. Chemosphere 47:1033–1039
PePiper G, Piper DJ (2002) The igneous rocks of Greece. BerlinGermany, Gebroder Borntraeger
Pfau C, Pablick C, Gray SK, Johnson JA, Johnson CE, Schweizer S(2013) Mossbauer spec t roscopy of europium-dopedfluorochlorozirconate glasses and glass ceramics: optimization ofstorage phosphors in computed radiography. J Phys CondensMatter. doi:10.1088/0953-8984/25/20/205402
PonnurangamA, BauM, BrennerM, KoschinskyA (2015)Mussel shellsofMytilus edulis as bioarchives of the rare earth elements and yttri-um distribution in seawater and the potential impact of pH andtemperature on the partitioning behaviour. Biogeosciences Discuss12:14911–14939
Qiang F, Limin Y, Qiuquan W (2007) On-line preconcentration with anovel alkyl phosphinic acid extraction resin coupled with inductive-ly coupled plasma mass spectrometry for determination of trace rareearth elements in seawater. Talanta 72:1248–1254
Qingsong HE, Yue R, Ibrahim M, Maha A, Waseem H, Fangui Z (2013)Assessment of trace and heavy metal distribution by four sequentialextraction procedures in a contaminated soil. Soil &Water Res 8(2):71–76
Renie PT, Janssen WV (2003) Geochemistry of some rare earth elementsin groundwater, Vierlingsbeek the Netherlands. Water Res 37:1320–1350
Richter H, Schermanz K (2006) Seltene Erden, in: Dittmayer R, KeimW,Kreysa G, Oberholz A (Eds.) Chemische Technik - Prozesse undProdukte Band 6b Metalle. Wiley-VCH Verlag Weinheim 5:147–208
Rollinson HR (2014) Using geochemical data: evaluation, presentation,interpretation, Taylor & Francis, London
Environ Sci Pollut Res

Roskill information services Ltd. (2007) The economics of rare earths andYtterium, 13th edition. Roskill, London, p 275
Schuler D, Buchert M, et al (2011) Study on rare earths and theirrecycling. Oko-Institut e.V., Darmstadt, Germany
Shan X, Lian J, Wen B (2002) Effects of organic acids on adsorption anddesorption of rare earth elements. Chemosphere 47:701–710
Skarpelis N (2002) Geodynamics and evolution of the miocene mineral-ization in the Cycladic-Pelagonian belt Hellenides. Bull Geol SocGreece 34:2191–2206
Sprecher B, Xiao Y, Walton A, Speight J, Harris R, Kleijn R, Visser G,Kramer GJ (2014) Life cycle inventory of the production of rareearths and the subsequent production of NdFeB rare earth perma-nent magnets. Environ Sci Technol 48:3951–3958
Sun Y, Liu DL, Yu ZQ, Zhang Q, Bai J, Sun DY (2003) An apoplasticmechanism for short term effects of rare earth elements at lowerconcentrations. Plant, Cell and Environment 26(6):887–896
Susanne BJ, Bellis D, Staton I, McLeod CW, Dombovari J, Becker S(2000) Determination of trace elements including platinum in treebark by ICP mass spectrometry. Fresenius J Anal Chem 368:490–495
Tai P, Zhao Q, et al. (2010) Biological toxicity of lanthanide elements onalgae. Chemosphere 80(9):1031–1035
Tangahu BV, Abdullah SRS, Basri H, Idris M, Anuar N, Mukhlisin M(2011) A review on heavy metals (as, Pb and Hg) uptake by plantsthrough phytoremediation. Int J Chem Eng p:1–31
Tao L, Shen Z, LijunW, Hsiang-Te K, Yuqi W, Aitang H (2005) ShimingD. Environmental biogeochemical behaviors of rare earth elementsin soil–plant systems Environmental Geochemistry and Health 27:301–311
Tessier A, Campbell PGC, Bisson M (1979) Anal Chem 51:845–851Tsirambides A, Filippidis A (2012) Exploration key to growing Greek
industry. Ind Miner:44–47Tsuyoshi I, Kenji S, Kazuya N (2003) Determination of rare-earth ele-
ments in rock samples by an improved high-performance ion chro-matography. Geochem J 37:671–680
Tyler G (2004) Rare earth elements in soil and plant systems - a review.Plant Soil 267(1–2):191–206
Tyler G, Olsson T (2001b) Plant uptake of major and minor elements asinfluenced by soil acidity and liming. Plant Soil 230:307–321
US Geological Survey (2010) Mineral commodities summary 2010. USDepartment of the Interior January 26. Retrieved fromhttp://minerals.usgs.gov/minerals/pubs/mcs/2010/mcs2010.pdf.Mineral Commodities Survey Report
USGS (2010) Rare Earth Elements in U.S. Not So Rare: SignificantD e p o s i t s F o u n d i n 1 4 S t a t e s h t t p : / / www. u s g s .gov/newsroom/article. asp?ID = 2642& from = rss_home). U.S.Department of the Interior. Full Report: The Principal Rare EarthElements Deposits of the United States—A Summary of DomesticDeposits and a Global Perspective (http://pubs.usgs.gov/sir/2010/5220/). Rare earths statistics and information
USGS (2013) USGS Minerals Information. Available online:http://minerals.usgs.gov/minerals/pubs/commodity/rare_earths(accessed on 11 Sept 2013)
Veronica G, Davide ALV, Corinne L, Laure G (2014) Environmental fateand ecotoxicity of lanthanides: are they a uniform group beyondchemistry? Environ Int 71:148–157
Verplanck PL, Furlong ET, Gray JL, Phillips P, Wolf R, Esposito K(2010) Evaluating the behavior of gadolinium and other rare earthelements through large metropolitan sewage treatment plants.Environ Sci Technol 44:3876–3882
Viehmann S, Homann JE, Munker C, Bau M (2014) Decoupled Hf-Ndisotopes in Neoarchean seawater reveal weathering of emerged con-tinents. Geology 42:115–118
Wali A, Colinet G, Ksibi M (2014) Speciation of heavy metals by mod-ified BCR sequential extraction in soils contaminated by
Phosphogypsum in Sfax, Tunisia. Environmental Research,Engineering and Management 4(70):14–26
Wang Z, Shan X, Zhang S (2001c) Comparison of speciation and bio-availability of rare earth elements between wet rhizosphere soil andair-dried bulk soil. Anal Chim Acta 441:147–156
Wang D, Wang C, Ye S, Qi H, Zhao G (2003a) Effects of spraying rareearths on contents of rare earth elements and effective componentsin tea. J Agric Food Chem 51(23):6731–6135
Weber RJ, Reisman DJ (2012) Rare earth elements: A review of produc-tion, processing, recycling, and associated environmental issues. USEPA Region.
Wei Z, YinM, ZhangX, Hong F, Li B, TaoY, Zhao G, Yan C (2001) Rareearth elements in naturally grown fern Dicranopteris linearis inrelation to their variation in soils in South-Jiangxi region (southernChina). Environ Pollut 114(3):345–355
Wen B, Shan X, Lin J, Tang G, Bai N, Yuan D (2002) Desorption kineticsof yttrium, lanthanum and cerium from soils. Soil Sci Soc Am J66(4):1198–1206
Wen B, Yuan D, Shan X, Li F, Zhang S (2001) The influence of rare earthelement fertilizer application on the distribution and bioaccumula-tion of rare earth elements in plants under field conditions. ChemSpeciat Bioavailab 13:39–48
Wenfeng W, Yong Q, Shuxun S, Yanming Z, Chaoyong W, Dominik JW(2008) Geochemistry of rare earth elements in a marine influencedcoal and its organic solvent extracts from the Antaibao mining district.Shanxi, China International Journal of Coal Geology 76:309–317
Weng ZH, Jowitt SM, Mudd GM, Haque N (2013) Assessing rare earthelement mineral deposit types and links to environmental impacts.Appl Earth Sci Trans Inst Min Metall B 122:83–96
Williams-Jones AE, Migdisov AA, Samson IM (2012) Hydrothermalmobilisation of the rare earth elements: a tale of ceria and Yttria.Elements 8(5):355–360
Wood AKH, Ahmed Z, Shazili NA, Yaakob R, Carpenter R (2004) Metaldigenesis and transport in coastal sediment around Penang Island,Malaysia. Journal of Nuclear and Related Technologies 1(1):1–30
Wyttenbach et al. (1998) Rare earth elements in soil and in soil grownplants. Plant Soil 199:267–273
Wyttenbach A, Tobler L (2002) Soil contamination in plant samples andin botanical reference materials. J Radioanal Nucl Chem 254(1):165–174
Xinde C, Ying C, XiaorongW (2001) Xihia D. Effects of Redox potentialand pH values on the release of rare earth elements from soilChemosphere 44:655–661
Xingye Y, Daqiang Y, Hao S, Xiaorong W, Lemei D, Yijun C, Mi C(1999) Distribution and bioavailability of rare earth elements inaquatic microcosm. Chemosphere 39(14):2443–2450
Xiong BK, Zhang SR, Guo BS, Zheng W (2001) Reviews of the use ofREEs-based fertilizer in the past of three decades. Symposium of theuse of REEs in agricultural of China. Baotou, P.R. China
Xu Z, Li D, Yang J, Peng A (2001) Effect of phosphate on the exchange-able form and the bioavailability of exogenous neodymium in soil.Huan Jing Ke Xue 22(3):66–69
XuX, ZhuW,Wang Z, WitkampG (2002) Distribution of rare earths andheavy metals in field-grown maize after application of rare earth-containing fertilizer. Sci Total Environ 293:97–105
Yang XJ, Lin AJ, Li XL, Wu YD, Zhou WB, Chen ZH (2013) China sion-adsorption rare earth resources, mining consequences and pres-ervation. Environ, Dev
Yoshiyuki N, Jing Z (1995) The rare earth elements and Yttrium in thecoastal/offshore mixing zone of Tokyo Bay waters and theKuroshio. In: Sakai H, Nozaki Y (eds) Biogeochemical processesand Ocean flux in the Western Pacific. Terra Scienetific PublishingCompany (TERRAPUB) Tokyo, Japan, p 171–184
Zawisza B, Pytlakowska K, Feist N, Polowniak M, Kita A, Sitko R(2011) Determination of rare earth elements by spectroscopic tech-niques: a review. J Anal At Spectrom 26:2373–2390
Environ Sci Pollut Res

Zdzislaw MM, Agnieszka G (2015) The characteristics, occurrence, andgeochemical behavior of rare earth elements in the environment: areview. Crit Rev Environ Sci Technol 45:429–471
Zhang SZ, Shan XQ (2001) Speciation of rare earth elements in soil andaccumulation by wheat with rare earth fertilizer application. EnvironPollut 112:395–405
Zhang H, Feng J, Zhu W, Liu C, Xu S, Shao P, Wu D, Yang W, Gu J(2000a) Chronic toxicity of rare earth elements on human beings:implications of blood biochemical indexes in REE high regions,South Jiangxi. Biol Trace Elem Res 73(1):1
Zhang XC, Friedrich JM, Nearing MA, Norton LD (2001) Potential useof rare earth oxides as tracers for soil erosion and aggregation stud-ies. Soil Sci Soc Am J 65
Zhu JG, Xi GX (1992) Study on the chemical form of REEs in soil bysequential extraction. Soil 24(4):215–218
Zhu JG, Chu HY, Xie ZB, Yagi K (2002) Effects of lanthanum on nitri-fication and ammonification in three Chinese soils. Nutr CyclAgroecosys 63:309–314
Zhu JG, ZhangYL, Yamasaki S, Tsumura (1997)Water soluble rare earthelements in some soils of China. In proceedings of 4th internationalconference on biogeochemistry of trace elements, Berkely CA, 23–26 June 1997, p 303–310
Zuykov M, Pelletier E, Harper DAT (2013) Bivalve mollusks in metalpollution studies: from bioaccumulation to biomonitoring.Chemosphere 93:201–208
Environ Sci Pollut Res