chemical kinetics and photochemical data for use ... · chemical kinetics and photochemical data...
TRANSCRIPT

JPL PUBLICATION 83-62
NASA-CR-175564 19850013539
Chemical Kinetics and Photochemical Data for Use ~_n Stratospheric Modeling Evaluation Number 6
NASA Panel for Data Evaluation:
W.B. DeMore Mario J. Molina R.T. Watson Jet Propulslcin Laboratory
D.M.Golden SRI International
September 15, 1983
NI\S/\ National Aeronautics and Space Administration
Jet Propulsion Laboratory California Institute of Technology Pasadena, California
Robert F. Hampson Michael J. Kurylo National Bureau of Standards
Charleton J. Howard NOAA EnVIronmental Research Laboratory
I A.R. Ravishankara Georgia Institute of Technology
LANGLCY RC:SE~RCH CL"lTER lIERIl.qy, NI~SA
HA'/PTml, VIRG'NIA:
111111111111111111111111111111111111111111111 NF00725
https://ntrs.nasa.gov/search.jsp?R=19850013539 2020-04-09T17:15:38+00:00Z

JPL PUBLICATION 83-62
Chemical Kinetics and Photochemical Data for Use in Stratospheric Modeling Evaluation Number 6
NASA Panel for Data Evaluation:
W.B. DeMore M.J. Molina R.T. Watson Jet Propulsion Laboratory
D.M. Golden SRI International
September 15, 1983
NI\SI\ National Aeronautics and Space Administration
Jet Propulsion Laboratory California Institute of Technology Pasadena, California
RF. Hampson M.J. Kurylo National Bureau of Standards
C.J. Howard NOAA Environmental Research Laboratory
A.R Ravishankara Georgia Institute of Technology
tJ 8 J:. ;J/ g.JjtJ iF
N-' 154-/333

This publication was prepared by the Jet Propulsion Laboratory. California Institute of Technology. under a contract with the National Aeronautics and Space Administration

INTRODUCTION •
BASIS OF THE RECOMMENDATIONS
DISCUSSION •
Ox Reactions
O(lD) Reactions
HOx Reactions
NOx Reactions
Halogen Chemistry •
Hydrocarbon Ox~dation
SOx Reactions
CONTENTS
- Photochemical Cross Sections
Status of Atmospheric Chemistry •
- Heterogeneous Effects
RATE CONSTANT DATA •
- ForMat
- Error Estimates
- Units
- Second-Order Reactions - Table of Data
- Second-Order Reactions - Notes
Three-Body Reactions - Table of Data
- Three-Body Reactions - Notes
iii
1
2
3
4
4
4
5
5
6
7
10
10
14
16
16
22
23
24
35
98
100

EQUILIBRIUM CONSTANTS
Format
Tal-Ie of Data
- Notes
PHOTOCHEMICAL DATA •
Discussion of Format and Error Estimates
Photochemical Reactions of Stratospheric
Interest - Table of data
Combined Uncertainties for Cross Sections and Quantum
Yields - Table of Data
- Data Entries
°2 03 (Table of Data)
H02 (Table of Data) •
H202 (Table of Data)
N02 (Tables of Data)
N03 (Table of Data)
N20 (Table of Data)
N205 (Table of Data)
HN02 (Table of Data)
HN03 (Tahle of Data)
HN04 (Table of Data)
C12 (Table of Data)
- C10 •
iv
108
108
110
111
113
113
115
116
117
119
121
122
123
127
130
131
132
133
135
136
137

CIaO (Table of Data)
OC10
C103 (Table of Data)
HC1 (Table of Data) •
HOC1 (Table of Data)
C1NO (Table of Data)
C1N02 (Table of Data)
C10NO (Table of Data) •
- C10N02 (Table of Data)
Halocarbon Absorption Cross Sections and Quantum Yields
CC14 (Table of Data)
CC13F (Table of Data) •
CC12F2 (Table of Data)
CHC1F2 (Table of Data)
CH3C1 (Table of Data)
CC120 (Table of Data)
CC1FO (Table of Data)
CF20 (Table of Data)
CH3CC13 (Table of Data) •
BrO (Table of Data) •
BrON02 (Table of Data)
HF
CO
CHZO (Table of Data)
CH300H (Table of Data)
- HCN •
v
138
139
140
141
142
144
146
147
148
150
152
153
154
155
156
157
157
157
159
161
163
164
165
166
167
168

168
- S02 • • • • • • • • . . . . . . . . 169
- OCS (Table of Data) . . . . . . . . 170
- CS 2 • • • • • • . . . . . . . . . . . . . . 172
REFERENCES • 173
Tables
1. Rate Constants for Second Order Reactions • • . . . . . . . . . . . 24
2. Rate Constants for Three-Body Reactions 98
3. Equilibrium Constants • 110
4. Photochemical Reactions of Stratospheric Interest • . . . . 115
5. Comhined Uncertainties for Cross Sections and Quantum Yields 116
6. Mathematical Expression for O(ID) Quantum Yields, ~, in the Photolysis of 03 • • • • 120
7. Absorption Cross Sections of H02 •••• 121
8. Absorption Cross Sectins of H202 Vapor •• 122
9. N02 Absorpt10n Cross Sections at 235 and 298K ••• 125
10. Quantum Yields for N02 Photolysis. 126
11. Absorption Cross Sections of N03 · . . . . . . . 129
12. Mathematical Expressions for Absorption Cross Sections of
N02 as a Function of Temperature . . . . . . . . . . . . . . 130
13. Absorption Cross Sections of N205 . . . . . . . . . . . . . . . . 131
14. HONO Absorption Cross Sections . . . · 132
15. Absorption Cross Sections of HN03 Vapor . . . . 134
16. Absorption Cross Sections of H02N02 Vapor • . . . . . . 135
17. Ahsorption Cross Sections of C12 136
18. Absorption Cross Sections of ClOO • . · . . . 138
V1
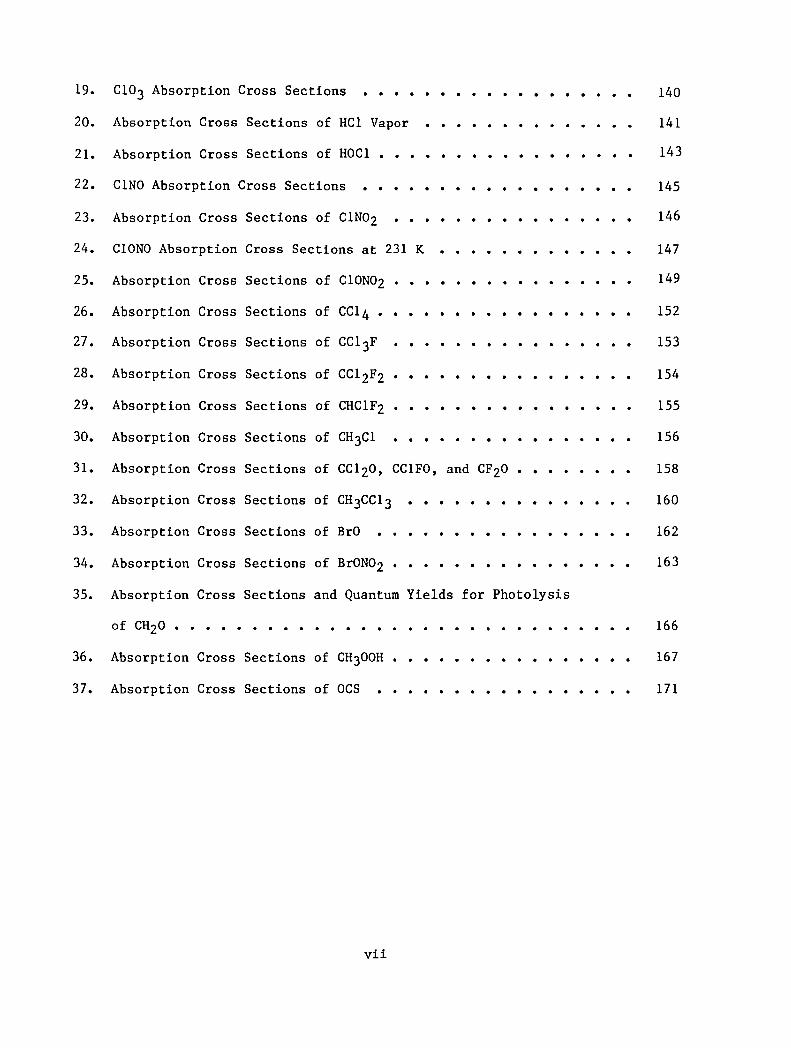
19. C103 Absorption Cross Sections · · · · · · · · · · · · · · · · 140
20. Absorption Cross Sections of HC1 Vapor · · · · · 141
21. Absorption Cross Sections of HOC1 · · · · · 143
22. C1NO Absorption Cross Sections · · · · · · · · · · · · · 145
23. Absorption Cross Sections of C1N02 146
24. C10NO Absorption Cross Sections at 231 K · · · · · · · · 147
25. Absorption Cross Sections of C10N02 · · · · · 149
26. Absorption Cross Sections of CC14 • · · · · · · · • • · · · · · 152
27. Absorption Cross Sections of CC13F · · · · · 153
28. Absorption Cross Sections of CC1 2F2 · · · · · · 154
29. Absorption Cross Sections of CHC1F2 · · · · · 155
30. Absorption Cross Sections of CH3C1 · · · · · · · · · · · · · 156
31. Absorption Cross Sections of CC120, CC1FO, and CF20 · · · · 158
32. Absorption Cross Sections of CH3CC13 · · · · 160
33. Absorption Cross Sections of BrO · · · · · · · · · 162
34. Absorption Cross Sections of BrON02 · · · · · 163
35. Absorption Cross Sections and Quantum Yields for Photolysis
of CH20 . . . . . . . . . . · · · 166
36. Absorption Cross Sections of CH300H • · · · · · · · · · · · 167
37. Absorption Cross Sections of OCS · · · · · 171
vii

This Page Intentionally Left Blank

ABSTRACT
This is the sixth in a series of evaluated sets of rate constants and
photochemical cross sections compiled by the NASA Panel for Data
Evaluation. The primary application of the data is in the modeling of
stratospheric processes, with particular emphasis on the ozone layer and
its possible perturbation by anthropogenic and natural phenomena.
ix

CHEMICAL KINETICS AND PHOTOCHEMICAL DATA
FOR USE IN STRATOSPHERIC MODELING
INTRODUCTION
The present compilation of kinetic and photochemical data represents
the sixth evaluation prepared by the NASA Panel for Data Evaluation. The
Panel was established in 1977 by the NASA Upper Atmosphere Research
Program Office for the purpose of providing a critical tabulation of the
latest kinetic and photochemical data for use by modelers in computer
simulations of stratospheric chemistry. The previous publications
appeared as follows:
Eyaluation Number
1
2
3
4
5
Reference
NASA RP 1010, Chapter 1 (Hudson, 1977)
JPL Publication 79-27 (DeMore et al., 1979)
NASA RP 1049, Chapter 1 (Hudson and Reed, 1979)
JPL Publication 81-3 (DeMore et al., 1981)
JPL Publication 82-57 (DeMore et al., 1982)
The present composition of the Panel and the major responsibilities
of each member are listed below:
w. B. DeMore, Chairman (Chapman chemistry)
D. M. Golden (three-body reactions)
R. F. Hampson (halogen chemistry)
C. J. Howard (HOx chemistry, O{1D) reactions)
1

M. J. Kurylo (SOx chemistry)
M. J. Molina (photochemical cross sections)
A. R. Ravishankara (hydrocarbon oxidation)
R. T. Watson (NOx chemistry).
As shown above, each Panel member concentrates his effort on a given
area or type of data. Nevertheless, the final recommendations of the
Panel represent a consensus of the entire Panel. Each member reviews the
basis for all recommendations, and is cognizant of the final decision in
every case.
BASIS OF THE RECOMMENDATIONS
The recommended rate constants and cross sections are based on
laboratory measurements, and in general only published data are
considered. Occasional exceptions are made when preprints of articles
submitted for publication are available to the Panel. In no cases are
ra te constants adjust ed to fi t observations of stra tospheri c
concentrations. The Panel does consider the question of consistency of
data with expectations based on kinetics theories, and in cases where a
discrepancy appears to exist, this fact is pointed out in the accompanying
note. The major use of theoretical extrapolation of data is in connection
with three-body reactions, in which the required pressure or temperature
dependence is sometimes unavailable from laboratory measurements, and can
be estimated by use of appropriate theoretical treatment. In the case of
a few important rate constants for which no experimental data are
available the Panel has provided estimates of rate constant parameters,
based on analogy to similar reactions for which data are available.
2

DISCUSSION
General State of Laboratory Kinetics
There have been no major changes in stratospheric chemistry since
the publication of our previous evaluation, JPL 82-57. There are
approximately twenty changes in the rate constant reoommendations in the
present evaluation, but these are for the most part minor. Seventeen new
reactions have been added, representing processes whioh play small but
possibly signifioant roles in the stratosphere. Some important
refinements have been made in certain key rate constants, such as those
for 0 + 03 and OH + Hel. These examples are typical of the set of
critical reactions which were carefully measured about five or ten years
ago, during the early stages of the stratospheric chemistry program.
While these measurements have generally stood the test of time, it is
appropriate to re-examine them to verity that the kinetic data being used
in the models are as accurate as possible. Such refinements will go hand
in-hand with the improved reliability of field measurement methods for the
in-situ measurement of trace species, permitting more exacting comparisons
of the model with observatio~
One important question whioh has been resolved during the past year
is that of possible isomer forma tion in the C10 + N02 reaction. Reoent
experiments, discussed in more detail in the section on three-body
reaotions, indicate that chlorine nitrate is the sole product of the
reaction.
3

Ox Reactions
The kinetics of the 0, 02' and 03 system appear to be well
established, al though in the present evaluation a small change has been
made in the rate parameters of the 0 + 03 reaction. There remains some
concern about possible roles of excited states of 02' especially 02(1t,),
but at present there is no evidence that these states have any important
effects on the overall chemistry of the stratosphere.
0(1D) Reactions
The data base for 0(1 D) reaction chemistry is in fairly good
condition. There is good to excellent agreement in independent
measurements of the absolute rate constants for 0(1D) deactivation by the
major atmospheric components, N2 and 02' and by the critical radical
producing components, H20, CH4, N20, and H2. There are fewer direct
studies of the products of the deactivation processes, but in most cases
these details appear to be of minor importance. Some processes of
interest for product studies include the reactions of O('D) with CH4 and
halo carbons. Possible kinetic energy effects from photolytically
generated 0(1D) are probably not important in the atmosphere but may
contribute complications in laboratory studies.
HOx Reactions
Our knowledge of the kinetics of HOx radicals has continued to
improve. For example, several new studies have been reported on the
H02 + H02 reaction. Although the reaction mechanism is complex and
demonstrates both bimolecular and termolecular behavior, independent
4

studies using different experimental techniques are in excellent
agreement. Data on the temperature dependence are also consistent. More
serious problems remain with the OH + H02 reaction, where there are
indications of a pressure effect but there are few data on this and the
temperature dependence. The reaction H + H02, which is important in the
upper stratosphere, has been added to the evaluation (Table 1).
NOx Reactions
The kinetics data for this class of reactions are considered
reliable, particularly following the recent improvements in the OH + HN03
and OH + HN04 rate constants. Furthermore, there are now measurements of
the temperature and pressure dependences of the H02 + N02 reaction.
Kinetic data for NH2 reactions has been added to this evaluation.
The status for this class of reactions is not so good as that for the
other NOx reactions. For nearly all NH2 reactions the value of k at 298 K
is uncertain by a factor of 2-3, the temperature dependences are not well
defined, and the reaction mechanisms are complex and not well understood.
Halogen Chemistry
The recommendations for the important C10x reactions have not
changed significantly since the previous evaluation (JPL 82-57). This
reflects the fact that from the standpOint of the CFM-03 question many of
the important rate constants have been measured reliably and
recommendations can be made confidently. There may be minor changes in the
rate constant recommendation for the reaction OH + HC1, since preliminary
results from several new studies are slightly higher than the current
5

recommended value. The table includes a new entry for the reaction of
chlorine atoms with CH3CC13. Other than a few minor refinements, there
have been no changes in the data base for BrOx and FOx reactions.
Hydrocarbon Oxidation
Our understanding of hydrocarbon oxidation in the atmosphere has
improved considerably in the past few years. All hydrocarbons are
released at the surface of the earth, and their degradation in the
troposphere is initiated by reaction with OH (and with ozone in the case
of olefins). Depending on their reactivity with OH, only a fraction of
the surface flux of hydrocarbons is transported into the stratosphere
where their oxidation serves as a source of water vapor. In addition,
reaction of Cl atoms with these hydrocarbons (mainly CH4) constitutes one
of the major sink mechansims for active chlorine. Even though CH4 is the
predominant hydrocarbon in the stratosphere, we have included in this
evaluation certain reactions of a few heavier hydrocarbon species.
In the stratosphere, CH4 oxidation is initiated by its reaction with
either OH or Cl (and to a limited extent 0(1D», leading to formation of
CH3 and subsequently CH302. Several details of the subsequent chemistry
are unclear, primarily because four key reactions are not well
characterized. These reactions are: (1) CH302 + H02' which exhibi ts an
unusual temperature dependence analogous to that for the H02 + H02
reaction; (2) CH30 + 02' which has not been directly studied at or below
room temperature; (3) CH300H + OH, which has been recently studied in a
competitive system and found to be extremely rapid; and (4) OH + CO, whose
pressure, O2 , and temperature dependence of the high pressure rate
6

coefficient are uncertain. Even though the rate constants for the four
reactions mentioned above are not very well known, the effects of these
uncertainties on stratospheric 03 perturbation calculations are
negligible.
The rate constant for CH302N02 formation from CH302 and N02 is well
defined. However, the role of CH302N02 in the stratosphere remains
unclear, owing to the lack of data on its thermal decomposition and
photolysis.
Formaldehyde photo-oxidation to form CO can be considered well
understood, especially since the rate of the HCO + 02 reaction is known.
The rates of the OH and 0(3p) reactions with CH20 and the photolysis cross
sections of CH20 are reasonably well know~
Another area of hydrocarbon oxidation which has seen a great deal of
improvement is that of product analysis. However, some additional work
may be required to measure branching ratios for reactions such as CH302 +
CH302·
The oxidation scheme for higher hydrocarbons has not been fully
elucidated. However, the rate of transport of these hydrocarbons into the
stratosphere can be easily calculated since the rates of reactions with OH
are well known. In most cases it is expected that the radicals formed
from the initial OH or Cl attack will follow courses analogous to CH3, and
ul timately lead to CO.
SOx Reactions
There have been a number of changes and additions to this section on
homogeneous sulfur chemistry. In particular, we now have more detailed
7

information on the rates of oxidation of SO by O2 and 03. Nevertheless a
complete description of SO oxidation by both radical and molecular species
cannot be presented at this time. Many SO reactions appear to occur with
rate constants greatly exceeding the NO reaction analogues. Further work
is still needed to fully assess the importance of SO reactions with
species such as OH, H02' ClO, BrO, etc.
Several reactions which have been suggested as candidates for
coupling the stratospheric chlorine and sulfur cycles have also been
added. While the limited data base does not support a coupling
hypothesis, in the absence of more detailed information we cannot
presently rule it out (particularly for atmospheric regions perturbed by
volcanic emissions).
More detailed evidence has been presented on the effect of molecular
oxygen on the reactions of certain sulfur containing compounds. The role
of the reaction of O2 with electronically excited CS2 has been documented
as an important tropospheric loss mechanism of CS2 and source of OCS.
Quantitative information has now become available regarding the
appreciable acceleration of the OH + CS2 reaction as a function of total
pressure, O2 partial pressure, and temperature in a mixed N2/02
environment. The results are strongly suggestive of the reaction of a
CS2-OH adduct intermediate with 02. While further such 02 reactions have
not yet been quantitatively appraised, their occurrence may be very
important to a complete understanding of SOx chemistry.
Among the simple bimolecular reactions, those involving sulfur atoms
are reasonably well defined for stratospheric purposes. However, our
understanding of atmospheric SH reactions, involved in the oxidation of
8

H2S, is not well defined and suffers from the absence of relevant rate
constant measurements. For example, the only loss mechanism for SH
currently included in Table 1 is the reaction with 02' Other reactions
with H02 or 03 may be important.
Another area of significant uncertainty is the oxidation of S02 into
sulfuric acid and its potential depletion of HOx radical concentrations.
Three possible mechanistic pathways exist for this oxidation resulting in
the loss of 0, 1, or 2 HOx radicals for each H2S04 formed. For example,
in the scheme
OH + S02 -+ HS03
OH + HS03 -+ H20 + S03
S03 + H20 -+ H2S04
two OH radicals are lost for each H2S04 formed. While the final reaction
in this sequence is probably heterogeneous in nature, the initiation steps
are most certainly homogeneous. If the second reaction is replaced by
the cycle leads to no net change in HOx per H2S04 formed. Another model
involving HS05 as an intermediate species results in a net loss of one HOx
per H2 S04 formed. Clearly additional information is needed to fully
understand aerosol formation via S02 oxidatio~
9
Photochemical Cross Sections
The absorption cross sections of 02 in the 185-210 nm range--i.e.,
in the Schumann-Runge bands and at the onset of the Herzberg continuum-
require further study; estimates of the penetration of UV radiation in the
stratosphere depend critically on these cross sections. Also, the
absorption cross sections of 03 and their temperature dependence should be
accurately remeasured in view of their importance for atmospheric modeling
and for interpreting Dobson and BUV data.
The temperature dependence of the absorption cross sections of
H02N02 and HN03 in the 300 om region should be determined.
Status Q! Atmospheric Chemistry
The ozone content of earth's atmosphere can be considered to exist
in three distinct regions, the troposphere, stratosphere, and mesosphere.
The unpolluted troposphere contains small amounts of ozone, which come
from both downward transport from the stratosphere and from in situ
photochemical production. The chemistry of' the global troposphere is
complex, with both homogeneous and heterogeneous (e.g., rain-out)
processes playing important roles. The homogeneous chemistry is governed
by coupling between the carbon/nitrogen/hydrogen and oxygen systems and
can be considered to be more complex than the chemistry of the
stratosphere, due to the presence of higher hydrocarbons, long
photochemical relaxation times, higher total pressures, and the high
relative humidity which may affect the reactivity of certain key species
such as H02• Significant progress is being made in understanding the
coupling between the different chemical systems, especially the mechanism
10
of methane oxidation, which partially controls the odd hydrogen budget.
This is an important development, as reactions of the hydroxyl radical are
the primary loss mechanism for compounds containing C-H (CH4, CH3Cl,
CHF2Cl, etc.) or C=C (C2C14, C2HC13t C2H4' etc.), thus limiting the
fraction transported into the stratosphere.
The stratosphere is the region of the atmosphere where the bulk of
the ozone resides, with the concentration reaching a maximum value of
about 5 x 10 12 molecule cm-3 at an altitude of -25 km. Ozone in the
stratosphere is removed predominantly by catalytic (i.e., non-Chapman)
processes, but the assignment of their relative importance and the
prediction of their futUre impact are dependent on a detailed
understanding of chemical reactions which form, remove and interconvert
the catalytic species. A model calculation of stratospheric composition
may include some 150 chemical reactions and photochemical processes, which
vary greatly in their importance in controlling the density of ozone.
Laboratory measurements of the rates of these reactions have progressed
rapidly in recent years, and have given us a basic understanding of the
processes involved, particularly in the upper stratosphere. Despite the
basically sound understanding of overall stratospheric chemistry which
presently exists, much remains to be done to quantify errors, to identify
reaction channels positively, and to measure reaction rates both under
conditions corresponding to the lower stratosphere (-210 K, -75 torr) as
well as the top of the stratosphere (-270 K, - 1 torr).
The chemistry of the upper stratosphere, i.e. 30-50 km, is thought
to be reasonably well defined, although there appear to be some
significant differences between the predicted and observed chemical
11

composition of this region of the atmosphere which may be due to
inaccurate rate data or missing chemistry. In this region the chemical
composition of the atmosphere is predominantly photochemically controlled
and the photolytic lifetimes of temporary reservoir species such as HOC1,
H02N02, CION02, N205 and H202 are short and hence they play a minor role.
Thus the important processes above 30 km all involve atoms and small
molecules. The majority of laboratory studies on these reactions have
been carried out under the condi tiona of pressure and temperature which
are encountered in the upper stratosphere, and their overall status
appears to be good. No significant changes in rate coefficients for the
key reactions such as CI + 03 , 0 + C10, NO + CIO, 0 + N02, NO + 03' etc.,
have occurred in the last few years. Historically, a major area of
concern in the chemistry of the upper stratosphere has involved the
reaction between HO and H02 radicals, which, as previously discussed in
this section, has had considerable uncertainty in the rate constant. This
HOx termination reaction plays an important role in determining the
absolute concentrations of HO and H02, and since HO plays a central role
in controlling the catalytic efficiencies of both NOx and C10x ' it is a
reaction of considerable importance. Recently the uncertainty in the rate
coefficient for the reaction has decreased, now being thought to be about
a factor of 1.5 over the entire range of atmospheric conditions. It
should be noted that the HO + H202, HO + HN03 and HO + H02N02 reactions
have little effect on controlling the HOx concentrations above 30 km. For
reactions such as 0 + HO and 0 + H02, which control the HOx radical
partitioning above 40 km, the data base can only be considered to be quite
good.
12

One area in which additional studies may be needed is that of
excited state chemistry, i.e., studies to determine whether electronic or
vibrational states of certain atmospheric constituents may be more
important than hitherto recognized. Possible examples are 02*' 03*' HO*,
or N2*.
The chemistry of the lower stratosphere is quite complex, with
significant coupling between the HOx, HOx and C10x families. It is within
this region of the atmosphere (15-30 km) where both dynamics and
photochemistry play key roles in controlling the trace gas distributions.
It is within this region of the stratosphere that the question of the
pressure and temperature dependences of the rate coefficients is most
critical, due to the low temperatures (210-255 K) and the high total
pressures (30-200 torr). The question of possible pressure and
temperature dependences of HO and H02 reactions is highly pertinent here.
Our view of the chemistry of the lower stratosphere has changed in
recent years, due to changes in rate constants which have in turn led to
changes in the relative importance of reactions which control the HOx
budget in this region of the atmosphere. Prior to the appearance of
improved kinetics data for the HO + H202, HO + HN03' and HO + H02N02
reactions, the maJor termination reaction for odd hydrogen species in
models of the lower stratosphere was the HO + H02 -+ H20 + 02 reaction.
However, the HO + HN03 and HO + N02N02 reactions are now thought to play a
vital role in controlling the HOx radical concentration in the lower
stratosphere. The species HN03 , H02N02, C1N03 and HOCl illustrate the
strong coupling that exists between the HOx, NOx and C10x families. One
disturbing problem is that while these species are currently thought to
13

play an important role in stratospheric photochemistry, only HN03 has yet
been positively observed by any field measurement study.
Heterogeneous Effects
A continuing question in stratospheric modeling is whether or not
aerosols perturb the homogeneous chemistry to a significant degree.
Effects could arise through the following processes:
1. Surface catalysis of chemical reactions.
2. Production or removal of active species.
3. Effects of aerosol precursors.
The aerosol question now assumes more relevance in view of the 1982
eruption of the El Chichon volcano, which evidently increased the aerosol
loading by approximately an order of magnitude. This effect is of course
temporary, with a recovery time of the order of a few years.
In NASA Reference Publications 1010 and 1049, processes 1 and 2
above were discussed in general terms. It was shown that, with a few
possibly significant exceptions, surface catalysis of chemical reactions
is not expected to compete with the rates of homogeneous gas phase
reactions. The essential reason was that the frequency of collision of a
gas phase molecule with the aerosol surface is typically of the order of
104 to 105 sec-1, whereas most of the key gas phase reactions, for
example, conversion of atomic oxygen to 02 by the 0 + 03 reaction, occur
with much greater frequency. Thus, even in the unlikely case of unit
reaction efficiency on the aerosol surface the heterogeneous process
cannot be significant. Possible exceptions occur for reactions which are
extremely slow in the gas phase, such as hydrolysis of an anhydride, as in
14

the reaction N205 + H20 + 2HN03' There remains some uncertainty with
regard to the role of these latter processes.
It was also shown in NASA 1010 and 1049 that there is no evidence
that aerosols serve as significant sources or sinks of the major active
species such as chlorine compounds. However, Hunten llU. (1980) have
suggested that dust particles of meteoric origin may scavenge metallic
atoms and ions, and in particular may remove Na diffusing from the
mesosphere in the form of absorbed NaOH or Na2S04'
Although it appears that aerosols do not greatly perturb the ambient
concentrations of active species through direct interaction with the
surfaces, the aerosol precursors may significantly perturb the
stratospheric cycles through removal of species such as OH radicals. For
example, a large injection of S02, such as that which occurred in the El
Chichon eruption, has the potential of significantly depleting HOx radical
concentrations, as was discussed in the section on SOx chemistry. It must
be reiterated, however, that the detailed mechanism of S02 oxidation is
not known with certainty, and therefore it is not clear that the process
resul ts in a net loss of OH from the system.
Small effects of aerosols on the radiation field and on the
temperature may also need to be considered. These effects are probably
small, however.
There are two problems with regard to detecting the effects of
aerosol injections such as that following the El Chichon eruptio~ One is
that no adequate baseline exists for the unperturbed atmosphere, and
therefore a given observation cannot unambiguously be assigned to the
enhanced presence of the aerosol loading. A second problem is that, as
15

already discussed, the effects are expected to be subtle and probably of
small magnitude. Thus, in spite of the large change that has occurred in
the aerosol content of the lower stratosphere, effects on the chemical
balance will be difficult to detect.
RATE CONSTANT DATA
Format
In Table 1 (Rate Constants for Second Order Reactions) the reactions
are grouped into the classes Ox' O(1D), HOx, NOx , ClOX' BrOx , FOx,
Hydrocarbon Reactions, and SOx. The data in Table 2 (Rate Constants for
Three-Body Reactions), while not grouped by class, are presented in the
same order as the bimolecular reactions. Further, the presentation of
photochemical cross section data follows the same sequence.
Some of the reactions in Table 1 are actually more complex than
simple two-body reactions. To explain the anomalous pressure and
temperature dependences occasionally seen in reactions of this type, it is
necessary to consider the bimolecular class of reactions in terms of two
subcategories, direct (concerted) and indirect (non-concerted) reactions.
A direct or concerted bimolecular reaction is one in which the
reactants A and B proceed to products C and D without the intermediate
formation of an A + B adduct which has appreciable bonding, i.e., no
stable A-B molecule eXists, and there is no reaction intermediate other
than the transition state of the reaction, (AB)~.
A + B -+ (AB)~ -+ C + D
16

The reaction of OH with CH4 forming H20 + CH3 is an example of a reaction
of this class.
Very useful correlations between the expected structure of the
transition state [AB]~ and the A-factor of the reaction rate constant can
be made, especially in reactions which are constrained to follow a well
defined approach of the two reactants in order to minimize energy
requirements in the making and breaking of bonds.
The indirect or non-concerted class of bimolecular reactions is
characterized by a more complex reaction path involving a potential well
between reactants and products, leading to a bound adduct (or reaction
complex) formed between the reactants A and B:
A + B :t: [AB]- -+ C + D
The intermediate [AB]- is different from the transition state [AB]~, in
that it is a bound molecule which has a finite lifetime and which can, in
principle, be isolated. (Of course, transition states are involved in all
of the above reactions, both forward and backward, but are not explicitly
shown.) An example of this reaction type is ClO + NO, which normally
produces CI + N02 as a bimolecular product, but which undoubtedly involves
CIONO (chlorine nitrite) as an intermediate. This can be viewed as a
chemical activation process forming (ClONO)- which decomposes
unimolecularly to the ultimate products, Cl + N02• Reactions of the non
concerted type can have a more complex temperature dependence than those
of the concerted type, and, in particular, can exhibit a pressure
dependence if the lifetime of [AB] - is comparable to the rate of
17

collisional deactivation of [AB]'. This arises because the relative rate
at which [AB]' goes to products C + D vs. reactants A + B is a sensitive
function of its excitation energy. Thus, in reactions of this type, the
distinction between the bimolecular and term·olecular classification
becomes less meaningful, and it is particularly necessary to study such
reactions under the temperature and pressure conditions in which they are
to be used in model calculations.
The rate constant tabulation for second-order reactions (Table 1)
gives the following information:
1. Reaction stoichiometry and products (if known).
2. Arrhenius A-factor.
3. Temperature dependence and associated uncertainty ("activation
temperature" E/Rz~/R).
4. Rate constant at 298K.
5. Uncertainty factor at 298K.
6. Note giving basis of recommendation and any other pertinent
information.
Third-order reactions (Table 2) are given in the form
(where the value is suitable for air as the third body), together with the
recommended value of n. Where pressure fall-off corrections are
necessary, an additional entry gives the limiting high pressure rate
constant in a similar form:
18
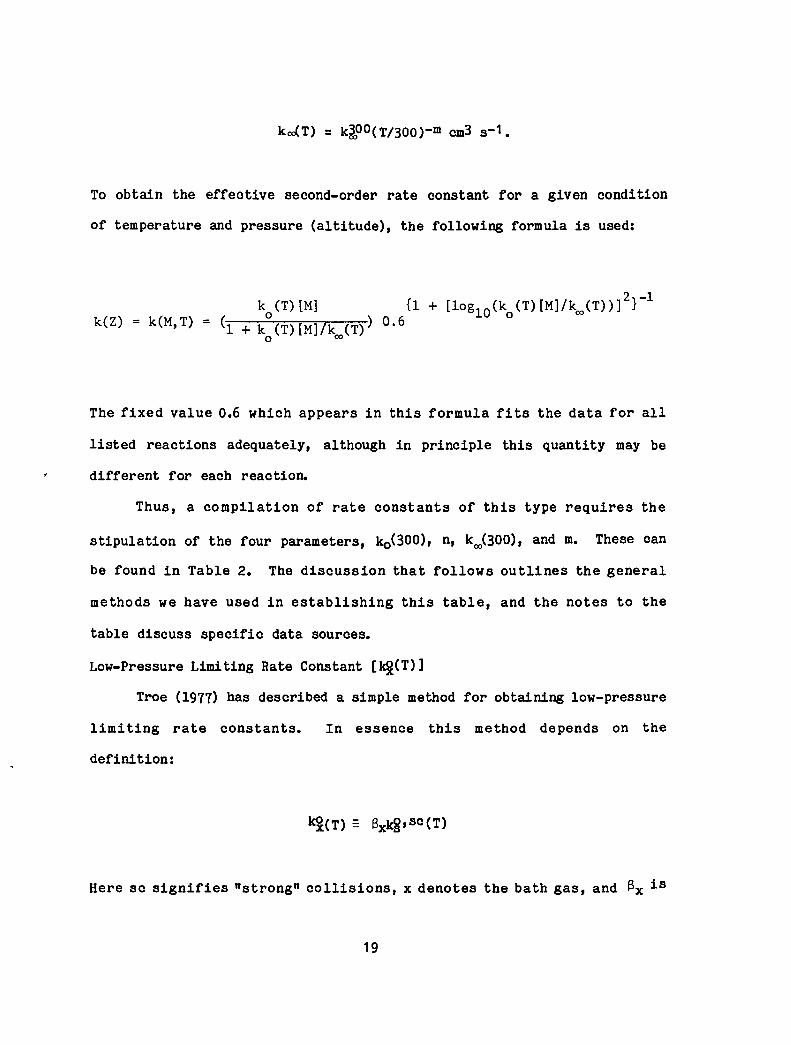
To obtain the effective second-order rate constant for a given condition
of temperature and pressure (altitude), the following formula is used:
k(Z) = k(M, T)
The fixed value 0.6 which appears in this formula fits the data for all
listed reactions adequately, although in principle this quantity may be
different for each reactio~
Thus, a compilation of rate constants of this type requires the
stipulation of the four parameters, ko(300), n, koo(300), and m. These can
be found in Table 2. The discussion that follows outlines the general
methods we have used in establishing this table, and the notes to the
table discuss specific data sources.
Low-Pressure Limiting Rate Constant [~(T)]
Troe (1977) has described a simple method for obtaining low-pressure
limi ting rate constants. In essence this method depends on the
definition:
Here sc signifies "strong" collisions, x denotes the bath gas, and ex is
19

an efficiency parameter (0 < S < 1), which provides a measure of energy
transfer.
The coefficient Sx is related to the average energy transferred in
a collision with gas x, <~>x' via:
= <~E>
x FE kT
Notice that <~E> is quite sensitive to S. FE is the correction factor of
the energy dependence of the density of states (a quantity of the order of
1.1 for most species of stratospheric interest).
For many of the reactions of possible stratospheric interest
reviewed here, there exist data in the low-pressure limit (or very close
thereto), and we have chosen to eyaluate .aru1 unify this data by
calculating k~,SC(T) for the appropriate bath gas x and computing the
value of Sx corresponding to the experimental value [Troe (1977)]. A
recent compilation (Patrick and Golden, 1983) gives details for reactions
considered here.
From the Sx values (most of which
<[£>x according to the above equation.
are for N2, i.e., SN ), we compute 2
Values of <~E>Nz of approximately
0.3-1 kcal mole- 1 are generally expected. If multiple data exist, we
average the values of <~>N and recommend a rate constant corresponding to
the SN2computed in the equation above.
Where no data eXist, we have estimated the low-pressure rate
constant by taking SN = 0.3 at T = 300 K, a value based on those cases 2
where data exist.
20

Temperature Dependence of Low-Pressure Limiting Rate Constants n
The value of n recommended here comes from a calculation of <b.E>N
from the data at 300 K, and a computation of ~ (200 K) assuming that 2
<~>N is independent of temperature in this range. This ~ (200 K) value 2 2
is combined with the computed value of koS C (200 K) to give the expected
value of the actual rate constant at 200 K. This latter in combination
with the value of 300 K yields the value of ~
This procedure can directly be compared with measured values of
ko(200 K) when those exist. Unfortunately, very few values of 200 K are
available. There are often temperature-dependent studies, but some
ambiguity exists when one attempts to extrapolate these down to 200 K. If
data is to be extrapolated out of the measured temperature range, a choice
must be made as to the functional form of the temperature dependence.
There are two general ways of expressing the temperature dependence of
rate constants. Either the Arrhenius expression ko(T) = Aexp(-E/RT) or
the form ko(T) = AI T- n is employed. Since neither of these
extrapolation techniques is soundly based, and since they often yield
values that differ substantially, we have used the method explained
heretofore as the basis of our recommendations.
High-Pressure Limiting Rate Constants [koo(T)]
High-pressure rate constants can often be obtained experimentally,
but those for the relatively small species of atmospheric importance
usually reach the high-pressure limit at inaccessibly high pressures.
This leaves two sources of these numbers, the first being guesses based
upon some model, and the second extrapolation of fall-off data up to
higher pressures. Stratospheric conditions generally render reactions of
21

interest much closer to the low-pressure limit, and thus are fairly
insensitive to the high-pressure value. This means that while the
extrapolation is long, and the value of koo(T) not very precise, a
"reasonable guess" of koo(T) will then suffice. In some cases we have
declined to guess since the low-pressure limit is always in effect over
the entire range of stratospheric conditions.
Temperature Dependence of High-Pressure Limiting Rate Constants; m
There is very little data upon which to base a recommendation for
values of m. Values in Table 2 are estimated, based on models for the
transition state of bond association reactions and whatever data are
available.
k.r.Ql: Estimates
For second-order rate constants in Table 1, an estimate of the
uncertainty at any given temperature may be obtained from the following
expression:
An upper or lower bound (corresponding approximately to one standard
deviation) of the rate constant at any temperature T can be obtained by
multiplying or dividing the value of the rate constant at that temperature
by the factor fT. The quantities f298 and ~E/R are, respectively, the
uncertainty in the rate constant at 298K and in the Arrhenius temperature
coeffiCient, as listed in Table 1.
For three-body reactions (Table 2) a somewhat analogous procedure is
used. Uncertainties expressed as increments to ko and kooare given for
these rate constants at room temperature. The additional uncertainty
22

arising from the temperature extrapolation is expressed as an uncertainty
in the temperature coefficients nand m.
Units
The rate constants are given in units of concentration expressed as
molecules per cubic centimeter and time in seconds. Thus, for first-,
second-, and third-order reactions the units of k are s-1, cm3 molecule-1
s-1, and cm6 molecule-2 s-1, respectively.
23

Table 1. Rate Constants for Second Order Reactions.
Reaction
• NO + NO
/o(1D) + H20> OH + OH
~0(1D) + CH4 ~ OH + CH3
)0(1 D) + H2 ~ OH + H
~(1D) + N2 ~ 0 + N2
0(1 D) + N2 ~ N20
J 0 ( 1 D) + O2 ~ 0 + O2
0(1D) + 03 ~ 02 + 02
~ O2 + 0 + 0
~0(1D) + HCl ~ OH + Cl
0(1D) + CC14 ~ products
0(1 D) + CFC13 ~ products
0(1 D) + CF2C12 ~ products
A-Factor E/R:tI\( E/R)
Ox Reactions
(See Table 2)
8.0x10⁻¹²
4.9x10⁻¹¹
6.7x10⁻¹¹
2.2x10⁻¹⁰
1.4x10⁻¹⁰
1.4x10⁻¹¹
1.0x10⁻¹⁰
1.8x10⁻¹¹
2060'*'250
0(1D) Reactions
o:t100
o:t100
o:t100
o:t100
o:t100
o:t100
(See Table 2)
3.2X10⁻¹¹
1.2x10⁻¹⁰
1.2x10⁻¹⁰
1.4x10⁻¹⁰
3.3x10⁻¹⁰
2.3x10⁻¹⁰
1.4x10⁻¹⁰
-(67%100)
o:t100
o:t100
o:t100
o:t100
o:t100
k(298K)
8.0x10⁻¹⁵
4.9x10⁻¹¹
6.7x10- 11
2.2x10⁻¹⁰
1.4x10⁻¹⁰
1.4x10⁻¹¹
1.0x10⁻¹⁰
2.6x10⁻¹¹
4.0x10⁻¹¹
1.2x10⁻¹⁰
1.2x10⁻¹⁰
1.4x10⁻¹⁰
3.3x10⁻¹⁰
2.3x10⁻¹⁰
1.4x10⁻¹⁰
'Indicates a change from the previous Panel evaluation (JPL 82-57).
IIndicates a new entry that was not in the previous evaluation.
24
Unccrtdinty Factor/298K
1.15
1.4
1.4
1.2
1.2
1.2
1.2
1.2
1.2
1.3
1.3
1.3
1.2
1.2
1.3
Notes
2,3
2,3
2,4
2,5
2,5
2
2
2
2,6
2,6
2,7
2,8
2,8
2,8

Table 1. ( Continued) •
Uncertainty Reaction A-Factor ElR±~(fjlHl k(Z96Kl [ilg!;QI:LZ96K HQ!;es
0(1 D) + CF4 .... CF4 + 0 1.8x10⁻¹³ 0:i:100 1.8x10⁻¹³ 2.0 2,8
O( 1D) + CC120 .... products 3.6x10⁻¹O 0:i:100 3.6x10⁻¹O 2.0 2,9
0(1 D) + CFC10 .... products 1.9x10⁻¹O 0:i:100 1.9x10⁻¹O 2.0 2,9
0(1 D) + CF20 .... products 7.4x10⁻¹¹ 0:i:100 7.4x10⁻¹¹ 2.0 2,9
vOt1D) + NH3 .... OH + NH2 2.5x10⁻¹O 0:i:100 2.5x10⁻¹O 1.3 2,10
0(1D) + C02 .... 0 + CO2 7.4x10⁻¹¹ -(117*100) 1.1x10⁻¹O 1.2 2
O( 1D) +HF .... OH+F 1.0x10⁻¹O 0:i:100 1.0x10⁻¹O 5.0 11
HOx Reactions
H + 02 ~ H02 (See Table 2)
H+03 .... OH+02 1.4x10⁻¹O 470*200 2.9x10⁻¹¹ 1.25 12
IH + H02 .... products 7.4x10⁻¹¹ 0:i:400 7.4x10⁻¹¹ 1.6 13
o + OH .... O2 + H 2.2x10⁻¹¹ -( 117·100) 3.3x10⁻¹¹ 1.2 14
o + H02 .... OH + 02 3.0x10⁻¹¹ -(200:i:200) 5.9x10⁻¹¹ 1.4 15
·0 + H202 .... OH + H02 1.4x10⁻¹² 2000%1000 1.7x10⁻¹⁵ 2.0 16
-v*OH + H02 .... H20 + 02 (7+4Patm)x1o- 11 0%500 (7+4Pa tm)x10-11 1.6 17
.-AJH + 03 .... H02 + 02 1.6x10⁻¹² 940:i:300 6.8x10⁻¹⁴ 1.3 18
<OH+ OH .... H20 + 0 4.2x10⁻¹² 242:i:242 1.9x10⁻¹² 1.4 19
M .... H202 (See Table 2)
/eOH + H202 .... H20 + H02 3.1x10⁻¹² 187*200 1.7x10⁻¹² 1.3 20
v6H + H2 .... H20 + H 6.1x10⁻¹² 2030:i:400 6.7x10- 15 1.2 21
.Indicates a change from the previous Panel evaluation (JPL 82-57).
IIndicates a new entry that was not in the previous evaluation.
25
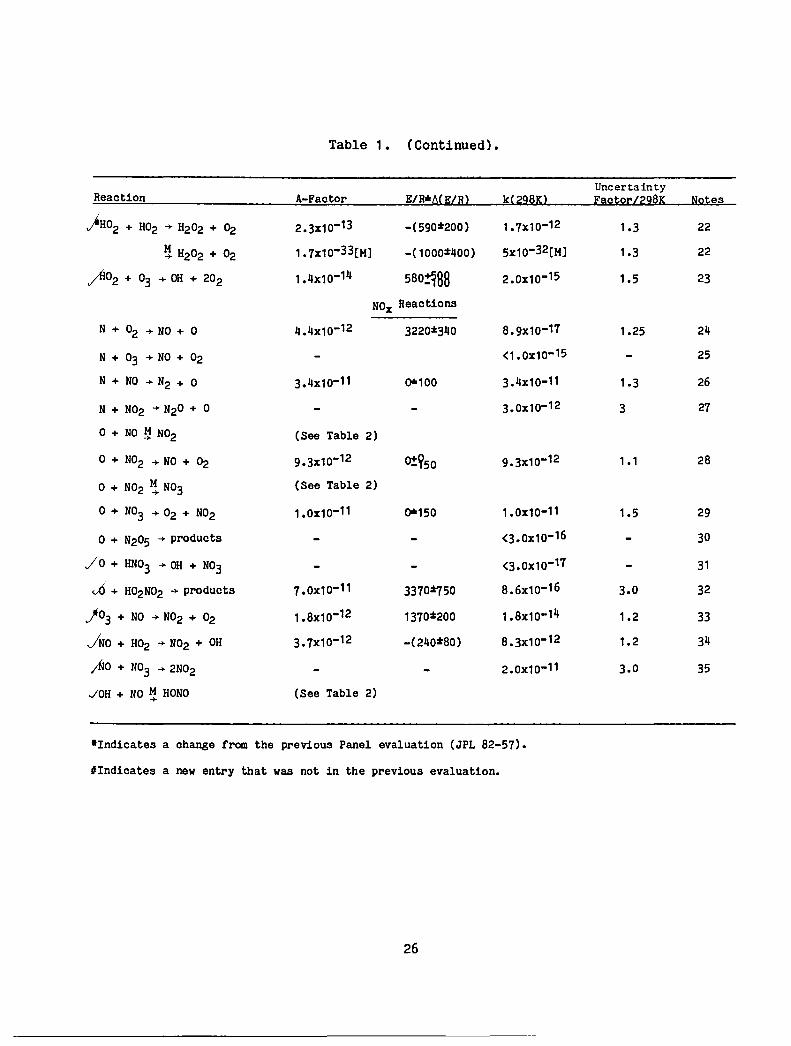
Table 1. (Continued) •
Uncertainty Reaction A-Factor ElR*A(J:;lHl k(~2~Kl EaQtQ~lZ2~K NQ!<es
)H02 + H02 .... H202 + ~ 2.3x10⁻¹³ -(590:t200) 1.7x10⁻¹² 1.3 22
~ H202 + 02 1.7x10⁻³³[H] -(1000:t400) 5x10-32[H] 1.3 22
~02 + 03 .... OH + 202 1.4x10⁻¹⁴ 580!188 2.0x10⁻¹⁵ 1.5 23
NOx Reactions
N + 02 .... NO + 0 4.4x10⁻¹² 3220:t340 8.9x10⁻¹⁷ 1.25 24
N + 03 .... NO + 02 <1.0x10- 15 25
N + NO .... N2 + ° 3.4x10⁻¹¹ 0'0100 3.4x10⁻¹¹ 1.3 26
N + N02 .... N20 + ° 3.0x10⁻¹² 3 27
° + NO ~ N02 (See Table 2)
° + N02 .... NO + 02 9.3x10⁻¹² 0!950 9.3x10⁻¹² 1 .1 28
° + N02 l! N03 (See Table 2)
° + N03 .... 02 + N02 1.0x10⁻¹¹ 0'0150 1.0x10⁻¹¹ 1.5 29
° + N205 .... products <3.0x10⁻¹⁶ 30
/0 + HN03 .... OH + N03 <3.0X10⁻¹⁷ 31
vO + H02N02 .... products 7.0x10⁻¹¹ 3370%750 8.6x10⁻¹⁶ 3.0 32
j 03 + NO .... N02 + 02 1.8x10⁻¹² 1370:t200 1.8x10⁻¹⁴ 1.2 33
JNO + H02 .... N02 + OH 3.7x10⁻¹² -(240:t80) 8.3x10⁻¹² 1.2 34
;No + N03 .... 2N02 2.0x10⁻¹¹ 3.0 35
JOH + NO ~ HONO (See Table 2)
-Indicates a change from the previous Panel evaluation (JPL 82-57).
IIndicates a new entry that was not in the previous evaluation.
26

Table 1. (Continued) •
Uncertainty B~iIogUQD 4-ligtsn: BlB*ll!ElRl k(2981Q Faotorl2981C Notes
vOH + N02 ~ HN03 (See Table 2)
vnH + HN03 + produots 9.4x10⁻¹⁵ -(778*100) 1.3x10⁻¹³ 1.3 36
~OH + H02N02 + produots 1.3x10⁻¹² -(380!~88) 4.6x10⁻¹² 1.5 37
~02 + N02 ~ H02N02 (See Table 2)
v03 + N02 + N03 + 02 1.2x10⁻¹³ 2450*140 3.2x10⁻¹¹ 1.15 38
,;-03 + HN02 + 02 + HN03 <5.0x10⁻¹⁹ 39
~02 + N03 ~ N205 (See Table 2)
~H + NH3 + H20 + NH2 3.3x10⁻¹² 900*200 1.6x10⁻¹³ 1.4 40
v1NH2 + OH + produots 1.0x10⁻¹³ 10 41
INH2 + H02 + produots 3.4x10⁻¹¹ 2 42
vfNH2 + NO + produots 3.6x10⁻¹² -(450*150) 1.6x10⁻¹¹ 2 43
INH2 + N02 + produots 1.9x10⁻¹² -(650*250) 1.7x10⁻¹¹ 3 44
INH2 + 02 + produots <3x10-18 45
INH2 + ~ + produots 3.4x10⁻¹² 1000*500 1.2x10⁻¹³ 3 46
C10x Reaotions
...tl + 03 + C10 + 02 2.8x10⁻¹¹ 257*100 1.2x10⁻¹¹ 1.15 47
..A:l + H2 + HCl + H 3.7x10⁻¹¹ 2300*200 1.6x10⁻¹⁴ 1.25 48
~ + CH4 + HCl + CH3 9.6x10⁻¹² 1350*150 1.0x10⁻¹³ 1 .1 49
Cl + C2H6 + HCl + C2H5 7.7x10⁻¹¹ 90*90 5.7x1o-11 1.1 50
Cl + C3H8 + HCl + C3H7 1.4x10⁻¹O -(40*250) 1.6x10⁻¹O 1.5 51
-Indicates a ohange trom the previous Panel evaluation (JPL 82-57).
'Indicates a new entry that was not in the previous evaluation.

Table 1. ( Continued) •
Uncertainty Reaction A-Factor ElRZlI'~lBl Id~9!lKl EllQS;ol:lZ9!lK Hgtes
Cl + C2H2 -+ products 1x10-12 10 52
Cl + CH30H -+ CH20H + HCl 6.3x10⁻¹¹ 0~250 6.3x10⁻¹¹ 2.0 53
~l + CH3Cl -+ CH2Cl + HCl 3.4x10⁻¹¹ 1260:t200 4.9x10⁻¹³ 1.2 54
ICl + CH3CC13 -+ CH2CC13 + HCl <4xl0-14 55
vel + H2CO -+ HCl + HCO 8.2x10⁻¹¹ 34~100 7.3x10⁻¹¹ 1.15 56
vCl + H202 -+ HCl + H02 1.lxl0-11 980*500 4.1xl0-13 1.5 57
Cl + HOCl -+ products 3.0xl0-12 130:t250 1.9x10⁻¹² 2.0 58
/-Cl + HN03 -+ products <1.7xl0-14 59
vCl + H02 -+ HCl + 02 1.8x10⁻¹¹ -( 170·200) 3.2xl0-ll 1.5 60
-+ OH + C10 4.1xl0-11 450·200 9.1xl0-12 2.0 60
vtl + C120 -+ C12 + C10 9.8x10⁻¹¹ 0:t250 9.8x10⁻¹¹ 1.2 61
"vel + OC10 -+ C10 + C10 5.9xl0-11 0:t250 5.9xl0-11 1.25 62
JlCl + C10N02 -+ products 6.8x10⁻¹² -( 160:t200) 1.2x10⁻¹¹ 1.3 63
vCl + NO li NOCl (See Table 2)
Cl + N02 ~ C10NO (C1N02) (See Table 2)
.;Cl + C1NO -+ NO + C12 2.3xl0-11 0!~g8 2.3xl0-11 3.0 64
vCl + 02 ~ C100 (See Table 2)
/Cl + C100 -+ C12 + 02 1.4xl0-1O 0*250 1.4x10⁻¹⁰ 3.0 65
I -+ C10 + C10 8.0xl0-12 0*250 8.0xl0-12 3.0 65
I C10 + 0 -+ Cl + O2 7.7xl0-11 130~130 5.0x10⁻¹¹ 1.4 66
*Indicates a change from the previous Panel evaluation (JPL 82-57).
IIndicates a new entry that was not in the previous evaluation.
28

Table 1. (Continued) •
Uncertainty HegQt;!.Q!l A-f5!.QtQC ElH·~(E/R~ k(228K~ Factor/228K Notes
~IO + NO ~ N02 + CI 6.2x10⁻¹² -(294*100) 1.7x10⁻¹¹ 1.15 67
v'CIO + N02 ~ CION02 (See Table 2)
~10 + H02 ~ HOCI + O2 4.6x10⁻¹³ -(710!~~8) 5.0X10⁻¹² 1.4 68
~10 + H2CO ~ products _1.0x10-12 >2060 <1.0x10⁻¹⁵ 69
vaCIO + OH ~ products 9.2x10⁻¹² -(66:200) 1.2x10⁻¹¹ 2 70
~10 + CH4 ~ products -1.0x10⁻¹² >3700 <4.Ox10-18 71
~10 + H2 ~ products -1.0x10⁻¹² >4800 <1.Ox10-19 71
~10 + CO ~ products _1.0x10-12 >3700 <4.Ox10-18 71
CIO + N20 ~ products -1.0x10⁻¹² >4260 <6.0x10⁻¹⁹ 71
CIO + CIO ~ products 72
'-CIO + 03 ~ CIOO + O2 1.0x10⁻¹² >4000 <1.0x10⁻¹⁸ 73
,/' ~ OCIO + 02 1.0x10⁻¹² >4000 <1.0x10⁻¹⁸ 73
~ + HCI ~ H20 + CI 2.8x10⁻¹² 425*100 6.6x10⁻¹³ 1.2 74
/lbH + HOCI ~ H20 + CIO 3.0x10⁻¹² 150:!:~s8 1.8x10⁻¹² 10 75
~ + CH3CI ~ CH2CI + H2O 1.8x10⁻¹² 1112*200 4.3x10⁻¹⁴ 1.2 76
~H + CH2Cl2 ~ CHCl2 + H2O 4.5x10⁻¹² 1032*200 1.4x10⁻¹³ 1.2 76
~H + CHCl3 ~ CCl3 + H2O 3.3x10⁻¹² 1034*200 1.0x10⁻¹³ 1.2 76
OH + CHFCl2 ~ CFCl2 + H2O 8.9x10⁻¹³ 1013*200 3.0x10⁻¹⁴ 1.3 76
OH + CHF2CI ~ CF2CI + H2O 7.8x10⁻¹³ 1530*200 4.6x10⁻¹⁵ 1.2 76
OH + CH2CIF ~ CHCIF + H2O 2.0x10⁻¹² 1134*150 4.4x10⁻¹⁴ 1.2 76
• Indicates a change from the previous Panel evaluation (JPL 82-57) •
IIndicates a new entry that was not in the previous evaluation.
29

Reaction
yH + C2C14" products
OH + C2HC13" products
OH + CFC13 .. products
OH + CF2C12 .. products
/OH + CION02 .. products
~ + HCl .. OH + Cl
va + HOCl .. OH + CIO
JO + CION02 .. products
JftJ + C120 .. CIO + CIO
/0 + OCIO .. CIO + 02
/ NO + OCIO .. N02 + CIO
~r + 03 .. BrO + 02
JBr + H202 .. HBr + H02
~r + H2CO .. HBr + HCO
Br + H02 .. HBr + 02 /
...;BrO + 0 .. Br + O2
..IBrO + CIO .. Br + OCIO
/ .. Br + Cl + O2
Table 1. (Continued).
A-Factor
9.4x10⁻¹²
5.0x10⁻¹³
-1.0x10⁻¹²
_1.0x10-12
1.2x10⁻¹²
1.0x10⁻¹¹
1.0x10⁻¹¹
3.0x10⁻¹²
2.9x10⁻¹¹
2.5x10⁻¹¹
2.5x10⁻¹²
1.4x10⁻¹¹
-1.0x10⁻¹¹
1.7x10⁻¹¹
3.0X10⁻¹¹
6.7x10⁻¹²
6.7x10⁻¹²
E/R*A(E/R)
1820*200
1200*200
-(445*200)
>3650
>3560
333*200
3340*350
2200:1:1000
808*200
630*200
1160:1:300
600*300
BrOx Reactions
755:1:200
>2500
800*200
0:1:250
0*250
0*250
k(298K)
1.2x10⁻¹⁴
1.7x10⁻¹³
2.2x10- 12
<5.0x10⁻¹⁸
<6.5x10⁻¹⁸
3.9x10⁻¹³
1.4x10⁻¹⁶
6.0x10⁻¹⁵
2.0x10⁻¹³
3.5x10⁻¹²
5.0x10⁻¹³
3.4x10⁻¹³
1.1x10⁻¹²
<2.0x10- 15
1.1x10⁻¹²
>1x10-13
3.0x10⁻¹¹
6.7x10- 12
6.7x10⁻¹²
-Indicates a change from the previous Panel evaluation (JPL 82-57).
IIndicates a new entry that was not in the previous evaluation.
30
Uncertainty Factor/298K
1.3
1.25
1.25
1.5
2.0
10
1.5
1.4
1.5
1.5
1.2
1.3
3.0
2.0
2.0
Notes
77
78
79
80
80
81
82
83
84
85
86
87
88
89
90
91
92
93
93

Table 1. (Continued) •
Uncertainty Reaction A-Factor ElR=A(~ll!l k(Z2BKl EIlQt2rLZ2BK H2tes
v13'rO + NO .... N02 + Br 8.7x10⁻¹² -(265*130) 2.1x10⁻¹¹ 1.15 94
--13rO + N02 ~ BrON02 (See Table 2)
./BrO + BrO .... 2 Br + O2 1.4x10⁻¹² -(150:1:150) 2.3x10⁻¹² 1.25 95
,/ .... Br2 + 02 6.0x10⁻¹⁴ -(600*600) 4.4x10⁻¹³ 1.25 95
vErO + 03 .... Br+ 202 -1x10-12 )1600 <5.0x10⁻¹⁵ 96
ArO + H02 .... products 5.0x1Q-12 3.0 97
JBrO + OH .... products 1.2x1O-11 5.0 98
/6H + HBr .... H2O + Br 8.0x10⁻¹² ():t250 8.0x10⁻¹² 1.5 99
vOH + CH3Br .... CH2Br + H2O 6.1x10⁻¹³ 825·200 3.8x10⁻¹⁴ 1.25 100
~O + HBr .... OH + Br 6.6x10⁻¹² 1540·200 3.7x10⁻¹⁴ 1.3 101
FOx Reactions
F + 03 .... FO + 02 2.8x10⁻¹¹ 226*200 1.3x10⁻¹¹ 2.0 102
F + H2 .... HF + H 1.9x10⁻¹O 570:1:250 2.8x10⁻¹¹ 1.3 103
F + CH4 .... HF + CH3 3.0x10⁻¹O 400:1:300 8.0x10⁻¹¹ 1.5 104
F + H20 .... HF + OH 2.2x10⁻¹¹ 200·200 1.1x10⁻¹¹ 5.0 105
F + 02 ~ F02 (See Table 2)
F + NO M FNO .... (See Table 2)
F + N02 ~ FN02(FONO) (See Table 2)
NO + FO .... N02 + F 2.6x10⁻¹¹ 0*250 2.6x10⁻¹¹ 2.0 106
FO + FO .... 2 F + 02 1.5x10⁻¹¹ 0:1:250 1.5x10⁻¹¹ 3.0 107
*Indicates a change from the previous Panel evaluation (JPL 82-57).
'Indicates a new entry that was not in the previous evaluation.
31

Table 1. <Continued)
Uncertainty Reaction A-Factor E/R*t\C E/R) k(298K) Factor/298K
FO + 03 + F + 2 02
+ F02 + 02
FO + N02 ~ FON02 (See Table 2)
0+FO+F+02 5.0x10⁻¹¹ 0*250 5.0x10⁻¹ 1 3.0
o + F02 + FO + 02 5.0x10⁻¹¹ 0*250 5.0x10- 11 5.0
HldrQc~rb2D B~~~t12n~
'/*OH + CO + CO2 + H See Note 1.5x10⁻¹³ (1+0.6Patm) 1.4
/OH + CH4 + CH3 + H2O 2.4x10- 12 1710*200 7.7x10- 15
OH + C2H6 + H20 + C2H5 1.9x10⁻¹¹ 1260*250 2.7x10⁻¹³
OH + C3H8 + H20 + C3H7 1.6x10⁻¹¹ 800*250 1.1x10⁻¹²
OH + C2H4 + products (See Table 2)
OH + C2H2 + products (See Table 2)
liOH + H2CO + H20 + HCO 1.0x10⁻¹¹ 0*200 1.0x10⁻¹¹
- J *OH + CH300H + products 1.0x10⁻¹¹ 0*200 1.0x10⁻¹¹
v/OH + HCN + products 1.2x10⁻¹³ 400*150 3.1x10⁻¹⁴
10H + CH3CN + products 4.5x10⁻¹³ 750*300 3.7x10⁻¹⁴
IH02 + CH20 + adduct 4.5x10⁻¹⁴
o + C2H2 + products 2.9x10⁻¹¹ 1600·300 1.4x10⁻¹³
o + H2CO + products 3.0x10⁻¹¹ 1550*250 1.6x10-13
*0 + CH3 + products 1.1x10⁻¹O 0*250 1.1x10⁻¹O
*Indicates a change from the previous Panel evaluation (JPL 82-57).
IIndicates a new entry that was not in the previous evaluation.
CJ-I O(f/-I f /-I:t0 -1 2.
C I-'J OJ.... + !.J:. U
32
1.2
1.25
1.5
1.25
2.0
3.0
3.0
10.0
1.3
1.25
1.3
Notes
108
108
109
110
111
112
113
114
115
116
117
118
119
120
121
122
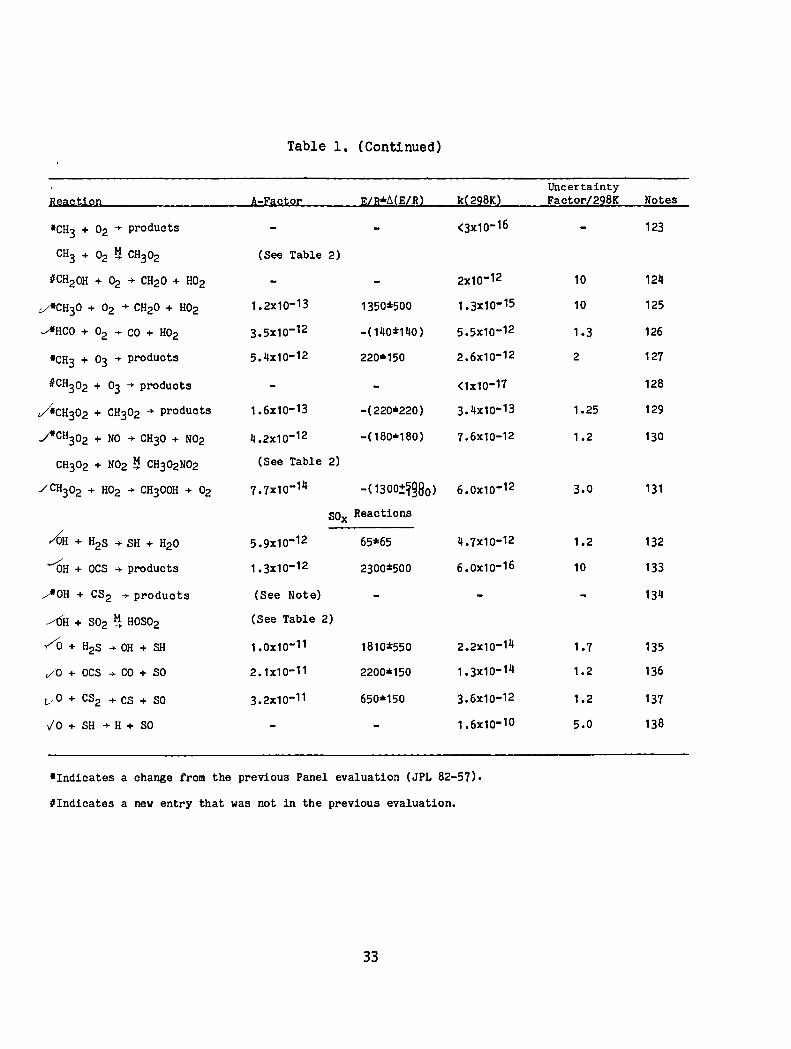
Table 1. (Continued)
Uncertainty Heas;:UQIl A-Eas;:l;ol: ElH*1I(E/R2 k{228K2 Factor/228K Notes
'CH3 + 02 + products <3x10- 16 123
CH3 + 02 ~ CH302 (See Table 2)
UCH20H + 02 + CH20 + H02 2x10-12 10 124
v/*CH30 + 02 + CH20 + H02 1.2x10⁻¹³ 1350*500 1.3x10⁻¹⁵ 10 125
~HCO + O2 + CO + H02 3.5x10⁻¹² -( 140:t140) 5.5x10⁻¹² 1.3 126
'CH3 + 03 + products 5.4x10⁻¹² 220*150 2.6x10⁻¹² 2 127
OCH302 + 03 + products <1x10-17 128
~CH302 + CH302 + products 1.6x10⁻¹³ -(220*220) 3.4x10⁻¹³ 1.25 129
~CH302 + NO + CH30 + N02 4.2x10⁻¹² -(180·180) 7.6x10⁻¹² 1.2 130
CH302 + N02 ~ CH302N02 (See Table 2)
/CH302 + H02 + CH300H + 02 7.7x10⁻¹⁴ -( 1300:1980) 6.0x10⁻¹² 3.0 131
SOx Reactions
~H + H2S + SH + H2O 5.9x10⁻¹² 65*65 4.7x10⁻¹² 1.2 132
~ OH + OCS + products 1.3x10⁻¹² 2300:t500 6.0x10⁻¹⁶ 10 133
~OH + CS2 .... products (See Note) 134
~H + S02 ~ HOS02 (See Table 2)
y/c) + H2S + OH + SH 1.0x10⁻¹¹ 1810:t550 2.2x10⁻¹⁴ 1.7 135
./0 + OCS .... CO + SO 2.1x10⁻¹¹ 2200*150 1.3x10⁻¹⁴ 1.2 136
v O + CS2 .... CS + SO 3.2x10⁻¹¹ 650*150 3.6x10⁻¹² 1.2 137
";0 + SH + H + SO 1.6x10⁻¹O 5.0 138
'Indicates a change from the previous Panel evaluation (JPL 82-57).
OIndicates a new entry that was not in the previous evaluation.
33

Reaction
~ + 02 .... SO + 0
S + 03 .... SO + 02
S+OH .... SO+H
j-so + O2 .... S02 + 0
)SO + 03 .... S02 + 02
SO + OH .... S02 + H
/so + N02 .... S02 + NO
SO + C10 .... S02 + Cl
SO + OC10 .... S02 + C10
SO + BrO .... S02 + Br
~02 + H02 .... products
JCH302 + S02 .... products
J SH + 02 .... OH + SO
ICl + H2S .... HCl + SH
ICl + OCS .... SCl + CO
IC10 + OCS .... products
IC10 + S02 .... Cl + S03
Table 1. (Continued)
A-Factor
2.3x10⁻¹²
2 .4x1 0-13
3.6x10⁻¹²
E/R*fl(E/R)
0:1<200
2370·500
1100:1<200
k(298K)
2.3x10⁻¹²
1.2x10⁻¹¹
6.6x10⁻¹¹
8.4x10⁻¹⁷
9.0x10- 14
8.6x10⁻¹¹
1.4x10⁻¹¹
2.3x10⁻¹¹
1.9x10⁻¹²
>4.0x10⁻¹¹
<1.0x10⁻¹⁸
<5.0x10⁻¹⁷
<3.2x10- 15
7.3x10⁻¹¹
<1.1x10- 16
<2.4x10⁻¹⁶
<4.0x10⁻¹⁸
-Indicates a change from the previous Panel evaluation (JPL 82-57).
IIndicates a new entry that was not in the previous evaluation.
34
Uncertainty Factor/298K Notes
1.2 139
2.0 140
3.0 141
2 142
1.2 143
2.0 144
1.3 145
3.0 146
3.0 146
146
147
148
149
1.4 150
151
151
151

NOTES .I.Q .I.Am.E ~
1. 0 + 03. Changed from JPL 82-57 to include the new results of Wine
II .sl.., (1983). The recommended rate expression is from Wine II
~. and is a linear least squares fit of all data (unweighted) from
Davis II al. (1973), McCrumb and Kaufman (1972), West ~ .sl..
(1978), Arnold and Comes (1979), and Wine II li. (1983).
Compared to the previous recommendation, the new rate is 9% lower
at 298 K and 9% higher at 220 K.
2. 0(1 D) Reactions. These recommendations are based on averages of the
absolute rate constant measurements reported by Streit ~~. (1976),
Davidson ~~. (1977) and Davidson II sl,. (1978) for N20, H20, CH4, H2,
N2, 02, 03' HCI, CCI4, CFCI3, CF2CI2, NH3, and C02; by Amimoto ll.al. (1978), Amimoto ~.s].. (1979), and Force and Wiesenfeld
(1981a,b) for N20, H20, CH4, N2, H2, 02, 03' C02, CCI4, CFCl3'
CF2Cl2, and CF4; by Wine and Ravishankara (1981) and (1982) for
N20, H20, N2, H2, 03' C02, and CF20; by Brock and Watson (1980c)
for N2 , 02 and C02; by Lee and Slanger (1978 and 1979) for H20 and
02; and by Gericke and Comes (1981) for H20. The weight of the
evidence from these studies indicates that the resul ts of Heidner
and Husain (1973), Heidner ~~. (1973) and Fletcher and Husain
(1976a, 1976b) contain a systematic error. For the critical
atmospheric reactants, such as N20, H20, and CH4' the recommended
absolute rate constants are in good agreement with the previous
relative measurements when compared with N2 as the reference
reactant. A similar comparison with O2 as the reference reactant
gives somewhat poorer agreement. Wine and Ravishankara (1982) have
determined the yields of 0(3p) from 0(1D) collisions: H20 (4.9 :t
3.2%), N20 «4.0%), CH4 «4.3%), and H2 «4.9%).
3. 0(1D) + N20. The branching ratio for the reaction of 0(1D) with N20
to give N2 + 02 or NO + NO is an average of the values reported by
Davidson ~.s.!. (1979); Volltrauer ~.al. (1979); Marx ~ sl.
35
(1979) and Lam ~~. (1981). This result, ¢(N2) = 1.42, agrees
well with earlier measurements of the N2 quantum yield from N20
photolysis: ¢(N2) = 1.44 (Calvert and Pitts 1966b). 0(1D) translational
energy and temperature dependence effects are not clearly resolved.
4. O(lD) + H20. Measurements by Zellner ~~. (1980) indicate 1(+0.5
or -1)% of the O(lD) + H20 reaction products are H2 + 02.
5. O(l D) + CH4. The branching ratio for reaction of O(lD) with CH4 to
give OH + CH3 or CH20 + H2 is from Lin and DeMore (1973). A molecular
beam study by Casavecchia ~ Al. (1980) indicates that an additional
path forming CH30 (or CH20H) + H may be important. This
possibility requires further investigation.
6. 0(1D) + 03. The branching ratio for reaction of O(lD) with 03 to
give 02 + 02 or 02 + ° + ° is from Davenport ~~. (1972). This is supported by measurements of Amimoto ~ sl. (1978) who reported
that on average one ground state ° is produced per 0(1D) reaction with
03. It seems unlikely that this could result from 100% quenching
of the 0(1D) by 03.
7. O(l D) + HCIO. The reaction O(lD) + HCl may give a small amount of
H + CIO products (Davidson ~ ~., 1977).
8. O(1D) + halocarbons. The halocarbon rate constants are for total
disappearance of O(lD) and probably include physical quenching.
Products of the reactive channels may include: CX30 + X, CX20 + X2, and
CX3 + XC, where X = H, F, or CI in various combinations. Chlorine and
hydrogen are more easily displaced than fluorine from halocarbons as
indicated by approximately 100% quenching for CF4. A useful formula
for estimating O(lD) removal rates by methane and ethane type
halocarbons was given by Davidson et sl. (1978): k(CnHaFbClc) = 0.32a + 0.030b + 0.74c (in units 10-10 cm3 molecule-1s-1). This
~xpression does not work for molecules with extensive fluorine
36

substitution. Some values have been reported for the fractions of
the total rate of disappearance of O(1D) proceeding through
quenching and reactive channels. For CCI4: quenching = (14%6)% and
reaction = (86%6)%, (Force and Wiesenfeld, 1981a); for CFCI3: quenching
= (13%4)% and reaction = (87%4)% (Force and Wiesenfeld, 1981a), quenching = (25%10)%, CIO formation = (60%15)% (Donovan, 1980); for CF2CI2:
quenching = (14±7)% and reaction = (86±14)% (Force and
Wiesenfeld, 1981), quenching = (20%10)%, CIO formation = (55%15)%
(Donovan, 1980); for CF4: quenching = 100% (Force and Wiesenfeld, 1981a).
9. O(1D) + CCI20, CFCIO and CF20. For the reactions of O(1D) with CCl20
and CFCIO the recommended rate constants are derived from data of Fletcher
and Husain (1978). For consistency, the recommended values for these rate
constants were derived using a scaling factor (0.5) which corrects
for the difference between rate constants from the Husain
Laboratory and the recommendations for other O(1D) rate constants in
this table. The recommendation for CF20 is from data of Wine and Ravishankara
(1983). Their result is preferred over the value of Fletcher and Husain
(1978) because it appears to follow the pattern of decreased reactivity with
increased fluorine substitution observed for other halocarbons. These reactions
have been studied only at 298 K. Based on consideration of similar O(1D)
reactions, it is assumed that E/R equals zero, and therefore the value shown
for the A-factor has been set equal to k(298 K).
10. O(1 D) + NH3 • Sanders ~ ale (1980a) have detected the product NH(a1~) in
addition to OH formed in the reaction O(1D) + NH3' They report the
yield of NH(a1~) is in the range 3-15% of the amount of OH
detected.
11. O(1 D) + HF. No experimental data are known for O(1D) + HF. k is estimated to
be large and not strongly temperature dependent, based on comparison
with other O(1 D) reactions. The products OH + F are exothermic
but quenching may also occur.
37

12. H + 03. The recommendation is an average of the recent results of Lee ~.al. (1978b) and Keyser (1979), which are in excellent agreement over
the 200-400 K range. An earlier study by Clyne and Monkhouse (1977)
is in very good agreement on the T dependence in the range 300-650 K
but lies about 60% below the recommended valUes. Although we have
no reason not to believe the Clyne and Monkhouse values, we prefer
the two studies that are in excellent agreement, especially since
they were carried out over the T range of interest. Recent results
by Finlayson-Pitts and Kleindienst (1979) agree well with the
present recommendations. Reports of a channel forming H02 + ° (Finlayson-Pitts and Kleindienst, 1979: -25%, and Force and
Wiesenfeld, 1981b: -40%) have been contradicted by other studies
(Howard and Finlayson-Pitts, 1980: < 3%; Washida ~ .al., 1980a:
< 6%; and Finlayson-Pitts ~.al., 1981: < 2%). Secondary chemistry
is believed to be responsible for the observed ° atoms in this
system. Washida ~.al. (1980c) measured a low limit « 0.1%) for
the production of singlet molecular oxygen in the reaction H + 03.
13. H + H02. New entry. There are four recent studies of this
reaction: Hack lili. (1978b), Hack lili. (1979c), Thrush and
Wilkinson (1981b), and Sridharan ~.al. (1982). Related early work
and combustion stUdies are referenced in the latter paper. All
four studies used discharge flow systems. It is difficult to
obtain a direct measurement of the rate constant for this reaction
because both reactants are radicals and the products OH and ° are
very reactive toward the H02 reactant. The recommendation is based
on the data of Sridharan ~.al. because their measurement was the
most direct and required the fewest corrections. The other
measurements, (5.0 :i: 1.3) x 10- 11 cm3 molecule-1 s-1 by Thrush and
Wilkinson (1981b) and (4.65 :i: 1) x 10-11 by Hack ~~. (1979c) are
in reasonable agreement with the recommended value. Hack ~ ~
(1978b) and Sridharan et~. (1982) reported 3 product channels:
(a) 20H, (b) H20 + 0, and (c) H2 + 02. The former gave ka/ k = 0.69, kb/k ~ 0.02, and kc/k = 0.29 and the latter gave ka/k = 0.87 ±
38

0.04, kb/k = 0.04 i: 0.02, and kc/k = 0.09 i: .045. Hislop and Wayne
(1977) reported on the possibility of 02(b1~) being formed in
channel (c) in (2.8 oj: 1.3) x 10-4 of the total reactions. There
are no studies of the temperature dependence of the rate constant
or the product ratios in the range of atmospheric interest. It is
likely that the dominant channel at room temperature, (a), which
occurs on a radical-radical recombination surface will increase
with decreasing temperature and that the others which involve
insertion or abstraction will decrease with increasing temperature.
Further high quality studies are needed.
14. 0 + OR. The rate constant for 0 + OH is a fit to three temperature dependence
studies: Westenberg ~~. (1970a), Lewis and Watson (1980), and
Howard and Smith (1981). This recommendation is consistent with earlier
work near room temperature as reviewed by Lewis and Watson (1980).
The ratio k(O + H02)/k(0 + 08) measured by Keyser (1983) agrees with the rate constants recommended here.
15. 0 + H02• The recommendation for the 0 + H02 reaction rate constant is the
average of two studies at room temperature (Keyser, 1982, and Sridharan
~Al., 1982) fitted to the temperature dependence given by
Keyser (1982). Earlier studies by Hack ~al. (1979a) and Burrows
~Al. (1977,1979) are not considered, because the OH + H202 reaction
was important in these studies and the value used for its rate constant
in their analyses has been shown to be in error. Data from Lii ~
Al. (1980c) is not considered, because it is based on only four
experiments and involves a curve fitting procedure that appears to
be insensitive to the desired rate constant. New data from
Ravishankara ~~ (1983b) at 298 K are in excellent agreement with
the recommendation and show no dependence on pressure between 10
and 500 Torr N2• The ratio k(O + H02)/k(0 + OH) measured by Keyser (1983) agrees with the rate constants recommended here.
16. 0 + H202• There are two direct studies of the 0 + H202 reaction:
39
Davis ~ li. (1974c) and Wine ~ lie (1983). The recommended value
is a fit to the combined data. Wine §1.sJ... suggest that the
earlier measurements may be too high because of secondary
chemistry. The A factor for both data sets is quite low compared
to similar atom-molecule reactions. An indirect measurements of
the E/R by Roscoe (1982) is consistent with the recommendation.
17. OH + H02• Three measurements of the rate constant at low pressure (1-3 torr) in discharge-flow systems all give values near
7 x 10-11 cm3 molecule-1 s-1: Keyser (1981), Sridharan ~ ale
(1981), and Temps and Wagner (1982). The latter two studies
supersede earlier work which reported lower values from the same
laboratories, Chang and Kaufman (1978) and Hack ~~. (1978a).
Separate studies at pressures near one atmosphere obtain
consistently a larger rate constant, about 1.1 x 10⁻¹⁰ : Lii
~li. (1980a), Hochanadelllli. (1980), DeMore (1982), Coxnal.
(1981) and Braun et sl. (1982). DeMore (1982) reports rate
constants that increase from about 7 x 10-11 at 75 torr to about
1.2 x 10⁻¹⁰ at 730 torr. The present recommendation is for a rate
constant that increases linearly with pressure from 7 x 10-11 at
low pressure to 1.1 x 10⁻¹⁰ at one atmosphere. Other studies by
Burrows lili. (1981), Kurylo li ale (1981), and Thrush and
Wilkinson (1981a) agree with these values. Although this
recommendation incorporates the most reliable and thorough studies,
it has not been reconciled in terms of the current models of reaction
rate theory. The observed pressure dependence implies the formation
of an H203 intermediate. Preliminary low pressure results from
Sridharan n.sl. (1983) indicate E/R = -400. Further direct
studies of the temperature and pressure dependences and products of
this reaction are required.
18. OH + 03. The recommendation for the OH + 03 rate constant is based on the room temperature measurements of Kurylo (1973) and Zahniser
and Howard (1980) and the temperature dependence studies of
40

Anderson and Kaufman (1973) and Ravishankara ~Al. (1979b).
Kurylo's value was adjusted (-8%) to correct for an error in the
ozone concentration measurement (Hampson and Garvin, 1977). The
Anderson and Kaufman rate constants were normalized to k = 6.3 x
10-14 cm3 molecule-1 s-1 at 295K as suggested by Chang and Kaufman
(1978).
19. OH + 08. The recommendation for the OH + 08 reaction is the average
of six measurements near 298K: Westenberg and de Haas (1973a), McKenzie
~~. (1973), Clyne and Down (1974), Trainor and von Rosenberg
(1974), Farquharson and Smith (1980) and Wagner and Zellner (1981).
The rate constants for these studies all fall between (1.4 and 2.3)
x 10-12 cm3 molecule-1 s-1. The temperature dependence is from
Wagner and Zellner, who reported rate constants for the range T = 250-580K.
20. OH + H202• There are extensive new data on the OH + H202 reaction. The recommendation is a fit to the temperature dependence studies of
Keyser (1980b), Sridharan ~sl. (1980), Wine ~Al. (1981c) and
Kurylo ~~. (1982b). The first two references contain a
discussion of some possible reasons for the discrepancies with
earlier work and an assessment of the impact of the new value on
other kinetic studies. A measurement at 298 K by Marinelli and
Johnston (1982a) agrees with the recommendatio~ There is some
evidence that the E/R decreases with temperature, therefore the
recommendation incorporates a large error limit on the temperature
dependence.
21. OH + H2• The OH + H2 reaction has been the subject of numerous studies (see Ravishankara ~~. (1981b) for a review of experimental and
theoretical work). The recommendation is fixed to the average of
nine studies at 298K: Greiner (1969), Stub! and Niki (1972),
Westenberg and de Haas (1973b), Smith and Zellner (1974), Atkinson
~~. (1975), Overend ~~.(1975), Tully and Ravishankara
41

(1980), Zellner and Steinert (1981), and Bavishankara ~ al.
(1981b). The E/B is an average of five temperature dependence
studies: Greiner (1969), Westenberg and de Haas (1973c), Smith and
Zellner (1974), Atkinson ~~. (1975), and Bavishankara ~~.
(1981b).
22. H02 + H02• Two separate expressions are given for the rate
constant for the H02 + H02 reactio~ The effective rate constant is given by the sum of these two equations. This reaction has been
shown to have a pressure independent bimolecular component and a
pressure dependent termolecular component. Both components have
negative temperature coefficients. The bimolecular expression is
obtained from data of Cox and Burrows (1979), Thrush and Tyndall
(1982a,b), Kircher and Sander (1983), and Takacs and Howard (1983).
Earlier results of Thrush and Wilkinson (1979) are inconsistent with
these dat~ The termolecular expression is obtained from data of Sander
~ ~ (1982), Simonaitis and Heicklen (1982) at room temperature
and Kircher and Sander (1983) for the temperature dependence. This
equation applies to M = air. On this reaction system there is
general agreement among investigators on the following aspects of
the reaction at high pressure ( P - 1 atm): (a) the H02 uv
absorption cross section: Paukert and Johnston (1972), Cox and
Burrows (1979), Hochanadel ~~. (1980), and Sander ~ Al. (1982); (b) the rate constant at 300K: Paukert and Johnston (1972),
Hamilton (1975), Hamilton and Lii (1977), Cox and Burrows (1979),
Lii g1 sl. (1979), Tsuchiya and Nakamura (1979), Sander ~ ale
(1982), and Simonaitis and Heicklen (1982) (all values fall in the
range (2.5 to 4.7) x 10- 12 cm3 molecule- 1 5- 1); (c) the rate
constant temperature dependence: Cox and Burrows (1979), Lii ~ ~
(1979), and Kircher and Sander (1983); (d) the rate constant water
vapor dependence: Hamilton (1975), Hochanadel ~ ale (1972),
Hamilton and Lii (1977), Cox and Burrows (1979), DeMore (1979), Lii
II Al. (1981), and Sander ~Al.. (1982); (e) the HID isotope
effect: Hamilton and Lii (1977) and Sander ~ sl. (1982); and (f)
42

the formation of H202 + 02 as the major products at 300K: Su,g.t. ru... (1979), Niki§!.sl.. (1980), Sander et.e.l.. (1982), and Simonait1s
and Heicklen (1982). Recent measurements by Sahetchian ~ ~.
(1982) give evidence for the formation of a small amount of H2 in
this system. For systems containing water vapor, the factors given
by Lii ll.s.l.. (1981) and Sander et al. (1982) can be incorporated.
23. H02 + 03. There is only one direct study of the H02 + ~ reaction
(Zahniser and Howard, 1980). This is the basis of the recommendation.
Three indirect studies, all using H02 + H02 as the reference reaction,
are in good agreement when the negative temperature dependence of
the reference reaction is considered (Simonaitis and Heicklen,
1973; DeMore and Tschuikow-Roux, 1974; and DeMore 1979). Another
direct study would be valuable. The A factor is unusually low.
24. N + 02. Unchanged from JPL 82-57. Activation energy based on Becker ,g.t.
~. (1969). Value and uncertainty at 298K assigned from average of
Clyne and Thrush (1961), Wilson (1967), Becker et li. (1969), Clark and
Wayne (1970) and Westenberg llsl. (1970b). Independent confirmation of
the temperature dependence is needed.
25. N + 03. Unchanged from JPL 82-57. Recommendation based on results of Stief et al. (1979). Note that this is an upper limit based on instrumental
sensitivity. Results of Stief et~. and Garvin and Broida (1963) cast doubt
on the fast rate reported by Phillips and Schiff (1962).
26. N + NO. Unchanged from JPL 82-57. Recommendation is based on the results
of Lee ~~. (1978c). A recent study by Husain and Slater (1980) reports
a room temperature rate constant 30 percent higher than the recommended value.
27. N + N02. Changed from JPL 82-57. Accepts the results of Clyne and
Ono (1982) for the value of the rate constant at 298 K. This is a
factor of 2 higher than that reported by Clyne and McDermid
(1975). However, Clyne and Ono consider that the more recent study
43

is probably more reliable. Husain and Slater (1980) reported a
room temperature rate constant of 3.8 x 10⁻¹¹ cm3 molecule-1 s-1 which
is a factor of 12 greater than the value reported by Clyne and Ono.
This high value may indicate the presence of catalytic cycles as
discussed by Clyne and McDermid, and Clyne and Ono. There are no
studies of the temperature dependence of the rate constant. The
reaction products are taken to be N20 + ° (Clyne and McDermid).
28. ° + N02' Unchanged from JPL 82-57. Based on results of Davis ~
sl. (1973a), Bemand ~Al. (1974) and Slanger ~ ale (1973), there may
be a slight negative temperature coefficient, but the evidence at low
temperature is uncertain.
29. ° + N03 • Unchanged from JPL 82-57. Based on study of Graham and
Johnston (1978) and 298K and 329K. While limited in temperature
range, the data indicate no temperature dependence. Furthermore,
by analogy with the reaction of ° with N02' it is assumed that this
rate constant is in fact independent of temperature. Clearly, temperature
dependent studies are needed.
30. ° + N205• Unchanged from JPL 82-57. Based on Kaiser and Japar
(1978).
31. 0+ HN03 • Unchanged from JPL 82-57. Accepts the upper limit reported by
Chapman and Wayne (1974).
32. ° + H02N02' Unchanged from JPL 82-57. Recommended value is based on the study of Chang ~si. (1981). The previous recommendation was
based upon the unpublished results of the same group. The large uncertainties
in EtR and k at 298K are due to the fact that this is a single study.
33. 03 + NO. Unchanged from JPL 82-57. The recommended Arrhenius expression
is a least squares fit to the data reported by Birks ~ al. (1976),
Lippmann ~Al. (1980), Ray and Watson (1981b), Michael ~ Al.
44

(1981) and Borders and Birks (1982) at and below room temperature, with
the data at closely spaced temperatures reported in Lippmann ~ .s.l..
and Borders and Birks being grouped together so that these five studies
are weighted equally. This expression fi ts all the data wi thin the
temperature range 195-304K reported in these five studies to within 20
percent. Only the data between 195 and 304K were used to derive the
recommended Arrhenius expression due to the observed non-linear Arrhenius
behavior (Clyne et Al. (1964), Clough and Thrush (1967), Birks ~ al., Michael ~ sl.. and Borders and Birks). Clough and Thrush, Birks ~ al.,
Schurath et al. (1981), and Michael et al. have all reported individual
Arrhenius parameters for each of the two primary reaction channels. The
range of values for k at stratospheric temperatures is somewhat larger than
would be expected for such an easy reaction to study. The measurements of
Stedman and Niki (1973) and Bemand ~ gl (1974) of k at 298K are in excellent
agreement with the recommended value of k at 298K.
34. NO + H02• Unchanged from JPL 82-57. The recommendation for H02 + NO is
based on the average of six measurements of the rate constant near room
temperature: Howard and Evenson (1977), Leu (1979), Howard (1979),
Glaschick-Schimpf ~ ~ (1979), Hack ~ sl.. (1980), and Thrush and
Wilkinson (1981). All of these are in quite good agreement. An
earlier study from the Thrush Laboratory, Burrows ~ sl. (1979),
has been dropped because of an error in the reference rate
constant, k(OH + H202). The temperature dependence is from Howard (1980) and is in reasonable agreement with that given by Leu
(1979). A high pressure study is needed in view of the many unusual
effects seen in other H02 reactions.
35. NO + N03• Unchanged since JPL 82-57. Value reported by Graham and
Johnston (1978).
36. OH + HN03• Unchanged from JPL 82-57. Even though there have been
several recent studies of this reaction, all of the reported data
are not completely consistent. However, the data which are
45
relevant for stratospheric conditions of temperature and pressure
are in reasonable agreement. The recommended Arrhenius expression
is based on a least squares fit to the data reported by Wine ~
ale (1981b), Kurylo et ale (1982b), Margitan and Watson (1982),
Marinelli and Johnston (1982a), Ravishankara ~ ale (1982), Jourdain
et Al. (1982) and Smith ~ Al. (1983) at and below room
temperature, i.e. -300K, but did not utilize the data of Smith and
Zellner (1975), Margitan et Al. (1975), Nelson et 51. (1981) and
Connell and Howard (1983). While the data of Margitan and Watson
appear to be in good agreement with data reported in the other
recent flash photolysis studies (Wine ~~, Kurylo ~ gl.,
Ravishankara et ~., Marinelli and Johnston and Smith ~ ~.) it
exhibits one rather significant difference, i.e., a small but
measurable pressure dependence which is greatest at low
temperatures (a factor of 1.1 increase in k from 20-100 torr He at
298 K, and a factor of 1.4 increase in k from 20-100 torr He at -235K). Consequently it is difficult to reconcile the data of Margitan and
Watson with that of the other flash photolysis studies where no
pressure dependence was observed. Although the low pressure discharge
flow results of Jourdain ~sl. are in excellent agreement with the
results from the higher pressure studies (at least below 300K), this
agreement does not preclude a pressure dependence as the magnitude of
the effect at temperatures ~ 250 K is small in the range 1-40 torr
(1 torr is a typical discharge flow tube pressure, and 40 torr is
the typical flash photolysis pressure). The data of Margitan and Watson
at 40 torr (He and Ar) at each temperature were used in deriving the
recommended Arrhenius expression (data relevant to the mid
stratosphere and typical of the pressure conditions used in other
flash photolYSiS studies). Under these conditions the data are in
excellent agreement with the data from the other preferred studies.
It should be noted that the 40 torr data is the average of all the
data; consequently, the preferred value is not dependent upon which
subset of Margitan and Watson data is used. The recent work of Nelson
~ sl. should be disregarded as it has been superseded by the
46

more careful and comprehensive Marinelli and Johnston study. However,
it is not presently possible to explain the difference between the data
from the preferred studies and that from the discharge flow study of
Connell and Howard, who determined a value for k at 301K of 8.4 x 10⁻¹⁴
cm3 molecule s-1 (consistent with the earlier values of Smith
and Zellner, and Margitan et sl.), in contrast to the recommended
value of 12.5 x 10⁻¹⁴ cm3 molecule-1 s-1. In addition
Connell and Howard reported a value for E/R of -430K, in contrast to the
recommended value of -778K and the earlier values of zero.
The recommended Arrhenius expression was derived using only data
from -220-300K due to the non-linear Arrhenius behavior noted above 300K in all the recent studies except Jourdain ll.sl..and Smith II
~, who reported linear Arrhenius behavior from 251-403K and 240-
370K, respectively. Marinelli and Johnston fit all their data (218-363K)
to an Arrhenius expression, but curvature is noticeable and hence their value
of -644K for E/R would be greater over the temperature range 218-298K.
This non-linear Arrhenius behavior can easily be rationalized in terms of an
addition channel (dominating at low temperatures), and an H atom
abstraction channel (dominating at high temperatures).
Nelson ~ sl., Jourdain ~.sl.., and Ravishankara ~ sl. (1982) have
all shown that within experimental evidence the yield of N03 per HO
removed is unity at 298 K. In addition Ravishankara ~ sl.
obtained similar product distribution results at 250 K. There is no
evidence for the production of H202·
37. OH + H02N02. Unchanged from JPL 82-57. Recommendation for both k at 298K and the Arrhenius expression based upon the data of
Trevor ~.li. (1982), Barnes ~.el. (1981) and Smith ~.li.
(1983). Trevor ~ .sl.., studied this reaction over the temperature
range 246-324 K and reported a temperature invariant value of 4.2 x
10-12 cm3 molecule-1 s-1, although a weighted least squares fit to
their data yields an Arrhenius expression with an E/R value of
(193*193) K. In contrast, Smith ~.sl.. studied the reaction
over the temperature range 240-330 K and observed a negative
47

temperature dependence with an E/R value of -(650%30)K. Barnes ~
.sY., only studied the reaction at room temperature. The values of
k at 298K from the three studies are in exoellent agreement. An
unweighted least squares fit to all the experimental data of
Trevor §.t. li., Barnes §.t. Al., and Smith §.t. li. yields the
reoommended Arrhenius expression. The large differenoe in E/R values may
be due to the reaction being oomplex and having different E/R values at low
pressure, i.e., <1 torr (Trevor g1 Al.) and high pressures (760 torr
(Smith ~li.». The less precise value for kat 298 K reported by
Littlejohn and Johnston (1980) is in fair agreement with the reoommended
value. The error limits on the reoommended E/R are sufficient to
encompass the results of both Trevor g1~. and Smith ~ Al. It
should be noted that the values of k at 220 K deduced from the two
studies differ by a factor of 2. Clearly addi tional studies of k
as a funotion of temperature, and the identification of the
reaotion products are needed.
38. 03 + N02• Unchanged from JPL 82-57. Based on least squares fit
to data in studies of Davis ~ Al. (1974b), Graham and Johnston (1974)
and Huie and Herron (1974).
39. 03 + HN02• Unohanged from JPL 82-57. Based on Kaiser and Japar (1977) and Streit ~Al. (1979).
40. OH + NH3 • New entry. The recommended value at 298K is the average
of the values reported by Stuhl (1973b), Smith and Zellner (1975),
Perry ~ Al. (1976b), and Silver and Kolb (1980). The values
reported by Kurylo (1973), Hack ~~. (1974), Pagsberg ~ Al. (1979)
and Cox ~ Al. (1975) were not inoluded. The temperature
dependence is based on the results reported by Haok ~ Ai., Smith
and Zellner, Perry II Al., and Silver and Kol b, and the
preexponential factor has been selected to fit the recommended room
temperature value.
48

41. NH2 + OH. New entry. No experimental data exist. Based upon
mechanistic and thermodynamic considerations, the reaction is
expected to be quite rapid, probably producing NH and H20
42. NH2 + H02. New entry. There is fairly good agreement on the value
of k at 298K between the direct study of Kurasawa and Lesclaux
(1980b), and the relative studies of Cheskis and Sarkisov (1979) and
Pagsberg et sl.. (1979). The recommended value is the average of
the values reported in these three studies. The identity of the
products is not known; however, Kurasawa and Lesclaux suggest that
the most probable reaction channels give either NH3 + 02 or HNO +
H20 as products.
43. NH2 + NO. New entry. The recommended value for k at 298K is the
average of the values reported by Gordon et sl. (1971), Gehring ~
Al. (1973), Lesclaux ~ .al., (1975), Hancock II Al., (1975),
Sarkisov et al. (1978), Hack et Al. (1979b), Stief ~~. (1982)
and Silver and Kolb (1982). The values reported in these studies
for k at 298K range from 8.3 to 27.0 (x 10-12) cm3 molecule-1 s-1,
which is not particularly satisfactory. The results tend to
separate into two groups. The flash photolysis results average 1.9
x 10-11 cm3 molecule- 1 s-1, while those obtained using the
discharge flow technique average 0.9 x 10- 11 cm3 molecule- 1 s-1.
The apparent discrepancy cannot simply be due to a pressure effect
as the pressure ranges of the flash photolysis and discharge flow
studies overlapped, and none of the studies observed a pressure
dependence for ~ There have been four studies of the temperature
dependence of k. Each study reported k to decrease with increasing
temperature, i.e. r 1•25 (Lesclaux et.al. from 300-500K), r 1•85
(Hack ~ ru... from 210-503K), T-1.67 exp(-684/T) (Silver and Kolb
rrom 294-1215K). The recommended temperature dependence is taken
to be a weighted average of the data below 500K from all four
studies. The expression is: k = 1.6 x 10⁻¹¹ (T/298)-1.5 for the
temperature range 210-500K.
49

While there are many conceivable reaction channels, the channel
yielding H20 and N2 appears to be the dominant channel with strong
vibrational excitation of the product H20 observed by Gehring ~
sl., and more recently by Wolfrum ~sl. (1981). To date atomic
hydrogen has not been observed as a reaction product, suggesting
that the channel producing N2 + H + OH is of limited importance.
The hydroxyl radical has been observed by both Silver and Kolb, and
Wolfrum ~~ However, while Silver and Kolb reported a yield of
40% for OH production, Wolfrum ~ ~ tentatively placed an upper
limit of 15% on OH productio~ Stief ~sl. failed to observe OH
production and placed an upper limit of 22% on OH production in
agreement with Wolfrum et sl. Clearly more work on this reaction
is required.
44. NH2 + N02• New entry. There have been two studies of this
reaction (Hack ~ ale (1979b), and Kurasawa and Lesclaux (1979».
There is very poor agreement between these two studies both for k
at 298K (factor of 2.3) and for the temperature dependence of k (r-3•O
and ~1.3). The recommended values of k at 298K and the
temperature dependence of k are averages of the results reported in
these two studies. Hack ~~ have shown that the predominant
reaction channel (>95%) produces N20 + H20.
45. NH2 + 02. New entry. There have been five studies of this reactio~ Upper limits have been reported by Lesclaux and Demissy
(1977), Pagsberg ~ 51. (1979), and Cheskis and Sarkisov (1979) of
2 x 10-18, 8 x 10-15 and 1.5 x 10⁻¹⁷ cm3 molecule-1 s-1,
respectively. Jayanty ~~. (1976) reported a lower limit of 4 x
10-15 cm3 molecule-1 s-1 from a relative study. Hack ~ ale (1982)
reported that there was an association reaction between NH2 and 02
from 295-353K whose rate constant could be expressed: k = 3.6 x 10⁻³³
(T/295)-2.0 cm6 molecule-2 s-1. Lesclaux (1982) restudied this
reaction under the conditions employed by Hack ~ ale and reported
50

that there was no detectible reaction at room temperature. The
upper limit recommended is based on the study of Lesclaux and
Demissy.
46. NH2 + 03. New entry. There have been three studies of this
reaction, by Kurasawa and Lesclaux (1980a), Bulatov ~ sl. (1980),
and Hack II li. (1981). The vaues of k at 298K vary by a factor of
three and the values of E/R reported by Kurasawa and Lesclaux, and
Hack ~ ale differ by a factor of -2. The recommended values of k
at 298K and E/R are averages of the reported dat~ Bulatov ~ ~.,
and Hack ~Al. observed a deviation of first order decay kinetics
at higher pressures of 03 and in both instances interpreted the
observations to indicate that the principal reaction channel leads
to formation of NH20 + 02 which is followed by the reaction of NH20
with 03 to regenerate NH2•
47. Cl + 03' Unchanged from JPL 82-57. The results reported for k(298K) by
Watson ~ sl. (1976), Zahniser ~sl. (1976), Kurylo and Braun
(1976) and Clyne and Nip (1976a) are in good agreement, and have
been used to determine the preferred value at this temperature.
The values reported by Leu and DeMore (1976) (due to the wide error
limits) and Clyne and Watson (1974a) (the value is inexplicably
high) are not considered. The four Arrhenius expressions are in
fair agreement within the temperature range 205-300K. In this
temperature range, the rate constants at any particular temperature
agree to within 30-40%. Although the values of the activation
energy obtained by Watson ~ ale and Kurylo and Braun are in
excellent agreement, the value of k in the study of Kurylo and
Braun is consistently (-17%) lower than that of Watson ~ ~.
This may suggest a systematic underestimate of the rate constant,
as the values from the other three studies agree so well at 298K. A
more disturbing difference is the scatter in the values reported
for the activation energy (338-831 cal mole-1). However, there
is no reason to prefer anyone set of data to any other; therefore,
51

the preferred Arrhenius expression shown above was obtained by
computing the mean of the four results between 205 and 298K.
Inclusion of higher temperature (~466K) experimental data would
yield the following Arrhenius expression: k = (3.4=1.0) x 10-11
exp(-310±76)/T).
Vanderzanden and Birks (1982) have interpreted their observation
of oxygen atoms in this system as evidence for some production
(0.1-0.5%) of 02 (1L~) in this reaction. The possible
production of singlet molecular oxygen in this reaction has also been
discussed by DeMore (1981), in connection with the Cl2 photo
sensitized decomposition of ozone.
48. CI + H2• Unchanged from JPL 82-57. This Arrhenius expression is based on
the data below 300K reported by Watson ~ Al. (1975), Lee ~Al.
(1977) and Miller and Gordon (1981). The results of these three
studies are in excellent agreement below 300K; the data at higher
temperatures are in somewhat poorer agreement. The results of
Watson ~ sl. and those of Miller and Gordon agree well (after
extrapolation) with the results of Benson ~sl. (1969) and Steiner
and Rideal (1939) at higher temperatures. For a discussion of the
large body of rate data at high temperatures see the review by
Baulch ~~. (1980). Miller and Gordon also measured the rate of
the reverse reaction, and the ratio was found to be in good
agreement with equilibrium constant data. Results of a new study
by Kita and Stedman (1982) are in excellent agreement with this
recommendation. They also measured the rate of the reverse
reaction and found the ratio to be in good agreement with
equilibrium constant data.
49. CI + CH4• Unchanged from JPL 82-57. The values reported from the thirteen
absolute rate coefficient studies for k at 298K fall in the range (0.99 to
1.48) x 10-13, with a mean value of 1.15 x 10⁻¹³ • However, based
upon the stated confidence limits reported in each study, the range
52

of values far exceeds that to be expected. A preferred average
value of 1.04 x 10⁻¹³ can be determined from the absolute rate
coefficient studies for k at 298K by giving equal weighting to the
values reported in Lin et al. (1978a), Watson ~~. (1976),
Manning and Kurylo (1977), Whytock ~~. (1977), Zahniser et al.
(1978), Michael and Lee (1977), Keyser (1978), and Ravishankara and
Wine (1980). The values derived for k at 298K from the competitive
chlorination studies of Pritchard ~sl. (1954), Knox (1955),
Pritchard et al. (1955), Knox and Nelson (1959), and Lin ~ al.
(1978a) range from (0.95 - 1.13) x 10-13 , with an average value of
1.02 x 10⁻¹³ • The preferred value of 1.04 x 10⁻¹³ was obtained by
taking a mean value from the most reliable absolute and relative
rate coefficient studies.
There have been nine absolute studies of the temperature dependence
of k. In general the agreement between most of these studies can
be considered to be quite good. However, for a meaningful analysis
of the reported studies it is best to discuss them in terms of two
distinct temperature regions, (a) below 300 K, and (b) above 300 K.
Three resonance fluorescence studies have been performed over the
temperature range -200-500 K (Whytock et~. (1977), Zahniser et sl. (1978) and Keyser (1978» and in each case a strong non
linear Arrhenius behavior was observed. Ravishankara and Wine
(1980) also noted nonlinear Arrhenius behavior over a more limited
temperature range. This behavior tends to explain partially the
large variance in the values of E/R reported between those other
investigators who predominantly studied this reaction below 300 K
(Watson ~al. (1976) and Manning and Kurylo (1977» and those
who only studied it above 300 K (Clyne and Walker (1973), Poulet ~
al. (1974), and Lin ~sl. (1978a». The agreement between all
studies below 300 K is good, with values of (a) E/R ranging from
1229-1320 K, and (b) k(230 K) ranging from (2.64-3.32) x 10-14 • The
mean of the two discharge flow values (Zahniser ~sl. (1978) and
Keyser (1978» is 2.67 x 10⁻¹⁴ , while the mean of the four flash
53
photolysis values (Watson ~A1. (1976), Manning and Kurylo (1977),
Whytock et sl. (1977), and Ravishankara and Wine (1980» is 3.22 x
10-14 at 230 K. There have not been any absolute studies at stra
tospheric temperatures other than those which utilized the resonance
fluorescence technique. Ravishankara and Wine (1980) have suggested
that the results obtained using the discharge flow and competitive
chlorination techniques may be in error at the lower temperatures
«240 K) due to a non-equilibration of the 2P1/2 and 2P3/2 states of atomic chlorine. Ravishankara and Wine observed that at
temperatures below 240 K the apparent bimolecular rate constant was
dependent upon the chemical composition of the reaction mixture;
i.e., if the mixture did not contain an efficient spin equilibrator,
e.g. Ar or CCI4, the bimolecular rate constant decreased at high
CH4 concentrations. The chemical composition in each of the
flash photolysis studies contained an efficient spin equilibrator,
whereas this was not the case in the discharge flow studies.
However, the reactor walls in the discharge flow studies
could have been expected to have acted as an efficient spin equili
brator. Consequently, until the hypothesis of Ravishankara and Wine
is proven it is assumed that the discharge flow and competitive
chlorination results are reliable. Above 300 K the three resonance
fluorescence studies reported (a) "averaged" values of E/R ranging
from 1530-1623 K, and (b) values for k (500 K) ranging from (7.74-
8.76) x 10-13• These mass spectrometric studies have been per
formed above 300 K with E/R values ranging from 1409-1790 K. The
data of Poulet et sl. (1974) are sparse and scattered, that of
Clyne and Walker (1973) show too strong a temperature dependence
(compared to all other absolute and competitive studies) and
k(298 K) is -20% higher than the preferred value at 298 K, while that of Lin et~. (1978a) is in fair agreement with the resonance
fluorescence results. In conclusion, it should be stated that the
best values of k from the absolute studies, both above and below
300 K, are obtained from the resonance fluorescence studies. The
competitive chlorination results differ from those obtained from the
54

absolute studies in that linear Arrhenius behavior is observed.
This difference is the major discrepancy between the two types of
experiments. The values of E/R range from 1503 to 1530 K, and
k (230 K) from (2.11-2.54) x 10-14 with a mean value of 2.27 x 10⁻¹⁴•
It can be seen from the above discussion that the average values at
230 K are: 3.19 x 10⁻¹⁴ (flash photolysis), 2.67 x 10⁻¹⁴ (discharge
flow) and 2.27 x 10⁻¹⁴ (competitive chlorination). These
differences increase at lower temperatures. Until the hypothesis of
Ravishankara and Wine (1980) is re-examined, the preferred Arrhenius
expression attempts to best fit the results obtained between 200 and
300 K from all sources. The average value of k at 298 K is 1.04 x
10-13 , and at 230 K is 2.71 x 10- 14 (this is a simple mean of
the three average values). The preferred Arrhenius expression is
9.6 x 10⁻¹² exp(-1350/T). This expression yields values
similar to those obtained in the discharge flow-resonance
fluorescence studies. If only flash photolysis-resonance
fluorescence results are used then an alternate expression of 6.4 x 10⁻¹²
(exp(-1220/T» can be obtained (k(298 K) = 1.07 x 10⁻¹³ , and k(230 K) = 3.19 x 10⁻¹⁴ ).
A recent study (Heneghan ~ sl. (1981» using very low pressure
reactor techniques reports results from 233 to 338K in excellent
agreement with the other recent measurements. They account for
the curvature in the Arrhenius plot at higher temperatures by
transition state theory. Measured equilibrium constants
are used to derive a value of the heat of formation of the methyl
radical at 298K of 35.1±0.1 kcal/mol.
50. Cl + C2H6. Unchanged from JPL 82-57. The absolute rate coefficients reported
in all four studies (Davis ~ Al. (1970), Manning and Kurylo (1977),
Lewis ~ Al. (1980), and Ray ~ al. (1980» are in good agreement
at 298 K. The value reported by Davis ~~. was probably
overestimated by -10% (the authors assumed that If was proportional
to [CllO.9, whereas a linear relationship between If and [Cll
55

probably held under their experimental conditions). The preferred
value at 298 K was taken to be a simple mean of the four values (the
value reported by Davis ~Al. was reduced by 10%), i.e., 5.7 x 10⁻¹¹ •
The two values reported for E/R are in good agreement; E/R = 61 K
(Manning and Kurylo) and E/R = 130 K (Lewis ~ al.). A simple
least squares fit to all the data would unfairly weight the data of
Lewis ~ ale due to the larger temperature range covered. Therefore,
the preferred value of 7.7 x 10⁻¹¹ exp(-90/T) is an expression which
best fits the data of Lewis ~ sl. and Manning and Kurylo between
220 and 350 K.
51. Cl + C3H8. Unchanged from JPL 82-57. This recommendation is based on results over the temperature range 220-607K reported in the recent
discharge flow-resonance fluorescence study of Lewis ~~ (1980). These
results are consistent with these obtained in the competitive chlorination
studies of Pritchard ~ ale (1955) and Knox and Nelson (1959).
52. Cl + C2H2. Unchanged from JPL 82-57. Since abstraction would be endotherm
by 9 kcal/mol, the initial step must be addition to give an excited C2H2Cl radical which either will be stabilized or will decompose to give the
original reactants. Lee and Rowland (1977), in a high pressure study using
radioactive tracer techniques, concluded that the initial addition must occur once in not more than 5 collisions. They calculated that under
conditions corresponding to the stratosphere at 30 km the overall
conversion of Cl to stabilized C2H2Cl proceeds with a rate
coefficient of about 1 x 10-12 cm3 molecule-1 s-1. Poulet ~al.
(1977) discuss their own earlier work using the discharge flow-mass
spectrometric technique at 1 torr helium in which they report a
value of (2.0~0.5) x 10-13 independent of temperature from 295-500K.
They point out that these results can be reconciled with those of
Lee and Rowland if the efficiency of stabilization of excited
C2H2Cl is 1/500 at 1 torr helium. The rate constant given in the
table is for the overall rate of conversion of Cl to a stabilized C2H2Cl radical under conditions of the stratosphere at 30 km. The probable
56

fate of this radical is reaction with 02·
53. Cl + CH30H. Unchanged from JPL 82-57. This recommendation is based on results
obtained over the temperature range 200-500K using the flash photolysis
resonance fluorescence technique in the only reported study of this reaction,
Michael ~ RJ... (1979b). This reaction has been used as a source of
CH20H and as a source of H02 by the reaction of CH20H with 02.
See Radford (1980) and Radford et RJ... (1981).
54. Cl + CH3Cl. Unchanged from JPL 82-57. The results reported by both groups
(Clyne and Walker (1973), and Manning and Kurylo (1977» are in good
agreement at 298 K. However, the value of the activation energy
measured by Manning and Kurylo is significantly lower than that
measured by Clyne and Walker. Both groups of workers measured the
rate constant for the Cl + CH4 and, similarly, the activation energy
measured by Manning and Kurylo was significantly lower than that
measured by Clyne and Walker. It is suggested that the discharge
flow-mass spectrometric technique was in this case subject to a systematic
error, and it is recommended that the flash photolysis results be used for
stratospheric calculations in the 200-300 K temperature range (see
discussion of the Cl + CH4 studies). In the discussion of the
Cl + CH4 reaction it was suggested that some of the apparent dis
crepancy between the results of Clyne and Walker and the flash photo
lysis studies can be explained by nonlinear Arrhenius behavior.
However, it is less likely that this can be invoked for this
reaction as the pre-exponential A-factor (as measured in the flash
photolysis studies) ~ already -3.5 x 10⁻¹¹ and the significant
curvature which would be required in the Arrhenius plot to make the
data compatible would result in an unreasonably high value for A
(> 2 x 10⁻¹⁰).
55. Cl + CH3CC13• New reaction. There has been only one study of this rate, that by Wine ~sl. (1982) using a laser flash photolysis-resonance
fluorescence technique. It was concluded that the presence of a reactive
57

impurity accounted for a significant fraction of the Cl removal, and therefore
only upper limits to the rate were reported for the temperature range 259-356K.
This reaction is too slow to be of any importance in atmospheric chemistry.
56. Cl + H2CO. Unchanged from JPL 82-57. The results from five of the six
published studies (Michael ~ sl. (1979a), Anderson and Kurylo (1979),
Niki ~sl. (1978a), Fasano and Nogar (1981) and Poulet ~sl. (1981»
are in good agreement at -298K, but -50% greater than the value reported by Foon ll.sU.. (1979). The preferred value at 298K (7.3 x
10-11 ) was obtained by combining the absolute values reported by
Michael ~ sl., Anderson and Kurylo, and Fasano and Nogar, with the
values obtained by combining the ratio of k(Cl + H2CO)/k(Cl + C2H6)
reported by Niki ~ sl. (1.3:0.1) and by Poulet ~ sl. (1.16·0.12)
with the preferred value of 5.7 x 10⁻¹¹ for k(Cl + C2 H6) at 298K.
The preferred value of E/R was obtained from a least squares fit to all
the data reported in Michael ~.sU.. and in Anderson and Kurylo.
The A-factor was adjusted to yield the preferred value at 298K.
57. Cl + H202• Unchanged from JPL 82-57. The absolute rate coefficients
determined at -298 K by Watson ~sl. (1976), Leu and DeMore (1976),
Michael ~sl. (1977), Poulet ~ sl. (1978a) and Keyser (1980a)
range in value from (3.6-6.2) x 10-13. The studies of Michael
~~., Keyser, and Poulet ~ sl. are presently considered to
be the most reliable. The preferred value for the Arrhenius
expression is taken to be that reported by Keyser. The A-factor
reported by Michael ~ sl. is considerably lower than that expected
from theoretical considerations and may possibly be attributed to
decomposition of H2 02 at temperatures above 300 K. The data
of Michael ~ sl. at and below 300 K are in good agreement with the
Arrhenius expression reported by Keyser. More data are required
before the Arrhenius parameters can be considered to be well
established.
58. Cl + HOCI. Unchanged from JPL 82-57. This recommendation is based on results
58

over the temperature range 243-365K using the discharge flow-mass
spectrometric technique in the only reported study of this reaction, Cook
et al. (1981a). In a subsequent paper, Cook et al. (1981b) argue that
C12 + OH are the major products of this reaction, even though
the reaction channel giving HCl + C10 is more exothermic.
59. Cl + HN03. Changed from JPL 82-57. Since the previous evaluation there have
been two stUdies of this rate, in which the decay of Cl atoms 1n
excess HN03 was monitored by resonance fluorescence (Kurylo
et al., 1983b) or by resonance absorption (Clark ~ al., (1982).
Both report values higher than those obtained in earlier discharge
flow-mass spectrometric studies by Leu and DeMore (1976) and by
Poulet et sl. (1978a) which monitored the decay of HN03 in
excess Cl. Kurylo ~ al. report a value for E/R of 1700K for
the temperature range 243-298K. Poulet et sl. report a value
for E/R of 4380K for the temperature range 439-633K. The higher
temperature data of Poulet g1 sl. are not directly applicable
to stratospheric conditions, and extrapolation to room temperature
may not be valid. The preferred value is based on assuming that
the room temperature data of Kurylo ~ ale represents an upper
limit. The higher value reported by Clark ~ Al. is based on
data which exhibit significant scatter and is not considered in
deriving the preferred value.
60. Cl + H02• Unchanged from JPL 82-57. The recommendations for the two
reaction channels are based upon the recent results by Lee and Howard
(1982) using a discharge flow system with laser magnetic resonance
detection of H02' OH and C10. The total rate constant is
temperature independent with a value of (4.2%0.7) x 10-11 cm3
molecule-1 s-1 over the temperature range 250-420K. This value
for the total rate constant is in agreement with the value
recommended in JPL 81-3, which was based on indirect studies
relative to Cl + H202 (Leu and DeMore (1976), Poulet et iLl.
(1978a), Burrows et sl. (1979) or to Cl + H2 (Cox (1980». The
59

contribution of the reaction channel producing OH + ClO (21% at
room temperature) is much higher than the upper limit reported by
Burrows ~sl. (1% of total reaction). The value of the rate
constant for this channel, when combined with the rate constant for
the reaction ClO + OH (assuming the products are Cl + H02) , yields
an equilibrium constant of 1.0. This gives a value for the heat of
formation of H02 at 298K of 3.3 kcal/mol, in reasonably good
agreement with the Howard (1980) value of 2.5~0.6 kcal/mole. Weissman
et sl. (1981) propose that the reaction proceeds by radical combination
to give an excited HOOCl intermediate whose stabilization may become
important at stratospheric temperatures.
61. Cl + Cl20. Unchanged from JPL 82-57. The preferred value of 9.8 x 10⁻¹¹
cm3molecule-1s-1 was determined from two independent absolute rate coefficient
studies reported by Ray ~~. (1980), using the discharge flow-resonance
fluorescence and discharge flow-mass spectrometric techniques.
This value has been confirmed by Burrows and Cox (1981) who determined
the ratio k(Cl + Cl20)/k(Cl + H2) = 6900 in modulated photolysis
experiments. The earlier value reported by Basco and Dogra (1971a)
has been rejected. The Arrhenius parameters have not been experimentally
determined; however, the high value of k at 298 K precludes a
substantial positive activation energy.
62. Cl + OClO. Unchanged from JPL 82-57. Data reported by Bemand, Clyne and
Watson (1973).
63. Cl + ClON02• Minor change from JPL 82-57. Recent flash photolysis/resonance
fluorescence studies by Margitan (1983a) and by Kurylo ~ sl.
(1983a) which are in good agreement show that the rate constant
for this reaction is almost two orders of magnitude faster than
that indicated by the previous work of Kurylo and Manning (1977)
and Ravishankara et Al. (1977b). It is probable that the slower
reaction observed by Kurylo and Manning was actually ° + ClN03 ,
not Cl + ClN03. The preferred value averages the results of
60

the two new studies.
64. CI + CINO. Unchanged from JPL 82-57. This value is based on the discharge
flow-resonance fluorescence study of Clyne and Cruse (1972) and the
flash photolysis-resonance fluorescence study of Nelson and Johnston
(1981). Grimley and Houston (1980) reported a value which is lower
than this preferred value by a factor of four. This low value may
be due to adsorption of CINO on the vessel walls in their static
experiment. There are no reliable data on the temperature dependence.
A new study by Kita and Stedman (1982) using the same technique as
that of Clyne and Cruse (1972) report a value which is a factor of
three higher than the preferred value. However, there are
insufficient data reported to assess the reliability of this result,
and the preferred value has therefore been left unchanged.
65. Cl + CIOO. Unchanged from JPL 82-57. Values of 1.56 x 10⁻¹⁰ , 9.8 x 10⁻¹¹ ,
and 1.67 x 10⁻¹⁰ have been reported for ka(CI + CIaO + Cl2 + 02) by
Johnston ~sl. (1969), Cox gial. (1979), and Ashford ~ ale
(1978), respectively. Values of 108, 20.9, 17, and 15 have been
reported for ka(Cl + CIaO + C12 + 02)/k(Cl + CIaO + 2 ClO) by
Johnston et al., Cox ~ al., Ashford ~al., and Nicholas and
Norrish (1968). Obviously the value of 108 by Johnston et lie is
not consistent with the others, and the preferred value of 17.6 was obtained
by averaging the other three values (this is in agreement with a value
that can be derived from a study by Porter and Wright (1953». The
absolute values of ka and kb are dependent upon the choice of ~ (CIaO)
(the values of liH<f (CIaO) reported by Cox ~ 5ll.. and Ashford ~ .sl..
are in excellent agreement, i.e. 22.7 and 22.5 kcal/mol,
respectively). The preferred value of ka(Cl + CIaO + C12 + 02) is taken to be the average of the three reported values, i.e. 1.4 x
10-10 cm3 molecule-1s-1• Consequently, the preferred value
of kb(Cl + CIaO + 2 CIa) is ka/ 17 •6 , i.e. 8.0 x 10⁻¹² cm3
molecule-1s-1• The E/R values are estimated to be zero, which is
consistent with other experimentally determined E/R values for atom-
61

radical reactions.
66. 0 + CIO. Unchanged from JPL 82-57. The recommended rate constant is base
on the experimental data of Bemand ~ si. (1973), Clyne and Nip (1976b),
and Zahniser and Kaufman (1977). The E/R values reported by Clyne and
Nip and Zahniser and Kaufman are in poor agreement. Before this
rate constant can be considered to be well established, additional data
are required.
67. CIO + NO. Unchanged from JPL 82-57. The absolute rate coefficients deter
mined in the four discharge flow mass spectrometric studies (Clyne
and Watson (1974a), Leu and DeMore (1978), Ray and Watson (1981a)
and Clyne and MacRobert (1980» and the discharge flow laser magnetic
resonance study Lee ~ Al. (1982) are in excellent agreement at
298K, and are averaged to yield the preferred value. The value
reported by Zahniser and Kaufman (1977) from a competitive study
is not used in the derivation of the preferred value as it is about 33%
higher. The magnitudes of the temperature dependences reported by
Leu and DeMore (1978) and Lee et al. are in excellent agreement.
Although the E/R value reported by Zahniser and Kaufman (1977) is
in fair agreement with the other values, it is not considered as it
is dependent upon the E/R value assumed for the CI + 03 reaction.
The Arrhenius expression was derived from a least squares fit to
the data reported by Clyne and Watson, Leu and DeMore, Ray and Watson,
Clyne and MacRobert and Lee ~al.
68. CIO + H02• Unchanged from JPL 82-57. There have been four low pressure
discharge flow studies, each using a different experimental detection
technique, and one high pressure molecular modulation study
(Burrows and Cox, 1981) at 298 K. The values reported at 298 K,
in units of 10-12 cm3 molecule-1s-1, are 0.85±0.19 (Poulet ~ ~.,
1978b), 3.8:1:0.5 (Reimann and Kaufman 1978), 4.5:1:0.9 (Leck ~ li.,
1980), 6.3±1.3 (Stimpfle ~ al., 1979), and 5.4!~ (Burrows and Cox,
1981). The value of Poulet et ale was disregarded and the preferred
62

value taken to be the mean of the other four values, i.e. k = 5.0 x 10⁻¹² cm3
molecule-1s-1• The agreement between the low pressure values
and the one atmosphere value suggests the absence of a third order
complex forming process. The only temperature dependence study
(Stimpfle ~sl.) resulted in a non-linear Arrhenius behavior. The
data were best described by a four parameter equation of the form
k = Ae-B/ T + CTn, possibly suggesting that two different mechanisms
may be occurring. The expression forwarded by stimpfle ~ sl. was
3.3 x 10⁻¹¹ exp(-850/T) + 4.5 x 10⁻¹² (T/300)-3.7. Two possible
preferred values can be suggested for the temperature dependence of
k; (a) an expression of the form suggested by Stimpfle ~al., but
where the values of A and C are adjusted to yield a value of 5.0 x
10-12 at 298 K, or (b) a simple Arrhenius expression which fits the data
obtained at and below 300 K (normalized to 5.0 x 10- 12 at 298 K),
i.e., 4.6 x 10⁻¹³ exp(710/T). The latter expression is preferred.
The two most probable pairs of reaction products are, (1) HOCI + 02
and (2) HCI + 03• Both Leu (1980b) and Leck ~ sl. used mass spectrometric detection of ozone to place upper limits of 1.5% (298 K),
3.0% (248 K) and 2.0% (298 K), respectively, on k2/k. Burrows and Cox
report an upper limit of 0.3% for k2/k at 300 K.
69. CIO + H2CO. Unchanged from JPL 82-57. Poulet ~ al. (1980) have determined an upper limit of 10-15cm3molecule-1s-1 for k at 298 K using
the discharge flow-EPR technique.
70. CIO + OH. Changed from JPL 82-57, which recommendation was based on
preliminary, uncorrected results of a discharge flow-resonance fluorescence
temperature dependent study, which is now published (Ravishankara
et gl. (1983a» and a similar study at room temperature by Leu and
Lin (1979). In the published paper by Ravishankara ~ al., the
preliminary values have been corrected for interference due to OH
regeneration by the reaction CI + H02 + OH + CIO. The same
correction applied to the published results of Leu and Lin gives a
room temperature value in very good agreement with Ravishankara
63

et Al.'s corrected value (M. T. Leu, private communication).
The preferred value at 298 K is the mean of the values reported in
these two studies. The A-factor was adjusted to give the preferred
value at 298 K. Leu and Lin determined a lower limit of 0.65 for
k1(OH + C10 + H02 + Cl)/k (OH + C10 + products) at 298K.
The approach was somewhat indirect and the actual value of k1/k
may be unity. If in fact it is unity, then the value of this rate
constant and that for the reverse reaction (Cl + H02 + OH + C10)
are consistent with the Howard (1980) value of 2.5*0.6 kcal/mol
for the heat of formation of H02. See note on Cl + H02 reaction.
Additional studies of the rate and mechanism as a function of pressure
and temperature are needed.
71. C10 Reactions. Unchanged from JPL 82-57. These upper limits are based
on the data of Walker (reported in Clyne and Watson (1974a». The upper
limits shown for k (298) were actually determined from data collected at
either 587 K or 670 K. The Arrhenius expressions were estimated
based on this -600 K data.
72. C10 + C10. No recommendation at present. For a discussion of the
C10 + C10 reactions the reader is referred to Watson (1977, 1980).
73. C10 + 03• Unchanged from JPL 82-57. The branching ratio between
the two channels is not known, but, for the present discussion, is
assumed to be unity. The Arrhenius parameters were estimated, and
the upper limit rate constants are based on data reported by DeMore,
Lin and Jaffe (1976) and by Wongdontri-Stuper ~A1. (1979).
74. OH + HC1. Unchanged from JPL 82-57. There is good agreement between six
groups of workers at -298K (Takacs and Glass (1973c), Zahniser
~ ale (1974), Smith and Zellner (1974), Ravishankara ~ sl.
(1977a), Hack ~sl. (1977) and Husain ~ sl. (1981» and the
preferred value at this temperature is the average of the six. The
Arrhenius expression was derived by giving an equal weighting to
64

data reported by Zahniser ~ ~., Ravishankara ~ al., and Smith
and Zellner. There have been several very recent studies of this
rate. Preliminary values by Molina, by Ravishankara, and by Keyser
are all higher than the preferred value, and therefore the error
limit has been increased slightly.
75. OH + HOCI. Unchanged from JPL 82-57. There are no experimental data
for this reaction. This is an estimated value based on the OH + H202 reaction, which should have roughly similar E/R and A values.
76. OH + Subst~tuted Methanes. There have been several studies of each of the
OH + CHxFyX(4_x_y) (X = CI or Br) reactions, i.e. OH + CH3CI, CH2CI2'
CHCI3 , CHFCI2, CHF2CI, CH2CIF, and CH3Br. In each case there has been
quite good agreement between the reported results (except for Clyne and Holt,
(1979b», both at -298 K and as a function of temperature. However,
in certain cases it can be noted that the E/R values obtained from
studies performed predominantly above 298 K were greater than the
E/R values obtained from studies performed over a lower temperature
range, e.g. the E/R value for OH + CH3CI reported by Perry ~ al. (1976a) is significantly higher than that reported by Davis ~ al.
(1976). These small but significant differences could be
attributed to either experimental error or non-linear Arrhenius
behavior. The recent results of Jeong and Kaufman (1982) have shown
a non-linear Arrhenius behav~or for each reaction studied. They
found that their data could best be represented by a three parameter
equation of the form AT2exp(-B/T). The experimental AT2exp(-B/T)
fit ~s stated by the authors to be in agreement with that expected
from transition state theory.
The preferred values shown in this review were obtained by first
fitting all of the absolute rate data for each reaction (except Clyne
and Holt (1976b» to the three parameter equation AT2 exp (-B/T),
and then simplifYing these equations to a set of "derived
Arrhenius expressions" centered at 265 K. The derived Arrhen~us
65

expressions were centered at 265 K as a temperature representative
of the mid-troposphere. The AT2exp(-B/T) expressions are given
for each reaction in the individual notes, while the nderived
Arrhenius expressionsn are entered in the table of preferred values.
Obviously nderivedn Arrhenius expressions can be centered at any
temperature from the three parameter equations (these should be
restricted to within the temperature range studied). Transforming
k = AT2exp(-B/T) to the form k = A'exp(-E/T): E' = B + 2T and
A' = A x e2 x T2.
Unchanged from JPL 82-57. The preferred values were obtained using
only absolute rate coefficient data. The data of Howard and
Evenson (1976a), Davis et Al. (1976), Perry ~ sl. (1976a),
Paraskevopoulos ~ Al. (1981) and Jeong and Kaufman (1982) are in good
agreement and were used to determine the preferred values. Fitting the data
to an expression of the form AT2exp(-B/T) results in the equation
3.49 x 10⁻¹⁸ T2exp(-582/T) over the temperature range (247-483)K. This
results in a preferred value of 4.40 x 10⁻¹⁴cm3 molecule-1s-1 for
k at 298 K. The derived Arrhenius expression centered at 265 K is 1.81 x
10-12exp(-1112/T).
Unchanged from JPL 82-57. The preferred values were obtained using
only absolute rate coefficient data. The accuracy of the OH + CH4/
OH + CH2Cl2 study (Cox ~ sl. 1976a» was probably no better than
a factor of 2. The data of Howard and Evenson (1976a), Davis ~ al.
(1976), Perry et al. (1976a), and Jeong and Kaufman (1982) are in
good agreement and were used to determine the preferred value (the
values of Davis ~ sl. are somewhat lower (20%) than those reported
in the other studies but are included in the evaluation). Fitting
the data to an expression of the form AT2exp(-B/T) results in the
66

equation 8.58 x 10⁻¹⁸ T2exp(-502/T) over the temperature range
245-455 K. This results in a preferred value of 1.41 x 10⁻¹³cm3
molecule- l s- l for k at 298 K. The derived Arrhenius expression
centered at 265 K is 4.45 x 10⁻¹²exp(-1032/T).
OH + CHC13
Unchanged from JPL 82-57. The preferred values were obtained using
only absolute rate coefficient data. The accuracy of the OH + CH4/
OH + CHC13 study (Cox ~ al. (1976a» was probably no better than
a factor of 2. The data of Howard and Evenson (1976a), Davis ~ sl.
(1976) and Jeong and Kaufman (1982) are in good agreement and were
used to determine the preferred values. Fitting the data to an
expression of the form AT2exp(-B/T) results in the equation 6.3 x
10-18exp(-504/T) over the temperature range 245-487 K. This results
in a preferred value of 1.03 x 10⁻¹³cm3molecule-l s- l for k at 298 K.
The derived Arrhenius expression centered at 265 K is 3.27 x 10⁻¹²
exp(-1034/T).
OH + CHFC12
Unchanged from JPL 82-57. The preferred values were derived using the
absolute rate coefficient data reported by Howard and Evenson
(1976a), Perry ~ sl. (1976a), Watson ~ al. (1977), Chang and
Kaufman (1977a), Paraskevopoulos ~ ale (1981) and Jeong and Kaufman
(1982). The data of Clyne and Holt (1979b) was not considered as
it is in rather poor agreement with the other data within the temperature
range studied, e.g. there 1S a difference of -65% at 400 K. Fitting
the data to an expression of the form AT2exp(-B/T) results in the
equation 1.71 x 10⁻¹⁸ T2exp(-483/T) over the temperature range 241-483 K.
This results in a preferred value of 3.0 x 10⁻¹⁴cm3molecule-ls-l
for k at 298 K. The derived Arrhenius expression centered at 265 K
is 0.89 x 10⁻¹²exp(-1013/T).
67

OH + CHF2Cl
Unchanged from JPL 82-57. The preferred values were derived using
the absolute rate coefficient data reported by Howard and Evenson
(1976a), Atkinson ~ sl. (1975), Watson ~ sl. (1977), Chang and
Kaufman (1977a), Handwerk and Zellner (1978), Paraskevopoulos II
sl. (1981) and Jeong and Kaufman (1982), which are in good agreement.
The data of Clyne and Holt (1979b) was not considered as it is in rather
poor agreement with the other data within the temperature range studied,
except at 298 K (the reported A-factor of -1 x 10-11 cm3molecule- l s-1 is
inconsistent with that expected theoretically). Fitting the data
to an expression of the form AT2 exp(-B/T) results in the equation
1.51 x 10⁻¹⁸ T2exp(-1000/T) over the temperature range 250-482 K.
This results in a preferred value of 4.68 x 10⁻¹⁵cm3molecule-ls-l
for k at 298 K. The derived Arrhenius expression centered at 265 K
is 0.78 x 10⁻¹²exp(-1530/T).
Unchanged from JPL 82-57. The preferred values were derived us~ng the
absolute rate coefficient data reported by Howard and Evenson
(1976a), Watson ll..a.l.. (1977), Handwerk and Zellner (1978),
Paraskevopoulos ~~. (1981) and Jeong and Kaufman (1982) which are
in fair agreement. Fitting the data to an expression of the form
AT2exp(-B/T) results in the equation 3.77 x 10⁻¹⁸ T2exp(-604/T) over
the temperature range 245-486 K. This results in a preferred value of
4.41 x 10⁻¹⁴ cm3 molecule- l s- l for k at 298 K. The derived Arrhenius
expression centered at 265 K is 1.96 x 10⁻¹²exp(-1134/T).
77. OH + CH3CCl3. Unchanged from JPL 82-57. This evaluation is based on
the recent data of Jeong and Kaufman (1979) and Kurylo~..a.l. (1979).
Their results are in excellent agreement over the temperature range
250-460 K. The earlier results of Howard and Evenson (1976b),
Watson ~ sl. (1977), Chang and Kaufman (1977a) and Clyne and Holt
68

(1979a) were discounted in favor of the recent results. The earlier
results showed higher values of the rate constant, and lower E/R
values. This may be indicative of the CH3CCl3 used in the early studies
being contaminated with small amounts of a reactive olefinic
impurity.
78. OH + C2C14' Unchanged from JPL 82-57. The preferred value at 298 K
is a mean of the values reported by Howard (1976) and Chang and Kaufman
(1977a). The value reported by Winer ~ ale (1976), which is more than a
factor of 10 greater, is rejected. The preferred Arrhenius parameters
are those of Chang and Kaufman.
79. OH + C2HCI3• Unchanged from JPL 82-57. The preferred value at 298K
is a mean of the values reported by Howard (1976) and Chang and Kaufman
(1977a). The value derived from a relative rate coefficient study by W~ner
~.9.l.. (1976) is a factor of about -2 greater than the other values and
is not considered in deriving the preferred value at 298 K. The
Arrhenius parameters are based on those reported by Chang and Kaufman
(the A-factor is reduced to yield the preferred value at 298K).
80. OH + CFCl3 and OH + CH2Cl2' Unchanged from JPL 82-57. The A-factor was
estimated, and a lower limit was derived for E/R by using the upper limits
reported for the rate constants by Chang and Kaufman (1977b) at about
-480 K. These expressions are quite compatible with the upper limits
reported for these rate constants by Atkinson ~.9.l.. (1975),
Howard and Evenson (1976a), Cox ~ ale (1976a) and Clyne and Holt
(1979b). None of the investigators reported any evidence for
reaction between OH and these chlorofluoromethanes.
81. OH + CION02' Unchanged from JPL 82-57. The results reported by Zahniser
et.9.l.. (1977) and Ravishankara ~ ale (1977b) are in good agreement
at _245K (within 25%), considering the difficulties associated with
handling CION02• The preferred value is that of Zahniser ~ ale
Neither study reported any data on the reaction products.
69

82. ° + HC1. Unchanged from JPL 82-57. Fair agreement exists between
the results of Brown and Smith (1975), Wong and Belles (1971),
Ravishankara ~sl. (1977a), Hack ~ al. (1977) and Singleton
and Cvetanovic (1981) at 300K (some of the values for k (300K)
were obtained by extrapolation of the experimentally determined
Arrhenius expressions), but these are a factor of -7 lower than that of Balakhnin ~ sl. (1971). Unfortunately, the
values reported for E/R are in complete disagreement, ranging
from 2260-3755K. The preferred value was based on the results
reported by Brown and Smith, Wong and Belles, Ravishankara ~ Al., Hack ~ al. and Singleton and Cvetanovic but not those reported
by Balakhnin ~ al.
83. ° + HOC1. Unchanged from JPL 82-57. There are no experimental data;
this is an estimated value based on rates of o-atom reactions with
similar compounds.
84. ° + C10N02• Unchanged from JPL 82-57. The results reported by Molina
~~. (1977b) and Kurylo (1977) are in good agreement, and this data
has been used to derive the preferred Arrhenius expression. The
value reported by Ravishankara et .s.l. (1977b) at 245K is a factor
of 2 greater than those from the other studies, and this may
possibly be attributed to (a) secondary kinetic complications, (b) presence
of N02 as a reactive impurity in the C1ON02, or (c) formation of
reactive photolytic products. None of the studies reported
identification of the reaction products. The recent room temperature
result of Adler-Golden and Wiesenfeld (1981) is in good agreement
with the recommended value.
85. ° + C120. Minor change from JPL 82-57. Recommendation averages the
resl ts of Miziolek and Molina (1978) for 236-295K with the
approximately 30 percent lower values of Wecker ~ sl. (1982) over
the same temperature range. Earlier resul ts by Basco and Dogra
(1971a) and Freeman and Phillips (1968) have not been included in the
70

derivation of the preferred value due to data analysis difficulties
in both studies.
86. ° + OClO. Unchanged from JPL 82-57. Arrhenius expression was estimated
based on 298 K data reported by Bemand, Clyne and Watson (1973).
87. NO + OClO. Unchanged from JPL 82-57. Arrhenius expression was estimated
based on 298 K data reported by Bemand, Clyne and Watson (1973).
88. Br + 03• Unchanged from JPL 82-57. The results reported for k (298K)
by Clyne and Watson (1975), Leu and DeMore (1977), Michael ~ sl.
(1978) and Michael and Payne (1979) are in excellent agreement.
The preferred value at 298 K is derived by taking a simple mean of
these four values. The temperature dependences reported for k by
Leu and DeMore, Michael gi al. and Michael and Payne can only be
considered to be in fair agreement. There is a spread of 25% in k
at 200 K and 50% at 360 K. Although the results reported by
Michael ~ sl. and Michael and Payne are in good agreement, there
is no reason at present to discard the results of Leu and DeMore. Therefore,
until further results are reported, the preferred value was synthesized
to best fit all the data reported from these four studies.
89. Br + H202 • Unchanged from JPL 82-57. Using the discharge flow-mass
spectrometric technique Leu (1980a), and Posey ~sl. (1981) determined
an upper limit for k of -2 x 10-15 at -298 K. Leu also reported an
upper limit for k of 3 x 10-15 at 417 K. An estimate of the Arrhenius
expression would be <1 x 10-11 exp (-2500/T). The A-factor was chosen
to be consistent with that determined for the Cl + H2 02 reaction, and the E/R value was calculated to yield the upper limit at 298 K.
90. Br + H2CO. Unchanged from JPL 82-57. There have been two studies of
this rate constant as a function of temperature; Nava ~ sl. (1981),
using the flash photolysis-resonance fluorescence technique, and Poulet
~sl. (1981), using the discharge flow-mass spectrometric
71

technique. These results are in reasonably good agreement. The
Arrhenius expression was derived from a least squares fit to the
data reported in these two studies. The higher room temperature
value of LeBras ~ ale (1980) using the discharge flow - EPR
technique has been shown to be in error due to secondary chemistry
(Poulet gi al.).
91. Br + H02• Unchanged from JPL 82-57. Posey ~~. (1981) used the
discharge flow-mass spectrometric technique to determine a value of 2
x 10-13 (±factor of 2) for k at 298K. This value seems low for an
atom-radical reaction; for example, it is two orders of magnitude
lower than the corresponding reaction of H02 with Cl. Therefore,
until there is additional data, it is suggested that this be used as
a lower limit.
92. Bra + O. Unchanged from JPL 82-57. The preferred value is based on the
value reported by Clyne ~ ale (1976). This value appears to be quite
reasonable in light of the known reactivity of CIO radicals with
atomic oxygen. The temperature dependence of k is expected to be
small for an atom-radical process, e.g., a + CIO.
93. Bra + CIO. Unchanged from JPL 82-57. The results reported by Clyne
and Watson (1977) and Basco and Dogra (1971b) differ not only in the
magnitude of the rate constants, but also in the interpretation
of the reaction mechanism. The preferred value is that reported
by Clyne and Watso~ The temperature dependence for such processes is
expected to be small, as for Bra + Bra. Although the second
reaction channel is shown proceeding directly to Br + Cl + 02' it
may proceed through Br + C100 (6HO = -6.6 kcal/mol-1) or Cl + BrOO
(6HO unknown).
94. Bra + NO. Unchanged from JPL 82-57. The results of the three low pressure
mass spectrometric studies (Clyne and Watson (1975), Ray and Watson
(1981a) and Leu (1979) and the high pressure uv absorption study
72

(Watson ~ Al. (1979}), which all used pseudo first-order
conditions, are in excellent agreement at 298 K, and are thought
to be much more reliable than the earlier low pressure uv absorption
study (Clyne and Cruse (1970b». The results of the two temperature
dependence studies are in good agreement and both show a small
negative temperature dependence. The preferred Arrhenius expression
was derived from a least squares fit to all the data reported in
the four recent studies. By combining the data reported by Watson
~ gl. with that from the three mass spectrometric studies, it
can be shown that this reaction does not exhibit any observable
pressure dependence between 1 and 700 torr total pressure. The
temperature dependences of k for the analogous C10 and H02 reactions
are also negative, and are similar in magnitude.
95. BrO + BrO. Unchanged from JPL 82-57. There are two possible bimolecular
channels for this reaction: BrO + BrO + 2Br + O2 (k1) and BrO +
BrO + Br2 + O2 (k2). The total rate constant for disappearance of BrO
(k = k1 + k2) has been studied by a variety of techniques, including discharge
flow-ultraviolet absorption (Clyne and Cruse, 1970a), discharge
flow-mass spectrometry (Clyne and Watson, 1975) and flash
photolysis-ultraviolet absorption (Basco and Dogra, 1971b; Sander
and Watson, 1981b). Since this reaction is second order in [BrO],
those studies monitoring [BrO] by ultraviolet absorption required
the value of the cross section a to determine k. There is
SUbstantial disagreement in the reported values of a. Although the
magnitude of cr is dependent upon the particular spectral transition
selected and instrumental parameters such as spectral bandwidth,
the most likely explanation for the large differences in the
reported values of a is that the techniques (based on reaction
stoichiometries) used to determine cr in the early studies were used
incorrectly (see discussion by Clyne and Watson). The recent study
of Sander and Watson used totally independent methods to determine
the values of a and (alk). The recommendations for k1 and k2 are consistent with a recommendation of k = 1.14 x 10- 12
73

exp(+255/T) cm3 molecule-1 s-1. This temperature dependence is the
corrected value from Sander and Watson, and the pre-exponential has
been chosen to fit the value of k(298K) = 2.7 x 10⁻¹² cm3 molecule-1
s-1, which is the average of the values reported by Clyne and
Watson (the mass spectrometric study where knowledge of a is not
required) and by Sander and Watson (the recent absorption study).
There was no observable pressure dependence from 50 to 475 torr in
the latter study. In a recent study, Cox ~sl. (1982) used the
molecular modulation technique with ultraviolet absorption to
derive a temperature independent value of k2 which is 50 percent
greater than the 298K value recommended here.
The partitioning of the total rate constant into its two
components, k1 and k2, has been measured by Sander and Watson at 298K, by Jaffe and Mainquist (1980) from 258 to 333K, and by Cox
~Al. (1982) from 278 to 348K. All are in agreement that k1/k =
0.84*0.03 at 298K. In the temperature dependent studies the
quantum yield for the bromine photosensitized decomposition of
ozone was measured. Jaffe and Mainquist observed a strong,
unexplained dependence of the quantum yield at 298K on [Br2], and
their results were obtained at much higher [Br2] values than were
those of Cox ~~. This makes a comparison of results difficult.
From an analysis of both sets of temperature dependent data, the
following expressions for k1/k were derived: 0.98 exp(-44/T) (Jaffe
and Mainquist); 1.42 exp(-163/T) (Cox ~ al); and 1.18 exp(-104/T)
(mean value). This mean value has been combined with the
expression for k given above to yield the expression for k1 shown
in the table. The expression for k2 results from the numerical
values of k2 at 200K and 300K derived from the evaluation of these
expressions for k1 and for k(=k1 + k2).
96. BrO + 03. Unchanged from JPL 82-57. Based on a study reported by
Sander and Watson (1981b). Clyne and Cruse (1970a) also reported an upper
limit of 8 x 10-14cm3molecule-1s-1 for this reaction. Both studies
74

reported that there is no evidence for this reaction. The analogous
CIO reaction has a rate constant of <10-18cm3molecule-1s-1•
97. BrO + H02• Unchanged from JPL 82-57 in which the preferred value was
based on value of k(CIO + H02). Cox and Sheppard (1982) have studied
the rate of this reaction in an investigation of the photolysis of 03 in the presence of Br2, H2, and 02 using the molecular modulation -
ultraviolet absorption technique. Although the reported value is
not very precise, it does show that this reaction occurs and at a
rate comparable to that for ClO + H02• By analogy with the CIO +
H02 system, the products may be expected to be HOBr + 02·
98. BrO + OH. Changed from JPL 82-57. Value chosen to be consistent with
k(CIO + OH), due to the absence of any experimental data.
99. OH + HBr. Unchanged from JPL 82-57. Takacs and Glass (1973a) and
Jourdain ~~. (1981) used the discharge flow - EPR technique and
reported k (298K) to be 5.1 and 9.2 x 10⁻¹² cm3 molecule-1 s-1,
respectively. Ravishankara ~~. (1979a) and Husain ~~. (1981)
used the flash photolysis-resonance fluorescence technique and
reported values of 11.9 and 6.0 x 10⁻¹² cm3 molecule-1 s-1,
respectively. The preferred value of k (298K) is taken to be a
simple mean of these four values. The data reported by Ravishankara
~~. show that the rate constant exhibits no temperature
dependence between 249-416K.
100. OH + CH3Br. Unchanged from JPL 82-57. The absolute rate coefficients
determined by Howard and Evenson (1976a) and Davis ~~. (1976)
are in excellent agreement at 298 K. The same approach has been used to
determine the preferred Arrhenius parameters as was used for the OH +
CHxFyC14_x_y reactions. Fitting the data to an expression of the form AT2exp(-B/T) results in the equation 1.17 x 10⁻¹⁸
T2exp(-295/T) over the temperature range 244-350 K. This results
in a preferred value of 3.86 x 10⁻¹⁴cm3molecule-1s-1 for k at 298 K.
75

The derived Arrhenius expression centered at 265 K is 6.09 x 10⁻¹³
exp{-825/T) •
101. 0+ HBr. Changed from JPL 82-57. Results of the recent flash photolysis
resonance fluorescence study of Nava ~ sl. (1983) for 221-455K
provide the only data at stratospheric temperatures. The previous
recommendation was based on results reported by Singleton and
Cvetanovic (1978) for 298-554K by a phase-shift technique, and on
discharge flow results of Brown and Smith (1975) for 267-430K and
of Takacs and Glass at 298K. The preferred value is based on the
results of Nava ~sl. and those of Singleton and Cvetanovic
over the same temperature range, since these results are less
subject to complications due to secondary chemistry than are the
results using discharge flow techniques. The uncertainty at 298K
has been set to encompass these latter results.
102. F + 03' Unchanged from JPL 82-57. The only experimental data is that reported by Wagner ~.aJ... (1972). Value appears to be quite
reasonable in view of the well known reactivity of atomic chlorine
with 03.
103. F + H2• Unchanged from JPL 82-57. The value of k at 298K seems to be well established with the results reported by Homann ~sl. (1970),
Warnatz ~Al. (1972), Zhitneva and Pshezhetskii (1978), Heidner
~ sl. (1979, 1980), Wurzberg and Houston (1980), Dodonov ~ sl.
(1971), Clyne ~ Al. (1973), Bozzelli (1973), and Igoshin ~Al.
(1974), being in excellent agreement (range of k being 2.3-3.3 x 10⁻¹¹
cm3 molecule-1 s-1). The preferred value at 298K is taken to be the
mean of the values reported in these references. The magnitude of the
temperature dependence is not quite as well established with values of
E/R ranging from 433-755K (Homann ~ sl., Warnatz ~sl., Heidner
~ sl., Wurzburg and Houston, Igoshin ~Al.). The preferred
value of E/R is taken to be the mean of the results from all of the
studies. The A-factor was calculated by taking E/R to be 570K, and
76

k at 298K to be 2.8 x 10⁻¹¹ cm3 molecule-1 s-1.
104. F + CH4. Unchanged from JPL 82-57. The three absolute rate coefficients
determined by Wagner ~Al. (1971), Clyne ~ Al. (1973) and Kompa
and Wanner (1972) at 298 K are in good agreement; however, this
may be somewhat fortuitous as the ratios of keF + H2)/k(F + CH4)
determined by these same groups can only be considered to be in fair
agreement, 0.23, 0.42 and 0.88. The values determined for k (298)
from the relative rate coefficient studies are also in good
agreement with those determined in the absolute rate coefficient
studies, and the value of 0.42 reported for keF + H2)/k(F + CH4)
by Foon and Reid (1971) is in good agreement with that reported by
Clyne ~Al. The preferred value of 8.0 x 10⁻¹¹ for k (298) is a
weighted mean of all the results. The magnitude of the temperature . dependence is somewhat uncertain. The preferred Arrhenius
parameters are based on the data reported by Wagner ~ al., and
Foon and Reid, and the preferred Arrhenius parameters of the F + H2
reaction. This reaction has recently been reviewed by both Foon
and Kaufman (1975) and Jones and Skolnik (1976). A-factor may be
too high. Since the previous evaluation there has been one study
of this reaction, by Fasano and Nogar (1982). The reported value
at 298K is 30% lower than the preferred value, well within the
stated uncertainty limits. The preferred value is based on results
of five studies and inclusion of this new result does not change
the preferred value.
105. F + H20. Unchanged from JPL 82-57. This is the value of Zetzsch (1971)
which was reported in the review of Jones and Skolnik (1976). The
reactivity appears to be somewhat lower than might be expected for such
a hydrogen abstraction reaction (see review of Foon and Kaufman (1975).
106. NO + FO. Unchanged from JPL 82-57. This is the value reported by Ray
and Watson (1981a) for k at 298K using the discharge flow-mass spectro-
77

metric technique. The temperature dependence of k is expected to
be small for such a radical-radical reaction. The temperature
dependences of k for the analogous CIO and BrO reactions have been
reported to be negative, with E/R preferred values of -294K and
-265K, respectively.
107. FO + FO. Unchanged from JPL 82-57. Although the value of k (FO +
FO) reported by Clyne and Watson (1974b) was obtained in a more
direct manner than that of Wagner ~sl. (1972), and as such is less
susceptible to error due to the presence of complicating secondary
reactions and thus would normally be preferred, the value to be
recommended in this assessment is a weighted average of the two
studies. From the data of Wagner ~~. it can be seen that the
dominant reaction channel is that producing 2F + 02. However, their
data base is not adequate to conclude that it is the only process.
108. FO + 03. Unchanged from JPL 82-57. The FO + 03 reaction has two possible pathways which are exothermic, resulting in the production of F + 2
02 or F02 + 02. Although this reaction has not been studied in a
Simple, direct manner, two studies of complex chemical systems have
inferred some kinetic information about it. Starrico ~ ale (1962)
measured quantum yields for ozone destruction in F2/03 mixtures,
and attributed the high values, -4600, to be due to the rapid
regeneration of atomic fluorine via the FO + 03 ~ F + 02 reactio~
However, their results are probably also consistent with the chain
propagation process being FO + FO ~ 2 F + 02 (the latter reaction
has been studied twice (Wagner ~ ale (1972), Clyne and Watson
(1974b», but although the value of [F]produced/[FO]consumed is known to be close to unity, it has not been accurately determined.
Consequently it is impossible to ascertain from the experimental
results of Starrico ~~. whether or not the high quantum yields
for ozone destruction should be attributed to the FL + 03 reaction
producing either F + 2 02 or F02 + 02 (this process is also a chain
propagation step if the resulting F02 radical preferentially reacts
78

with ozone rather than with either Fa or itself). Wagner ~ sl utilized a low pressure discharge flow-mass spectrometric system to
study the F + 03 and Fa + Fa reactions by directly monitoring the
time history of the concentrations of F, Fa and 03' They concluded
that the Fa + 03 reaction was unimportant in their system. However,
their paper does not present enough information to warrant this
conclusion. Indeed, their value of k(FO + Fa) of 3 x 10-11 is
about a factor of 4 greater than that reported by Clyne and Watson,
which may possibly be attributed to either reactive impurities being
present in their system, e.g., 0(3p), or that the Fa + 03 reactions
were not of negligible importance in their study. Consequently,
it is not possible to determine a value for the Fa + 03 reaction
rate constant from existing experimental data. It is worth
noting that the analogous C10 + 03 reactions are extremely slow
«10-18cm3molecule-1s-1) (DeMore ~ ale (1976», and upper limits
of 8 x 10-14 (Clyne and Cruse (1970a» and 5 x 10-15cm3molecule-1s-1
(Sander and Watson (1981b» have been reported for Bra + 03 ,
109. a + Fa. Unchanged from JPL 82-57. This estimate is probably accurate to
within a factor of 3, and is based upon the assumption that the
reactivity of Fa is similar to that of C10 and Bra. The experi-
mentally determined rate constants for C10 and Bra at -298 K are
5.0 x 10⁻¹¹ and 3.0 x 10⁻¹¹ , respectively (NASA preferred values).
The temperature dependence of the rate constant is expected to be
small. The temperature dependence of the analogous C10 reaction
has been studied twice with somewhat different results. The values
reported for E/R are -76 K (Zahniser and Kaufman (1977) and +224 K
Clyne and Nip (1976b».
110. a + F02• Unchanged from JPL 82-57. No experimental data. The rate constant for such a radical-atom process is expected to approach the gas
collision frequency, and is not expected to exhibit a strong temp
erature dependence.
79

111. OH + co. The recommendation allows for an increase in k with pressure.
The zero pressure value was derived by averaging all direct low pressure
determinations (those listed in Baulch ~ sl. (1980) and the values
reported by Dreier and Wolfrum (1980), Husain ~ Al. (1981), and
Ravishankara and Thompson (1983». An increase in k with pressure has
been observed by a large number of investigators (Overend and Paraskevopoulc
(1977a), Perry ~Al. (1977), Chen ~ ale (1977), Bierman ~sl.
(1978), Cox ~.al. (1976b), and Butler II .s.l.. (1978». There are a
large number of inconsistencies in these data, however. Bierman ~ sl. (1978)
found the rate coefficient to be dependent on both pressure and presence of 02
(or other impurities). Recent measurements by Paraskevopoulos and Irwin (1982a
indicate that the pressure effects are seen in the absence of 02. DeMore
(1983) reported a similar lack of dependence on O2 when N2 was the
pressurizing gas, and found less than a 10% increase in k when pressure of
Argon diluent was changed from -50 torr to -760 torr, both in the presence
and absence of 02.
Refinements in the rate coefficient data for the OH + H02 and OH + H202
reactions require reinterpretation of many of the above mentioned
studies. For example, the possibility of the OH + H02 reaction causing
interference in the studies of Bierman ~~. needs to be considered.
The study of Butler ~ Al. can be reevaluated by using the value
of k(OH + H202) recommended here to yield the rate coefficients
for OH + CO of 1.5 x 10⁻¹³ cm3 molecule-1 s-1 at 100 torr increasing
to 3.7 x 10⁻¹³ cm3 molecule-1 s-1 at 600 torr of synthetic air.
The weight of the present evidence suggests that there is no O2 effect, but there is a pressure effect. The exact value of the
high pressure limit and the pressure at which it is reached remain
undefined. In the absence of such data, the recommended value is
quite uncertain (-40%). Until proven otherwise, the E/R value is
assumed to be zero.
112. OH + CH4. This is an extremely well characterized reaction. All
80

temperature dependence studies are in good agreement (Greiner (1970a), Davis
gkal. (1974a), Margitan gk Al. (1974), Zellner and Steinert (1976),
Tully and Ravishankara (1980), Jeong and Kaufman (1982». Due to this good
agreement, and the curved nature of the Arrhenius plot at higher temperatures, the
value of Davis ~ al., obtained in the temperature interval
240 < T < 373K is recommended.
113. OH + C2"6. There is excellent agreement between five studies of this
reaction at 298K, i.e., Greiner (1970a), Howard and Evenson (1976b), Overend
~ gl. (1975), Lee and Tang (1982) and Tully ~sl. (1983). k(298K) is
the average of these five measurements. The temperature dependence was
computed by using the data of Greiner (1970a) and Tully ~~. (1983).
114. OH + C3H8. There are five measurements of the rate coefficient at
298K; Greiner (1970a), Gorse and Volman (1974), Bradley ~~. (1973),
Overend ~ Al. (1975), and Tully et Al. (1983). Gorse and Volman
measured k(OH + C3H8) relative to k(OH + CO) in the presence of 02 and
calculated k(OH + C3H8) assuming that k(OH + CO) = 1.5 x 10⁻¹³ cm3
molecule-1 s-1. If the current recommended value for k(OH + CO) at
high pressure is used, k(OH + C3H8) will be approximately
4 x 10-12 cm3 molecule-1 s-1. Therefore the results of Overend ~~.
(1975) (k = 2 x 10-12 cm3 s-1) and Gorse and Volman are in disagreement
with the other values. The most probable cause for the discrepancy is
the presence of secondary reactions in their system. The 298K value is
the average of the three studies. Only Greiner (1970a) and Tully ~
al. (1983) have measured the temperature dependence of this reaction,
and the recommended E/R was obtained from a linear least squares analysis of
the data below 500 K. The A factor was adjusted to reproduce k(298K).
This reaction has two possible channels, i.e., abstraction of the
primary or the secondary H atom. Therefore, non-Arrhenius behavior
may be exhibited over a wide temperature range, as seen by Tully ~ ~.
The branching ratios can be estimated from Greiner's (1970a) formula:
kprimary = 6.1 x 10⁻¹² exp(-830/T) cm3 molecule-1 s-1
ksecondary = 4.6 x 10⁻¹² exp(-430/T) cm3 molecule-1 s-1
81

115. OH + H2CO. The value for k (298 K) is the average of those determined
by Atkinson and Pitts (1978) and Stief ~ Al. (1980), both using the
flash photolysis-resonance fluorescence technique. The value
reported by Morris and Niki (1971) agrees within the stated
uncertainty. There are two relative values which are not in agree
ment with the recommendations. The value of Niki et~. (1978b)
relative to OH + C2H4 is higher while the value of Smith (1978)
relative to OH + OH is lower. The latter data are also at variance
with the negligible temperature dependence observed in the two flash
photolysis studies. Although Atkinson and Pitts assign a small
energy barrier (E/R = 90 + 150), their data at 356 K and 426 K
and that of Stief ~~. at 228 K, 257 K and 362 K are all within
10% of the k (298 K) value. Thus, the combined data set suggest E/R
= O. The abstraction reaction shown in the table is probably the major
channel; other channels may contribute (Horowitz ~A1., 1978).
116. OH + CH300H. The recommended value is that of Niki ~ Al. (1983). They
measured the rate coefficient relative to that of OH with C2H4 by
monitoring CH300H disappearance using an FTIR system. This measured value
is very fast and hence is not expected to show substantial temperature
dependence. Niki ~Al. have determined that the rate coefficient
for H atom abstraction from the CH3 group is approximately 0.7 times
that for H atom abstraction from the OH group. Independent, direct
measurements of this rate coefficient are needed.
117. OH + HCN. New entry. This reaction is pressure dependent. The recommended
value is the high pressure limit measured by Lorenz ~~. (1983) using
a laser photolysis-resonance fluorescence apparatus. Phillips (1978)
studied this reaction using a discharge flow apparatus at low pressures
and found the rate coefficient to have reached the high pressure limit at
-10 torr at 298K. Lorenz ~A1.'s results contradict this finding. They agree with Phillips' measured value, within a factor of two, at 7
torr but they find k to increase further with pressure. The products of
82

the reaction are unknown. The measured A factor appears to be low.
118. OH + CH3CN. New entry. This rate coefficient has been measured in
the temperature range 298-424K by Harris ~al. (1981) using flash
photolysis-resonance fluorescence method. Zellner (1983) has measured
(k298 ), using flash photolysis-resonance fluorescence method, to be approximately a factor of two lower than that determined by Harris ~
sl. The recommended E/R is that of Harris ~ ale k(298K) is the
average of Harris ~Al.'s and Zellner's values. The A factor has
been adjusted to reproduce k(298K). The products of the reaction are
unknown. The measured A factor appears to be low.
119. H02 + CH20. New entry. There is a general consensus that this reaction
proceeds through addition of H02 to CH20 (Su et al., 1979a,b, Veyret
~~. 1982). The value of the rate coefficient deduced by Su
~ Al. (1979b) based on modelling a complex system involving the
oxidation of CH20 is approximately seven times lower than that
obtained by Veyret et ale (1982), who also modelled a complex
system. The recommended value is an average of the two measurements
and is very uncertain. Su ~sl. (1979b) have deduced that life
time of the adduct towards decomposition to CH20 and H02 is
-1sec at 298K.
120. ° + C2H2. The value at 298K is an average of nine measurements; Arrington ~ ale (1965), Sullivan and Warneck (1965), Brown and Thrush
(1967), Hoyermann ~~. (1967), Westenberg and deHaas (1969b),
James and Glass (1970), Stuhl and Niki (1971), Westenberg and
deHaas (1977) and Aleksandrov ~ ale (1981). There is reasonably
good agreement between these studies. Arrington ~sl. (1965) did
not observe a temperature dependence, an observation which was later
shown to be erroneous by Westenberg and deHaas (1969). Westenberg
and deHaas are the only ones who have measured the temperature
dependence, and they observed a curved Arrhenius plot. In the range
of 195-450K, Arrhenius behavior provides an adequate description and
83

the E/R obtained by them in this temperature range is recommended.
The A factor was calculated to reproduce k(298K). This reaction can
have two sets of products, i.e., C2HO + H or CH2 + CO. Under
molecular beam conditions C2HO has been shown to be the major
product. However, a recent study by Aleksandrov ~~. using a
discharge flow-resonance fluorescence method (under undefined pressure
conditions) indicates that the CH20 + H channel contributes no
more than 7% to the net reaction at 298K.
121. 0 + H2CO. The recommended values for A, E/R and k (298 K) are the
averages of those determined by Klemm (1979) using flash photolysis-resonancE
fluorescence (250 to 498 K) by Klemm ~~. (1980) using discharge
flow-resonance fluorescence (298 to 748 K) and Chang and Barker
(1979) using discharge flow-mass spectrometry (296 to 436 K). All
three studies are in good agreement. The k (298 K) value is also
consistent with the results of Niki ~~. (1969), Herron and
Penzhorn (1969), and Mack and Thrush (1973). Although the mechanism
for 0 + H2CO has been considered to be the abstraction reaction
yielding OH + HCO, Chang and Barker suggest that an addition channel
yielding H + HC02 may be occurring to the extent of 30% of the total
reaction. This conclusion is based on an observation of C02 as a
product of the reaction under conditions where reactions such as
o + HCO + H + C02 and 0 + HCO + OH + CO apparently do not occur.
This interesting suggestion needs independent confirmation.
122. 0 + CH3. The recommended k(298K) is the weighted average of three
measurements by Washida and Bayes (1976), Washida (1980), and Plumb and
Ryan (1982). The E/R value is based on the results of Washida and Bayes
(1976) who found k to be independent of temperatures between 259 and
341K.
123. CH3 + O2• This bimolecular reaction is not expected to be important based on the results of Baldwin and Golden (1978a) who found k < 5 x 10-17
cm3 molecule-1 s-1 for temperatures up to 1200K. Klais ~ s1.
84

(1979) failed to detect OH (via CH3 + 02 + CH20 + OH) at 368K
and placed an upper limit of 3 x 10-16 cm3 molecule-1 s-1 for this
rate coefficient. Bhaskaran, Frank and Just (1979) measured k = 1
x 10-11 exp(-12,900/T) cm3 molecule-1 s-1 for 1800 < T < 2200K.
The latter two studies, thus, support the results of Baldwin and
Golden. Recent studies by Selzer and Bayes (1983) and Plumb and
Ryan (1982) confirm the low value for this rate coefficient. Previous
studies of Washida and Bayes (1976) are superseded by those of Selzer
and Bayes. Plumb and Ryan have placed an upper limit of 3 x 10-16
cm3 molecule- 1 s-1 based on their inability to find HCHO in their
experiments.
124. CH20H + 02' The rate coefficient has been measured by Radford (1980) by
detecting the H02 product in a laser magnetic resonance spectrometer.
The effect of wall loss of CH20H could have introduced a large error
in this measurement. Radford also showed that the previous measurement of
Avramenko and Kolesnikova (1961) was in error.
125. CH30 + 02' The recommended A factor and E/R are those obtained from the
results of Gutman ~sl. (1982). These investigators have measured
k directly under pseudo-first order conditions by following CH30
via laser induced fluorescence. The temperature interval was 413
to 608K. Cox ~ sl. (1980) used an end product analysis technique
to measure k down to 298K. The previous high temperature measure-
ments (Barker ~al. (1977) and Batt and Robinson (1979», are in
reasonable agreement with the derived expression. k(298K) is calculated
from the recommended expression. This value is consistent with the
298K results of Cox ~ sl. (1980) and with the upper limit measured
by Sanders ~~. (1980b). The A factor, shown above, appears to be
too low for a hydrogen atom transfer reaction. The products of this
reaction are H02 and CH20, as shown by Niki ~ sl. (1981).
126. HCO + 02. The value of k(298K) is the average of the determinations
by Washida ~~. (1974), Shibuya et al. (1977), Veyret and Lesclaux
85

126. HCO + 02. The value of k(298K) is the average of the determinations
by Washida ~ sJ... (1974), Shibuya ~.sl,. (1977), Veyret and Lesclaux
(1981), and Langford and Moore (1983). There are three measurements of k
where HCO was monitored via the intracavity dye laser technique (Reilly
~ ale (1978), Nadtochenko ~.sl.. (1979), and Gill ~ sl (1981».
Even though there is excellent agreement between these three studies,
they yield consistently lower values than those obtained by other techniques.
There are several possible reasons for this discrepancy. (a) The relationship
between [HCO] and laser attenuation might not be linear, (b) there could
have been depletion of 02 in the static systems that were used (as
suggested by Veyret and Lesclaux), and (c) these experiments were designed
more for the study of photochemistry than kinetics. Therefore, these values
are not included in obtaining the recommended value. The recommended
temperature dependence is essentially identical to that measured
by Veyret and Lesclaux. We have expressed the temperature dependence
in an Arrhenius form even though the authors preferred a Tn form
(k = 5.5 x 10⁻¹¹ T-(0.4±0.3) cm3 molecule-1 s-1).
127. CH3 + 03. The recommended A factor and E/R are those obtained from
the results of Ogryzlo ~.sl.. (1981). The results of Simonaitis and
Heicklen (1975) based on an analysis of a complex system have been
neglected. Washida ~.sl,. (1980b) used ° + C2H4 as the source of CH3• Recent results (Buss ~ al. (1981), Kleinermanns and Luntz
(1981), Hunziker ~ ale (1981), and Inoue and Akimoto (1981» have
shown the ° + C2H4 reaction to be a poor source of CH3. Therefore, the results of Washida ~ ale are also neglected.
128. CH302 + 03. There are no direct studies of this reaction. The
quoted upper limit is based on indirect evidence obtained by Simonaitis
and Heicklen (1975).
129. CH302 + CH302• The recommended value for k(298K) is the average of those reported by Hochanadel ~ ale (1977), Parkes (1977), Anastasi
~Al. (1978), Kan ~ Al. (1979), Sanhueza ~~. (1979), and Sander
86

the absorption cross section for CH302 at the monitored wavelength.
To obtain a set of numbers that can be compared, the values of k
have been recalculated using the absorption cross sections measured
by Hochanadel g1 ale (1977). k(298K) is the average of these numbers.
The recommended temperature dependence is that measured by Sander and
Watson (1981c).
This reaction has three possible sets of products, i.e.,
CH302 + CH302 + CH20 + CH30H + 02 kb
~
FTIR studies by Kan ~ Al. (1980) and Niki ~ ale (1981) are
in reasonable agreement on branching ratios at 298K; ka/k -0.35,
kb/k -0.10. Because of the existence of multiple pathways,
the temperature dependence of k may be complex. Further work
is required on both the temperature dependence and the variation
of branching ratios with temperature.
130. CH302 + NO. The value of k(298K) is the average of those determined
by Sander and Watson (1980), Ravishankara ~ ale (1981a), Cox and
Tyndall (1980), Plumb ~ Al. (1981), and Simonaitis and Heicklen (1981).
Values lower by more than a factor of two have been reported by Adachi
and Basco (1979) and Simonaitis and Heicklen (1979). The former direct
study was probably in error because of interference by CH30NO formation.
The results of Simonaitis and Heicklen (1979) and Plumb g1Al. (1979)
are assumed to be superseded by their more recent values. Ravishankara gk
Al. (1981a) and Simonaitis and Heicklen (1981) have measured the temperature
dependence of k over limited temperature ranges. The recommended A factor
and E/R were obtained by a least squares analysis of the data from the two
studies. The value of k(218K) obtained by Simonaitis and Heicklen (1981) has
87

been neglected; however, the large error bounds allow the calculated value
of k at 218K to overlap that measured by Simonai tis and Heicklen.
Ravishankara ~al. (1981a) find that the reaction channel leading to
N02 accounts for at least 80% of the reaction. This result, in conjunction
with the indirect evidence obtained by Pate ~~. (1974), confirms
that N02 formation is the major, if not the only, reaction path.
131. CH302 + H02' The room temperature value is that of Cox and Tyndall
(1979, 1980). This study also reports a large negative E/R value over a
temperature range 274 to 338K, which is similar to that found for the H02 + H02
reaction by many groups (see note on H02 + H02)' This measurement
has been carried out only at 1 atmosphere pressure. The above results
are not inconsistent with the suggested value for the H02 + H02
reaction. The rate coefficient needs independent verification at
one atmosphere, and measurements as functions of pressure, water
vapor concentration, and temperature.
132. OH + H2S, The value of k(298) is an average of the rate constants reported
by Perry ~ ale (1976b), Cox and Sheppard (1980), Wine ~~. (1981a),
Leu and Smith (1982a), and Michael ~~. (1982). The value of E/R
is taken from a composite unweighted least squares fit to the
individual data points from these same five studies. The study by
Leu and Smith (1982a) shows a slight parabolic temperature dependence
of k with a minimum occurring near room temperature. Within the error
limits stated in this evaluation, all data are fit reasonably well
with an Arrhenius expression. The data from the very recent study
by Lin (1982) are in excellent agreement with the present recommendation
They also show a slight non-Arrhenius behavior. The weight of evidence
from these recent measurements suggests that the earlier study by
Westenberg and deHaas (1973b) was in error (quite possibly due to
secondary reactions). The room temperature value of Stuhl (1974)
lies just outside the 20 error limit set for k(298).
133. OH + OCS. This recommendation accepts with broad uncertainties the
88

work of Leu and Smith (1981) who report rate constants between 300 and
500K approximately an order of magnitude lower than Ravishankara
~Al. (1980b), who had been thought to have minimized the compli
cations due to secondary chemistry and/or excited state reactions
present in the studies of Atkinson et Al. (1978) and Kurylo (1978).
The upper limit of k(298) reported by Cox and Sheppard (1980) is
too insensitive to permit valid comparison with the newer results.
The Ravishankara et~. (1980b) data can be used to calculate an
E/R value of -2000K. The similarity between this value and the
230K value of Leu and Smith (1981) suggests a temperature invariant
removal of OH in the Ravishankara experiment possibly due to
impurities in the OCS. Product observations by Leu and Smith (1981)
tentatively confirm the suggestion of Kurylo and Laufer (1979) that
the reaction produces predominantly HS + C02. Until these lower
measurements are independently confirmed, the error limits on k(298)
and E/R will encompass the results of Ravishankara et sl. (1980b).
134. OH + CS2• There appears to be a consensus of experimental evidence
indicating that this reaction proceeds very slowly as a direct bimolecular
process. Based on the study by Wine ~ Al. (1980), an upper limi t
on k(298) of 1.5 x 10⁻¹⁵ can be set. This determination is
consistent with the upper limit reported by Iyer and Rowland (1980)
for the rate of direct production of OCS in an OH + CS2 reaction
system suggesting that OCS and SH are the primary products of the
bimolecular process. This mechanistic interpretation is further
supported by the studies of Leu and Smith (1982b) and Biermann ~
Al. (1982) which set upper limits on k(298) somewhat higher than
Wine ~ Al. (1980). The more rapid reaction rates observed by
Atkinson ~ sl. (1978), Kurylo (1978), and Cox and Sheppard (1980)
may be attributed to severe complications arising from excited
state and secondary chemistry in their photolytic systems. The Cox
and Sheppard study in particular may have been affected by the
reaction of electronically excited CS2 (produced via the 350 on
photolysis) with O2 (in the 1 atmosphere synthetic air mix). The
89

importance of this reaction in the tropospheric photooxidation of
CS2 to oes has been suggested by Wine ~ sl. (1981d).
More recent investigations by Ravishankara (1982), Jones ~Al.
(1982), and Barnes et sl. (1983) have demonstrated a marked
acceleration of the OH + CS2 reaction in the presence of O2 with
a one to one relationship between the S02 and OCS produced and
the CS2 consumed. In the Barnes study the effective bimolecular
reaction rate was found to be a function of total pressure (02 + N2)
as well, and exhibited an appreciable negative temperature
dependence. These observations are consistent with the formation of
a long-lived collision adduct postulated by Kurylo (1978) and Kurylo
and Laufer (1979), followed by its reaction with 02:
k a
+ M:::==HOCS2 + M ~ k
02--S. Products
The effective second order rate constant of eS2 or OH removal in
such a scheme can be written as
kb l/keff = -k-k--
a c Po 2
1 + k P
a M
where Po is the partial pressure of O2 and PM equals Po + PN_. 2 2 -2
The validity of this expression requires that ka and kb are
invariant with the P02 /PN2
ratio. A 11k vs 1/P02 plot of the data of Jones et~. taken at atmospheric pressure exhibits
marked curvature, suggesting a more complex mechanistic involvement
of 02" The more extensive data base of Barnes ~ sl., however,
appears to be fit quite satisfactorily by the above analysis.
Nevertheless several inconsistencies arise. First, under the same
conditions of Po and PN , the Barnes ~Al. rate constants lie 2 2
-60% higher than those of Jones et s1. Secondly, two fits of the
Barnes data can be made: one at fixed PM and varying Po , and the 2
90

other at fixed Pez and varying PM (i.e. varying added N2). While
both fits converge for mole fractions of 02 near 0.2 (the common data point) their differences approach more than a factor of 2 for
a pure 02 system. Finally, the temperature dependence of the keff values from Barnes ~ ale varies systematically from an E/R or
-1300K for runs in pure 02 (at 700 torr total pressure) to -2900K
in a 50 torr 02 plus 650 torr N2 mixture. These last two observations
suggest that ka and kb are not independent of the identity of M.
The present recommendation was derived by averaging the two above
mentioned fits of the Barnes ~ Al. room temperature data and
incorporating the temperature dependence calculated from an Arrhenius
analysis of the 1/keff vs. Po fits of the constant PM data at 264, 2
278, and 293K. This leads to the following equation:
k(298) = 3.2 x 10⁻¹⁵ P cm3 molec-1 s-1
for air mixtures (i.e. Po /PN = 0.25) where P (the total pressure) 2 2
is expressed in torr. The uncertainty factor at 298K has been set
to encompass the synthetic air data of Jones ~ ~.
Values of k at temperatures below 298K can be calculated from the
expression
k = 2.0 x 10⁻¹⁸exp[(2200~500)/T] x P cm3 molec-1 s-1
Again, this expression is valid for oxygerr-ni trogen mixtures at a
total pressure P (in torr) having an oxygen mole fraction of 0.2.
The 6E/R has been set to account for (within 20) the range of
E/R found as a function of the Paz /PN 2 ratio.
No recommendation is given for N2 + 02 mixtures with mole
91

fractions differing from air since, as mentioned, the fits to the
two sets of Barnes et sl. room temperature data diverge at high
O2 mole fractions. Additional work is needed to understand more fully the complex details of this reaction.
135. 0 + H2S. This recommendation is derived from an unweighted least squares
fit of the data of Singleton ~sl. (1979) and Whytock ~ ale (1976).
The results of Slagle ~ ale (1978) show very good agreement for
E/R in the temperature region of overlap (300-500K) but lie systematically
higher at every temperature. The uncertainty factor at 298K has been
chosen to encompass the values of k(298K) determined by Slagle et sl.
(1978) and Hollinden ~sl. (1970). other than the 263K data point
of Whytock ~ ale (1976) and the 281K point of Slagle ~ sl. (1978)
the main body of rate constant data below 298K comes from the study of
Hollinden ~sl. (1970), which indicates a dramatic change in E/R in
this temperature region. Thus, ~E/R was set to account for these
observations. Such a non-linearity in the Arrhenius plot might indicate
a change in reaction mechanism from abstraction (as written) to addition.
An additional channel (resulting in H atom displacement) has been
proposed for this reaction by Slagle ~sl. (1978), Singleton ~Al.
(1979), and Singleton et sl. (1982). In the two Singleton studies
an upper limit of 20% is placed on the displacement channel. Direct observa tion of product HSO was made in the recent reactive
scattering experiments of Clemo ~ sl. (1981) and Davidson ~ sl.
(1982). A threshold energy of 3.3 Kcal/mole was observed (similar
to the activation energy measured in earlier studies) suggesting the
importance of this direct displacement channel. Addition products
from this reaction have been seen in a matrix by Smardzewski and Lin
(1977). Further kinetic study in the 200 to 300K range as well as
quantitative direct mechanistic information could clarify these issues.
This reaction is thought to be of limited stratospheric importance,
however.
136. 0 + OCS. The value for k (298 K) is the average of five different studies
92

of this reaction: Westenberg and de Haas (1969a), Klemm and Stief
(1974), Wei and Timmons (1975), Manning ~ Al. (1976) and Breckenridge
and Miller (1972). The recommended value for E/R is the average of those
determined in the temperature stUdies reported in the first three references.
Hsu ~Al. (1979) report that this reaction proceeds exclusively by
a stripping mechanism.
137. 0 + CS2• The value of k (298 K) is the average of seven determinations:
Wei and Timmons (1975), Westenberg and de Haas (1969a), Slagle ~ Al.
(1974a), Callear and Smith (1967), Callear and Hedges (1970), Homann
~~. (1968), and Graham and Gutman (1977). The E/R value is
an average of those determined by Wei and Timmons (1975) and Graham
and Gutman (1977). E/R has been set to encompass the limited
temperature data of Westenberg and de Haas (1969a). The principal
reaction products are thought to be CS + SO. However, Hsu ~ ~.
(1979) report that 1.4% of the reaction at 298K proceeds through the
channel yielding CO + S2 and calculate a rate constant for the
overall process in agreement with that recommended. Graham and Gutman
(1977) have found that 9.6% of the reaction proceeds to yield OCS + S
at room temperature.
138. 0 + SH. This recommendation accepts the results of Cupitt and Glass
(1975). The large uncertainty reflects the fact that there is only
one study of the reaction.
139. S + O2• This recommendation is based primarily on the study of Davis ~~. (1972). Modest agreement at 298K is provided by the
studies of Fair and Thrush (1969), Fair ~sl. (1971), Donovan and
Little (1972) and Clyne and Townsend (1975). A more recent study by
Clyne and Whitefield (1979) indicates a slightly negative E/R between
300 and 400K. Their data are encompassed by the error limits of the
present recommendation.
140. S + 03• This recommendation accepts the only available experimental
93

data by Clyne and Townsend (1975). In the same study these authors report
a value for S + 02 in reasonable agreement with that recommended. The
error limit cited reflects both the agreement and the need for independent
confirmation.
141. S + OH. This recommendation is based on the single study by Jourdain
~Al. (1979). Their measured value for k(298) compares favorably
with the recommended value of k(O + OH) when one considers the slightly
greater exothermicity of the present reaction.
142. SO + O2 • This recommendation is based on the recent (only available low
temperature measurements) of Black ~ Al. (1982a,1982b). The room
temperature value accepts the latter results as recommended by the
authors. The uncertainties cited reflect the need for further
confirmation and the fact that these results lie significantly
higher than an extrapolation of the higher temperature data of
Homann ~ Ai. (1968) upon which the previous recommendation was
based. A room temperature upper limit on k set by Breckenridge and
Miller (1972) is in good agreement with the Black ~Al. data.
143. SO + 03. The value of k(298) is an average of the determinations by
Halstead and Thrush (1966), Robertshaw and Smith (1980), and Black ~sl.
(1982a,1982b) using widely differing techniques. The value of E/R is
an average of the values reported by Halstead and Thrush (1966) and
Black ~ Al. (1982b) with the A-factor calculated to fit the value
recommended for k(298).
144. SO + OH. The value recommended for k(298) is an average of the
determinations by Fair and Thrush (1969) and Jourdain ~ Al. (1979).
Both sets of data have been corrected using the present recommendation
for the 0 + OH reaction.
145. SO + N02 • The value of k(298) is an average of the measurements by
Clyne and MacRobert (1980) and Black ~Al. (1982a) which agree quite
94

well with the rate constant calculated from the relative rate measurements
of Clyne ~.s!.l.. (1966).
146. so + OCIO. This recommendation is based on the single investigation by
Clyne and MacRobert (1981). Uncertainties for both the CIO and OCIO
reactions reflect the absence of any confirming investigations.
In the BrO reaction (performed in excess SO), the BrO decay was
too rapid to permit quantitative analysis. The lower limit for
k(298) was therefore obtained from the measurement of S02
production.
147. S02 + H02• This upper limit is based on the atmospheric pressure study
of Graham et.s!.l.. (1979). A more recent low pressure laser magnetic
resonance study by Burrows ~ al. (1979) places a slightly
higher upper limit on k(298) of 4 x 10-17 (determined relative
to OH + H202). Their limit is based on the assumption that the products
are OH + S03. The weight of both these stUdies suggests an
error in the earlier determination by Payne ~ Ai. (1973).
148. CH302 + S02. This recommendation accepts results from the study of
Sander and Watson (1981a), which is believed to be the most appropriate
study for stratospheric modeling purposes among those which have
been conducted. Their experiments were conducted using much lower
CH302 radical concentrations than in the earlier studies of Sanhueza
et al. (1979) and Kan ~ gl. (1979), both of which resulted in
k(298) values approximately 100 times larger. A more recent report by
Kan ~ Ai. (1981) postUlates that these differences are due to
reactive removal of the CH302S02 adduct at high CH302 radical concentrations, prior to its reversible decomposition into CH302 + S02.
They suggest that such behavior of CH302S02 or its equilibrated
adduct with O2 (CH302S0202) would be expected in the studies
yielding high k values, while decomposition of CH302S02 into reactions would dominate in the Sander and Watson experiments. It
does not appear likely that such secondary reactions involving CH302'
95

NO, or other radical species, if they occur, would be rapid enough
under normal stratosphere condi tions to compete with the adduct
decomposition.
149. SH + O2 • The basis of this recommendation is the recent work of Tiee
~si. (1981) employing laser induced fluorescence detection of HS.
Their preliminary measurement is lower than the upper limit for this
rate constant estimated by Cupitt and Glass (1975) by nearly two orders
of magnitude. A pulse radiolysis study by Nielsen (1979) sets an
upper limit for k(298) approximately 2.5 times greater than that
found by Tiee ~ Ai. (1981).
150. Cl + ~S. This recommendation is based on the laser-initiated, timeresolved infrared chemiluminescence study by Nesbitt and Leone (1980)
which refines the measurements of Braithwaite and Leone (1978). The
uncertainty factor at 298K has been set to encompass (within 2a)
the discharge flow results of Clyne and Ono (1983) which may have
been complicated by heterogeneous effects or by wall loss of the
very low concentrations of H2S used.
151. Cl + OCS; C10 + OCS; C10 + S02. These recommendations are based on
the discharge flow mass spectrometer data of Eibling and Kaufman (1983).
The upper limit on k(298) for the Cl + OCS reaction is calculated from
their minimum detectible decrease in atomic chlorine. Based on
the observation of product SC1, a lower limit for k(298) for the
reaction as written can be set at 10-18 cm3 molec-1 s-1.
Similarly, the upper limit on k(298) for the C10 + OCS reaction
was set from the minimum detectible decrease of C10 in this reaction
system. No products were observed.
The recommended upper limit on k(298) for the C10 + S02 reaction
is based on the authors' estimate of their detectibility for S03.
Other estimates of k at 298K and 220K, based on the minimum detectible
96

decrease in ClO, have not been used because of the potential problem
of ClO reformation from the Cl + 03 source reaction.
97

Table 2. Rate Constants for Three-Body Reactions
Low Pressure Limit High Pressure Limit ko(T) = kaOO (T/300)-n koJT) = k~00(T/300)-m
Reaction kdOO n ~OO m Notes
/0 + 02 ~ 03 (6.0:0.5)( -34) 2.3:0.5
+0(1D) + N2 ~ N20 (3.5:t3.0)(-37) 0.6!~6 2
J'H + 02 !! H02 (5.5:t0. 5)( -32) 1.6:t0.5 3
+ H OH + OH .... H202 (6. 9:t3.0)( -31) 0.8~6:g (1.0:t0.5)( -11) 1.0:t1.0 4
o + NO ~ N02 (1.2:t0.3)(-31 ) 1 .8:t0. 5 (3.0:1.0)(-11) 0:t1 5
o + N02 !i N03 ( 9 .0:t1 .0)( - 32 ) 2.0:t1.0 (2.2:t0. 3)( -11) 0:1 6
~OH + NO !i HONO (7.0:t2.0)(-31) 2.6:t1.0 (1. 5:1. 0)( -11) 0.5:0.5 7
JOH + N02 !i HN03 (2. 6:t0. 3)( -30) 3.2:t0.7 (2.4:t1.2)( -11) 1.3:t1.3 8
~02 + N02 !i H02N02 (2. 3:t0 .2)( -31) 4.6:t1.0 (4.2:1.0)(-12) 0:t2.0 9
,ft02 + N03 !! N205 (2.2:t1.1)( -30) 2.8:t1.0 ( 1 • 0:t0 .8)( -12 ) 0:t1.0 10
-.tCl + NO !i ClNO (9.0:2.0)(-32) 1.6:0.5 11
+Cl + N02 ~ ClONO ( 1 • 6:t0 .6)( -30 ) 2.0:t1.0 ( 1.0:t0.5)(-10) 1.0:t1.0 12
+ !i ClN02 (2.2:t1.2)(-31) 2.0:t1.0 ( 1 • 0:t0 • 5 )( -1 0 ) 1.0:t1.0 12
~Cl + O2 ~ ClOO (2.0:t1.0)(-33) 1.4:t1.4 13
/ ClO + N02 !i ClON02 ( 1 • 8:t0 .3)( - 31 ) 3.4:t1.0 ( 1. 5:0 • 7)( -11 ) 1.9:1.9 14
viBrO + N02 ~ BrON02 (5 .0:t2. 0)( -31) 2.0:t2.0 ( 1 • 0:t0. 5)( -11 ) 1.0%1.0 15
k (T) [M] 2} -1 0 0.6{1 + [log10(ko (T) [M]/koo(T»]
Note: k(Z) = k(M,T) = (1 + k (T)[M]/k (T» o 00
The values quoted are suitable for air as the third body, M.
+H1nor changes from JPL 82-57 for consistency with calculations of Patrick and Golden (1983).
·Changed from JPL 82-57.
98

Table 2. (Continued).
Low Pressure Limit High Pressure Limit ko(T) = k300 (T/300)-n k (T) = k3OO (T/300)-m
0 <Xl <Xl
Reaction k~OO n k300 <Xl m Notes
+F + O2 !! F02 (1.6:1:0.8)( -32) 1.4:1:1.0 16
F + NO ~ FNO ( 5.9:1:3 • 0 )( - 32 ) 1. 7:1:1. 7 17
F + N02 ~ Products (3.3:1:1.7)(-30) 2.0:1:2.0 (2.0:1:1.0)(-10) 1.0:1:1.0 18
FO + N02 ~ FON02 (2.6:1:2.0)(-31 ) 1. 3:1:1.3 (2.0:1:1.0)(-11) 1.5:1:1.5 19
./ CH3 + 02 !! CH302 (6.0:1:3.0 )(-31) 2.0:1:1.0 (2.0:1:1.0)(-12) 1.7:1:1. 7 20
CH302 + N02 !! CH302N02 (1.5:1:0.8)(-30) 4.0:1:2.0 (6.5:1:3.2)(-12) 2.0:1:2.0 21
VOH + 502 !! H0502 (3.0:1:1.5)(-31 ) 3.4:1:1.5 (2.0:1:1.5)(-12) 0:1:1.0 22
OH + C2H4 !! HOCH2CH2 (3. r:t2)( -28) 3.1:1:2.0 (8.8:1:0.9)(-12) O:!:~ 23
DH + C2H2 ~ HDCHCH (3.5:1:2)(-29) 3.5:1:2.0 (8.0:1:1.0)(-13) -2.6:!:~:g 24
k (T) [M] 2} -1
Note: k(Z) = K(M,T) = (1 + kO(T) [M]/k (T» 0.6 {l + [loglO(ko (T)[H]/k<Xl(T»)]
o <Xl
The values quoted are suitable for air as the third body, H.
+Hinor changes from JPL 82-57 for consistency with calculations of Patrick and Golden (1983).
99

1. Low-pressure limit and T-dependence are an average of Klais,
Anderson, and Kurylo (1980a), and Lin and Leu (1982). The result
is in agreement with most previous work (see references therein).
2. Low-pressure limit from Kajimoto and Cvetanovic (1976). T-dependence
assuming constant S. Rate constant is extremely low in this special
system due to electronic curve crossing.
3. Kurylo (1972), Wong and Davis (1974) averaged. Both studies include
T-dependence; the recommended value is chosen with constant <~>N _
.05 kcal mole-1• This very low number reflects rotational effects.
4. Zellner (1982) reports pressure and T-dependence in N2 for
253 < T < 353. Their values are in rough agreement with those of
Kijewsky and Troe (1972), who report low-pressure values in Ar for
950 < T < 1450. Trainor and von Rosenberg (1974) also report a
value.
5. Values of rate constants and temperature dependences from the
evaluations of Baulch ~ al. (1980). They suggest Fe = 0.85=.1, compared to our fixed value of 0.6. They also suggest m = -0.3.
These make very small differences over the range of stratospheric
conditions.
(In a supplementary review, Baulch ~ sl. (1982) suggest a slight
temperature dependence for Fc' which would cause their suggested
value to rise to Fc = 0.89 at 200 K.)
6. Values of rate constants and temperature dependences from the
evaluations of Baulch ~sl. (1980). They use Fc = 0.8 to fit the
measured data at 298K, but our value of Fc = 0.6 gives a similar
result. (In a supplementary review, Baulch ~ al. (1982) suggest
100

a slight temperature dependence for Fc , which would cause their
suggested value to rise to Fc = 0.85 at 200K.)
7. The low-pressure limit rate constant has been reported by Anderson
and Kaufman (1972), Stuhl and Niki (1972), Morley and Smith (1972),
Westenberg and de Haas (1972), Anderson ~al., (1974), Howard and
Evenson (1974), Harris and Wayne (1975), Atkinson gisl. (1975),
Overend ~sl. (1976), Anastasi and Smith (1978), and Burrows
et sl. (1983). The general agreement is good, and the recommended
value is a weighted average, with heavy weighting to the work of
Anastasi and Smith. The reported high pressure limit rate
constant is generally obtained from extrapolation. The recom mended
value is a weighted average of the reports in Anastasi and Smith (1978)
and Anderson ~sl. (1974). [Both ~ and trans - HONO are
formed. ]
8. Low-pressure limit from Anderson ~sl. (1974), who report n = 2.5
(240 < TIK < 450); Howard and Evenson (1974); Anastasi and Smith
(1976), who report n = 2.6 (220 < TIK < 550) and Wine ~sl. (1979)
who support these values over the range (247 < TIK < 352). The recommended
value of n = 3.2 comes from <~E>N =0.55 kcal mole-1• (This 2
value is consistent with the experiments.) Burrows gi.s.L (1983)
confirm the value of 295 K. The high-pressure limit and T-dependence
come from R R KM model of Smith and Golden (1978), although the error
limits have been expanded to encompass m = O.
Robertshaw and Smith (1982) have measured k up to 8.6 atmospheres of
CF4. Their work suggests that koo might be higher than suggested
here (-50%). This might also be due to other causes (i.e., isomer
formation or involvement of excited electronic states). The recommendation
herein fits all data over the range of atmospheric interest.
9. Low-pressure limit from Howard (1977) and Sander and Peterson
(1982). The latter work includes a complete study of pressure and
101

temperature dependence, and all other parameters are from this
study. The previous values from Baldwin and Golden (1978b), who used
RRKM theory and data on the reverse reaction from Graham, Winer, and
Pitts (1977), differ slightly in the value and the temperature
dependence of koo• The absence of negative temperature dependence
for koo yields an equilibrium constant that, in turn, yields values
of SO(H02N02) -76 cal mole-1 deg-1 and bHf(H02N02) = -12.7 kcal
mole-1• This compares to Baldwin and Golden's values of S0298 = 71.6, and 6Hf ,298 = -14.1 kcal/mole-1• This value of 71.6 e.u. should be a fairly conservative upper limit, and suggests that some
negative T-dependence may be required to fit all the data. The
discrepancy in the high-pressure limiting rate constants has a
small effect at stratospheric pressures.
other studies by Simonaitis and Heicklen (1978) and Cox and Patrick
(1979) are in reasonable agreement with the recommendations.
10. Data on the reverse reaction from Connell and Johnston (1979) and
Viggiano ~ al. (1981). A very thorough analysis of this data by
Malko and Troe (1982) concludes that the data is best fit with ko300 = 3.7 x 10⁻³⁰ , n = 4.1, koo30 0 = 1.6 x 10⁻¹² , m = -0.2, and F c = exp(-T/250) +
exp(-1050/T), Fc = .33 at 300K. The values recommended here fit the
data just as well. A recent study in 02 (Fowles ~ al. 1982) is in
rough agreement for the high pressure limit.
11. Low-pressure limit from Lee ~ sl., (1978a), Clark ~ sl. (1966),
Ashmore and Spencer (1959), and Ravishankara ll.al. (1978).
Temperature dependence from Lee ~al. (1978a) and Clark ~~.
(1966).
12. Low-pressure limit and T-dependence from Ravishankara ~~. (1978),
Ravishankara (1982), and Chang ~ ale (1979). The latter paper
shows why Niki ~ sl. (1978c) saw two products with ClONO dominating.
8 = 0.28 was arrived at by dividing the sum of ksc for both paths
102

into measured rate constant for overall reaction of Cl + N02.
[Both ~ and ~ - ClONO are formed.] High-pressure limit and
temperature dependence are fixed to match measurement at 200 torr.
13. stedman ~~. (1968) and Nicholas and Norrish (1968) measured this
process in Ar. Recommended value based on k(N2)/k(Ar) = 1.8. T-dependence from constant <~>.
14. The available kinetics data for this reaction fall into two sets,
which are in substantial disagreement. Several independent low
pressure determinations (Zahniser ~ ~., 1977; Birks ~ ~., 1977;
Leu ~~., 1977; Lee ~ gl., 1982) of the rate of ClO disappearance
via the ClO + N02 + M reaction are in excellent agreement and give
an average ko (300) near 1.8 x 10⁻³¹ cm6 s-1. No product
identification was carried out, and it was assumed that the reaction
gave chlorine nitrate, ClON02• In contrast, direct measurements
of the rate of thermal decomposition of ClON02 (Knauth, 1978;
Schonle ~ ~., 1979), combined with the equilibrium constant, give
ko(300) = 4.5 x 10⁻³² cm6 s-1 for the three-body reaction forming
ClON02• Since the measured rate of ClO disappearance seems well
established by four groups, the Knauth results can be reconciled
with the higher number by three different explanations: (1) the
measured thermal decomposition rate is incorrect; (2) the
equilibrium constant is in error by a factor of three (requiring
that the ~Hf's are off by -1 kcal/mole, which, while small, is
outside the stated error limits); (3) all the data are correct, and
the low-pressure ClO disappearance studies measured not only a
reaction forming ClON02 , but another channel forming an isomer,
such as OClN02, ClOONO, or OClONO (Chang ~ al., 1979; Molina gt si., 1980a) •
Recent work by Margitan (1983b) and Cox li.9l.. (1983) indicate that
there are no isomers of ClON02 formed. Thus, either explanation (1)
and/or (2) above must be invoked.
103
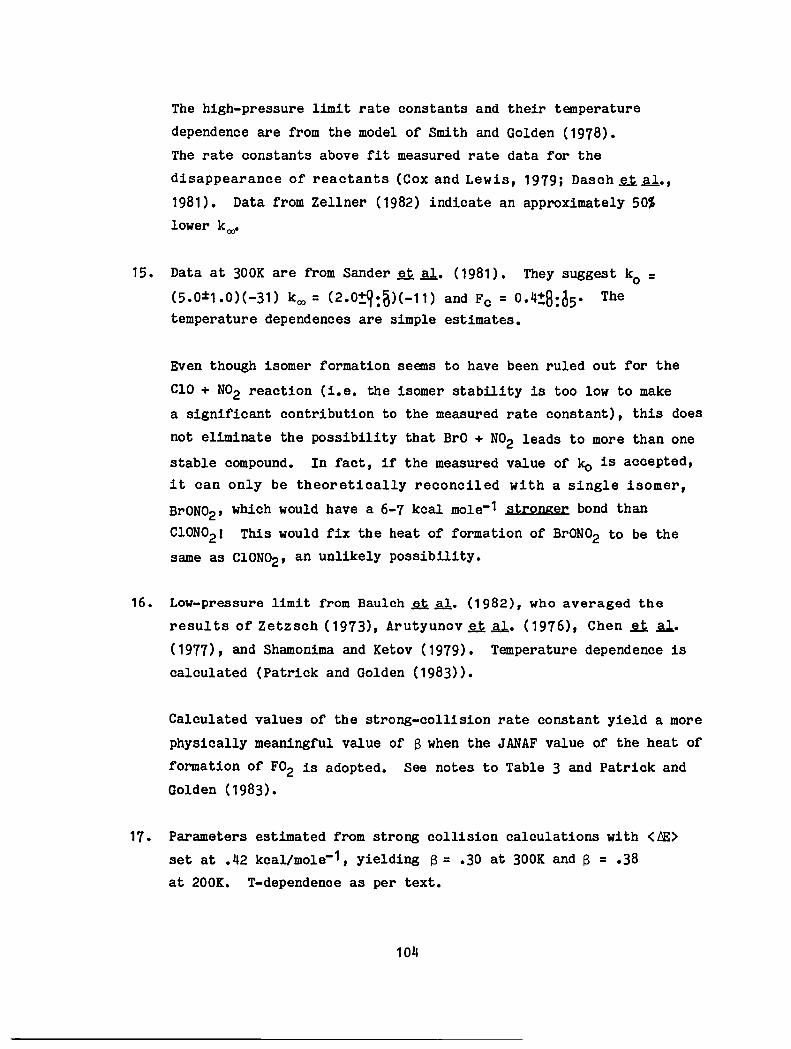
The high-pressure limit rate constants and their temperature
dependence are from the model of Smith and Golden (1978).
The rate constants above fit measured rate data for the
disappearance of reactants (Cox and Lewis, 1979; Dasch §..t.li.,
1981). Data from Zellner (1982) indicate an approximately 50%
lower koo'
15. Data at 300K are from Sander ~Al. (1981). They suggest ko = (5.0~1.0)(-31) koo = (2.0!q:O)(-11) and Fc = 0.4!8:05' The temperature dependences are simple estimates.
Even though isomer formation seems to have been ruled out for the
C10 + N02 reaction (i.e. the isomer stability is too low to make
a significant contribution to the measured rate constant), this does
not eliminate the possibility that BrO + N02 leads to more than one
stable compound. In fact, if the measured value of ko is accepted,
it can only be theoretically reconciled with a single isomer,
BrON02, which would have a 6-7 kcal mole-1 stronger bond than
C10N02 ! This would fix the heat of formation of BrON02 to be the
same as C10N02' an unlikely possibility.
16. Low-pressure limit from Baulch ~~. (1982), who averaged the
results of Zetzsch (1973), Arutyunov lili. (1976), Chen ~ .s.l..
(1977), and Shamonima and Ketov (1979). Temperature dependence is
calculated (Patrick and Golden (1983».
Calculated values of the strong-collision rate constant yield a more
physically meaningful value of B when the JANAF value of the heat of
formation of F02 is adopted. See notes to Table 3 and Patrick and
Golden (1983).
17. Parameters estimated from strong collision calculations with <tE> set at .42 kcal/mole-1, yielding B = .30 at 300K and B = .38
at 200K. T-dependence as per text.
104

18. Low-pressure limit rate constant from strong collision calculation
and S = 0.30. T-dependence from constant <6E> = 0.42 kcal mole-1.
High-pressure limit and T-dep~ndence are estimated by analogy to
Cl + N02 , assuming the same relative stability of the analogous
isomers (i.e. FONO is formed more rapidly than FN02)'
19. Low-pressure limit from strong collision calculation and S = 0.33.
T-dependence from constant <6E> = .52 kcal mole-1• High-pressure
limit and T-dependence estimated.
Once again (see Note 15) multiple channels could be important here,
which would mean that the reaction between FO and N02 could be much
faster, since these values consider only FON02 formation.
20. Low pressure limit from recent reports of Plumb and Ryan (1982) and
Selzer and Bayes (1983) who each report ko - 3 x 10-31 cm-6 sec-1
in He. Low-pressure limit T-dependence as per text. High-pressure
limit from van den Bergh and Callear (1971), and Hochanadel ~Al.
(1977). [Data of Basco ~~. (1972), Washida and Bayes (1976),
Laufer and Bass (1975), Washida (1980), are also considered.]
High-pressure limit T-dependence estimated.
21. Parameters from a reasonable fit to the temperature and pressure
dependent data in Sander and Watson (1980) and Ravishankara ~ ale
(1980a) •
The former reference reports their room-temperature data in the same
form as herein, but they allow Fc to vary. They report:
ko = 2.33 x 10⁻³⁰ , koo = 8 x 10-12 , Fc = 0.4 which is not a qualitatively different fit to the data at 300K.
The later reference reports temperature dependence as:
ko = 2.2 x 10⁻³⁰(T/300)-2.5, koo = 7 x 10-12(T/300)-3.5, Fc = 0.4
These parameters are a better fit at all temperatures than those
recommended here. We do not adopt them since they are not much
105

better in the stratospheric range, and they would require both a
change in our Fc = 0.6 format, and the adoption of a quite large
negative activation energy for koo•
The most recent CODATA recommendations (Baulch ~ ~., 1982) are:
ko = 2.3 x 10⁻³⁰ (T/300)-4, koo = 8 x 10-12 and
F - e-T/ 320 + e-1280/T. F = .41 at 300K and .54 at 200K. c - , c These values do not fit the data as well as the current recommendations.
It is interesting to note that the data require a negative T-dependence
for koo' unlike H02 + N02, and that the value of S at 300K is -.2.
22. Values of rate constants from Baulch ~ ale (1980). Temperature
dependence from S = .07 ( E = .24 kcal mole-1) as forced by the data.
They suggest a value of Fc = 0.7. In a supplementary review, Baulch ~ sl.
(1982) suggest that Fc = 0.55 at 300K and is temperature dependent, such that
Fc = 0.67 at 200K, and they raise koo3 00 to 2.5 x 10⁻¹² to accommodate
this change. The computed rate constants are essentially the same over
stratospheric conditions as when using Fc = 0.6 as recommended herein.
Recent work of Leu (1982) and Ravishankara (1983) are in excellent agreement
with the recommended values.
23. Experimental data of Tully (1983), Davis ~ Al. (1975), Howard
(1976), Greiner (1970a), Morris ~ ale (1971) and Overend and
Paraskevopolous (1977b) in helium, Atkinson ~ al. (1977) in argon
and Lloyd et ale (1976) and Cox (1975) in nitrogen/oxygen mixtures,
have been considered in the evaluation. All data are for T > 290 K.
The low-pressure limiting rate constant and its temperature
dependence are from calculations of the type discussed earlier
and in Patrick and Golden (1983). Most of the data is close to the
high pressure limit and relatively insensitive to ko •
The value of the high-pressure limiting rate constant and its
temperature dependence were arrived at from the same data base as
106

above.
The consensus value of koo is already so high, that is unlikely to
have much temperature dependence. This is not a radical-radical
reaction, such as all the previous entries in Table 2, and is
unlikely to have a positive value of m. The extreme limit of m = -2
corresponds to a real activation energy of -1 kcal mole-1.
24. The rate coefficient for this reaction has been measured in
discharge flow tubes by three groups of investigators; Wilson and
Westenberg (1967), Breen and Glass (1971), and Pastrana and Carr
(1974). There is poor agreement between these three studies.
Smith and Zellner (1973) measured k(298K) = 8 x 10-13 cm3 molecule-1
s-1. Davis ~Al. (1975) found the rate coefficient to be
independent of pressure, which is contradicted by Perry ~ Al. (1977), Michael ~~. (1980), and Perry and Williamson (1982) who
found k(298K) to increase up to a pressure of -200 torr of
argon and then reach a pressure-independent value.
The recommended values fit the temperature and pressure dependence
of the latter three reports, when the differences between Ar and
N2 as bath gases are considered.
The low pressure limiting rate constant and its temperature
dependence are calculated as always. Thermo-chemical parameters
are adjusted within reason to fit the data.
The high pressure rate constant and its temperature dependence
are from Michael ~~. (1980), extrapolated downward in temperature.
The error limits on m reflect the positive activation energy
requirement.
107

EQUILIBRIUM CONSTANTS
FQrmat
SQme Qf the three-bQdy reactiQns in Table 2 fQrm prQducts which are
thermally unstable at atmQspheric temperatures. In such cases the thermal
decQmpQsitiQn reactiQn may cQmpete with Qther IQSS prQcesses, such as
phQtQdissQciation or radical attack. Table 3 lists the equilibrium
cQnstants, K(T), for six reactiQns which may fall intQ this categQry. The
table has three cQlumn entries, the first tWQ being the parameters A and B
which can be used tQ express K(T):
K(T)/cm3 molecule-1 = A exp(B/T) (200 < T < 300K)
The third cQlumn entry in Table 3 is the calculated value of K at 300K.
The data sources for K(T) are described in the individual notes to
Table 3. When values of the heats Qf formation and entropies of all
species are knQwn at the temperature T, we note that:
log [K(T)/cm3 molecule- 1] = 2.303R
~HO T
2.303RT + log T - 21.87
where the superscript "0" refers to a standard state of one atmosphere.
In some cases K values were calculated from this equation, using
thermochemical data. In other cases the K values were calculated directly
from kinetic data for the forward and reverse reactions. When available,
JANAF values were used for the equilibrium constants. The following
equations were then used to calculate the parameters A and B:
108

K200 300 . 200 B/oK = 2.303 log 200
K300 300-
log A = log K(T) - B/2.303 T
109

Table 3. Equilibrium Constants
Reaction A/cm3 molecule-1 log K(300) Note
.At02 + N02 + H02N02 2.33 x 10⁻²⁷ 10, 870 -10.90 1
A02 + N03 + N205 1. 77 x 10-27 11 , 001 -10.83 2
/c:l + 02 + C100 2.43 x 10⁻²⁵ 2, 979 -20.30 3
C10 + 02 + C10· 02 <1.3 x 10⁻²⁶ <5, 230 <-18.30 4
F + 02 + FOO 5.32 x 10⁻²⁵ 7, 600 -13.27 5a
1.15x 10⁻²⁵ 3, 582 -19.75 5b
CH302 + N02 + CH302N02 1.30 x 10⁻²⁸ 11 , 192 -11.68 6
K/cm3 molecule-1 = A exp(B/T) [200 < T/K < 300]
110

1. The value was obtained by combining the data of Sander and Peterson
(1982) for the rate constant of the reaction as written and that of
Graham ~Ai. (1977) for the reverse reaction.
From the equilibrium constant, it may be inferred that the thermal
decomposition of H02N02 is unimportant in the stratosphere, but is important in the troposphere.
2. The parameters A and B were calculated from JANAF equilibrium constants
at 200 and 300 K.
3. Cox ~ gl. (1979) measured K at 298 K. Their reported value of K,
(5.4%2.6) x 10-21 cm3 molecule-1 , when combined with JANAF values
for the entropy change, gives ~Hf(298)(Cl02) = 22.5 kcal/mole-1•
This is in excellent agreement with Ashford ~al. (1978), who suggest
~f(298)(Cl02) = 22.5%.5 kcal/mole-1• The expression of Cox ~al.
is:
K = 3.71 x 10⁻²⁸ T exp(32l7/T).
4. Zellner (1982) suggests K < 12 atm-1 and ~H ~ - 11 kcal/mole. The
corresponding value of A leads to S0300(ClO·02) -73 cal mole-1 K-1.
A higher value of
requires SO(ClO·02)
unreasonably high.
evidence for ClO·02•
K has been proposed by
to be about 83 cal mole-1
Carter and Andrews (1981)
Prasad (1980), but it
K-1, which seems
found no experimental
5. (a) From JANAF thermochemical values. (This value favored by ko
calculation, see Note 16, Table 2.)
(b) From Benson's (1976) thermochemical values.
6. Thermochemical values at 300 K for CH302N02 and CH302 are from
111

Baldwin (1982). In the absence of data, ~Ho and ~so were assumed
to be independent of temperature. Bahta et~. (1982) have measured
k(dissociation) at 263 K. Using the values of k(recombination) suggested
in this evaluation, they compute K(263) = (2.68~0.26) x 10-10 cm3•
Our values predict 3.94 x 10⁻¹⁰ cm3, in good agreement.
112

PHOTOCHEMICAL DATA
Discussion Q! Format ~~ Estimates
In Table 4 we present a list of photochemical reactions considered
to be of stratospheric interest. The absorption cross sections of 02 and
03 largely determine the extent of penetration of solar radiation into the
stratosphere and troposphere. Some comments and references to these cross
sections are presented in the text, but the data are not listed here. The
photodissociation of NO in the O2 Schumann-Runge band spectral range is
another important process requiring special treatment and is not discussed
in this evaluation (see, for example, Frederick and Hudson, 1979; Allen
and Frederick, 1982; and WMO Report '11).
For some other species having highly structured spectra, such as
CS2 , S02 and OCIO, some comments are given in the text, but the
photochemical data are not presented. The species CH20 and N02 also have
complicated spectra, but in view of their importance for atmospheric
chemistry the data are summarized in the evaluation; for more detailed
information on their high-resolution spectra and temperature dependence,
the reader is referred to the original literature.
Table 5 gives recommended reliability factors for some of the more
important photochemical reactions. These factors represent the combined
uncertainty in cross sections and quantum yields, taking into
consideration the atmospherically important wavelength regiOns, and they
refer to total dissociation rate regardless of product identity (except in
the case of 0(1D) production from photolYSiS of 03)·
The absorption cross sections are defined by the following
expression of Beer's Law:
113

I = Ioexp(-anl),
where: Io, I are the incident and transmitted light intensity,
respectively, a is the absorption cross section in cm2 molecule- 1 , n is
the concentration in molecule cm-3 , and 1 is the pathlength in cm. The
cross sections are room temperature values, and the expected
photodissociation quantum yields are unity, unless otherwise stated.
114

Table 4. Photochemical Reactions of Stratospheric Interest
02 + hv + ° + ° 03 + hv + 02 + 0
03 + hv + 02 + 0(1D) H02 + hv + products
H20 + hv + H + OH
H202 + hv + OH + OH
NO + hv + N + ° N02 + hv + NO + ° N03 + hv + products
N20 + hv + N2 + 0(1D)
N205 + hv + products
NH3 + hv + NH2 + H
HN02 + hv + OH + NO
HN03 + hv + OH + N02 HN04 + hv + products
Cl2 + h v + CI + CI
CIO + hv + CI + ° CIOO + hv + products
OCIO + hv + ° + CIO CI03 + hv + products
HCI + hv + H + CI HOCI + hv + OH + CI
CINO + hv + CI + NO
CIN02 + hv + products
(1) Hudson and Kieffer (1975)
(2) Turco (1975)
IF New entry
(1)
(1)
115
CIONO + hv + products
CION02 + hv + products
CCl4 + hv + products
CCl3F + hv + products
CCl2F2 + hv + products
CHCIF2 + hv + products CH3CI + hv + products
CCl20 + hv + products
CCIFO + hv + products
CF20 + hv + products
CH3CCl3 + hv + products
#BrO + hv + Br + ° BrON02 + hv + products
HF + hv + H + F
CO + hv + C + ° C02 + hv + CO + ° CH4 + hv + products
CH20 + hv + products
CH300H + hv + products
HCN + hv + products
CH3CN + hv + products
S02 + hv + SO + ° H2S + hv + HS + H
COS + hv + CO + S CS2 + hV + products
(1)
(1)
(2)
(2)

Table 5. Combined Uncertainties for Cross Sections and
Quantum Yields
Species Uncertainty
°2 (Schumann-Runge bands) 1.4
°2 (Continua) 1.3
°3 1.15
03 + 0(1 D) 1.4
N02 1.25
N03 2.0
N20 1.2
N205 2.0
H202 1.4
HN03 1.25
H02N02 2.0
CH20 1.4 HCl 1.15
HOCl 1.4
CION02 1.25
CCl4 1.1
CC13F 1 .1
CC12F2 1.15
CH3Cl 1.1
CF20 2.0
CH300H 1.4
BrON02 1.4
116

O2 + h \J -+ 0 + 0
The photodissociation of molecular oxygen in the stratosphere is due
primarily to absorption of solar radiation in the 200-220 nm wavelength
region, i.e., within the Herzberg continuum. The 185-200 nm region -- the
02 Schumann-Runge band spectral range -- is also very important, since
solar radiation penetrates efficiently into the stratosphere at those
wavelengths.
There is considerable disagreement among the cross section values
measured in the laboratory around 200 nm. Hasson and Nicholls (1971)
report the largest values: -1.4 x 10⁻²³ cm2 at 200 nm and -1.1 x 10⁻²³ cm2
at 210 nm. Shardanand and Prasad Rao (1977) obtain the smallest cross
sections, 1.0 x 10⁻²³ cm2 at 200 nm and 7.7 x 10⁻²⁴ cm2 at 210 nm. Other
investigators (Ditchburn and Young, 1962; Ogawa, 1971) report values lying
between the two extremes.
Frederick and Mentall (1982) and Herman and Mentall (1982) have
estimated 02 absorption cross sections from balloon measurements of solar
irradiance in the stratosphere. The latter authors find the cross
sections in the 200-210 nm range to be -35% smaller than the smallest of
the laboratory results, which are those of Shardanand and Prasad Rao.
Additional laboratory studies should be carried out to resolve the
discrepancies.
The attenuation of solar radiation in the Schumann-Runge wavelength
region is a problem requiring special treatment due to the rotational
structure of the bands; see, for example, Nicolet and Peetermans (1980);
Frederick and Hudson (1980); and Allen and Frederick (1982). The
effective O2 cross sections obtained from solar irradiance measurements in
117

the stratosphere by Herman and Mentall (1982) are in good agreement
between 187 and 195 nm with the values reported by Allen and Frederick
(1982), which were obtained by an empirical fit to the effective cross
sections appropriate for stratospheric conditions. Between 195 and 200 nm
the fit yielded values which are somewhat larger than those estimated by
Herman and MentaU.
The studies of the penetration of solar radiation in the atmosphere
in the Schumann-Runge wavelength region have been based so far on
laboratory measurements of cross sections which were affected by
instrumental parameters due to insufficient spectral resolutio~ Yoshino
et ale (1983) have recently reported high resolution 02 cross section
measurements at 300K, between 119 and 202 nm, obtaining presumably the
first set of results which is independent of the instrumental width. The
Schumann-Runge cross sections are temperature-dependent, so that
additional studies will be required in order to carry out detailed
atmospheric modelling calculations. Furthermore, for estimates of the
solar irradiance in the stratosphere the cross section values which need
to be accurately known are those at the wings of the rotational lines and
in the underlying continuum, and these are several orders of magnitude
smaller than the peak values.
118

03 + hV + 0 + O2
The quantum yields for 0(1D) production, ~(01D), for wavelengths
near 310 nm--i.e., the energetic threshold or fall-off region--have been
measured mostly relative to quantum yields for wavelengths shorter than
300 nm, which were assumed to be unity. There are now several studies
which indicate that this assumption is not correct: Fairchild ~ ale
(1978) observed approximately 10% of the primary photolysis products in
the ground state channel, that is, ~(03p) ~ 0.1, at 274 nm; 'Sparks II ale
(1980) also report ~(03p) ~ 0.1, at 266 nm; according to Brock and Watson
(1980b) ~(01D) = 0.88 at 266 nm; Amimoto ~ al. (1980) report ~(01D) = 0.85 at 248 nm, and Wine and Ravishankara (1982) measured
directly ~(03p) = 0.09 at 248 nm. There are also some indications
that ~(01D) decreases slightly between 304 and 275 nm (see Brock and
Watson, 1980 a, b).
The recommendation for the quantum yields in the fall-off region is
given in Table 5, and is taken from the mathematical expression given by
Moortgat and Kudzus (1978), scaled down by a factor of 0.9 to account for
the absolute magnitude of ~(01D) at short wavelengths. The relative
values are in good agreement with those reported by Brock and Watson
(1980a) •
There are several reviews of the 03 absorption cross sectiOns; see,
for example, Ackerman (1971) and Hudson and Kieffer (1975). Additional
laborator~ measurements are required in order to better establish the
cross sections and their temperature dependency, particularly in the
critical 280-320 nm range (such work is in progress; see Bass and Paur,
1981).
119

Table 6. Mathematical Expression for O(lD) Quantum Yields, ~, in the
Photolysis of 03
Where: T = T - 230 is a temperature function with T given in Kelvin,
T is expressed in nm, and arctan in radians.
The coefficients A(T), B(T), \,(T) and C(T) are expressed as
interpolation polynomials of the third order:
A(T) = 0.332 + 2.565 x 10⁻⁴ T + 1.152 X 10⁻⁵T 2 + 2.313 X 10⁻⁸T 3
B(T) = -0.575 + 5.59 x 10⁻³T -1.439 X 10⁻⁵T 2 - 3.27 X 10⁻⁸T 3
AO(T) - 308.20 + 4.4871 x 10⁻²T +6.9380 X 10⁻⁵T 2 - 2.5452 X 10⁻⁶T 3
C(T) = 0.466 + 8.883 x 10⁻⁴T -3.546 X 10⁻⁵T 2 + 3.519 X 10⁻⁷T 3.
In the limits where ~(A,T) > 0.9, the quantum yields is set ~ = 0.9, and
similarly for ~(A,T) < 0, the quantum yield is set ~ =0.
120

H02 + hv + OH + 0
The absorption cross sections or the hydroperoxyl radical, H02, in
the 200-250 run region have been measured at room temperature by Paukert
and Johnston (1972), Hochanadelllli. (1972) and Cox and Burrows (1979).
Hochanadel ~ sl. (1980) give a cross section value of 4.0ZO.5 x 10-18 cm2
at 205 nm, and Sander ~ li. (1982) a value of 3.0:0.4 x 10⁻¹⁸ cm2 at
227.5 nm.
The shape of the spectrum reported by the first three groups cited
above is in reasonable agreement. The recommended absorption cross
sections, listed in Table 7, are computed from the mean of the three after
normalization of each spectrum to the value at 227.5 run reported by Sander
~ li. (1982). This latter study gives the most direct measurement of an
absolute cross section value for H02.
Lee (1982) has detected O(1n) as a primary photodissociation product
at 193 and at 248 run, with a quantum yield which is about 15 times larger
at the longer wavelength. The absolute quantum yield for O(1n) production
has not been reported yet.
Table 7. Absorption Cross Sections of H02
A(nm) 1020a(cm2)
190 430
200 480
210 490
220 400
230 260
240 120
250 50
121

H202 + hv + OH + OH
The recommended absorption cross section values, listed in Table 8,
are the mean of the data of Lin li.s.l.. (1978b) and of Molina and Molina
(1981). This latter work supersedes the earlier results of Molina ~ sl.
(1977a).
Table 8. Absorption Cross Sections of H202 Vapor
A 1020 a A 1020 a
(nm) (cm2) (nm) (cm2)
190 67.2 270 3.2 195 56.3 275 2.5 200 47.5 280 2.0
205 39.8 285 1.5 210 34.9 290 1.13
215 29.9 295 0.87 220 25.4 300 0.66 225 21.3 305 0.49 230 17.9 310 0.37 235 14.8 315 0.28 240 12.2 320 0.20
245 10.0 325 0.15 250 8.3 330 0.12 255 6.7 335 0.09 260 5.2 340 0.07 265 4.2 345 0.05
350 0.03
122

N02 + hv + NO + 0
Table 9 lists the recommended absorption cross sections of nitrogen
dioxide, taken from the work of Bass et ~ (1976), who report extinction
coefficients every 1/8 nm between 185 and 410 nm at 298 K, and between 290
and 400 nm at 235 K. The effect of the dimer (N204) absorption was
considered in detail, and the measurements are probably correct to within
±10%.
Harker ~ 21. (1977) have reported measurements of absorption cross
sections and quantum yields in the 375-420 nm region. Their cross
sections are 4-10% larger than the values reported by Bass ~.s.l. (1976),
and their quantum yields are, on the average, about 15% smaller than those
measured by Jones and Bayes (1913), whose data provided the basis for
earlier recommendations. Recent measurements of the quantum yields by
Davenport (1978) at six different wavelengths agree very well with those of
Harker ~~ The recommended values for the quantum yields, presented in
Table 9, are those of Harker ll..s.l. (1977). Davenport's results indicate
that the quantum yields themselves are temperature dependent, although the
effect of temperature on the cross sections is more pronounced.
For quantum yields in the 295-365 nm region the recommendation is to
use the expression given by Jones and Bayes (1973), listed at the bottom
of Table 10. More accurate values should be established in this
wavelength region, although their contribution to the overall atmospheric
photodissociation rate is not of major importance. Direct measurements of
the solar photodissociation rate 1n the troposphere (Stedman ~sA., 1975;
Dickerson and Stedman, 1980) indicate that the present data base is
adequate for atmospheric modeling purposes. However, in view of the
123

importance of the N02 atmospheric photodissociation process additional
studies of the temperature dependence of the quantum yield should be
carried out.
124
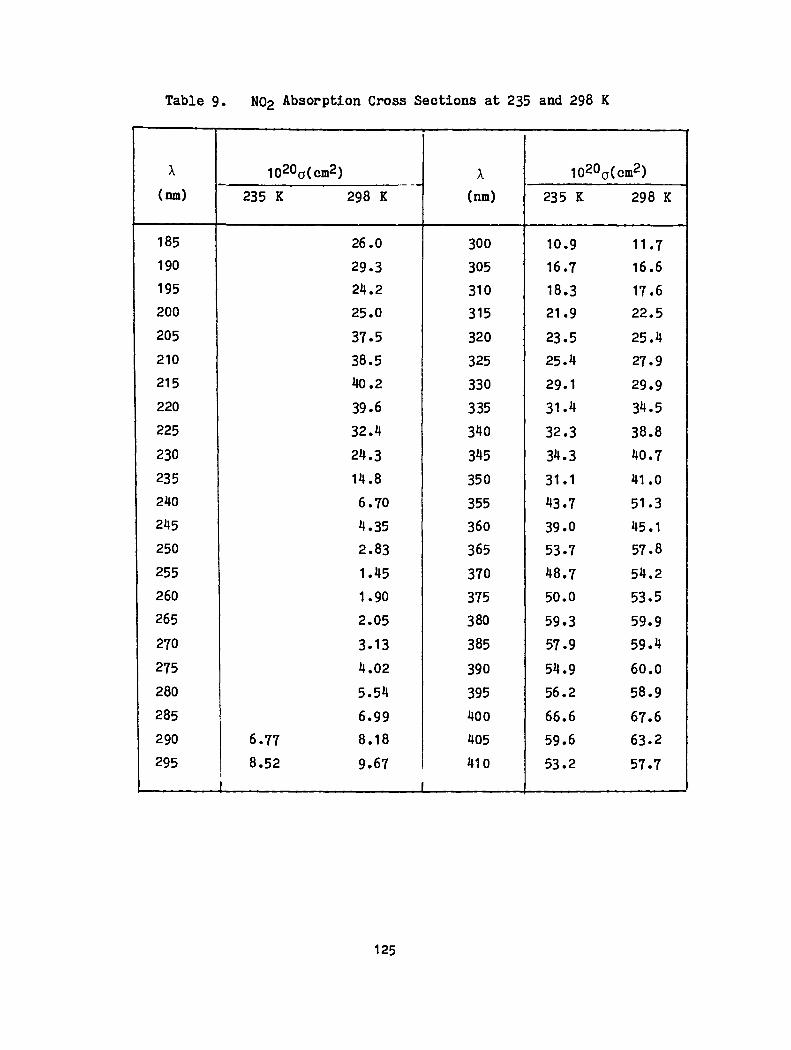
Table 9. N02 Absorption Cross Sections at 235 and 298 K
A 102Oa(cm2) A 102Oa(cm2) --(nm) 235 K 298 K (nm) 235 K 298 K
185 26.0 300 10.9 11.7 190 29.3 305 16.7 16.6 195 24.2 310 18.3 17 .6 200 25.0 315 21.9 22.5 205 37.5 320 23.5 25.4 210 38.5 325 25.4 27.9 215 40.2 330 29.1 29.9 220 39.6 335 31.4 34.5 225 32.4 340 32.3 38.8 230 24.3 345 34.3 40.7
235 14.8 350 31.1 41.0 240 6.70 355 43.7 51.3 245 4.35 360 39.0 45.1 250 2.83 365 53.7 57.8
255 1.45 370 48.7 54.2 260 1.90 375 50.0 53.5 265 2.05 380 59.3 59.9 270 3.13 385 57.9 59.4
275 4.02 390 54.9 60.0 280 5.54 395 56.2 58.9 285 6.99 400 66.6 67.6 290 6.77 8.18 405 59.6 63.2
295 8.52 9.67 I 410 53.2 57.7 I
~ J
125

Table 10. Quantum Yields for N02 Photolysis
A,run q, A,run <!l A,run q,
375 0.73 389 0.74 400 0.65
376 0.75 390 0.74 401 0.62
377 0.86 391 0.81 402 0.57
378 0.74 392 0.73 403 0.50
379 0.83 393 0.78 404 0.40
380 0.81 394 0.83 405 0.32
381 0.73 394.5 0.78 406 0.30
382 0.65 395 0.81 407 0.23
383 0.62 395.5 0.75 408 0.18
384 0.66 396 0.78 409 0.17
385 0.70 396.5 0.81 410 0.14
386 0.74 397 0.77 411 0.10
387 0.69 398 0.72 415 0.067
388 0.76 399 0.70 420 0.023
295-365 nm: q,(A) = 1.0-0.0008 (1..-275)
126

N03 + h v + NO + ~ ( <1>1 )
+ N02 + ° (<l>2)
The absorption cross sections of the nitrate free radical, N03, have
been studied by (1) Johnston and Graham (1974); (2) Graham and Johnston
(1978); (3) Mitchell ~ u. (1980); and (4) Marinelli ~ ale (1982). The
1st and 4th studies required calculation of the N03 concentration by
modelling a complex kinetic system. The 2nd and 3rd studies are the most
direct ones and the results in terms of integrated absorption coefficients
are in very good agreement; the discrepancies in peak heights can be
attributed to the difference in instrumental resolution, which was higher
in the 2nd study. The recommended absorption cross sections, listed in
Table 11 for every 2 nm, are taken from this latter study (Graham and
Johnston, 1978), which reports values every nm.
The 4th study was designed to characterize under high resolution the
strong absorption band around 662 nm; for spectroscopic measurements of
N03 in the atmosphere the preferred cross sections are those reported in
this 4th study, which have been scaled to yield the same integrated
absorption coefficient as in the 2nd and 3rd studies.
The quantum yields 4>1 and ¢2 have been measured by Graham and
Johnston (1978) and under higher resolution by Magnotta and Johnston
(1980), who report the product of the cross section times the quantum
yield in the 400 to 630 nm range. The total quantum yield value ¢1 + ¢2
computed from the results of this latter study and the cross sections of
Graham and Johnston (1978), listed in Table 11, are above unity for A <610
nm, which is, of course, impossible; hence, there is some systematic error
and it is most likely in the primary quantum yield measurements. Magnotta
127

and Johnston (1980) and Marinelli ~ sl. (1982) have discussed the
probable sources of this error, but the question remains to be resolved
and further studies are in order. At present, the recommendation remains
unchanged from the previous two, namely, to use the following
photodissociation rates estimated by Magnotta and Johnston (1980) for
overhead sun at the earth's surface:
J 1(NO + 02) = 0.022 s-1
J2( N02 + 0) = 0.18 s-1.
128

Table 11. Absorption Cross Sections of N03
1 20 0 CJ 10 20 CJ 10 20 CJ 10 20 CJ
(run) (cm2) (run) (cm2) (run) 1cm2) (run) Ccm2) 400 0 476 64 552 216 628 689 402 1 478 66 554 245 630 641
404 2 480 64 556 295 632 327 406 3 482 63 558 317 634 132 408 3 484 62 560 323 636 123 410 6 486 74 562 268 638 176
412 3 488 80 564 248 640 98 414 7 490 93 566 258 642 68
416 3 492 89 568 257 644 71 418 6 494 88 570 253 646 56 420 9 496 104 572 248 648 48 422 8 498 108 574 255 650 32 424 12 500 98 576 292 652 39 426 9 502 91 578 303 654 57
428 12 504 105 580 299 656 89 430 12 506 119 582 310 658 168
432 14 508 106 584 247 660 512
434 17 510 130 586 275 662 1708
436 21 512 161 588 448 664 1154
438 18 514 141 590 567 666 486
440 19 516 140 592 483 668 175 442 20 518 121 594 392 670 75 444 21 520 144 596 416 672 57
446 23 522 172 598 354 674 36
448 28 524 150 600 245 676 31
450 27 526 137 602 284 678 55
452 31 528 179 604 400 680 49
454 34 530 209 606 338 682 25
456 32 532 181 608 159 684 9 458 37 534 177 610 135 686 3
460 39 536 232 612 169 688 4
462 35 538 211 614 224 690 1
464 41 540 181 616 174 692 0
466 45 542 168 618 183 694 1
468 50 544 139 620 247 696 4
470 49 546 204 622 761 698 4
472 54 548 275 624 1166
474 56 550 224 626 700
129

The recommended values are taken from the work of Selwyn II ale
(1977), who measured the temperature dependence of the absorption cross
sections in the atmospg.erically relevant wavelength region. They have
fitted their data with the expression shown in Table 12. Hubrich and
Stuhl (1980) have recently measured the N20 cross sections at 298K and
208K, and their results are in very good agreement with those of Selwyn ~
Table 12. Mathematical Expression for Absorption Cross Sections of N20 as a Function of Temperature
ln cr(A,T) = A1 + A2A + A3A2 + A4A3 + A5A4
+ (T-300)exp(B1 + B2A + B3 A2 + B4A3)
Where: T: temperature, Kelvin A . nm . A1 = 68.21023 B1 = 123.4014
A2 = -4.071805 B2 = -2.116255
A3 = 4.301146 x 10⁻² B3 = 1.111572 x 10⁻²
A4 = -1.777846 x 10⁻⁴ B4 = -1.881058 x 10⁻⁵
A5 = 2.520672 x 10⁻⁷
Range: 173 to 240 nm; 194 to 320 K
130

N205 + hv + products
The absorption cross sections of dinitrogen pentoxide, N205 , have
been measured at room temperature by Jones and Wulf (1937) between 285 and
380 nm, by Johnston and Graham (1974) between 210 and 290 nm, by Graham
(1975) between 205 and 310 nm; and for temperatures in the 223 to 300 K
range by Yao ~~ (1982), between 200 and 380 nm. The agreement is good
particularly considering the difficulties in handling N2 05' The
recommended cross section values, listed in Table 13, are taken from Yao
ll.sl.. (1982); for wavelengths shorter than 280 nm there is little or no
temperature dependence, and between 285 and 380 nm the temperature effect
is best computed with the expression listed at the bottom of Table 13.
The primary products appear to be N02 and N03: Swanson and Johnston
(1983) have measured directly the primary quantum yield for N03 production
obtaining a value of 0.9 oJ: 0.1.
Table 13. Absorption Cross Sections of N205
A (nm) 102O o{cm2) A{nm) 102Oo{cm2)
200 920 245 52
205 820 250 40
210 560 255 32
215 370 260 26
220 220 265 20
225 144 270 16.1
230 99 275 13.0
235 77 280 11.7
240 ~a
For 285 nm < A < 380 nm; 300 K > T > 225 K:
10200 = exp[2.735 + {4728.5 - 17.127 A)/T]
Where 0/ cm2 ; A /nm; T/K.
131

HONO + hv + HO + NO
The ultraviolet spectrum of HONO between 300 and 400 nm has been
studied by Stockwell and Calvert (1978) by examination of its equilibrium
mixtures with NO, N02, H20, N203 and N204; the possible interferences by
these compounds were taken into account. The recommended cross sections,
taken from this work, are listed in Table 14.
Table 14. HONO Absorption Cross Sections
A 1020a A 1020a A 1020a
(nm) (cm2) (nm) (cm2) (nm) ( Q1!l2~
310 0.0 339 16.3 368 45.0 311 0.0 340 10.5 369 29.3 312 0.2 341 8.70 370 11 .9 313 0.42 342 33.5 371 9.46 314 0.46 343 20.1 372 8.85 315 0.42 344 10.2 373 7.44 316 0.3 345 8.54 374 4.77 317 0.46 346 8.32 375 2.7 318 3.6 347 8.20 376 1.9 319 6.10 348 7.49 377 1.5 320 2.1 349 7.13 378 1.9 321 4.27 350 6.83 379 5.8 322 4.01 351 17 .4 380 7.78 323 3.93 352 11.4 381 11 .4 324 4.01 353 37.1 382 14.0 325 4.04 354 49.6 383 17.2 326 3.13 355 24.6 384 19.9 327 4.12 356 11.9 385 19.0 328 7.55 357 9.35 386 11.9 329 6.64 358 7.78 387 5.65 330 7.29 359 7.29 388 3.2 331 8.70 360 6.83 389 1.9 332 13.8 361 6.90 390 1.2 333 5.91 362 7.32 391 0.5 334 5.91 363 9.00 392 0.0 335 6.45 364 12.1 393 0.0 336 5.91 365 13.3 394 0.0 337 4.58 366 21.3 395 0.0 338 19.1 367 35.2 396 0.0
132

HN03 + hv ~OH + N02
The recommended absorption cross sections, listed in Table 15, are
taken from the work of Molina and Molina (1981). These data are in good
agreement throughout the 190-330 nm range with the values reported by
Biaume (1973). They are also in very good agreement with the data of
Johnston and Graham (1973) except towards both ends of the wavelength
range. Okabe (1980) has measured the cross sections in the 110-190 nm
range; his results are 20-30% lower than those of Biaume and of Johnston
and Graham around 185-190 nm.
The temperature dependence of these cross sections has not been
measured yet; it might be significant in the 300 nm region and hence for
estimates of the atmospheric photodissociation rate.
Johnston et al. (1974) measured a quantum yield value of -1 for the
OH + N02 channel in the 200-315 nm range, using end product analysis. The
quantum yield for O-atom production at 266 nm has been measured to be
0.03, and that for H-atom production less than 0.002, by Margitan and
Watson (1982), who looked directly for these products using atomic
resonance fluorescence.
133

Table 15. Absorption Cross Sections of HN03 Vapor
A 10200 A 10200
(nI!!l (cm2) ~ .. (cm2)
190 1560 260 1.88
195 1150 265 1. 71 200 661 270 1.59 205 293 275 1.35 210 105 280 1.10 215 35.6 285 0.848
220 15.1 290 0.607
225 8.62 295 0.409
230 5.65 300 0.241
235 3.72 305 0.146
240 2.57 310 0.071
245 2.10 315 0.032 250 1.91 320 0.012
255 1.90 325 0.005
330 0.002
134

H02N02 + hv ~ products
There are four studies of the UV spectrum of H02N02 vapor: Cox and
Patrick (1979), Morellill, (1980), Graham lili.. (1978b) and Molina and
Molina (1981). The latter two studies are the only ones covering the gas
phase spectrum in the critical wavelength range for atmospheric
photodissociation, that is, wavelengths longer than 290 nm. The
recommended values, listed in Table 16 are taken from the work of Molina
and Molina (1981), which is the more direct study. The temperature
dependence of the cross sections at these longer wavelengths and the
identity of the photod~ssociation products remain to be determined.
Table 16. Absorption Cross Sections of H02N02 Vapor
A 10200 A 10200
(nm) (cm2) (nm) (cm2)
190 1010 260 27.8
195 816 265 22.4
200 563 270 17 .8
205 367 275 13.4
210 241 280 9.3
215 164 285 6.3
220 120 290 4.0
225 95.2 295 2.6
230 80.8 300 1.6
235 69.8 305 1 .1
240 59.1 310 0.7
245 49.7 315 0.4
250 41.8 320 0.3
255 35.1 325 0.2
330 0.1
135

Cl2 + hv + Cl + Cl
The absorption cross sections of Cl2, listed in Table 17, are taken
from the work of Seery and Britton (1964). These results are in good
agreement with those reported by Gibson and Bayliss (1933), and Fergusson
ll.al. (1936).
Table 17. Absorption Cross Sections of Cl2
A(nm) 1020 a(cm2) A(nm) 102Oa(cm2)
240 0.08 350 18.9
250 0.12 360 13 .1
260 0.23 370 8.3
270 0.88 380 4.9
280 2.7 390 3.3
290 6.5 400 1.9
300 12.0 410 1.3
310 18.5 420 0.99
320 23.6 430 0.73
330 25.6 440 0.53
340 23.6 450 0.34
136

CIO + hv + CI + 0
The absorption cross sections of chlorine monoxide, CIO, have been
reviewed by Watson (1977). There are some recent measurements yielding
results in reasonable agreement with the earlier ones, by Handelman and
Nicholls (1977) in the 250-310 nm region; by Wine et Al. (1977) around 283
nm; and by Rigaud ~s.l. (1977) and Jourdain ~.ru... (1978) in the 270-310
nm region.
The calculations of Coxon et ale (1976) and Langhoff ~ li. (1977)
indicate that photodecomposition of CIO accounts for at most 2 to 3
percent of the total destruction rate of CIO in the stratosphere, which
occurs predominantly by reaction with oxygen atoms and nitric oxide.
137

CIOO + h\J + CIO + 0
Johnston ~~. (1969) measured the absorption cross sections of the
CIOO radical using a molecular-modulation technique which required
interpretation of a complex kinetic scheme. The values listed in Table 18
are taken from their work.
Table 18. Absorption Cross Sections of CIOO
A(nm) A (nm)
225 260 255 1240
230 490 260 1000
235 780 265 730 240 1050 270 510
245 1270 275 340
250 1230 280 230
138

OCIO + hv ~ 0 + CIO
The spectrum of OCIO is characterized by a series of well developed
progressions of bands extending from - 280 to 480 nm. The spectroscopy of
this molecule has been studied extensively, and the quantum yield for
photodissociation appears to be unity throughout the above wavelength
range--see, for example, the review by Watson (1977).
Birks gi Al. (1977) have estimated a half-life against atmospheric
photodissociation of OCIO of a few seconds.
139

C103 + hv -+ products
Table 19 lists absorption cross sections of chlorine trioxide, C103 ,
for the 200 to 350 nm range obtained by graphical interpolation between
the data points of Goodeve and Richardson (1937>. Although the quantum
yield for decomposition has not been measured, the continuous nature of
the spectrum indicates that it is likely to be unity.
Table 19. C103 Absorption Cross Sections
A 1020 0 A 10200
(nm) (cm2) (nm) (cm2)
200 530 280 460
210 500 290 430
220 480 300 400
230 430 310 320
240 350 320 250
250 370 330 180
260 430 340 110
270 450 350 76
140
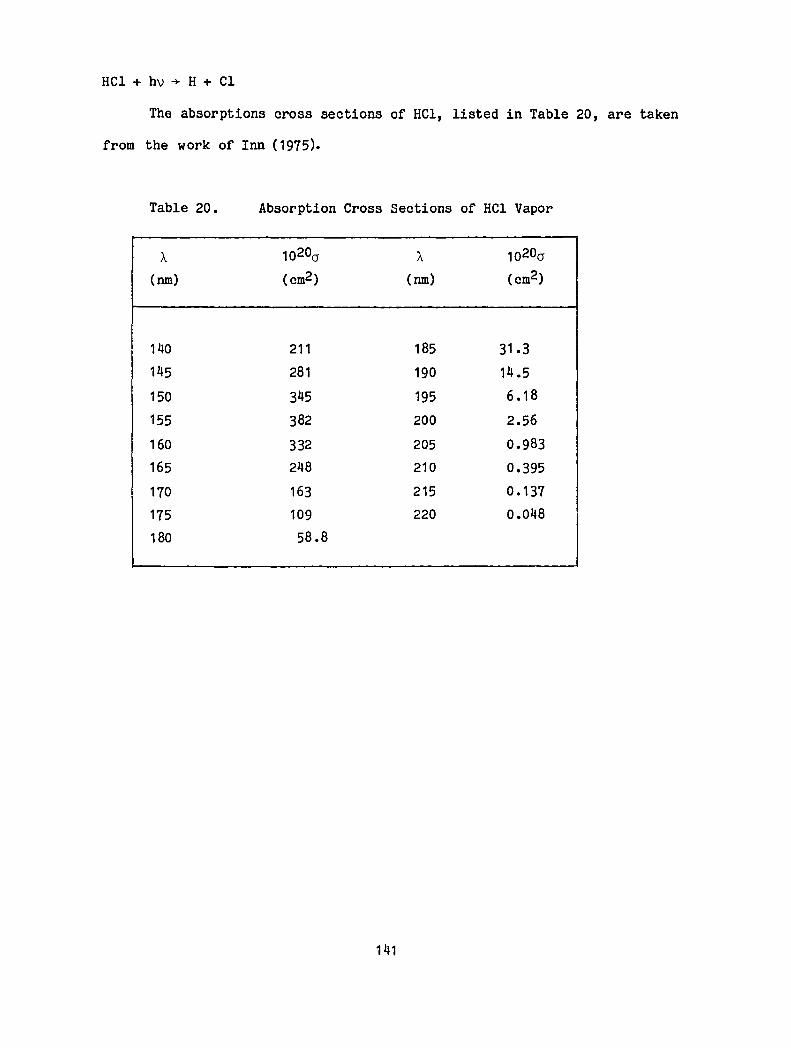
HCl + hv + H + Cl
The absorptions cross sections of HC1, listed in Table 20, are taken
from the work of Inn (1975).
Table 20. Absorption Cross Sections of HCl Vapor
A
(nm)
140
145
150
155
160
165
170
175
180
10200'
(cm2)
211
281
345
382
332
248
163
109
58.8
141
A
(nm)
185
190
195
200
205
210
215
220
10200'
(cm2)
31.3
14.5
6.18
2.56
0.983
0.395
0.137
0.048

HOCl + hv + OH + Cl
Knauth ~ ale (1979) have measured absorption cross sections of HOCl
using essentially the same technique as Molina and Molina (1978) except
for a higher temperature, which allowed them to obtain a more accurate
value for the equilibrium constant Keq for the H2Q-Cl20-HOCl system. The
cross section values from Molina and Molina's measurements recalculated
using the new Keq are in excellent agreement with the results of Knauth gi
~. The recommended values, taken from this later work, are presented in
Table 21.
Molina ~ ill. (1980b), by monitoring directly OH radicals produced
by laser photolysis of HOCl, obtain an absorption cross section value of
-6 x 10-20 cm2 around 310 nm, again in excellent agreement with the data of
Knauth li..al.. (1979).
In contrast, the theoretical predictions of Jaffe and Langhoff
(1978) indicate negligible absorption at those wavelengths. The reason is
not known, although it should be pointed out that no precedent exists to
validate the theoretical approach for this particular type of problem.
Butler and Phillips (1983) found no evidence for O-atom production
at 308 nm, and placed an upper limit of -0.02 for the primary quantum
yield for the HCl + 0 channel.
142

Table 21.
A
(nm)
200
210
220
230
240
250
260
270
280
290
300
Absorption Cross Sections of HOCI
102°0 (cm2)
5.2
6.1
11.0
18.6
22.3
18.0
10.8
6.2
4.8
5.3 6.1
143
A
(nm)
310
320
330
340
350
360
370
380
390
400
420
6.2
5.0
3.7 2.4
1.4
0.8
0.45
0.24
0.15
0.05
0.04
CINO + hv + Cl + NO
Nitrosyl chloride has a continuous absorption extending beyond 650
nanometers. There is good agreement between the work of Martin and Gareis
(1956) for the 240 to 420 nm wavelength region, of Ballash and Armstrong
(1974) for the 185 to 540 nm region, and of lIlies and Takacs (1976) for
the 190 to 400 nm region. These resul ts indicate that the early data of
Goodeve and Katz (1939) were seriously in error between 186 and 300 nm,
whereas, at longer wavelengths, they are in good agreement with the more
recent measurements.
The recommended absorption cross sections, listed in Table 22, are
obtained by taking the mean of the results of Ballash and Armstrong (1974)
and of lIlies and Takacs (1976). The two sets of measurements agree
within 20 percent, except in the region near 240 nm, where the values of
Ballash and Armstrong are about 60 percent higher.
The quantum yield for the primary photolytic process has been
reviewed by Calvert and Pitts (1966a) it is unity over the entire visible
and near-ul traviolet bands.
144

Table 22. C1NO Absorption Cross Sections
A(nm) 1020 a(cm2)
190 5270
200 6970
210 3180
220 1170
230 377
240 134
260 18.0
280 10.3
300 9.5
320 12.1
340 13.7
360 12.2
380 8.32
400 5.14
145
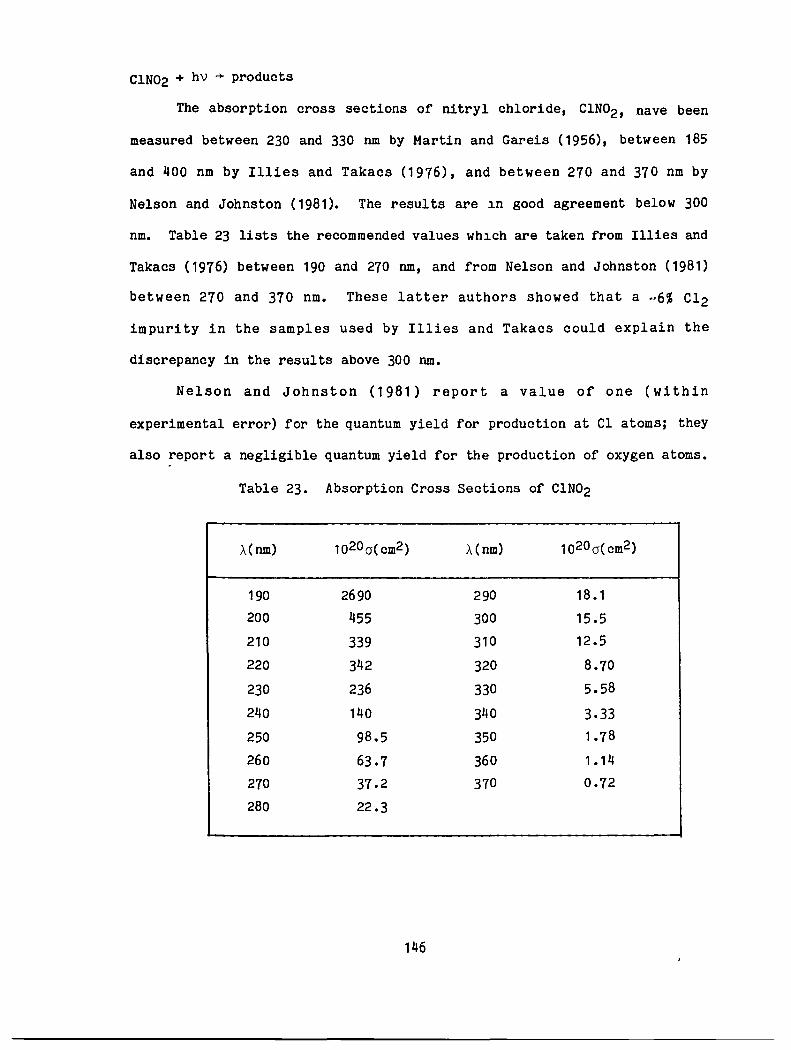
CIN02 + hv ~ products
The absorption cross sections of nitryl chloride, CIN02, nave been
measured between 230 and 330 nm by Martin and Gareis (1956), between 185
and 400 nm by lIlies and Takacs (1976), and between 270 and 370 nm by
Nelson and Johnston (1981). The results are ~n good agreement below 300
nm. Table 23 lists the recommended values wh~ch are taken from lIlies and
Takacs (1976) between 190 and 270 nm, and from Nelson and Johnston (1981)
between 270 and 370 nm. These latter authors showed that a -6% Cl2
impurity in the samples used by lIlies and Takacs could explain the
discrepancy in the results above 300 nm.
Nelson and Johnston (1981) report a value of one (within
experimental error) for the quantum yield for production at Cl atoms; they
also report a negligible quantum yield for the production of oxygen atoms.
Table 23. Absorption Cross Sections of ClN02
A(nm) 1020 a( cm2) A(nm) 102O a(cm2)
190 2690 290 18.1
200 455 300 15.5
210 339 310 12.5
220 342 320 8.70
230 236 330 5.58
240 140 340 3.33
250 98.5 350 1.78
260 63.7 360 1.14
270 37.2 370 0.72
280 22.3
146

CIONO + hv + products
Measurements in the near-ultraviolet of the cross sections of
chlorine nitrite (CIONO) have been made by Molina and Molina (1977).
Their results are listed in Table 24. The characteristics of the spectrum
and the instability of CIONO strongly suggest that the quantum yield for
decomposition is unity. The CI-O bond strength is only about 20
kilocalories, so that chlorine atoms are likely photolysis products.
Table 24. CIONO Absorption Cross Sections at 231 K
A 1020 0- A 1020 0-
(nm) (cm2) (nm) (cm2)
235 215.0 320 80.3
240 176.0 325 75.4
245 137.0 330 58.7
250 106.0 335 57.7
255 65.0 340 43.7
260 64.6 345 35.7
265 69.3 350 26.9
270 90.3 355 22.9
275 110.0 360 16.1
280 132.0 365 11.3
285 144.0 370 9.0
290 144.0 375 6.9
295 142.0 380 4.1
300 129.0 385 3.3
305 114.0 390 2.2
310 105.0 395 1.5
315 98.1 400 0.6
147

ClON02 + h v -+ products
The recommended cross section values, listed in Table 25, are taken
from the work of Molina and Molina (1979), which supersedes the earlier
work of Rowland, Spencer and Molina (1976).
The identity of the primary photolytic fragments has been
investigated by several groups. Smith llli. (1977) report ° + CIaNO as
the most l~kely products, using end product analysis and steady-state
photolysis. The resul ts of Chang II ale (1979), who employed the "Very
Low Pressure Photolysis" (VLPPh) technique, indicate that the products are
Cl + N03• Adler-Golden and Wiesenfeld (1981), using a flash photolysis
atomic absorption technique, find O-atoms to be the predominant photolysis
product, and report a quantum yield for Cl-atom production of less than
4%. Marinell~ and Johnston (1982b) report a quantum yield for N03
production at 249 nm between 0.45 and 0.85 with a most likely value of
0.55; they monitored N03 by tunable dye-laser absorption at 662 nm.
Margitan (1983a) used atomic resonance fluorescence detection of 0- and
Cl-atoms and finds the quantum yield at 266 and at 355 nm to be 0.9 :t 0.1
for Cl-atom production, and -0.1 for a-atom production, with no
discernible difference at the two wavelengths.
The preferred quantum yield values are 0.9 for the Cl + N03 chanel,
and a complementary value of 0.1 for the ° + ClONO channel. The
recommendation is based on Margitan (1983), whose direct study is the only
one with results at a wavelength longer than 290 nm, which is where
atmospheriC photodissociation will predominantly occur. The reason for
the discrepancy with the studies by Adler-Golden and Weisenfeld (1981) and
by Marinelli and Johnston (1982b) is almost surely that the rate constant
for Cl + ClN03 is much faster (two order of magnitude) than previously
thought (Margitan, 1983a; Kurylo ~ ru..., 1983a).
148
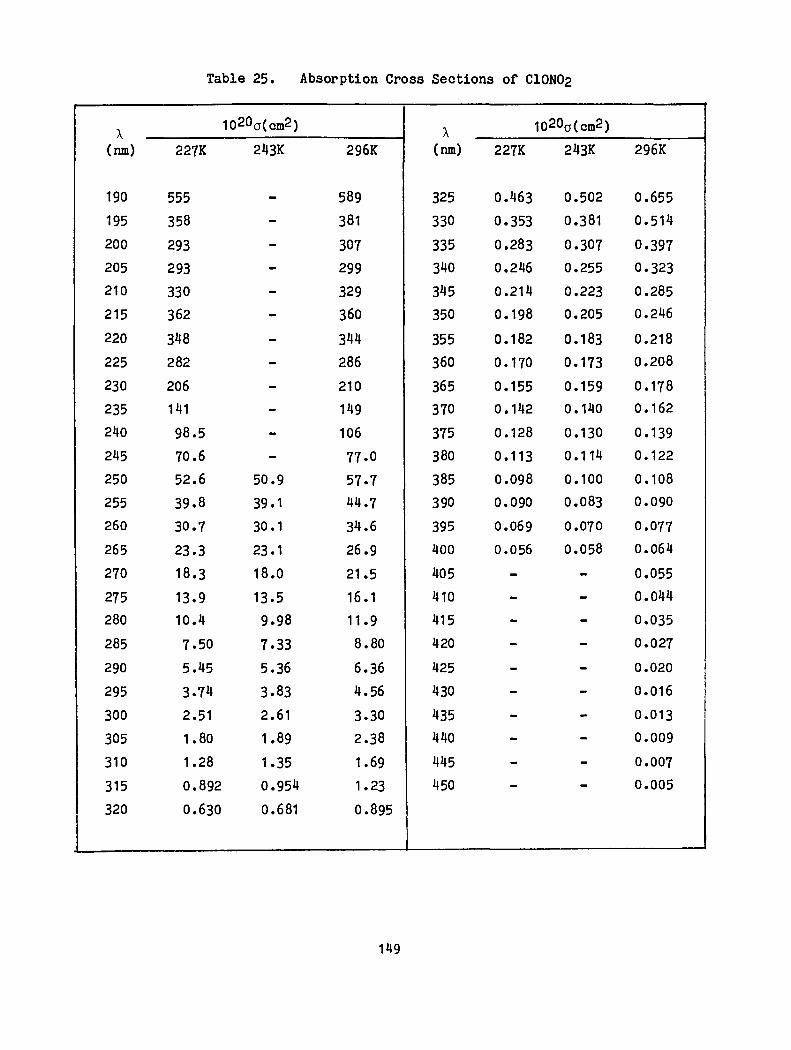
Table 25. Absorption Cross Sections of C10N02
A 102Ocr(cm2) A 102Ocr(cm2)
(nm) 227K 243K 296K (nm) 227K 243K 296K
190 555 - 589 325 0.463 0.502 0.655
195 358 - 381 330 0.353 0.381 0.514
200 293 - 307 335 0.283 0.307 0.397 205 293 - 299 340 0.246 0.255 0.323 210 330 - 329 345 0.214 0.223 0.285
215 362 - 360 350 0.198 0.205 0.246
220 348 - 344 355 0.182 0.183 0.218
225 282 - 286 360 0.170 0.173 0.208
230 206 - 210 365 0.155 0.159 0.178
235 141 - 149 370 0.142 0.140 0.162
240 98.5 - 106 375 0.128 0.130 0.139
245 70.6 - 77.0 380 0.113 0.114 0.122
250 52.6 50.9 57.7 385 0.098 0.100 0.108
255 39.8 39.1 44.7 390 0.090 0.083 0.090
260 30.7 30.1 34.6 395 0.069 0.070 0.077
265 23.3 23.1 26.9 400 0.056 0.058 0.064
270 18.3 18.0 21.5 405 - - 0.055
275 13.9 13.5 16.1 410 - - 0.044
280 10.4 9.98 11.9 415 - - 0.035
285 7.50 7.33 8.80 420 - - 0.027
290 5.45 5.36 6.36 425 - - 0.020
295 3.74 3.83 4.56 430 - - 0.016
300 2.51 2.61 3.30 435 - - 0.013
305 1.80 1.89 2.38 440 - - 0.009
310 1.28 1.35 1.69 445 - - 0.007
315 0.892 0.954 1.23 450 - - 0.005
320 0.630 0.681 0.895
149

HALOCARBON ABSORPTION CROSS SECTIONS AND QUANTUM YIELDS
The primary process in the photodissociation of chlorinated
hydrocarbons is well established: absorption of ultraviolet radiation in
the lowest frequency band is interpreted as an n-o* transition involving
excitation to a repulsive electronic state (antibonding in C-Cl), which
dissociates by breaking the carbon-chlorine bond (Majer and Simons, 1964).
As expected, the chlorofluoromethanes--which are just a particular type of
chlorinated hydrocarbons--behave in this fashion (Sandorfy, 1976). Hence,
the quantum yield for photodissociation is expected to be unity for these
compounds. There are several studies which show specifically that this is
the case for CF2Cl2, CFCl3 aand CCI4. These studies--which have been
reviewed in CODATA (1982)-also indicate that at shorter wavelengths two
halogen atoms can be released simultaneously in the primary process.
Several authors have investigated recently the absorption cross
sections for CCI 4 , CCl3F, CCI 2F2, CHCIF2 , and CH3CI--e.g., Hubrich.§.t. al.
(1977); Hubrich and Stuhl (1980); Vanlaethem-Meuree et sl. (1978a,b);
Green and Wayne (1976-1977)--and their results are in general in very good
agreement with our earlier recommendations. Tables 26, 27 and 28 list the
present recommendations for the cross sections of CCl4, CCl3F and CCl2F2
respectively; these data are given by the mean of the values reported by
various groups--those cited above as well as those referred to in earlier
evalua tions--as reviewed by CODATA (1982). For atmospheric
photodissociation calculations the change in the cross section values with
temperature is negligible for CCl4 and CFCl3; for CF2Cl2 the temperature
dependence is given by the expression at the bottom of Table 28.
The species CHCIF2, CH3CI and CH3CCI3'"are discussed individually;
their absorption cross sections are listed in Tables 29, 30 and 32,
respectively.
The absorption cross sections for various other halocarbons not
150

listed in this evaluation have been investigated recently. For CCIF3,
CCI2FCCIF2, CCIF2CCIF2 and CCIF2CF3 the values given by Hubrich and stuhl
(1980) at 298 K are in very good agreement with the earlier results of
Chou ~Al. (1978) and of Robbins (1977); Hubrich and Stuhl also report
values of 208 K for these species.
Absorption cross sections have also been measured recently for
several other halocarbons, including the following: CHCl2F by Hubrich ~
ale (1977); CHCI3 , CH2CI2, CH2CIF, CF3CH2CI, CH3CCIF2 and CH3CH2CI by
Hubrich and Stuhl (1980); CHCI3' CH3Br, CHFCI2' C2F4Br2' C2HCl3 and
C2H3Cl3 by Robbins (1977); CH2Cl2 and CHCl3 by Vanlaethem-Meuree ~ ale
(1978a); CHCI2F, CCIF2CH2CI, CF3CH2CI, CF3CHCl2 and CH3CF2CI by Green and
Wayne (1976-1977); and CH3Br, CH2Br2' CBrF3' CBr2F2, CBrCIF2, CBrF2CBrF2
and CBrF2CF3 by Molina ~sl. (1982).
As before, the recommendation for the photodissociation quantum
yield value is unity for all these species.
151
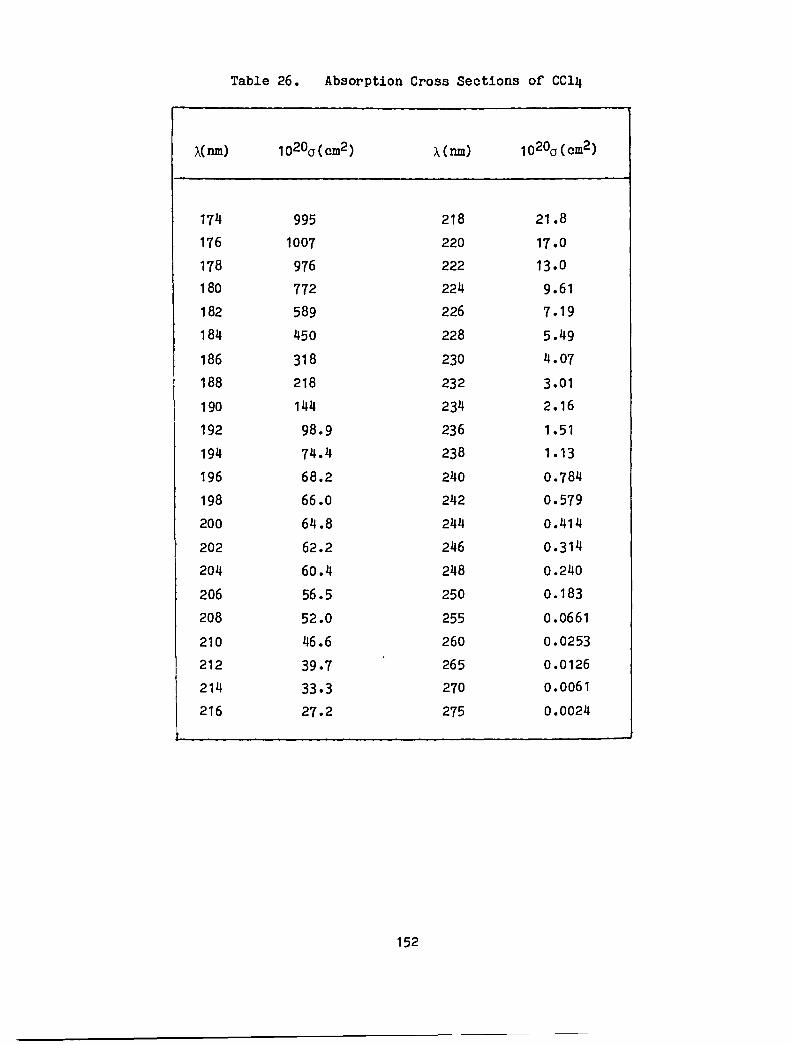
Table 26. Absorption Cross Sections of CCl4
A(nm) A(nm)
174 995 218 21.8
176 1007 220 17 .0
178 976 222 13.0
180 772 224 9.61
182 589 226 7.19
184 450 228 5.49
186 318 230 4.07
188 218 232 3.01
190 144 234 2.16
192 98.9 236 1.51
194 74.4 238 1.13
196 68.2 240 0.784
198 66.0 242 0.579
200 64.8 244 0.414
202 62.2 246 0.314
204 60.4 248 0.240
206 56.5 250 0.183
208 52.0 255 0.0661
210 46.6 260 0.0253
212 39.7 265 0.0126
214 33.3 270 0.0061
216 27.2 275 0.0024
152
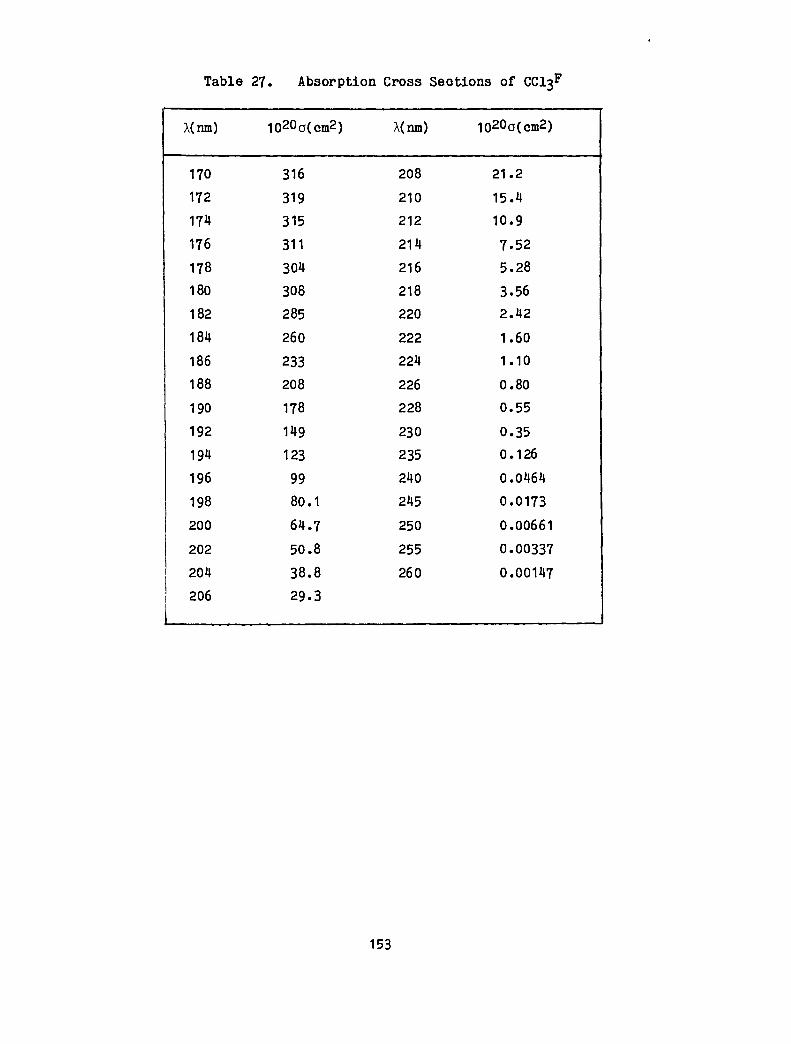
Table 27. Absorption Cross Sections of CCl3F
A(run) 102O a(cm2) A(run) 102Oa(cm2)
170 316 208 21.2
172 319 210 15.4
174 315 212 10.9
176 311 214 7.52
178 304 216 5.28
180 308 218 3.56
182 285 220 2.42
184 260 222 1.60
186 233 224 1.10
188 208 226 0.80
190 178 228 0.55
192 149 230 0.35
194 123 235 0.126
196 99 240 0.0464
198 80.1 245 0.0173
200 64.7 250 0.00661
202 50.8 255 0.00337
204 38.8 260 0.00147
206 29.3
153

Table 28. Absorption Cross Sections of CCl2F2
A(nm) 1 0200( cm2) A(nm) 102Oo(cm2)
170 124 200 8.84
172 151 202 5.60
174 171 204 3.47
176 183 206 2.16
178 189 208 1.32
180 173 210 0.80
182 157 212 0.48
184 137 214 0.29
186 104 216 0.18
188 84.1 218 0.12
190 62.8 220 0.068
192 44.5 225 0.022
194 30.6 230 0.0055
196 20.8 235 0.0016
198 13.2 240 0.00029
0T = 0298exp[4.1 x 10⁻⁴C\-184.9)(T-298)]
Where: 0298 cross section at 298K
nm
T temperature, Kelvin
154

CHClF2 + hv + products
The preferred absorption cross sections, listed in Table 29, are the
mean of the values reported by Robbins and stolarski (1976) and Chou et
gl, (1976), which are in excellent agreement with each other. Hubrich ~
Al. (1977) have reported cross sections for CHClF2 at 298 K and 208 K.
Their results indicate a significant temperature dependence for A > 200
nm, and their room temperature values are somewhat higher than those of
the former two groups.
Photolysis of CHClF 2 1S rather unimportant throughout the
atmosphere; reaction with OH radical is the dominant destruction process.
Table 29. Absorption Cross Sections of CHClF2
A(nm) 1020 o(cm2)
174 5.94
176 4.06
178 2.85
180 1.99
182 1.30
184 0.825
186 0.476
188 0.339
190 0.235
192 0.157
194 0.100
196 0.070
198 0.039
200 0.026
202 0.022
204 0.013
155

CH3Cl + hv ~ products
The preferred absorption cross sections, listed in Table 30, are
those given by Vanlaethem-Meuree ll.al. (1978b). These values are in
very good agreement with those reported by Robbins (1976) at 298 K, as
well as with those given by Hubrich ~.S!l.. (1977) at 298 K and 208 K, if
the temperature trend is taken into consideration.
Table 30. Absorption Cross Sections of CH3Cl
102Oa(cm2) A
(run) 296 K 279 K 255 K
186 24.7 24.7 24.7
188 17 .5 17 .5 17 .5
190 12.7 12.7 12.7
192 8.86 8.86 8.86
194 6.03 6.03 6.03
196 4.01 4.01 4.01
198 2.66 2.66 2.66
200 1.76 1.76 1.76
202 1.09 1.09 1.09
204 0.691 0.691 0.691
206 0.483 0.475 0.469
208 0.321 0.301 0.286
210 0.206 0.189 0.172
212 0.132 0.121 0.102
214 0.088 0.074 0.059
216 0.060 0.048 0.033
156

CC120 + h \) -+ products, CCIFO + h \) -+ products, and CF 20 + h \) -+ products
Table 31 shows the absorption cross sections of CC120 (phosgene) and
CFClO given by Chou ~ Al. (1977a), and of CF 20 taken from the work of
Molina and Molina (1982). The spectrum of CF20 shows considerable
structure; the values listed in Table 31 are averages over each 50-
wave number interval. The spectrum of CFCIO shows less structure, and the
CC1 20 spectrum is a continuum; its photodissociation quantum yield is
unity (Calvert and Pitts, 1966a).
The quantum yield for the photodissociation of CF20 at 206 nm
appears to be -0.25 (Molina and Molina, 1982); addi tional studies of the
quantum yield in the 200 nm region are required in order to establish the
atmospheric photodissociation rate.
157

Table 31. Absorption Cross Sections of CC120, CCIFO, and CF20
102Oa(cm2) >-
(nm) CC120 CCIFO CF20
184.9 204.0 - -186.0 189.0 15.6 5.5
187.8 137.0 14.0 4.8
189.6 117.0 13.4 4.2
191.4 93.7 12.9 3.7
193.2 69.7 12.7 3.1
195.1 52.5 12.5 2.6
197.0 41.0 12.4 2.1
199.0 31.8 12.3 1.6
201.0 25.0 12.0 1.3
203.0 20.4 11.7 0.95
205.1 16.9 11.2 0.69
207.3 15.1 10.5 0.50
209.4 13.4 9.7 0.34
211.6 12.2 9.0 0.23
213.9 11 .7 7.9 0.15
216.2 11.6 6.9 0.10
218.6 11.9 5.8 0.06
I 221.0 12.3 4.8 0.04
223.5 12.8 4.0 0.03 I 226.0
l 13.2 3.1 -
158

CH3CCl3 + hv ~ products
The absorption cross sections have been measured by Robbins (1977),
by Vanlaethem-Meuree et ale (1979) and by Hubrich and Stuhl (1980). These
latter authors corrected the results to account for the presence of a UV
absorbing stabilizer in their samples, a correction which might account
for the rather large discrepancy with the other measurements. The results
of Robbins (1977) and of Vanlaethem-Meuree et ~. (1979) are in good
agreement. The recommended values are taken from this latter work (which
reports values at 210 K, 230 K, 250 K, 270 K and 295 K, every 2 nm, and in
a separate table at wavelengths corresponding to the wavenumber intervals
generally used in stratospheric photodissociation calculations). Table 32
lists the values at 210 K, 250 K and 295 K, every 5 nm; the odd wavelength
values were computed by linear interpolation.
159

Table 32. Absorption Cross Sections of CH3CC13
A 10200 (cm2) (nm)
295K 250K 210K
185 265 265 265
190 192 192 192
195 129 129 129
200 81.0 81.0 81.0
205 46.0 44.0 42.3
210 24.0 21.6 19.8
215 10.3 8.67 7.47
220 4.15 3.42 2.90
225 1.76 1.28 0.97
230 0.700 0.470 0.330
235 0.282 0.152 0.088
240 0.102 0.048 0.024
160

BrO + hv ~ Br + 0
The BrO radical has a banded spectrum in the 290-380 nm range, the
strongest absorption feature lying around 338 nm. The photodissociation
quantum yield in this wavelength range is expected to be unity due to
extensive predissociation.
The recommended absorption cross sections averaged over 5 nm
wavelength intervals are taken from the recent work of Cox ~ sl.. (1982),
and are listed in Table 33. These authors estimate a Bra lifetime against
atmospheric photodissociation of -20 seconds at the earth's surface, for a
solar zenith angle of 300 •
The earlier BrO cross section measurements were carried out mostly
around 338 nm, and have been reviewed by CODATA (1980; 1982).
161

Table 33. Absorption Cross Sections of BrO
A 1020 cr (cm2) (nm) average
300 - 305 200
305 - 310 259
310 - 315 454
315 - 320 391
320 - 325 600
325 - 330 753
330 - 335 628
335 - 340 589
340 - 345 515
345 - 350 399
350 - 355 228
355 - 360 172
360 - 365 161
365 - 370 92
370 - 375 51
162

BrON02 + hv + products
The bromine nitrate cross sections have been measured at room
temperature by Spencer and Rowland (1978) in the wavelength region 186-390
nm; their results are given in Table 34. The photolysis products are not
known.
Table 34. Absorption Cross Sections of BrON02
A 10200- A 10200-
(nm) (cm2) (nm) (cm2)
186 1500 280 29
190 1300 285 27
195 1000 290 24
200 720 295 22
205 430 300 19
210 320 305 18
215 270 310 15
220 240 315 14
225 210 320 12
230 190 325 11
235 170 330 10
240 130 335 9.5
245 100 340 8.7
250 78 345 8.5
255 61 350 7.7
260 48 360 6.2
265 39 370 4.9
270 34 380 4.0
275 31 390 2.8
163

HF + hv + H + F
The ultraviolet absorption spectrum of HF has been studied by Safary
~~. (1951). The onset of absorption occurs at A < 170 nm, so that
photodissociation of HF should be unimportant in the stratosphere.
164

H2CO + hv ~ H + HCO (¢1)
~ H2 + CO ( 4>2)
Bass ~ al. (1980) have recently measured the absorption cross
sections of formaldehyde with a resolution of 0.05 nm at 296 K and 223 K.
The cross sections have also been measured by Moortgat ~~. (1980; 1983)
with a resolution of 0.5 nm in the 210-360 K temperature range; their
values are -30% larger than those of Bass ~.al. for wavelengths longer
than 300 nm. The recommended cross section values, listed in Table 35,
are the mean of the two sets of data (as computed in CODATA, 1982).
The quantum yields have been reported with good agreement by
Horowitz and Calvert (1978), Clark~.al. (1978a), Tangllli. (1979),
Moortgat and Warneck (1979), and Moortgat ~ 9J... (1980; 1983). The
recommended values listed in Table 35 are based on the results of all of
these investigators. The quantum yield 4>2 is pressure dependent for
wavelengths longer than 329 nm, and is given by the expression at the
bottom of Table 35, which is based on the values reported by Moortgat ~
.s.l.. (1980; 1983) for 300 K.
Additional work is needed to determine 4>1 and the cross sections
around 330 nm, which is the important wavelength region for atmospheric
photodissociation of CH20 to yield H + HCO; only a few scattered
measurements of 4>1 have been carried out around this wavelength. At
present the recommendation for the 320-340 nm wavelength interval is to
calculate 4>1 by linear interpolation assuming a value of 4>1 = 0.62 at 320
nm and 4> 1 = 0 at 340 nm.
165

Table 35. Absorption Cross Sections and Quantum Yields for
Photolysis of CH20.
10200 ( cm2) A <1>1 <1>2
(om) 290 K 220 K I
(H + HCO) (H2 + CO) ,
240 0.03 0.08 ! 0.21 0.42
250 0.13 0.08 I 0.24 0.46
260 0.47 0.47 , I 0.30 0.48
270 0.86 0.85 I 0.40 0.46
280 1.86 1.93 I 0.59 0.35 , 290 2.51 2.47 I 0.71 0.26
I 300 2.62 2.58 I 0.78 0.22
310 2.45 2.40 I 0.77 0.23
320 1.85 1.71 0.62 0.38
330 1.76 1.54 0.31 0.80 ,
0.69· 340 1.18 1.10 l 0
350 0.42 0.39 0 0.40·
360 0.06 0.02 0 0.12·
1
Note: The values are averaged for 10 om intervals centered on
indicated wavelength •
• at p = 760 torr
For A > 329 om, <1>2 is given by the following expression:
1 - exp(112.8-0.347A) p A-329
1 + 760 (364-A)
nm
P : torr
166

CH300H + hv ~ products
Molina and Arguello (1979) have measured the absorption cross
sections of CH300H vapor. Their results are listed in Table 36.
Table 36. Absorption Cross Sections of CH300H
A 10200 A 10200 A 10200
(nm) (cm2) (nm) (cm2) (nm) (cm2)
210 37.5 260 3.8 310 0.34
220 22.0 270 2.5 320 0.19
230 13.8 280 1.5 330 0.11
240 8.8 290 0.90 340 0.06
250 5.8 300 0.58 350 0.04
167

HCN + hv ~ products and CH3CN + hv ~ products
Herzberg and Innes (1957) have studied the spectroscopy of hydrogen
cyanide, HCN, which starts absorbing weakly at A < 190 nm. McElcheran ~
sl. (1958) have reported the spectrum of methyl cyanide, CH3CN; the first
absorption band appears at A < 216 nm.
The solar photodissociation rates for these molecules should be
rather small, even in the upper stratosphere; estimates of these rates
would require additional studies of the absorption cross sections and
quantum yields in the 200 nm regio~
168

S02 + hv ~ products
The UV absorption spectrum of S02 is highly structured, with a very
weak absorption in the 340-390 nm region, a weak absorption in the 260-340
nm, and a strong absorption extending from 180 to 235 nm; the threshold
wavelength for photodissociation is -220 nm. The atmospheric
photochemistry of S02 has been reviewed by Heicklen llAl. (1980) and by
Calvert and Stockwell (1983). Direct photooxidation at wavelengths longer
than -300 nm by way of the electronically excited states of S02 appears to
be relatively unimportant.
169

ocs + hv ~ CO + S
The absorption cross sections of OCS have been measured by Chou ~
sl.. (1979) between 186 and 226 nm, at 296,251 and 232 K (the results are
unpublished); by Breckenridge and Taube (1970), who presented their 298 K
results in graphical form, between 200 and 260 nm; by Rudolph and Inn
(1981) between 200 and -300 nm (see also Turco ~ li., 1981), at 297 and
195 K; by Leroy lisl.. (1981) at 294 K, between 210 and 260 nm, using
photographic plates; and by Molina ~ li. (1981) between 180 and 300 nm,
at 295 and 225 K. The results are in good agreement in the regions of
overlap, except for A > 280 nm, where the cross section values reported by
Rudolph and Inn (1981) are significantly larger than those reported by
Molina li lie (1981). The latter authors concluded that solar
photodissociation of OCS in the troposphere occurs only to a negligible
extent.
The recommended cross sections, given in Table 37, are taken from
Molinalisl.. (1981). (The original publication also lists a table with
cross sections values averaged over 1 nm intervals, between 185 and 300
run) •
The recommended quantum yield for photodissociation J.S 0.72. This
value is taken from the work of Rudolph and Inn (1981), who measured the
quantum yield for CO production in the 220-254 nm range.
170

Table 37. Absorption Cross Seotions of OCS
A. 1020a(om2)
A. 1020 aCom2)
(nm) (nm)
295 K 225 K 295 K 225 K
186.1 18.9 13.0 228.6 26.8 23.7
187.8 8.33 5.63 231.2 22.1 18.8
189.6 3.75 2.50 233.9 17 .1 14.0
191.4 2.21 1.61 236.7 12.5 9.72
193.2 1.79 1.53 239.5 8.54 6.24
195.1 1.94 1.84 242.5 5.61 3.89
197.0 2.48 2.44 245.4 3.51 2.29
199.0 3.30 3.30 248.5 2.11 1.29
201.0 4.48 4.50 251.6 1.21 0.679
203.1 6.12 6.17 254.6 0.674 0.353
205.1 8.19 8.27 258.1 0.361 0.178
207.3 10.8 10.9 261.4 0.193 0.0900
209.4 14.1 14.2 264.9 0.0941 0.0419
211.6 17 .6 17.6 268.5 0.0486 0.0199
213.9 21.8 21.8 272.1 0.0248 0.0101
216.2 25.5 25.3 275.9 0.0119 0.0048
218.6 28.2 27.7 279.7 0.0584 0.0021
221.5 30.5 29.4 283.7 0.0264 0.0009
223.5 31.9 29.5 287.8 0.0012 0.0005
226.0 30.2 27.4 292.0 0.0005 0.0002
296.3 0.0002 -
Photodissooiation quantum yield ~ = 0.72
_ 171

eS2 + hv + es + S
The eS2 absorption spectrum is rather complex. Its photochemistry
has been reviewed by Okabe (1978). There are two distinct regions in the
near UV spectrum: a strong absorption extending from 185 to 230 nm, and a
weaker one in the 290-380 nm range. The threshold wavelength for
photo dissociation is -280 nm.
The photooxidation of eS2 in the atmopshere has been discussed by
Wine ~ Ai. (1981d), who report that electronically excited eS2 may react
with 02 to yield eventually DeS.
172

REFERENCES
Ackerman, M., 1971, in Mesospheric Models and Related Experiments, G. Fiocco Ed., Reidel Publish. Co., Holland, pp. 149-159.
Adachi, H., and N. Basco, 1979, Chem. Phys. Lett. ~, p. 490.
Adler-Golden, S. M., and J. R. Wiesenfeld, 1981, Chem. Phys. Lett. Aa, p. 281.
Aleksandrov, E. N., V. S. Arutyunov, and S. N. Kozlov, 1981, Kinetics and Catalysis za, pp. 391-394.
Allen, M., and J. E. Frederick, 1982, J. Atmos. Sci. ~, pp. 2066-2075.
Amimoto, S. T., A. P. Force and J. R. Wiesenfeld, 1978, Chem. Phys. Lett • .6.Q., pp. 40-43.
Amimoto, S. T., A. P. Force, R. G. Gulotty, Jr. and J. R. Wiesenfeld, 1979, J. Chem. Phys. 11, pp. 3640-3647.
Amimoto, S. T., A. P. Force, J. R. Wiesenfeld and R. H. Young, 1980, J. Chem. Phys. 11, pp. 1244-1247.
Anastasi, C., and I. W. M. Smith, 1976, J. Chem. Soc., Faraday Trans. II 1.2.., pp. 1459-1468.
Anastasi, C., and I. W. M. Smith, 1978, J. Chem. Soc., Faraday Trans. II~, p. 1056.
Anastasi, C., I. W. M. Smith and D. A. Parkes, 1978, J. Chem. Soc., Faraday Trans. I~, pp. 1693-1701.
Anderson, J. G., and F. Kaufman, 1972, Chem. Phys. Lett. li, 375-379.
Anderson, J. G., and F. Kaufman, 1973, Chem. Phys. Lett. ~, 483-486.
Anderson, P. C., and M. J. Kurylo, 1979, J. Phys. Chem. ai, p. 2055.
Anderson, J. G., J. J. Margitan and F. Kaufman, 1974, J. Chem. Phys • .Q.Q., p. 3310.
Arnold, I., and F. J. Comes, 1979, J. Chem. Phys. &a, p. 231.
Arnold, I., F. J. Comes and G. K. Moortgat, 1977, Chem. Phys. ~, pp. 211-217.
Arrington, C. A., W. Brennen, G. P. Glass, J. V. Michael, and H. Niki, 1965, J. Chem. Phys. !i, p. 525.
Arutyunov, V. S., L. S. Popov, and A. M. Chaikin, 1976, Kinet. Katal. 11, p. 286.
173

Ashford, R. D., N. Basco and J. E. Hunt, 1978, Int. J. Chem. Kinet. 1.Q., PP. 1233-1244.
Ashmore, P. G., and H. S. Spencer, 1959, Trans. Faraday Soc. 52, p. 1868.
Atkinson, R., and J. N. Pitts, Jr., 1978, J. Chem. Phys. Qa, p. 3581.
Atkinson, R., D. A. Hansen and J. N. Pitts, Jr., 1975, J. Chem. Phys • .63., pp. 1703-1706.
Atkinson, R., R. A. Perry, and J. N. Pitts, Jr., 1977, J. Chem. Phys. ~, p. 1197.
Atkinson, R., R. A. Perry, and J. N. Pitts, Jr., 1978, Chem. Phys. Lett. 5!, p. 14.
Avramenko, L. I., and R. V. Kolesnikova, 1961, Bull. Acad. Sci. USSR Div. Chem. Sci., p. 545.
Bahta, A., R. Simonaitis, and J. Heicklen, 1982, J. Phys. Chem. ~, p. 1849.
Balakhnin, V. P., V. I. Egorov and E. I. Intezarova, 1971, Kinetics and Catalysis la, p. 299.
Baldwin, A. C., 1982, "Thermochemistry of Peroxides," in Chemistry of Functional Groups Cede S. Patai) John Wiley and Sons, Inc., New York.
Baldwin, A. C., and D. H. Golden, 1978a, Chem. Phys. Lett. 52, p. 350.
Baldwin, A. C., and D. H. Golden, 1978b, J. Phys. Chem. ~, p. 644.
Ballash, N. H., and D. A. Armstrong, 1974, Spectrochim. Acta .3.QA, pp. 941-944.
Barker, J. R., S. W. Benson and D. M. Golden, 1977, Int. J. Chem. Kinet • .9., p. 31.
Barnes, I., V. Bastian, K. H. Becker, E. H. Fink, and F. Zabel, 1981, Chem. Phys. Lett. ai, pp. 459-464.
Barnes, I., K. H. Becker, E. H. Fink, A. Reimer, F. Zabel, and H. Niki, 1983, Int. J. Chem. Kinet. 12, pp. 631-645.
Basco, N., and S. K. Dogra, 1971a, Proc. Roy. Soc. A. 321, p. 401.
Basco, N., and S. K. Dogra, 1971b, Proc. Roy. Soc. A. 321, p. 417.
Basco, N., and S. K. Dogra, 1971c, Proc. Roy. Soc. A. 321, p. 29
Basco, N., D. G. L. James and F. C. James, 1972, Int. J. Chem. Kinet • .i, p. 129.
174

Bass, A. M., and A. E. Ledford, 1978, pp. 282-284 in n12th Informal Conference on Photochemistry,n M. J. Kurylo and W. Braun, Eds., NBS, Spec. Pub!. 526.
Bass, A. M., and R. J. Paur, 1981, Upper Atmos. Progr. Bull. ~, FAA, Washington, D.C., pp. 9-10.
Bass, A. M., A. E. Ledford and A. H. Laufer, 1976, J. Res. NBS ~, pP. 143-166.
Bass, A. M., L. C. Glasgow, C. Miller, J. P. Jesson, and D. L. Filken, 1980, Planet. Space Sci. 2a, p. 675.
Batt, L., and G. N. Robinson, 1979, Int. J. Chem. Kinet. 11, p. 1045.
Baulch, D. L., R. A. Cox, R. F. Hampson, Jr., J. A. Kerr, J. Troe and R. T. Watson, 1980, J. Phys. and Chem. Ref. Data~, p. 295.
Baulch, D. L., R. A. Cox, R. F. Hampson, Jr., J. A. Kerr, J. Troe, and R. T. Watson, 1982, J. Phys. and Chem. Ref. Data 11, pp. 327-496.
Becker, K. H., W. Groth and D. Z. Kley, 1969, Z. Naturforsch Aai, p. 1280.
Becker, K. H., U. Schurath and H. Seitz, 1974, Int. J. Chem. Kinet. i p. 725.
Bemand, P. P., M. A. A. Clyne and R. T. Watson, 1973, J. Chem. Soc., Faraday Trans. I. ~, p. 1356.
Bemand, P. P., M. A. A. Clyne and R. T. Watson, 1974, J. Chem. Soc., Faraday Trans. II 1Q, p. 564.
Benson, S. W., 1976, Thermochemical Kinetics, John Wiley and Sons, Inc., New York, p. 292.
Benson, S. W., F. R. Cruickshank and R. Shaw, 1969, Int. J. Chem. Kinet. ~, p. 29.
Bhaskaran, K. A., P. Frank and Th. Just, 1979, paper presented at 12th International Shock Tube Symposium, Jerusalem.
Biaume, F., 1973, J. Photochem. Z, p. 139.
Biermann, H. W., C. Zetzsch and F. Stuhl, 1978, Ber. Bunsenges. Phys. Chem • .82., 633.
Biermann, H. W., G. W. Harris, and J. N. Pitts, Jr., 1982, J. Phys. Chem • .8..6., pp. 2958-2964.
Birks, J. W., B. Shoemaker, T. J. Leck and D. M. Hinton, 1976, J. Chem. Phys. ~, p. 5181.
175

Birks, J. W., B. Schoemaker, T. J. Leck, R. A. Borders and L. J. Hart, 1977, J. Chem. Phys. ~, p. 4591.
Black, G., R. L. Sharpless, and T. G. Slanger, 1982a, Chem. Phys. Lett • .9.Q., pp. 55-58.
Black, G., R. L. Sharpless, and T. G. Slanger, 1982b, Chem. Phys. Lett • .9.3" pp. 598-602.
Borders, R. A., and J. W. Birks, 1982, J. Phys. Chem. ~, pp. 3295-3302.
Bozzelli, J. W., 1973, Ph.D. Thesis, Dept. of Chemistry, Princeton University, (Diss. Abstr. Int. B, 34(2), p. 608).
Bradley, J. N., W. Hack, K. Hoyermann, and H. Gg. Wagner, 1973, J. Chem. Soc., Faraday Trans. I. ~, p. 1889.
Braithwaite, M., and S. R. Leone, 1978, J. Chem. Phys. ~, pp. 839-845.
Braun, M., A. Hofzumahaus, and F. Stuhl, 1982, Ber. Bunsenges. Phys. Chem. ~, pp. 597-602.
Breckenridge, W. H., and H. Taube, 1970, J. Chem. Phys. 5Z, pp. 1713-1715.
Breckenridge, W. H., and T. A. Miller, 1972, J. Chem. Phys. Si, p. 465.
Breen, J. E., and G. P. Glass, 1971, Int. J. Chem. Kinet. ~, p. 145.
Brock, J. C., and R. T. Watson, 1980a, Chem. Phys. ~, pp. 477-484.
Brock, J. C., and R. T. Watson, 1980b, Chem. Phys. Lett. 11, pp. 371-375.
Brock, J. C., and R. T. Watson, 1980c, private communication.
Brown, J. M., and B. A. Thrush, 1967, Trans. Faraday Soc. ~, p. 630.
Brown, R. D., and I. W. M. Smith, 1975, Int. J. Chem. Kinet. y, p. 301.
Bulatov, V. P., A. A. Buloyan, S .G. Cheskis, M. Z. Kozliner, o. M. Sarkisov, and A. I. Trostin, 1980, Chem. Phys. Lett. li, p. 288.
Burrows, J. P., and R. A. Cox, 1981, J. Chem. Soc., Faraday Trans. I XL, p. 2465.
Burrows, J. P., G. W. Harris and B. A. Thrush, 1977, Nature 2.fJ..1.., pP. 233-234.
Burrows, J. P., D. I. Cliff, G. W. Harris, B. A. Thrush and J. P •. T. Wilkinson, 1979, Proc. Roy. Soc. (London) A3Qa, p. 463-481.
Burrows, J. P., R. A. Cox and R. G. Derwent, 1981, J. Photochem. 1.6., pP. 147-168.
176

Burrows, J. P., T. J. Wallington, and R. P. Wayne, 1983, J. Chem. Soc., Faraday Trans. II, ~, PP. 111-122.
Buss, R. J., R. J. Baseman, G. He, and Y. T. Lee, 1981, J. Photochem. 11, p. 389.
Butler, P. J. D., and L. F. Phillips, 1983, J. Phys. Chem. ~, pp. 183-184.
Butler, R., I. J. Solomon and A. Snelson, 1978, Chem. Phys. Lett. 5!l, p. 19.
Callear, A. B., and I. W. M. Smith, 1967, Nature 211, p. 382.
Call ear, A. B., and R. E. M. Hedges, 1970, Trans. Faraday Soc. Qi, p. 605.
Calvert, J. G., and J. N. Pitts, 1966a, Photochemistry, John Wiley & Sons, Inc., New York, pp. 230-231.
Calvert, J. G., and J. N. Pitts, 1966b, ~ cit., p. 783.
Calvert, J. G., and W. R. Stockwell, 1983, in Acid Precipitation: S02' NO and N02 Oxidation Mechanisms: Atmospheric Considerations, Ann Arbor Sci. Publishers, Ann Arbor, Michigan, in press.
Calvert, J. G., F. Su, J. W. Bottenheim and O. P. Strausz, 1978, Atmos. Environ. la, p. 197.
Campbell, I. M., D. F. McLaughlin and B. J. Handy, 1976, Chem. Phys. Lett., ,3lt, p. 362.
Carter, R. 0., and L. Andrews, 1981, J. Phys. Chem • .85., p.2351.
Casavecchia, P., R. J. Buss, S. J. Sibener and Y. T. Lee, 1980, J. Chem. Phys. 13., pp. 6351-6332.
Chang, J. S., and F. Kaufman, 1977a, J. Chem. Phys. Qi, p. 4989.
Chang, J. S., and F. Kaufman, 1977b, Geophys. Res. Lett. ll, p. 192.
Chang, J. S. , and F. Kaufman, 1978, J. Phys. Chem. .82.., pp. 1683-1686 •
Chang, J. S. , and J. R. Barker, 1979, J. Phys. Chem • .81l, p. 3059.
Chang, J. S., A. C. Baldwin and D. M. Golden, 1979, J. Chem. Phys. ll, p. 2021.
Chang, J. S., J. R. Barker, J. E. Davenport and D. M. Golden, 1979, Chem. Phys. Lett. bQ, pP. 385-390.
Chang, J. S., P. L. Trevor, and J. R. Barker, 1981, Int. J. Chem. Kinet. 11, pp. 1151-1161.
177

Chapman, C. J., and R. P. Wayne, 1974, Int. J. Chem. Kinet • .6., pp. 617-630.
Chen, H. L., D. W. Trainor, R. E. Cender, and W. T. Fyfe, 1977, J. Chem. Phys • .6..6., p. 5513.
Cheskis, S. G., and 0. M. Sarkisov, 1979, Chem. Phys. Lett. Qa, p. 72.
Chou, C. C., H. Vera-Ruiz, K. Moe and F. S. Rowland, 1976, unpublished work, University of California, Irvine.
Chou, C. C., G. Crescentini, H. Vera-Ruiz, W. S. Smith and F. S. Rowland, 1977a, "Stratospheric Photochemistry of CF20, CClFO and CCl20," 173rd American Chemical Society National Meeting, New Orleans.
Chou, C. C., W. S. Smith, H. Vera-Ruiz, K. Moe, G. Crescentini, M. J. Molina and F. S. Rowland, 1977b, J. Phys. Chem. at, pp. 286-290.
Chou, C. C., R. J. Milstein, W. S. Smith, H. Vera-Ruiz, M. J. Molina and F. S. Rowland, 1978, J. Phys. Chem. Ba, p. 1.
Chou, C. C., H. Vera-Ruiz and F. S. Rowland, 1979, quoted in JPL Publication 79-27, Jet Propulsion Laboratory, California, p. 23.
Clark, I. D., and R. P. Wayne, 1970, Proc. Roy. Soc. A31.6.. p. 539.
Clark, J. H., C. B. Moore and N. S. Nogar, 1978a, J. Chem. Phys. Qa, p. 1264.
Clark, J. H., C. B. Moore and J. B. Reilly, 1978b, Int. J. Chem. Kinet • .1Q., p. 427.
Clark, R. H., D. Husain and J. Y. Jezequel, 1982, J. Photochem. la, pp. 39-46.
Clark, T. C., M. A. A. Clyne and D. H. Stedman, 1966, Trans. Faraday Soc • .Qa, p. 3354.
Clemo, A. R., F. E. Davidson, G. L. Duncan, and R. Grice, 1981, Chem. Phys. Lett. ~, pp. 509-511.
Clough, P. N., and B. A. Thrush, 1967, Trans. Faraday Soc. Qi, p. 915.
Clyne, M. A. A. , 1963, 9th SymP. Combust. (Academic Press) , p. 211.
Clyne, M. A. A., and B. A. Thrush, 1961, Proc. Roy. Soc. .A2.6.1., p. 259.
Clyne, M. A. A., and J. A. Coxon, 1968, Proc. Roy. Soc. A., .3.Q3., p. 207.
Clyne, M. A. A., and H. W. Cruse, 1970a, Trans. Faraday Soc. .6..6., p • 2214 •
Clyne, M. A. A., and H. W. Cruse, 1970b, Trans. Faraday Soc. .6..6., p. 2227.
178

Clyne, M. A. A., and H. W. Cruse, 1972, J. Cham. Soc., Faraday Trans. II .6.8., p. 1281.
Clyne, M. A. A., and R. F. Walker, 1973, J. Chem. Soc., Faraday Trans. I~. p. 1547.
Clyne, M. A. A., and S. Down, 1974, J. Chem. Soc., Faraday Trans. II 1Jl, pp. 253-266.
Clyne, M. A. A., and R. T. Watson, 1974a, J. Chem. Soc., Faraday Trans. I. 1Q, p. 2250.
Clyne, M. A. A., and R. T. Watson, 1974b, J. Chem. Soc., Faraday Trans. I 1Jl, p. 1109.
Clyne, M. A. A., and I. S. McDermid, 1975, J. Chem. Soc., Faraday Trans. I li, p. 2189.
Clyne, M. A. A., and L. W. Townsend, 1975, Int. J. Chem. Kinet. Symp. 1, pp. 73-84.
Clyne, M. A. A., and R. T. Watson, 1975, J. Chem. Soc., Faraday Trans. Ill, p. 336.
Clyne, M. A. A., and W. S. Nip, 1976a, J. Chem. Soc., Faraday Trans. II 1..2.., p. 838.
Clyne, M. A. A., and W. S. Nip, 1976b, J. Chem. Soc., Faraday Trans. I 1..2.., p. 2211.
Clyne, M. A. A., and P. Monkhouse, 1977, J. Chem. Soc., Faraday Trans. II ll, pp. 298-309.
Clyne, M. A. A., and R. T. Watson, 1977, J. Chem. Soc., Faraday Trans. I ll, p. 1169.
Clyne, M. A. A., and P. M. Holt, 1979a, J. Chem. Soc., Faraday Trans. II ~, pp. 564-581.
Clyne, M. A. A., and P. M. Holt, 1979b, J. Chem. Soc., Faraday Trans. II ~, pp. 582-591.
Clyne, M. A. A., and P. D. Whitefield, 1979, J. Chem. Soc. Faraday Trans. II ~, p. 1327.
Clyne, M. A. A., and A. J. MacRobert, 1980, Int. J. Chem. Kinet. 1.2., pp. 79-96.
Clyne, M. A. A., and A. J. MacRobert, 1981, Int. J. Chem. Kinet. ~, pp. 187-197.
Clyne, M. A. A., and Y. Ono, 1982, Chem. Phys. ~, PP. 381-388.
179

Clyne, M. A. A., and Y. Ono, 1983, Cham. Phys. Lett. g!, pp. 597-602.
Clyne, M. A. A., B. A. Thrush, and R. P. Wayne, 1964, Trans. Faraday Soc • .6.Q, p. 359.
Clyne, M. A. A., C. J. Halstead, and B. A. Thrush, 1966, Proc. Soc. London, Sere A, ~, p. 355.
Clyne, M. A. A., D. J. McKenney, and R. F. Walker, 1973, Can. J. Chem. 51, p. 3596.
Clyne, M. A. A., P. B. Monkhouse, and L. W. Townsend, 1976, Int. J. Chem. Kinet. a, p. 425.
CODATA, 1980, Evaluated Kinetic and Photochemical Data for Atmospheric Chemistry. J. Phys. Cham. Ref. Data~, pp. 295-471.
CODATA, 1982, Evaluated Kinetic and Photochemicall Data for Atmospheric Chemistry: Supplement I. J. Phys. Cham. Ref. Data 11, pp. 327-496.
Connell, P. S., and C. J. Howard, 1983, manuscript in preparation.
Connell, P. S., and H. S. Johnston, 1979, Geophys. Res. Lett. ~, p. 553.
Cook, J. L., C. A. Ennis, T. J. Leck, and J. W. Birks, 1981a, J. Cham. Phys. ft, p. 545.
Cook, J. L., C. A. Ennis, T. J. Leck, and J. W. Birks, 1981b, J. Chem. Phys. 15., p. 497.
Cox, R. A., 1975, Int. J. Chem. Kinet., SymP. ~, p. 379.
Cox, R. A., 1980, Int. J. Chem. Kinet. la, p. 649.
Cox, R. A., and R. G. Derwent, 1977, J. Chem. Soc., Faraday Trans. I .73., p. 272.
Cox, R. A., and J. P. Burrows, 1979, J. Phys. Chem. al, p. 2560-2568.
Cox, R. A. , and R. Lewis, 1979, 2649.
J. Chem. Soc. , Faraday Trans. I 15.., p.
Cox, R. A., and R. Patrick, 1979, Int. J. Chem. Kinet. 11, p. 635.
Cox, R. A., and G. Tyndall, 1979, Chem. Phys. Lett. ~, p. 357.
Cox, R. A., and D. Sheppard, 1980, Nature za!, pp. 330-331.
Cox, R. A., and G. S. Tyndall, 1980, J. Chem. Soc., Faraday Trans. II, ~, p.
Cox, R. A., and D. W. Sheppard, 1982, J. Chem. Soc., Faraday Trans. II, lA, pp. 1383-1389.
180
153.

Cox, R. A., R. G. Derwent, and P. M. Holt, 1975, Chemosphere~, p. 201.
Cox, R. A., R. G. Derwent, A. E. J. Eggleton, and J. E. Lovelock, 1976a, Atmos. Environ. ~, p. 305.
Cox, R. A., R. G. Derwent, and P. M. Holt, 1976b, J. Chem. Soc., Faraday Trans. I la, p. 2031.
Cox, R. A., R. G. Derwent, A. E. J. Eggleton and H. J. Reid, 1979, J. Chem. Soc., Faraday, Trans. I 12, pp. 1648-1666.
Cox, R. A., R. G. Derwent, S. V. Kearsey, L. Batt, and K. G. Patrick, 1980, J. Photochem. 11, p. 149.
Cox, R. A., J. P. Burrows, and T. J. Wallington, 1981, Chem. Phys. Lett • .a!l, p. 217-221.
Cox, R. A., D. W. Sheppard, and M. P. Stevens, 1982, J. Photochem. ~, pp. 189-207.
Cox, R. A., J. P. Burrows, and G. B. Coker, 1983, manuscript in preparation.
Coxon, J. A., W. E. Jones and D. A. Ramsey, 1976, 12th International Symposium on Free Radicals, Laguna Beach, California.
Cupitt, L. T. and G. P. Glass, 1975, Int. J. Chem. Kinet., Symp. 1, pp. 39-50.
Dasch, W., K.-H. Steinberg, and R. N. Schindler, 1981, Ber. Bunsenges, Phys. Chem., ~, p. 611.
Davenport, J. E., 1978, "Determination of N02 Photolysis Parameters for Stratospheric Modeling," Report No. FAA-EQ-78-14.
Davenport, J. E., B. Ridley, H. I. Schiff, and K. H. Welge, 1972, J. Chem. Soc., Faraday Discussions, 21, pp. 230-231.
Davidson, F. E., A. R. Clemo, G. L. Duncan, R. J. Browett, J. H. Hobson, and R. Grice, 1982, Molec. Phys. ~, pp. 33-40.
Davidson, J. A., H. I. Schiff, G. E. Strei t, J. R. McAfee, A. L. Schmeltekopf, and C. J. Howard, 1977, J. Chem. Phys. QY, pp. 5021-5025.
Davidson, J. A., H. I. Schiff, T. J. Brown, and C. J. Howard, 1978, J. Chem. Phys. ~, pp. 4277-4279.
Davidson, J. A., C. J. Howard, H. I. Schiff, and F. C. Fehsenfeld, 1979, J. Chem. Phys. IQ, pp. 1697-1704.
Davis, D. D., W. Braun, and A. M. Bass, 1970, Int. J. Chem. Kinet. a, p. 101.
181

Davis, D. D., R. B. Klemm, and M. Pilling, 1972, Int. J. Chem. Kinet. !, PP. 367-382.
Davis, D. D., J. T. Herron, and R. E. Huie, 1973a, J. Chem. Phys • .s.a, p. 530.
Davis, D. D., W. Wong, and J. Lephardt, 1973b, Chem. Phys. Lett. 22., pp. 273-278.
Davis, D. D., S. Fisoher, and R. Sohiff, 1974a, J. Chem. Phys. ~, pp. 2213-2219.
Davis, D. D., J. Prusazoyk, M. Dwyer, and P. Kim., 1974b, J. Phys. Chem. 1.6., p. 1775.
Davis, D. D., W. Wong, and R. Sohiff, 19740, J. Phys. Chem. 1.B.., pp. 463-464.
Davis, D. D., S. Fischer, R. Schiff, R. T. Watson, and W. Bollinger, 1975, J. Chem. Phys. Al, p. 1707.
Davis, D. D., G. Machado, B. Conaway, Y. Oh, and R. T. Watson, 1976, J. Chem. Phys. ~, p. 1268.
DeMore, W. B., 1975, Int. J. Chem. Kinet., SymP. ~, pp. 273-279.
DeMore, W. B., 1979, J. Phys. Chem. ai, pp. 1113-1118.
DeMore, W. B., 1983, private oommunioation.
DeMore, W. B., 1981, results presented at 182nd National Meeting, Amerioan Chemioal Sooiety, New York, August, 1981.
DeMore, W. B., 1982, J. Phys. Chem. ~, pp. 121-126.
DeMore, W. B., and E. Tsohuikow-Roux, 1974, J. Phys. Chem. 1.B.., pp. 1447-1451.
DeMore, W. B., C. L. Lin, and S. Jaffe, 1976, "12th Informal Conferenoe on Photoohemistry", M. J. Kurylo and W. Braun, Eds., NBS Speo. publ. 526 (1978), pp. 287-289.
DeMore, W. B., L. J. Stief, F. Kaufman, D. M. Golden, R. F. Hampson, M. J. Kurylo, J. J. Margitan, M. J. Molina, and R. T. Watson, 1979, JPL Publioation 79-27, Jet Propulsion Laboratory, California Institute of Teohnology, Pasadena, California.
DeMore, W. B., D. M. Golden, F. R. Hampson, C. J. Howard, M. J. Kurylo, M. J. Molina, A. R. Ravishankara, and R. T. Watson, 1981, JPL Publication 81-3, Jet PropulSion Laboratory, California Institute of Technology, Pasadena, California.
182

DeMore, W. B., D. M. Golden, F. R. Hampson, C. J. Howard, M. J. Kurylo, M. J. Molina, A. R. Ravishankara, and R. T. Watson, 1982, JPL Publication 82-57, Jet Propulsion Laboratory, California Institute of Technology, Pasadena, California.
Dickerson, R. R., and D. H. stedman, 1980, Environ. Sci. Technol. 1!, p. 1261.
Ditchburn, R. W., and P. A. Young, 1962, J. Atmos. Terrest. Phys. a, pp. 127-139.
Dodonov, A. F., G. K. Lavrovskaya, I. I. Morozov, and V. L. Tal'Roze, 1971, Dokl. Adak. Nauk USSR, 198, 662; Dokl. Phys. Chem. (Engl. Trans), ill, p. 440.
Donovan, R. J., 1980, private communication.
Donovan, R. J., and D. J. Little, 1972, Chem. Phys. Lett. 11, p. 488.
Dreier, T., and J. Wolfrum, 1980, 18th International Symposium on Combustion, pp. 801-809.
Eibling, R. E., and M. Kaufman, 1983, Atmos. Environ. 11, pp. 429-431.
Fair, R. W., and B. A. Thrush, 1969, Trans. Faraday Soc. ~, p. 1557.
Fair, R. W., A. van Roodaelaar, and O. P. Strausz, 1971, Can. J. Chem. &9.., p. 1659.
Fairchild, C. E., E. J. Stone, and G. M. Lawrence, 1978, J. Chem. Phys. ~, pp. 3632-3638.
Farquharson, G. K., and R. H. Smith, 1980, Aust. J. Chem. ~, pp. 1425-1435.
Fasano, D. M., and N. S. Nogar, 1981, Int. J. Chem. Kinet. 11, p. 325.
Fasano, D. M., and N. S. Nogar, 1982, Chem. Phys. Lett. ga, pp. 411-414.
Fergusson, W. C., L. Slotin, and W. G. Style, 1936, Trans. Far. Soc. la, p. 956.
Finlayson-Pitts, B. J., and T. E. Kleindienst, 1979, J. Chem. Phys. 1.Q, pp. 4804-4806.
Finlayson-Pitts, B. J., T. E. Kleindienst, J. J. Ezell, and D. W. Toohey, 1981, J. Chem. Phys.1!, pp. 4533-4543.
Fletcher, I. S., and D. Husain, 1976a, Can. J. Chem. 5&, pp. 1765-1770.
Fletcher, I. S., and D. Husain, 1976b, J. Phys. Chem. BQ, pp. 1837-1840.
183

Fletcher, I. S., and D. Husain, 1978, J. Photochem. a, pp. 355-361.
Foon, R., and G. P. Reid, 1971, Trans. Faraday Soc. ~, p. 3513.
Foon, R., and M. Kaufman, 1975, Progress Reaction Kinetics a, p. 81.
Foon, R., G. LeBras, and J. Combourieu, 1979, C.R. Acad. Sci. Paris, Series C, aa,a, p. 241.
Force, A. P., and J. R. Wiesenfeld, 1981a, J. Phys. Chem. ~, pp. 782-785.
Force, A. P., and J. R. Wiesenfeld, 1981b, J. Chem. Phys. ~, pp. 1718-1723.
Fowles, M., D. N. Mitchell, J. W. L. Morgan, and R. P. Wayne, 1982, J. Chem. Soc., Faraday Trans. II, La, p. 1239.
Frederick, J. E., and R. D. Hudson, 1979, J. Atmos. Sci. ,3.6., pp. 737-745.
Frederick, J. E., and R. D. Hudson, 1980, J. Atmos. Sci. 31., pp. 1099-1106.
Frederick, J. E., and J. E. Mentall, 1982, Geophys. Res. Let t. .9" pp. 461-464.
Freeman, C. G., and L. F. Phillips, 1968, J. Phys. Chem. 72.., p. 3025.
Fujii, N., H. Miyama, and T. Asaba, 1981, Chem. Phys. Lett. ~, pp. 355-357.
Garvin, D., and H. P. Broida, 1963, 9th Symposium on Combustion, p. 678.
Gehring, M., K. Hoyermann, H. Schaeke, and J. Wolfrum, 1973, 14th Int. Symposium on Combustion, p. 99.
Gericke, K.-H., and F. J. Comes, 1981, Chem. Phys. Lett. at, pp. 218-222.
Gibson, G. E., and N. S. Bayliss, 1933, Phys. Rev. ~, p. 188.
Gill, R. J., W. D. Johnson, and G. H. Atkinson, 1981, Chem. Phys. 5a, p. 29.
Glaschick-Schimpf, I., A. Leiss, P. B. Monkhouse, U. Schurath, K. H. Becker, and E. H. Fink, 1979, Chem. Phys. Lett. ~, pp. 318-323.
Goodeve, C. F., and F. D. Richardson, 1937, Trans. Faraday. Soc. 33., pp. 453-457.
Goodeve, C. F., and S. Katz, 1939, Proc. Roy. Soc. llZA, pP. 432-444.
Gordon, R. J., and M. C. Lin, 1976, J. Chem. Phys. ,6lL, pp. 1058-1064.
Gordon, S., and W. A. Mulac, 1975, Int. J. Chem. Kinet., SymP. 1, p. 289.
Gordon, S. , W. Mulac, and P. Nangia, 1971, J. Phys. Chem. 15., p. 2087.
Gorse, R. A., and D. H. Volman, 1974, J. Photochem. ~, p. 115.
184

Graham, H. A., 1975, nphotochemistry of N03 and the Kinetics of the N205-03 System," Ph.D. Thesis, University of California, Berkeley.
Graham, H. A., and H. S. Johnston, 1974, J. Cham. Phys. ~, p. 4628.
Graham, H. A., and D. J. Gutman, 1977, J. Phys. Chem. at, p. 207.
Graham, R. A., and H. S. Johnston, 1978, J. Phys. Cham. ~, pp. 254-268.
Graham, H. A., A. M. Winer, and J. N. Pitts, Jr., 1977, Chem. Phys. Lett. 5.l., p • 2 15 •
Graham, H. A., A. M. Winer, and J. N. Pitts, Jr., 1978a, J. Chem. Phys. ~, pp. 4505-4510.
Graham, H. A., A. M. Winer, and J. N. Pitts, Jr., 1978b, Geophys. Hes. Lett. 5.., p. 909.
Graham, H. A., A. M. Winer, H. Atkinson, and J. N. Pitts, Jr., 1979, J. Phys. Cham. ~, p. 1563.
Green, H. G., and H. P. Wayne, 1976/77, J. Photocham. ~, pp. 375-377.
Greiner, N. H., 1969, J. Cham. Phys. 5..1, pp. 5049-5051.
Greiner, N. H., 1970a, J. Chem. Phys. 21, p. 1284.
Greiner, N. H., 1970b, J. Cham. Phys. 21, pp. 1070-1076.
Grimley, A. J., and P. L. Houston, 1980, J. Chem. Phys. 1..2., pp. 1471-1475.
Gutman, D., N. Sanders, and J. E. Butler, 1982, J. Phys. Chem. ~, p. 66.
Hack, W., K. Hoyermann, and H. Gg. Wagner, 1974, Beer. Bunsenges. Phys. Chem. 1.8., p. 386.
Hack, W., G. Mex., and H. G. Wagner, 1977, Ber. Bunsenges. Phys. Chem • .61., pp. 677-684.
Hack, W., A. W. Preuss, and H. Gg. Wagner, 1978a, Ber. Bunsenges. Phys. Chem. aa, pp. 1167-1171.
Hack, W., H. Gg. Wagner, and K. Hoyermann, 1978b, Bar. Bunsenges. Phys. Chem. aa, pp. 713-719.
Hack, W., A. W. Preuss, F. Temps and H. Gg. Wagner, 1979a, Ber. Bunsenges. Phys. Chem. ~, pp. 1275-1279.
Hack, W., H. Schacke, M. Schroter, and H. Gg. Wagner, 1979b, 17th Int. Symp. on Combustion, p. 505.
185

Hack, W., A. W. Preuss, H. Gg. Wagner, and K. Hoyermann, 1979c, Ber. Bunsenges. Phys. Chem. ai, pp. 212-217.
Hack, W., A. W. Preuss, F. Temps, H. Gg. Wagner, and K. Hoyermann, 1980, Int. J. Chem. Kinet. la, pp. 851-860.
Hack, W., O. Horie, and H. Gg. Wagner, 1981, Ber. Bunsenges. Phys. Chem. a5., p. 72
Hack, W., O. Horie, and H. Gg. Wagner, 1982, J. Phys Chem. ~, pp. 765-771.
Halstead, C. J. and B. A. Thrush, 1966, Proc. Roy. Soc. London, Sere A, ~, p. 380.
Hamilton, E. J., Jr., 1975, J. Chem. Phys. ~, pp. 3682-3683.
Hamilton, E. J., Jr., and R.-R. Lii, 1977, Int. J. Chem. Kinet.,9., pp. 875-885.
Hampson, R. F., Jr., and D. Garvin, Eds., 1977, Reaction.B..e.ll arul Photochemical ~ for Atmospheric Chemistry, National Bureau of Standards Special Publication 513, p. 33.
Hancock, G., W. Lang, M. Lenzi, and K. H. Welge, 1975, Chem. Phys. Lett. ll, p. 168.
Handwerk, V., and R. Zellner, 1978, Ber. Bunsenges. Phys. Chem • .az., pp. 1161-1166.
Harker, A. B., W. Ho, and J. J. Ratto, 1977, Chem. Phys. Lett • .5..Q., pp. 394-397.
Harris, G. W., and R. P. Wayne, 1975, J. Chem. Soc., Faraday Trans. I 11, p. 610.
Harris, G. W., T. E. Kleindienst, and J. N. Pitts, Jr., 1981, Chem. Phys. Lett. ~, pp. 479-483.
Hasson, V., and R. W. Nicholls, 1971, J. Phys. B.: Atom. Molec. Phys. ll, pp. 1789-1797.
Heicklen, J., N. Kelly, and K. Partymiller, 1980, Rev. Chem. Intermediates 3., pp. 315-404.
Heidner, R. F., III, and D. Husain, 1973, Int. J. Chem. Kinet. 2, pp. 819-831.
Heidner, R. F., III, D. Husain, and J. R. Weisenfeld, 1973, J. Chem. Soc., Faraday Trans. II n.9., pp. 927-938.
Heidner, R. F., J. F. Bott, C. E. Gardner, and J. E. Melzer, 1979, J. Chem. Phys. 1Q, p. 4509.
186

Heidner, H. F., J. F. Bott, C. E. Gardner, and J. E. Melzer, 1980, J. Chem. Phys. La, p. 4815.
Heneghan, S. P., P. A. Knoot, and S. W. Benson, 1981, Int. J. Chem. Kinet. il, p. 677.
Herman, J. H., and J. E. Mentall, 1982, J. Geophys. Hes. al, pp. 8967-8975.
Herron, J. T., and H. D. Penzhorn, 1969, J. Phys. Chem. 11, p. 191.
Herzberg, G., and K. K. Innes, 1957, Canad. J. Phys. ~, p. 842. Hislop, J. H., and H. P. Wayne, 1977, J.C.S. Faraday II, 11, pp. 506-516.
Hochanadel, C. J., J. A. Ghormley, and P. J. Ogren, 1972, J. Chem. Phys. ~, pp. 4426-4432.
Hochanadel, C. J., J. A. Ghormley, J. W. Boyle, and P. J. Ogren, 1977, J. Phys. Chem. at, p. 3.
Hochanadel, C. J., T. J. Sworski and P. J. Ogren, 1980, J. Phys. Chem • .B..!l., pp. 3274-3277.
Hollinden, G. A., M. J. Kurylo, and H. B. Timmons, 1970, J. Chem. Phys. ~, pp. 988-991.
Homann, K. H., G. Krome, and H. Gg. Wagner, 1968, Ber. Bunsenges. Phys. Chem. La, p. 998.
Homann, K. H., W. C. Solomon, J. Warnatz, H. Gg. Wagner, and C. Zetzsch, 1970, Ber. Bunsenges. Phys. Chem. ~, p. 585.
Horowitz, A., and J. G. Calvert, 1978, Int. J. Chem. Kinet. lQ, p. 805.
Horowitz, A., F. Su, and J. G. Calvert, 1978, Int. J. Chem. Kinet. 1.Q., p. 1099.
Howard, C. J., 1976, J. Chem. Phys. n2, p. 4771.
Howard, C. J., 1977, J. Chem. Phys. 2L, p. 5258.
Howard, C. J., 1979, J. Chem. Phys. 11, pp. 2352-2359.
Howard, C. J., 1980, J. Am. Chem. Soc. !Qa, pp. 6937-6941.
Howard, C. J., and K. M. Evenson, 1974, J. Chem. Phys. n1, p. 1943.
Howard, C., and K. M. Evenson, 1976a, J. Chem. Phys. ~, p. 197.
Howard, C. J., and K. M. Evenson, 1976b, J. Chem. Phys. ~, p. 4303.
Howard, C. J., and K. M. Evenson, 1977, Geophys. Hes. Lett. ~, pp. 437-440.
187

Howard, C. J., and B. J. Finlayson-Pitts, 1980, J. Chem. Phys. 1.2., pp. 3842-3843.
Howard, M. J., and I. W. M. Smith, 1980, Chem. Phys. Lett. ~, p. 40.
Howard, M. J., and I. W. M. Smith, 1981, J. Chem. Soc., Faraday Trans. II TI, Pp. 997-1008.
Hoyermann, K., H. G. Wagner, and J. Wolfrum, 1967, Z. Phys. Chem. 52, p. 72.
Hsu, D. S. Y., W. M. Shaub, T. L. Burks, and M. C. Lin, 1979, Chem. Phys • .!ill, pp.143-150.
Hubrich, C., and F. Stuhl, 1980, J. Photochem. la, pp. 93-107.
Hubrich, C., C. Zetzsch, and F. Stuhl, 1977, Ber. Bunsenges. Phys. Chem. at, p. 437.
Hudson, R. D., Editor, 1977, Chlorofluoromethanes .s.ru1.t.M Stratosphere, NASA Reference publication 1010.
Hudson, R. D., and L. J. Kieffer, 1975, "Absorption Cross Sections of Stratospheric Molecules," The Natural Stratosphere of 1974, ClAP Monograph 1, pp. (5-156)-(5-194).
Hudson, R. D., and E. I. Reed, Editors, 1979, The Stratosphere: Present and Future, NASA Reference publication 1049.
HUie, R. E., and J. T. Herron, 1974, Chem. Phys. Lett. 21, p. 411.
Hunten, D. M., R. P. Turco, and O. B. Toon, 1980, J. Atmos. Sci. 31, pp. 1342-1357.
Hunziker, H. E., H. Kneppe, and H. R. Wendt, 1981, J. Photochem. jy, p. 377.
Husain, D. and N. K. H. Slater, 1980, J. Chem. Soc., Faraday Trans. II 1..6.., Pp. 606-619.
Husain, D., J. M. C. Plane, and N. K. H. Slater, 1981, J. Chem. Soc. Faraday Trans. II 11, p. 1949.
Igoshin, V. I., L. V. Kulakov, and A. I. Nikitin, 1974, SOy. J. Quant. Electron. ~, p. 306.
Illies, A. J., and G. A. Takacs, 1976, J. Photochem. ~, pp. 35-42.
Inn, E. C. Y., 1975, Atmospheric Sciences 3a, p. 2375.
Inoue, G., and H. Akimoto, 1981, J. Chem. Phys. ~, pp. 425-433.
Iyer, R. S., and F. S. Rowland, 1980, Geophys. Res. Lett. 7.., pp. 797-800.
188

Jaffe, R. L., and S. R. Langhoff, 1978, J. Chem. Phys. ~, p. 1638.
Jaffe, S., and W. K. Mainquist, 1980, J. Phys. Chem. ~, p. 3277.
James, G. S. and G. P. Glass, 1970, J. Chem. Phys. SQ, p. 2268.
Jayanty, R. K. M., R. Simonai tis, and J. Heicklen, 1976, J. Phys. Chem • .8.Q., p. 443.
Jeong, K. M. , and F. Kaufman, 1979, Geophys. Res. Lett. ,6,., pp. 757-759.
Jeong, K. M. , and F. Kaufman, 1982, J. Phys. Chem., .6.6.., pp. 1808-1815.
Johnston, H. S., and R. Graham, 1973, J. Chem. Phys. TI, p. 62.
Johnston, H. S., and R. Graham, 1974, Can. J. Chem. 52., pp. 1415-1423.
Johnston, H. S., E. D. Morris, Jr., and J. Van den Bogaerde, 1969, J. Am. Chem. Soc. .91., p. 7712.
Johnston, H. S., S. Chang, and G. Whitten, 1974, J. Phys. Chem. !A, pp. 1-7.
Jones, B. M. B., J. P. Burrows, R. A. Cox, and S. A. Penkett, 1982, Chem. Phys. Lett. aa, pp. 372-376.
Jones, E. L., and O. R. Wulf, 1937, J. Chem. Phys. 2, p. 873.
Jones, I. T. N., and K. Bayes, 1973, J. Chem. Phys. ~, pp. 4836-4844.
Jones, W. E., and E. G. Skolnik, 1976, Chemical Beviews 1.6.., p. 563.
Jourdain, J. L., G. Le Bras, G. Poulet, J. Combourieu, P. Rigaud, and B. LeRoy, 1978, Chem. Phys. Lett. 51, p. 109.
Jourdain, J. L., G. Le Bras, and J. Combourieu, 1979, Int. J. Chem. Kinet. 11, pp. 569-577.
Jourdain, J. L., G. Le Bras, and J. Combourieu, 1981, Chem. Phys. Lett. !A, p. 483.
Jourdain, J. L. G. Poulet, and G. Le Bras, 1982, J. Chem. Phys. 7..6.., pp. 5827-5833.
Kaiser, E. W., and S. M. Japar, 1977, Chem. Phys. Lett. 52., p. 121.
Kaiser, E. W., and S. M. Japar, 1978, Chem. Phys. Lett. ~, p. 265.
KaJimoto, 0., and B. J. Cvetanovic, 1976, J. Chem. Phys. ~, p. 1005.
Kan, C. S., B. D. McQuigg, M. R. Whitbeck, and J. G. Calvert, 1979, Int. J. Chem. Kinet. 11, p. 921.
189

Kan, C. S., J. G. Calvert, and J. H. Shaw, 1980, J. Phys. Chem. ~, p. 3411.
Kan, C. S., J. G. Calvert, and J. H. Shaw, 1981, J. Phys. Chem. ~, pp. 1126-1132.
Kanofsky, J. R., D. Lucas, F. Pruss, and D. Gutman, 1974, J. Phys. Chem. za, p. 311.
Kaufman, F., 1964, Ann. Geophys. 2Q, pp. 106-114.
Kaufman, F., and B. Reimann, 1978, paper presented at 13th Informal Conf. on Photochemistry, Clearwater Beach, Florida, January 1978.
Keyser, L. F., 1978, J. Chem. Phys. ~, p. 214.
Keyser, L. F., 1979, J. Phys. Chem. ll, pp. 645-648.
Keyser, L. F. , 1980a, J. Phys. Chem. .B.!l., pp. 11-14 •
Keyser, L. F. , 1980b, J. Phys. Chem. ~, pp. 1659-1663.
Keyser, L. F. , 1981, J. Phys. Chem. ~, pp • 3667-3673.
Keyser, L. F., 1982, J. Phys. Chem. .a6., pp. 3439-3446.
Keyser, L. F. , 1983, J. Phys. Chem. Bl., pp. 837-841.
Kijewski, H., and J. Troe, 1972, Helv. Chim. Acta~, p. 205.
Kircher, C. C., and S. P. Sander, 1983, J. Phys. Chem., submitted.
Kita, D., and D. H. Stedman, 1982, J. Chem. Soc. Faraday Trans. II, ra, pp. 1249-1259.
Klais, 0., P. C. Anderson, A. H. Laufer and M. J. Kurylo, 1979, Chem. Phys., Lett. ~, p. 598.
Klais, 0., P. C. Anderson, and M. J. Kurylo, 1980a, Int. J. Chem. Kinet. lZ., p. 469.
Klais, 0., A. H. Laufer, and M. J. Kurylo, 1980b, J. Chem. Phys. ~, pp. 2696-2699.
Kleinermanns, K., and A. C. Luntz, 1981, J. Phys. Chem. ~, p. 1966.
Klemm, R. B., 1979, J. Chem. Phys. 11, p. 1987.
Klemm, R. B., and L. J. Stief, 1974, J. Chem. Phys. ni, p. 4900.
Klemm, R. B., E. G. Skolnik, and J. V. Michael, 1980, J. Chem. Phys. 1.2., p. 1256.
190

Knauth, H. D., 1978, Ber. Bunsenges. Phys. Chem. Ba, p. 212.
Knauth, H. D., H. Alberti, and H. Clausen, 1979, J. Phys. Chem • .63., pp. 1604-1612.
Knox, J. H., 1955, Chemistry and Industry, p. 1631. See also Lin et al., 1978a.
Knox, J. H., and R. L. Nelson, 1959, Trans. Far. Soc. ~, p. 937.
Kompa, K. L., and J. Wanner, 1972, Chem. Phys. Lett. la, p. 560.
Kurasawa, H., and R. Lesclaux, 1979, Chem. Phys. Lett. ~, p. 602.
Kurasawa, H., and R. Lesclaux, 1980a, Chem. Phys. Lett. 12, p. 437.
Kurasawa, H., and R. Lesclaux, 1980b, 14th Informal Photochemistry Conference, Newport Beach, CA.
Kurylo, M. J., 1972, J. Phys Chem. ~, p. 3518.
Kurylo, M. J., 1973, Chem. Phys. Lett. 21, pp. 467-471.
Kurylo, M. J., 1977, Chem. Phys. Lett, ~, p. 467.
Kurylo, M. J., 1978, Chem. Phys. Lett. sa, pp. 238-242.
Kurylo, M. J., and W. Braun, 1976, Chem. Phys. Lett. ~, p. 232.
Kurylo, M. J., and R. Manning, 1977, Chem. Phys. Lett. llia, p. 279.
Kurylo, M. J., and A. H. Laufer, 1979, J. Chem. Phys. lQ, pp. 2032-2033.
Kurylo, M. J., W. Braun, and A. Kaldor, 1974, Chem. Phys. Lett. zy, pp. 249-253.
Kurylo, M. J., P. C. Anderson, and O. Klais, 1979, Geophys. Res. Lett • .6.., pp. 760-762.
Kurylo, M. J., O. Klais, and A. H. Laufer, 1981, J. Phys. Chem • .8.5., pp. 3674-3678.
Kurylo, M. J., K. D. Cornett, and J. L. Murphy, 1982a, J. Geophys. Res. ltL, pp. 3081-3085.
Kurylo, M. J., J. L. Murphy, G. S. Haller, and K. D. Cornett, 1982b, Int. J. Chem. Kinet. ll, pp. 1149-1161.
Kurylo, M. J., G. L. Knable, and J. L. Murphy, 1983a, Chem. Phys. Lett • .9..5., pp. 9-12.
191

Kurylo, M. J., J. L. Murphy, and G. L. Knable, 1983b, Chem. Phys. Let t. ll, pp. 281-284.
Lam, L., D. R. Hastie, B. A. Ridley, and H. I. Schiff, 1981, J. Photochem. 15., pp. 119-130.
Langford, A. 0., and C. B. Moore, 1983, J. Phys. Chem., submitted.
Langhoff, S. R., L. Jaffe, and J. O. Arnold, 1977, J. Quant. Spectrosc. Radiat. Transfer la, p. 227.
Laufer, A. H., and A. M. Bass, 1975, Int. J. Chem. Kinet. L, p. 639.
Le Bras, G., R. Foon, and J. Combourieu, 1980, Chem. Phys. Lett. 21, p. 357.
Leck, T. J., J. E. Cook, and J. W. Birks, 1980, J. Chem. Phys. La, pp. 2364-2373.
Lee, F. S. C., and F. S. Rowland, 1977, J. Phys. Chem. at, p. 684.
Lee, J. H., J. V. Michael, W. A. Payne, Jr., and L. J. Stief, 1977, J. Chem. Soc., Faraday Trans. I 21, pp. 1530-1536.
Lee, J. H., J. V. Michael, W. A. Payne, Jr., and L. J. Stief, 1978a, J. Chem. Phys. 2A, pp. 5410-5413.
Lee, J. H., J. V. Michael, W. A. Payne, Jr., and L. J. Stief, 1978b, J. Chem. Phys. ~, pp. 350-353.
Lee, J. H., J. V. Michael, W. A. Payne, and L. J. Stief, 1978c, J. Chem. Phys. ~, pp. 3069-3076.
Lee, J. H. , I. N. Tang, 1982, J. Chem. Phys. Lt, pp. 4459-63.
Lee, L. C., 1982, J. Chem. Phys. 12., pp. 4909-4915.
Lee, L. C., and T. G. Slanger, 1978, J. Chem. Phys. ~, pp. 4053-4060.
Lee, L. C., and T. G. Slanger, 1979, Geophys. Res. Lett. ,6., pp. 165-166.
Lee, Y-P., and C. J. Howard, 1982, J. Chem. Phys. 1L, pp. 756-763.
Lee, Y-P., R. M. Stimpfle, R. A. Perry, J. A. Mucha, K. M. Evenson, D. A. Jennings, and C. J. Howard, 1982, Int. J. Chem. Kinet. ii, pp. 711-732.
Leroy, B., G. LeBras, and P. Rigaud, 1981, Ann. Geophys. 31, pp. 297-302.
Lesclaux, R., 1982, Informal Photochemistry Conference, Stanford, CA.
Lesclaux, R., 1983, manuscript in preparation.
Lesclaux, R., and M. Demissy, 1979, Nouv. J. Chim. 1, p. 443.
192

Lesclaux, H., P. V. Khe, P. Dezauzier, and J. C. Soulignac, 1975, Chem. Phys. Lett. ~, p. 493.
Leu, M. T., 1978, Chem. Phys. Lett. ~, p. 275.
Leu, M. T., 1979, J. Chem. Phys. ~, pp. 1662-1666.
Leu, M. T., 1980a, Chem. Phys. Lett. ~, pp. 37-39.
Leu, M. T., 1980b, Geophys. Hes. Lett. y, pp. 173-175.
Leu, M. T., 1982, J. Phys. Chem. ~, p. 4558.
Leu, M. T., and W. B. DeMore, 1976, Cham. Phys. Lett. !i, pp. 121-124.
Leu, M. T., and W. B. DeMore, 1977, Chem. Phys. Lett. !a, p. 317.
Leu, M. T., and W. B. DeMore, 1978, J. Phys. Chem. Ba, p. 2049.
Leu, M. T., and C. L. Lin, 1979, Geophys. Hes. Lett. ~, pp. 425-428.
Leu, M. T., and H. H. Smith, 1981, J. Phys. Chem. ~, pp. 2570-2575.
Leu, M. T., and H. H. Smith, 1982a, J. Phys. Chem. ~, pp. 73-81.
Leu, M. T., and H. H. Smith, 1982b, J. Phys. Chem. ~, pp. 958-961.
Leu, M. To, C. Lo Lin, and Wo B. DeMore, 1977, J. Phys. Chem. at. p. 190.
Lewis, H. S., and H. T. Watson, 1980, J. Phys. Chem. Bi, p. 3495-3503.
Lewis, H. S., S. P. Sander, S. Wagner, and H. T. Watson, 1980, J. Phys. Chem. Bi, pp. 2009-2015.
Lii, H.-H., H. A. Gorse, Jr., M. C. Sauer, Jr., and S. Gordon, 1979, J. Phys. Chem. al, pp. 1803-1804.
Lii, H.-H., H. A. Gorse, Jr., M. C. Sauer, Jr., and S. Gordon, 1980a, J. Phys. Chem. Bi, pp. 819-821.
Lii, H.-H.,H. A. Gorse, Jr., M. C. Sauer, Jr., and S. Gordon, 1980b, J. Phys. Chem. B.!l., pp. 813-817.
Lii, H.-H., M. C. Sauer, Jr., and S. Gordon, 1980c, J. Phys. Chem • .a!L, pp. 817-819.
Li1, H.-H., M. C. Sauer, Jr., and S. Gordon, 1981, J. Phys. Chem • .8.5.. pp. 2833-2834.
Lin. C. L., 1982. Int. J. Chem. Kinet. 1!, pp. 593-598.
Lin, C. L., and W. B. DeMore, 1973, J. Phys. Chem. Ll, pp. 863-869.
193

Lin, C. L., and M. T. Leu, 1982, Int. J. Chem. Kinet. ~, p. 417.
Lin, C. L., M. T. Leu, and W. B. DeMore, 1978a, J. Phys. Chem. BZ., p. 1772.
Lin, C. L., N. K. Rohatgi, and W. B. DeMore, 1978b, Geophys. Res. Lett • .5., pp. 113-115.
Lippmann, H. H., B. Jesser, and U. Schurath, 1980, Int. J. Chem. Kinet. 12., pp. 547-554.
Littlejohn, D., and H. S. Johnston, 1980, EOS ~, p. 966.
Lloyd, A. C., K. R. Darnall, A. M. Winer, and J. N. Pitts, Jr., 1976, J. Phys. Chem. ~, p. 789.
Lorenz, K., B. Fritz, and R. Zellner, 1983, Oxidation Communications, in press.
Luther, Ke, and J. Troe, 1978, 17th International Combustion Symposium, p. 535.
Mack, G. P. R., and B. Thrush, 1973, J. Chem. Soc., Faraday Trans. I~, p. 208.
Magnotta, F., and H. S. Johnston, 1980, Geophys. Res. Lett. 1., pp. 769-772.
Majer, J. R., and J. P. Simons, 1964, "Photochemical Processes in Halogenated Compounds," J. Pitts, G. Hammond, and W. A. Noyes, ed., Advances in Photochemistry, 2, Interscience, New York, pp. 137-181.
Malko, M. W., and J. Troe, 1982, Int. J. Chem. Kinet. ~, p. 399.
Mandelman, M., and R. W. Nicholls, 1977, J. Quant. Spectrosc. Radiat. Transfer 11., p. 483.
Manning, R., and M. J. Kurylo, 1977, J. Phys. Chem. ~, p. 291.
Manning, R. G., W. Braun, and M. J. Kurylo, 1976, J. Chem. Phys • .6,.5., p. 2609.
Margitan, J. J., 1983a, J. Phys. Chem. ai, pp. 674-679.
Margitan, J. J., 1983b, J. Geophys. Res., aa, pp. 5416-5420.
Margitan, J. J., and J. G. Anderson, 1978, paper presented at 13th Informal Conf. on Photochemistry, Clearwater Beach, Florida, January 1978.
Margitan, J. J., and R. T. Watson, 1982, J. Phys. Chem. ~, pp. 3819-3824.
Margitan, J. J., F. Kauf'man, and J. G. Anderson, 1974, Geophys. Res. Lett. 1, pp. 80-81.
194

Margitan, J. J., F. Kaufman, and J. G. Anderson, 1975, Int. J. Chem. Kinet. SymP. No.1, p. 281.
Marinelli, W. J., and H. S. Johnston, 1982a, J. Chem. Phys. 11, pp. 1225-1234.
Marinelli, W. J., and H. S. Johnston, 1982b, Chem. Phys. Lett • .23., pp. 127-132.
Marinelli, W. J., D. M. Swanson, and H. S. Johnston, 1982, J. Chem. Phys., ~, pp. 2864-2870.
Martin, H., and R. Gareis, 1956, Z. Elektrochemie nQ, pp. 959-964.
Marx, W., F. Bahe, and U. Schurath, 1979, Ber. Bunsenges. Phys. Chem • .83., pp. 225-230.
McCrumb, J. L., and F. Kaufman, 1972, J. Chem. Phys. 51, pp. 1270-1276.
McElcheran, D. E., M. H. J. Wijnen, and E. W. R. Steacie, 1958, Can. J. Chem. ~, p. 321.
McKenzie, A., M. F. R. Mulcahy, and J. R. steven, 1973, J. Chem. Phys. ~, pp. 3244-3254.
Michael, J. V., and J. H. Lee, 1977, Chem. Phys. Letters 21, p. 303.
Michael, J. V., and W. A. Payne, 1979, Int. J. Chem. Kinet. 11, p. 799.
Michael, J. V., J. E. Allen, Jr., and W. D. Brobst, 1981, J. Phys. Chem. B5., p. 4109.
Michael, J. V., D. A. Whytock, J. H. Lee, W. A. Payne, and L. J. Stief, 1977, J. Chem. Phys. ~, p. 3533.
MJ.chael, J. V., J. H. Lee, W. A. Payne, and L. J. Stief, 1978, J. Chem. Phys. Aa, p. 4093.
Michael, J. V., D. F. Nava, W. A. Payne, and L. J. Stief, 1979a, J. Chem. Phys. 1Q, p. 1147.
Michael, J. V., D. F. Nava, W. A. Payne, and L. J. Stief, 1979b, J. Chem. Phys. 1Q, p. 3652.
Michael, J. V., D. F. Nava, R. P. Borkowski, W. A. Payne, and L. J. Stief, 1980, J. Chem. Phys. 21, p. 6108.
Michael, J. V., D. F. Nava, W. Brobst, R. P. Borkowski, and L. J. Stief, 1982, J. Phys. Chem. ~, pp. 81-84.
Miller, J. C., and R. J. Gordon, 1981, J. Chem. Phys. ~, p. 5305.
195

Mitchell, D. N., R. P. Wayne, P. J. Allen, R. P. Harrison, and R. J. Twin, 1980, J. Chem. Soc., Faraday Trans. II~, p. 785.
Miziolek, A. W., and M. J. Molina, 1978, J. Phys. Chem. Ba, p. 1769.
Molina, L. T., and M. J. Molina, 1977, Geophys. Res. Let t. 1, pp. 83-86.
Molina, L. T., and M. J. Molina, 1978, J. Phys. Chem. Ba, pp. 2410-2414.
MOlina, L. T., and M. J. Molina, 1979, J. Photochem. ll, pp. 139-144.
Molina, L. T., and M. J. Molina, 1981, J. Photochem. 15.., p. 97.
Molina, L. T., and M. J. Molina, 1982, "Chemistry of Fluorine in stratosphere", 182nd American Chemical Society National Meeting, New York.
Molina, L. T., S. D. Schinke, and M. J. Molina, 1977a, Geophys. Res. Lett. 1, pp. 580-582.
Molina, L. T., J. E. Spencer, and M. J. Molina, 1977b, Chem. Phys. Lett. ~, pp. 158-162.
the
Molina, L. T., J. J. Lamb, and M. J. Molina, 1981, Geophys. Res. Lett. ,a, p. 1008.
Molina, L. T., M. J. Molina, and F. S. Rowland, 1982, J. Phys. Chem • .8.6., pp. 2672-2676.
Molina, M. J., and G. Arguello, 1979, Geophys. Res. Lett. ~, pp. 953-955.
Molina, M. J., L. T. Molina and T. Ishiwata, 1980a, J. Phys. Chem. Bll., p. 3100.
Molina, M. J., T. Ishiwata, and L. T. Molina, 1980b, J. Phys. Chem • .a!l, pp. 821-826.
Moortgat, G. K., and E. Kudzus, 1978, Geophys. Res. Lett. ~, p. 191.
Moortgat, G. K., and P. Warneck, 1979, J. Chem. Phys. lQ, pp. 3639-3651.
Moortgat, G. K., W. Klippel, K. H. Mobius, W. Seiler, and P. Warneck, 1980, "Laboratory Measurements of Photolytic Parameters for Formaldehyde", Report No. FAA-EE-80-47.
Moortgat, G. K., W. Seiler, and P. Warneck, 1983, J. Chem. Phys. 1.a, pp. 1185-1190.
Morel, 0., R. Simonai tis, and J. Heicklen, 1980, Chem. Phys. Lett. 1.3., p. 38.
Morley, C., and I. W. M. Smith, 1972, J. Chem. Soc., Faraday Trans. II ll, p. 1016
196

Morris, E. D., and H. Niki, 1971, J. Chem. Phys. 52, p. 1991.
Morris, E. D., D. H. Stedman, and H. Niki, 1971, J. Am. Chem. Soc. ~, p. 3570.
Nadtochenko, ~ A., O. M. Sarkisov, and V. I. Vedeneer, 1979, Doklady Akademii Nauk SSSR, ~, p. 152.
Nava, D. F., J. V. Michael, and L. J. Stief, 1981, J. Phys. Chem. ~, p. 1896.
Nava, D. F., S. R. Bosco, and L. J. Stief, 1983, J. Chem. Phys. lB., pp. 2443-2448.
Neksandrov, E. N., V. S. Arutyunov, and S. N. Kozlov, 1981, Kinetics and Catalysis za, pp. 391-394.
Nelson, H., W. J. Marinelli, and H. S. Johnston, 1981, Chem. Phys. Lett. lB., pp. 495-499.
Nelson, H. H., and H. S. Johnston, 1981, J. Phys. Chem. ~, p. 3891.
Nesbitt, D. J., and S. R. Leone, 1980, J. Chem. Phys. la, pp. 1722-1732.
Nicholas, J. E., and R. G. W. Norrish, 1968, Proc. Roy. Soc. A. 3.Q1., p. 391.
Nicolet, M., and W. Peetermans, 1980, Planet. Space Sci. 2a, pp. 85-103.
Nielsen, O. J., 1979, Riso National Laboratory Publication, Riso-M-2216, Roskilde, Denmark.
Niemitz, K. J., H. Gg. Wagner, and R. Zellner, 1981, Zeit. Phys. Chem. N.F. ~, pp. 155-170.
Niki, H., E. E. Daby and B. Weinstock, 1969, Data reported at Twelfth Symposium (International) on Combustion, The Combustion Institute, p. 277.
Niki, H., P. D. Maker, L. P. Breitenbach, and C. M. Savage, 1978a, Chem. Phys. Lett. 52, p. 596.
Niki, H., P. D. Maker, C. M. Savage, and L. P. Breitenbach, 1978b, J. Phys. Chem. aa, p. 132.
Niki, H., P. D. Maker, C. M. Savage, and L. P. Breitenbach, 1978c, Chem. Phys. Lett. ~, p. 78.
Niki, H., P. D. Maker, C. M. Savage, and L. P. Breitenbach, 1980, Chem. Phys. Lett. 11, pp. 43-46.
Niki, H., P. D. Maker, C. M. Savage, and L. P. Breitenbach, 1981, J. Phys. Chem. ~, p. 877.
197

Niki, H., P. D. Maker, C. M. Savage, and L. P. Breitenbach, 1983, J. Phys. Chem. aI, pp. 2190-2193.
Ogawa, M., 1971, J. Chem. Phys. 51, pp. 2550-2556.
Ogryzlo, E. A., H. Paltenghi, and K. D. Bayes, 1981, Int. J. Chem. Kinet. li, pp. 667-675.
Okabe, H., 1978, Photochemistry.Qf Small Molecules, John Wiley and Sons, Inc., New York, p. 217.
Okabe, H., 1980, J. Chem. Phys. La, p. 6642.
Overend, H. P., and G. Paraskevopoulos, 1977a, Chem. Phys. Lett. ~, p. 109.
Overend, H. P., and G. Paraskevopoulos, 1977b, J. Chem. Phys. 22, p. 674.
Overend, H. P., and G. Paraskevopoulos, 1978, J. Phys. Chem. aa, p. 1329.
Overend, H. P., G. Paraskevopoulos, and H. J. Cvetanovic, 1975, Can. J. Chem. 5.3., p. 3374-3382.
Overend, H. P., G. Paraskevopoulos, and C. Black, 1976, J. Chem. Phys • .6ll., p. 4149.
Pagsberg, P. B., J. Erikson, and H. C. Christensen, 1979, J. Phys. Chem. p. 582.
Paraskevopoulos, G., and H. S. Irwin, 1982a, Chem. Phys. Lett • .93., pp. 138-143.
Paraskevopoulos, G., and H. W. Irwin, 1982b, XV Informal Conference on Photochem1ctry, Stanford, CA June 27-July 1.
Paraskevopoulos, G., D. L. Singleton, and H. S. Irwin, 1981, J. Phys. Chem • .65., p. 561.
Parkes, D. A., 1977, Int. J. Chem. Kinet. ~, p. 451.
Pastrana, A. V., and H. W. Carr, Jr., 1974, Int. J. Cham. Kinet. ~, p. 587.
Pate, C. T., B. J. Finlayson, and J. N. Pitts, Jr., 1974, J. Am. Chem. Soc • .9..6., p. 6554.
Patrick, H., and D. M. Golden, 1983, Int. J. Chem. Kinet., in press.
Paukert, T. T., and H. S. Johnston, 1972, J. Cham. Phys., 5i pp. 2824-2838.
Payne, W. A., L. J. Stief, and D. D. Davis, 1973, J. Am. Chem. Soc • .9.,5., p. 7614.
Perry, H. A., and D. Williamson, 1982, Chem. Phys. Lett. ~, pp. 331-334.
198

Perry, R. A., R. Atkinson, and J. N. Pitts, Jr., 1976a, J. Chem. Phys • .611., p. 1618.
Perry, R. A., R. Atkinson, and J. N. Pitts, Jr., 1976b, J. Chem. Phys. g, p. 3237.
Perry, R. A., R. Atkinson, and J. N. Pitts, Jr., 1977, J. Chem. Phys. 6.l., p. 5577.
Phillips, L. F., 1978, Chem. Phys. Lett. 5L, pp. 538-539.
Phillips, L. F., 1979, Aust. J. Chem. la, pp. 2571-2577.
Phillips, L. F., and H. I. Schiff, 1962, J. Chem. Phys. ~, p. 1509.
Plumb, I. C., and K. R. Ryan, 1982, Int. J. Chem. Kinet. 1!, p. 861-874.
Plumb, I. C., K. R. Ryan, J. R. Steven, and M. F. R. Mulcahy, 1979, Chem. Phys. Lett. ~, p. 255.
Plumb, I. C., K. R. Ryan, J. R. Steven, and M. F. R. Mulcahy, 1981, J. Phys. Chem. ~, p. 3136.
Porter, G., and F. G. Wright, 1953, Disc. Faraday Soc., 1!, p. 23.
Posey, J., J. Sherwell, and M. Kaufman, 1981, Chem. Phys. Lett. 11, p. 476.
Poulet, G., G. Le Bras, and J. Combourieu, 1974, J. Chim. Physique li, p. 101.
Poulet, G., G. Le Bras, and J. Combourieu, 1977, J. Phys. Chem. at, p. 2303.
Poulet, G., G. Le Bras, and J. Combourieu, 1978a, J. Chem. Phys. ~, p. 767.
Poulet, G., G. Le Bras, and J. Combourieu, 1978b, Proceedings of the World Meteorological Organization Symposium on the Geophysical Aspects and Consequences of Changes in the Composition of the Stratosphere. Toronto, 26-30 June 1978. WMO-1511, p. 289.
Poulet, G., G. Le Bras, and J. Combourieu, 1980, Geophys. Res. Lett. 1., pp. 413-414.
Poulet, G., G. Laverdet, and G. Le Bras, 1981, J. Phys. Chem. ~, p. 1892.
Prasad, S. s., 1980, Nature ~, p. 152.
Pritchard, H. 0., J. B. Pyke, and A. F. Trotman-Dickenson, (a) 1954, J. Amer. Chem. Soc. ~, p. 1201; (b) 1955, J. Amer. Chem. Soc. 11, p. 2629.
Radford, H. E., 1980, Chem. Phys. Lett. 11, p. 195.
199
Radford, H. E., K. M. Evenson, and D. A. Jennings, 1981, Chem. Phys. Lett. za., p. 589.
Ravishankara, A. R., 1982, private communication.
Ravishankara, A. R. , 1983, private communication.
Ravishankara, A. R., and D. D. Davis, 1978, J. Phys. Chem. .82., p. 2852.
Ravishankara, A. R., and P. H. Wine, 1980, J. Chem. Phys. 12., pp. 25-30
Ravishankara, A. R. and R. L. Thompson, 1983, Chem. Phys. Letts. , in press.
Ravishankara, A. R., G. Smith, R. T. Watson, and D. D. Davis, 1977a, J. Phys. Chem. at, p. 2220.
Ravishankara, A. R., D. D. Davis, G. Smith, G. Tesi, and J. Spencer, 1977b, Geophys. Res. Lett. ~, p. 7.
Ravishankara, A. R., ~ Smith, and D. D. Davis, 1978, 13th Informal Photochemistry Conference, Clearwater Beach, Florida.
Ravishankara, A. R., P. H. Wine, and A. O. Langford, 1979a, Chem. Phys. Lett. ~, p. 479.
Ravishankara, A. R., P. H. Wine, and A. O. Langford, 1979b, J. Chem. Phys. ~, pp. 984-989.
Ravishankara, A. R., F. L. Eisele, and P. H. Wine, 1980a, J. Chem. Phys. ll, p. 3743.
Ravishankara, A. R., N. M. Kreutter, R. C. Shah, and P. H. Wine, 1980b, Geophys. Res. Lett. L, pp. 861-864.
Ravishankara, A. R., F. L. Eisele, N. M. Kreutter, and P. H. Wine, 1981a, J. Chem. Phys. 1!, p. 2267.
Ravishankara, A. R., J. M. Nicovich, R. L. Thompson, and F. P. Tully, 1981b, J. Phys. Chem. B2, pp. 2498-2503.
Ravishankara, A. R., F. L. Eisele, and P. H. Wine, 1982, J. Phys. Chem., .8..6., pp. 1854-1858.
Ravishankara, A. R., F. L. Eisele, and P. H. Wine, 1983a, J. Chem. Phys. pp. 1140-1144.
Ravishankara, A. R., P. H. Wine, and J. M. Nicovich, 1983b, J. Chem. Phys., la, pp. 6629-6639.
Ray, G. W. , and R. T. Watson, 1981a, J. Phys. Chem. .85" pp. 2955-2960.
Ray, G. W. , and R. T. Watson, 1981b, J. Phys. Chem. .8.5.., pp. 1673-1676 •
200
1Ji,

Ray, G. W., L. F. Keyser, and R. T. Watson, 1980, J. Phys. Chem. ~, pp. 1674-1681.
Reilly, J. D., J. H. Clark, C. B. Moore, and G. C. Pimentel, J. Chem. Phys. 1978, ~, p. 4381.
Reimann, B., and F. Kaufman, 1978, J. Chem. Phys. ~, p. 2925.
Rigaud, P., B. Leroy, G. Le Bras, G. Poulet, J. L. Jourdain, and J. Combourieu, 1977, Chem. Phys. Lett. ~, p. 161.
Robbins, D. E., 1976, Geophys. Res. Lett., .1, p. 213; Erratum, .1JUJl • .1, p. 757.
Robbins, D. E., 1977, "International Conference on Problems Related to the stratosphere", W. Huntress, Jr., and D. Maple, Eds., JPL Publication 77-12, Jet Propulsion Laboratory, California Institute of Technology, Pasadena, California.
Robbins, D. E., and R. S. Stolarski, 1976, Geophys. Res. Lett • .1, pp. 603-606.
Robbins, D. E., L. J. Rose, and W. R. Boykin, 1975, Ultraviolet Photoabsorption Cross Section for CF2C12' CFC13' and CC14' Johnson Space Flight Center Internal Note, JSC-09937.
Robertshaw, J. S., and I. W. M. Smith, 1980, Int. J. Chem. Kinet. 1.2.., p. 729.
Robertshaw, J. S., and I. W. M. Smith, 1982, J. Phys. Chem. ~, p. 785.
Roscoe, J. M., 1982, Int. J. Chem. Kinet. 1!, pp. 471-478.
Rosen, D. I., and R. A. Cool, 1975, J. Chem. Phys. bZ, pp. 466-476.
Rowland, F. S., and M. J. Molina, 1975, Rev. Geophys. Space Phys. ll, p. 1 •
Rowland, F. S., J. E. Spencer, and M. J. Molina, 1976, J. Phys. Chem • .a.o., pp. 2711-2713.
Rudolph, R. N., and E. C. Y. Inn, 1981, J. Geophys. Res. ~, p. 9891.
Safary, E., J. Romand, and B. Vodar, 1951, J. Chem. Phys. ~, p. 379.
Sahetchian, K. A., A. HeiSS, and R. Rigny, 1982, Can. J. Chem. nQ, pp. 2896-2902.
Sander, S. P., and R. T. Watson, 1980, J. Phys. Chem. ~, p. 1664.
Sander, S. P., and R. T. Watson, 1981 a, Chem. Phys. Lett. IT, pp. 473-475.
201
Sander, S. P., and R. T. Watson, 1981b, J. Phys. Chem. .85., p. 4000 •
Sander, S. P., and R. T. Watson, 1981c, J. Phys. Chem. .85., p. 2960.
Sander, S. P., and M. Peterson, 1983, manuscript in preparation.
Sander, S. P., G. W. Ray, and R. T. Watson, 1981, J. Phys. Chem. ,a,s., p. 199.
Sander, S. P., M. Peterson, R. T. Watson, and R. Patrick, 1982, J. Phys. Chem. ~, pp. 1236-1240.
Sanders, N. D., J. E. Butler, and J. R. McDonald, 1980a, J. Chem. Phys. Ll, pp. 5381-5383.
Sanders, N. D., J. E. Butler, L. R. Pasternack, and J. R. McDonald, 1980b, Chem. Phys. Lett. &.a, p. 203.
Sandorfy, C., 1976, Atmos. Environ. lQ, pp. 343-351.
Sanhueza, E., R. Simonaitis, and J. Heicklen, 1979, Int. J. Chem. Kinet. ll, p. 907.
Sarkisov, o. M., S. G. Cheskis, and E. A. Sviridenkov, 1978, Bull. Acad. Sci. USSR Chem. Sere '1, p. 2336.
Schonle, G., H. D. Knauth, and R. N. Schindler, 1979, J. Phys. Chem. al, p. 3297.
Schurath, U., H. H. Lippmann, and B. Jesser, 1981, Ber. Bunsenges. Phys. Chem • .85., pp. 807-813.
Seery, D. J., and D. Br1tton, 1964, J. Phys. Chem. ~, p. 2263.
Selwyn, G., J. Podolske, and H. S. Johnston, 1977, Geophys. Res. Lett. !" pp. 427-430.
Selzer, E. A., and K. D. Bayes, 1983, J. Phys. Chem. ~, p. 392-394.
Shamon1ma~ N. F., and A. G. Ketov, 1979, K1net. Katal. ~, p. 233.
Shardanand, and A. D. Prasad Rao, 1977, J. Quant. Spectrosc. Radiat. Transfer 11, pp. 433-439.
Sh1buya, K., T. Ebatu, K. Ob1, and I. Tanaka, 1977, J. Phys. Chem. ll, p. 2292.
Silver, J. A., and C. E. Kolb, 1980, Chem. Phys. Lett. 12, p. 191.
Silver, J. A., and C. E. Kolb, 1982, J. Phys. Chem. ~, pp. 3240-3246.
Simonaitis, R., and J. Heicklen, 1973, J. Phys. Chem. 21, 1932-1935.
202
Simonaitis, H., and J. Heicklen, 1975, J. Phys. Chem. ~, p. 298.
Simonai tis, H., and J. Heicklen, 1978, Int. J. Chem. Kinet. ~, pp. 67-87.
Simonai tis, H., and J. He1cklen, 1979, Chem. Phys. Lett. ,65., p. 361.
Simonaitis, H., and J. Heicklen, I
1981, J. Phys Chem • .85., p. 2946.
Simonai tis, H., and J. He1cklen, 1982, J. Phys. Chem. ~, pp. 3416-3418.
Singleton, D. L., and H. J. Cvetanovic, 1978, Can. J. Chem. 5..6.., p. 2934.
Singleton, D. L., and H. J. Cvetanovic, 1981, Int. J. Chem. Kinet. li, p. 945.
Singleton, D. L., H. S. Irwin, W. S. Nip, and H. J. Cvetanovic, 1979, J. Phys. Chem. B3.., pp. 2195-2200.
Singleton, D. L., G. Paraskevopoulos, and H. S. Irwin, 1982, J. Phys. Chem. ~, pp. 2605-2609.
Slagle, I. H., J. H. Gilbert, and D. Gutman, 1974a, J. Chem. Phys. ll, p. 704.
Slagle, I. H., J. F. Pruss, Jr., and D. Gutman, 1974b, Int. J. Chem. Kinet. ~, p. 177.
Slagle, I. H., F. Baiocchi, and D. Gutman, 1978, J. Phys. Chem. Aa, p. 1333.
Slanger, T. G., B. J. Wood, and G. Black, 1973, Int. J. Chem. Kinet. 5., p. 615.
Smardzewski, H. H., and M. C. Lin, 1977, J. Chem. Phys. ,6.6., pp. 3197-3204.
Smith, C. A., L. T. Molina, J. J. Lamb, and M. J. Molina, 1983, Int. J. Chemical Kinetics, in press.
Smith, G. P., and D. M. Golden, 1978, Int. J. Chem. Kinet. ~, p. 489.
Smi th, I. W. M., and H. Zellner, 1973, J. Chem. Soc., Faraday Trans. II .6..9." p. 1617.
Smith, I. W. M., and H. Zellner, 1974, J. Chem. Soc., Faraday Trans. II 1Jl., pp. 1045-1056.
Smith, I. W. M., and H. Zellner, 1975, Int. J. Chem. Kinet., Symp. 1, p. 341.
Smith, H. D., 1978, Int. J. Chem. Kinet • .1.Q.., p. 519.
203

Smi th, W. S., C. C. Chou, and F. S. Howland, 1977, Geophys. Hes. Lett. &., pp. 517-519.
Sparks, H. K., L. H. Carlson, K. Shobatake, M. L. Kowalczyk, and Y. T. Lee, 1980, J. Chem. Phys. la, pp. 1401-1402.
Spencer, J. E., and F. S. Howland, 1978, J. Phys. Chem. aa, pp. 7-10.
Sridharan, U. C., B. Heimann, and F. Kaufman, 1980, J. Chem. Phys. ll, pp. 1286-1293.
Sridharan, U. C., L. X. Qiu, and F. Kaufman, 1981, J. Phys. Chem. ~, pp. 3361-3363.
Sridharan, U. c., L. X. Qiu, and F. Kaufman, 1982, J. Phys. Chem. ~, pp. 4569-4574.
Sridharan, U. C., L. X. Qiu, and F. Kaufman, 1983, private communication.
Staricco, E. H., S. E. Sicre, and H. J. Schumacher, 1962, Z. Phys. Chem. N.F. 31, p. 385.
Stedman, D. H., and H. Niki, 1973, J. Phys. Chem. 11, p. 2604.
Stedman, D. H., M. A. A. Clyne, and J. A. Coxon, 1968, quoted in Clyne and Coxon (1968).
Stedman, D. H., W. L. Chameides, and J. G. Jackson, 1975, Geophys. Hes. Lett., a, p. 22.
Steiner, H., and E. K. Hideal, 1939, Proc. Hoy. Soc. (London) Sec. A. ill., p. 503.
Stief, L. J., W. A. Payne, J. H. Lee, and J. V. Michael, 1979, J. Chem. Phys., ~ pp. 5241-5243.
Stief, L. J., D. F. Nava, W. A. Payne, and J. V. Michael, 1980, J. Chem. Phys. 21, p. 2254-2258.
Stief, L. J., W. D. Brobst, D. F. Nava, H. P. Borkowski, and J. V. Michael, 1982, J. Cham. Soc. Faraday Trans. II La, pp. 1391-1401.
Stimpfle, H., H. Perry, and C. J. Howard, 1979, J. Chem. Phys. 11., pp. 5183-5190.
Stockwell, W. H., and J. G. Calvert, 1978, J. Photochem. a, pp. 193-203.
Strei t, G. E., C. J. Howard, A. L. Schmel tekopf, J. A. Davidson, and H. I. Schiff, 1976, J. Chem. Phys. ~, pp. 4761-4764.
Streit, G. E., J. S. Wells, F. C. Fehsenfeld, and C. J. Howard, 1979, J. Chem. Phys. ~, pp. 3439-3443.
204

Stuhl, F. , 1973a, Ber. Bunsenges., Phys. Chem. XL, p. 674.
Stuhl, F., 1973b, J. Chem. Phys. ~, p. 635.
Stuhl, F., 1974, Ber. Bunsenges., Phys. Chem. xa, p. 230.
Stuhl, F., and H. Niki, 1971, J. Chem. Phys. 5.5.. p. 3954.
Stuhl, F. , and H. Niki, 1972, J. Cham. Phys. 51, pp. 3671-3677.
Su, F., J. G. Calvert, C. R. Lindley, W. M. Uselman, and J. H. Shaw, 1979, J. Phys. Cham. al, pp. 912-920.
Su, F., J. G. Calvert, J. H. Shaw, H. Niki, P. D. Maker, C. M. Savage, and L. D. Breitenbach, 1979a, Chem. Phys. Lett. 22, pp. 221-225.
Su, F., J. G. Calvert, and J. H. Shaw, 1979b, J. Phys. Chem. al, pp. 3185-91.
Sullivan, J. 0., and P. Warneck, 1965, J. Phys. Cham. ~, p. 1749.
Swanson, D., and H. S. Johnston, 1983, manuscript in preparation.
Takacs, G. A., and G. P. Glass, 1973a, J. Phys. Chem. 1.1.., p. 1060.
Takacs, G. A., and G. P. Glass, 1973b, J. Phys. Chem. 1.1.., p. 1182.
Takacs, G. A., and G. P. Glass, 1973c, J. Phys. Chem. XL, p. 1948.
Takacs, G. A., and C. J. Howard, 1983, Private communication.
Tang, K. Y., P. W. Fairchild, and E. K. C. Lee, 1979, J. Phys. Chem • .6.3., p. 569.
Temps, F., and H. Gg. Wagner, 1982, Ber. Bunsenges. Phys. Chem. ~, p. 119.
Thrush, B. A., and J. P. T. Wilkinson, 1979, Chem. Phys. Lett. Q.6., pp. 441-443.
Thrush, B. A., and J. P. T. Wilkinson, 1981a, Chem. Phys. Lett. lU., pP • 1-3.
Thrush, B. A., and J. P. T. Wilkinson, 1981b, Chem. Phys. Lett. .all, pp. 17-19.
Thrush, B. A., and G. S. Tyndall, 1982a, J. Chem. Soc. Faraday II, xa, pp. 1469-1475.
Thrush, B. A., and G. S. Tyndall, 1982b, Chem. Phys. Lett. ~, pp. 232-235.
Tiee, J. J., F. B. Wampler, R. C. Oldenborg, and W. W. Rice, 1981, Chem. Phys. Lett. Ba, pp. 80-84.
205
Trainor, D. W., and C. W. von Rosenberg, Jr., 1974, J. Chem. Phys. ,61., pp. 1010-1015.
Trevor, P. L., G. Black, and J. R. Barker, 1982, J. P?ys • Chem. .8,6., p. 1661.
Troe, J. , 1977, J. Cham. Phys. .6,6., p. 4745.
Troe, J., 1979, J. Phys. Chem. lU, p. 114.
Tsuchiya, S., and T. Nakamura, 1979, Bull. Chem. Soc. Japan 5.,2., pp. 1527-1528.
Tully, F. P., 1983, Chem. Phys. Lett. ~, pp. 148-153.
Tully, F. P. and A. R. Ravishankara, 1980, J. Phys. Cham. ~, pp. 3126-3130.
Tully, F. P., A. R. Ravishankara, and K. Carr, 1983, Inter. J. Chem. Kinet., in press.
Turco, R. P., 1975, Geophys. Surveys a, pp. 153-192.
Turco, R. P., R. J. Cicerone, E. C. Y. Inn, and L. A. Capone, 1981, J. Geophys. Res. ~, p. 5373.
van den Bergh, H. E., and A. B. Callear, 1971, Trans. Faraday Soc. ~, p. 2017.
Vanderzanden, J. W., and J. W. Birks, 1982, Chem. Phys. Lett., .a.a, pp. 109-114.
Vanlaethem-Meuree, N., J. Wisemberg, and P. C. Simon, 1978a, Bull. Acad. Roy. Belgique, Cl. Sci. ~, p. 31.
Vanlaethem-Meuree, N., J. Wisemberg, and P. C. Simon, 1978b, Bull. Acad. Roy. Belgique, Cl. Sci. ~, p. 42.
Vanlaethem-Meuree, N., J. Wisemberg, and P. C. Simon, 1979, Geophys. Res. Lett. ~, pp. 451-454.
Veyret, B., and R. Lesclaux, 1981, J. Phys. Chem. ~, p. 1918.
Veyret, B., J. C. Rayez, and R. Lesclaux, 1982, J. Phys. Chem. ~, pp. 3424-3430.
Viggiano, A. A., J. A. Davison, F. C. Fehsenfeld, and E. E. Ferguson, 1981, J. Cham. Phys. 1!, p. 6113.
Volltrauer, H. N., W. Felder, R. J. Pirkle, and A. Fontijn, 1979, J. Photocham.11, pp. 173-181.
Wagner, G., and R. Zellner, 1981, Ber. Bunsenges. Phys. Chem • .65., pp. 1122-1128.
206

Wagner, H. Gg., J. Warnatz, and C. Zetzsch, 1971, Anales Assoc. Quim. Argentina, ~, pp. 169-177.
Wagner, H. Gg., C. Zetzsch, and J. Warnatz, 1972, Ber. Bunsenges, Phys. Chem. 16.., p. 526.
Warnatz, J., H. Gg. Wagner, and C. Zetzsch, 1972, Report 7-0240/92410/01017 Frankhofer Gesellchaft.
Washida, N., 1980, J. Chem. Phys. 21, p. 1665.
Washida, N. and K. D. Bayes, 1976, Int. J. Chem. Kinet. a, p. 777.
Washida, N., R. J. Martinez, and K. D. Bayes, 1974, Z. Naturforsch. ~, p. 251.
Washida, N., H. Akimoto, and M. Okuda, 1980a, J. Chem. Phys. 1.2.., pp. 5781-5783.
Washida, N., H. Akimoto, and M. Okuda, 1980b, J. Phys. Chem. 21, p. 1673.
Washida, N., H. Akimoto, ana M. Okuda, 1980c, Bull. Chem. Soc. Japan 5,3., pp. 3496-3503.
Watson, R. T., 1977, J. Phys. Chem. Reference Data~, pp. 871-917.
Watson, R. T., 1980, Proceedings of the NATO Advanced Study Institute on Atmospheric Ozone, Report IFAA-EE:80:20, pp. 429-466.
Wa tson, R. T., E. S. Machado, R. L. Schiff, S. Fischer, and D. D. Davis, 1975, Proceedings of the 4th ClAP Conference. DOT-TSC-OST-75-38. Cambridge, Mass., February 1975.
Watson, R. T., G. Machado, S. Fischer, and D. D. Davis, 1976, J. Chem. Pbys. ~, p. 2126.
Watson, R. T., G. Machado, B. C. Conaway, S. Wagner, and D. D. Davis, 1977, J. Phys. Chem. at, p. 256.
Watson, R. T., S. P. Sander, and Y. L. Yung, 1979, J. Phys. Chem • .8.3., p. 2936.
Wecker, D., R. Johanssen, and R. N. Schindler, 1982, Ber. Bunsenges. Phys. Chem. ~, pp. 532-538.
Wei, C. N., and R. B. TimmOns, 1975, J. Chem. Phys. 6Z, p. 3240.
Weissman, M., L. G. S. Shum, S. P. Heneghan, and S. W. Benson, 1981, J. Phys. Chem. ~, p. 2863.
West, G. A., R. E. Weston, Jr., and G. W. Flynn, 1978, Chem. Phys. Lett. ~, p. 429.
207

Westenberg, A. A., and N. de Haas, 1969a, J. Chem. Phys. 5.Q, p. 707.
Westenberg, A. A., and N. de Haas, 1969b, J. Phys. Chem. ll, p. 1181.
Westenberg, A. A., and N. de Haas, 1972, J. Chem. Phys. ~, p. 5375.
Westenberg, A. A., and N. de Haas, 1973a, J. Chem. Phys. .5.6., pp. 4066-4071.
Westenberg, A. A., and N. de Haas, 1973b, J. Chem. Phys. 5.9.., p. 6685.
Westenberg, A. A., and N. de Haas, 1973c, J. Chem. Phys. .5.6., pp. 4061-4065.
Westenberg, A. A., and N. de Haas, 1977, J. Chem. Phys. ~, p. 4900.
Westenberg, A. A., N. de Haas, and J. M. Roscoe, 1970a, J. Phys. Chem. 11l, p. 3431.
Westenberg, A. A., J. M. Roscoe, and N. de Haas, 1970b, Chem. Phys. Lett. ~, pp.597-599.
Whytock, D. A., R. B. Timmons, J. H. Lee, J. V. Michael, W. A. Payne, and L. J. Stief, 1976, J. Chem. Phys. ~, pp. 2052-2055.
Whytock, D. A., J. H. Lee, J. V. Michael, W. A. Payne, and L. J. Stief, 1977, J. Chem. Phys. n.6., p. 2690.
Wilson, W. E., Jr., 1967, J. Chem. Phys. ~, P. 2017.
Wilson, W. E., and A. A. Westenberg, 1967, 11 th Symposium on Combustion (The Combustion Institute, Pittsburgh), p. 1143.
Wine, P. H., A. R. Ravishankara, D. L. Philen, D. D. Davis, and R. T. Watson, 1977, Chem. Phys. Lett. 5.Q, p. 101.
Wine, P. H., and A. R. Ravishankara, 1981, Chem. Phys. Lett. 21, pp. 103-109.
Wine, P. H., and A. R. Ravishankara, 1982, Chem. Phys. ~, pp. 365-373.
Wine, P. H., and A. R. Ravishankara, 1983, Chem. Phys. Lett. ~, pp. 129-132.
Wine, P. H., N. M. Kreutter and A. R. Ravishankara, 1979, J. Phys. Chem. ll3., p. 3191.
Wine, P. H., R. C. Shah, and A. R. Ravishankara, 1980, J. Phys. Chem • .Bll, pp. 2499-2503.
Wine, P. H., N. M. Kreutter, C. A. Gump, and A. R. Ravishankara, 1981a, J. Phys. Chem. B2, pp. 2660-2665.
Wine, P. H., A. R. Ravishankara, N. M. Kreutter, R. C. Shah, J. M. Nicovich, R. L. Thompson, and D. J. Wuebbles, 1981 b, J. Geophys. Res. ll. pp. 1105-1112.
208

Wine, P. H., D. H. Semmes, and A. R. Ravishankara, 1981 c, J. Chem. Phys. 15.., pp. 4390-4395.
Wine, P. H., W. L. Chameides, and A. R. Ravishankara, 1981d, Geophys. Res. Lett. a, pp. 543-546.
Wine, P. H., D. H. Semmes, and A. R. Ravishankara, 1982, Chem. Phys. Lett • .9Q, pp. 128-132.
Wine, P. H., J. M. Nicovich, R. J. Thompson, and A. H. Havishankara, 1983, J. Phys. Chem., in press.
Winer, A. M., A. C. Lloyd, K. R. Darnell, and J. N. Pitts, Jr., 1976, J. Phys. Chem • .a.o., p. 1635.
WMO Global Ozone Research and Monitoring Project, 1982, Report No. 11, The Stratosphere 1981: Theory and Measurements.
Wolfram, J., 1981, as quoted in Stief ~sl., 1982.
Wong, E. L., and F. H. Belles, 1971, NASA Tech. Note, NASA TN D-6495; 1972, Chem. Abs., ~, Abstract No. 18326q.
Wong, W., and D. D. Davis, 1974, Int. J. Chem. Kinet. ~, p. 401.
Wongdontri-Stuper, W., H. K. M. Jayanty, R. Simonai tis, and J. Heicklen, 1979, J. Photochem. lQ, p. 163.
Wurzburg, E., and P. L. Houston, 1980, J. Chem. Phys. La, p. 4811.
Yao, F., I. Wilson, and H. Johnston, 1982, J. Phys. Chem. ~, p. 3611.
Yoshino, K., D. F. Freeman, J. H. Esmond, and W. H. Parkinson, 1983, Planet. Space Sci. 31, pp. 339-353.
Zahniser, M. S., and F. Kaufman, 1977, J. Chem. Phys. ~, p. 3673.
Zahniser, M. S., and C. J. Howard, 1980, J. Chem. Phys. ~, pp. 1620-1626.
Zahniser, M. S., F. Kaufman, and J. G. Anderson, 1974, Chem. Phys. Lett. 2.1.., p. 507.
Zahniser, M. S., F. Kaufman, and J. G. Anderson, 1976, Chem. Phys. Lett. 31., p. 226.
Zahniser, M. S., J. Chang, and F. Kaufman, 1977, J. Chem. Phys. a, p. 997.
Zahniser, M. S., B. M. Berquist, and F. Kaufman, 1978, Int. J. Chem. Kinet. lQ, p. 15.
Zellner, H., 1978, Ber. Bunsenges. J. Phys. Chem. ~, p. 1172.
209

Zellner, R., 1982, private communication.
Zellner, R., 1983, private communication.
Zellner, R., and W. Steinert, 1976, Int. J. Chem. Kinet. a, pp. 397-409.
Zellner, R., and G. Wagner, 1980, The Sixth Symposium on Gas KinetiCS, Univ. of Southampton, July 14-17, 1980.
Zellner, R., and W. Steinert, 1981, Chem. Phys. Lett. at, pp. 568-572.
Zellner, R., G. Wagner, and B. Himme, 1980, J. Phys. Chem. ~, pp. 3196-3198.
Zetzsch, C., 1971, Ph.D. dissertation, Georg-August UniverSity, Gottingen.
Zetzsch, C., 1973, First European Sym. on Combust. (ed. Weinberg, F. S., Academic Press, London), p. 35.
Zhitneva, G. P., and S. Ya. Pshezhetskii, 1978, Kinetika i Kataliz ~, p. 296.
210 NASA-JPL-Coml LA CaI~

End of Document