chemical engineering educationufdcimages.uflib.ufl.edu/aa/00/00/03/83/00193/aa00000383_00193.pdf ·...
TRANSCRIPT

Vol. 45, No. 3, Summer 2011 157
Chemical Engineering Education Volume 45 Number 3 Summer 2011
CHEMICAL ENGINEERING EDUCATION (ISSN 0009-2479) is published quarterly by the Chemical Engi neering Division, American Society for Engineering Education, and is edited at the University of Florida. Cor respondence regarding editorial matter, circulation, and changes of address should be sent to CEE, Chemical Engineering Department, University of Florida, Gainesville, FL 32611-6005. Copyright © 2011 by the Chemical Engineering Division, American Society for Engineering Education. The statements and opinions expressed in this periodical are those of the writers and not necessarily those of the ChE Division, ASEE, which body assumes no responsibility for them. Defective copies re placed if notified within 120 days of pub lication. Write for information on subscription costs and for back copy costs and availability. POSTMAS TER: Send address changes to business address: Chemical Engineering Education, PO Box 142097, Gainesville, FL 32614-2097. Periodicals Postage Paid at Gainesville, Florida, and additional post offices (USPS 101900).
PUBLICATIONS BOARD
EDITORIAL ADDRESS:Chemical Engineering Education
c/o Department of Chemical Engineering723 Museum Road
University of Florida • Gainesville, FL 32611PHONE and FAX: 352-392-0861
e-mail: [email protected]
EDITOR Tim Anderson
ASSOCIATE EDITORPhillip C. Wankat
MANAGING EDITORLynn Heasley
PROBLEM EDITORDaina Briedis, Michigan State
LEARNING IN INDUSTRY EDITORWilliam J. Koros, Georgia Institute of Technology
• CHAIR •C. Stewart SlaterRowan University
• VICE CHAIR•Jennifer Curtis
University of Florida
• PAST CHAIR •John O’Connell
University of Virginia
• MEMBERS •Pedro Arce Tennessee Tech UniversityLisa Bullard North Carolina StateStephanie Farrell Rowan UniversityRichard Felder North Carolina StateJim Henry University of Tennessee, ChattanoogaJason Keith Michigan Technological UniversityMilo Koretsky Oregon State UniversitySuzanne Kresta University of AlbertaSteve LeBlanc University of ToledoMarcel Liauw Aachen Technical UniversityDavid Silverstein University of KentuckyMargot Vigeant Bucknell University
EDUCATOR 158 Pablo G. Debenedetti of Princeton University Jean W. Tom, Athanassios Z. Panagiotopoulos, and Richard A. Register
CURRICULUM 165 Lehigh Design Course Vincent G. Grassi, William L. Luyben, and Cesar A. Silebi 170 Introducing Risk Analysis and Calculation of Profitability Under Uncertainty in Engineering Design Georgia Kosmopoulou, Margaret Freeman, and Dimitrios V. Papavassiliou 178 Demonstrating the Effect of Interphase Mass Transfer in a Transparent
Fluidized Bed Reactor Jean Saayman and Willie Nicol
CLASSROOM 184 Improved Student Achievement Using Personalized Online Homework
for a Course in Material and Energy Balances Matthew W. Liberatore 193 A Moveable Feast—A Progressive Approach to the Unit Operations
Laboratory Wm. Curtis Conner Jr., Karl D. Hammond, and Robert L. Laurence
RANDOM THOUGHTS 191 Speaking of Education—IV Richard M. Felder
FUNDAMENTAL RESEARCH IN ENGINEERING EDUCATION 202 Introductory Remarks Phil Wankat 203 Identifying and Repairing Student Misconceptions in Thermal and Transport Science: Concept Inventories and Schema Training Studies Ronald L. Miller, Ruth A. Streveler, Dazhi Yang, and Aidsa I. Santiago Román 211 Development of Concept Questions and Inquiry-Based Activities in Ther-
modynamics and Heat Transfer: An Example for Equilibrium vs. Steady State
Margot Vigeant, Michael Prince, and Katharyn Nottis 219 Student Learning in Industrially Situated Virtual Laboratories Milo D. Koretsky, Christine Kelly, and Edith Gummer
OTHER CONTENTS 192 Invited Guest Editorial: Why I Teach (and Advise) Lisa Bullardinside front cover Teaching Tip: Spark ChE Students’ Interest in Chemistry Lab by Cooperative Strategy TawfikA.Saleh

Chemical Engineering Education158
ChE educator
Pablo G. Debenedetti of Princeton Universityby Jean W. Tom,* aThanassios Z. PanagioToPoulos, and RichaRd a. RegisTeR
* Chemical Development, R&D, Bristol-Myers Squibb© Copyright ChE Division of ASEE 2011
Meeting Pablo Debenedetti leaves a last-ing impression—that of a quintessen-tial “gentleman and scholar.” And the
more one learns about Pablo, the more that initial impression deepens. Today, Pablo has achieved high levels of success as a scholar, an educa-tor, and an academic administrator, garnering numerous and broadly recognized distinctions. Fewer know that Pablo has been an invaluable mentor to many, many undergraduates, graduate students, and younger colleagues. Here we have the opportunity to share some of these less well-known (but certainly no less important) qualities that our mentor and friend has in abundance.
GROWING UP IN ARGENTINA
Pablo was born March 30, 1953, in Buenos Aires, Argentina. Pablo was the younger of two boys born to Francine and Sergio Debenedetti. Pablo’s father’s family immigrated to Argen-tina from Italy in the late 1930s, while Pablo’s mother’s family originally hailed from France. Not surprisingly, Pablo grew up well versed in multiple languages, speaking Spanish, English, Italian, and French. His father was a civil engi-neer, at a time when Buenos Aires was in the midst of a construction boom. Pablo’s maternal uncle and paternal grandfather were also engi-neers. Pablo’s mother was a musician and one of the co-founders of the Collegium Musicum, a music school for children, in Buenos Aires. A talented pianist, she could be heard on the radio. So it’s not surprising that two of Pablo’s passions growing up, and to this day, are engineering and music. As a child, Pablo played both the
Pablo at Princeton’s June 2008 Commencement, receiving the President’s Award for Distinguished Teaching.
violin and piano. He also organized concerts and groups to attend concerts, and co-founded a youth division of the Mozarteum Argentino, a non-profit institution that promotes musical culture in Argentina and throughout South America. Pablo’s third passion growing up was soccer and at some point in his childhood he aspired to become a professional soccer player. As a young adult, Pablo also considered becoming a pianist.

Vol. 45, No. 3, Summer 2011 159
Fortunately for the engineering world, his father prevailed and dissuad-ed Pablo from either of these alternative vocations.
Pablo’s primary education in Buenos Aires was at St. Peter’s School and St. Andrew’s Scots School where classes were taught in Spanish and English. Pablo has enjoyed return-ing to his primary schools for class reunions; at his 25-year reunion, he was a runner-up for the “Gone with the Wind” (think baldness) category, and recently attended his 40-year reunion. Upon graduating from high school, Pablo entered the University of Buenos Aires, commuting from home to campus daily. He began his studies in industrial engineering and subsequently switched to chemical engineering, graduat-ing in 1978 with the degree Ingeniero Químico. As a univer-sity student, Pablo once fortuitously appeared on a popular Argentinian TV quiz show testing general knowledge called “Gane y aprenda” (“Earn and Learn”) hosted by Roberto Galan, a well-known Argentinian TV and radio personality. Pablo won several rounds on the show, earning both cash and fame, before exiting in the semi-final round.
With his degree in hand, Pablo obtained a position as a process development engineer with the De Nora Company in Milan, Italy. De Nora has its roots in chlorine and chlorate chemical manufacturing, and today is a world leader in provid-ing innovative electrochemical technologies. Pablo enjoyed his work as an engineer and living in Italy; he explored some new hobbies, such as cooking, for which he won an award in a local contest. After two years at De Nora, Pablo was offered an as-signment at a plant in Brazil. Seeking to further his education in chemical engineering (and not counting Portuguese among his many languages), Pablo declined the Brazilian assignment, left De Nora, and entered the Chemical Engineering Department at MIT the fall of 1980 to pursue a Master’s degree.
GRADUATE STUDY AT MITAt MIT, Pablo chose to work for Professor Costas Vayenas
(now at the University of Patras, Greece) for a Master’s degree
on “Steady State Analysis of High Temperature Fuel Cells,” extending his experience and interest in electrochemical systems and conducting the first mathematical modeling of solid oxide fuel cells. Recalling his interactions with Pablo, Costas Vayenas writes, “Pablo made an everlasting impres-sion on me and all members of the department as a truly out-standing person, happy with the successes of others, honest, humorous, eager to help everybody, always ready to tackle new scientific challenges, deep in his thinking, a true scholar. His broad classical education was evident in practically all his interactions but made a deep impression on me when he visited Patras a couple of years later. Pablo was quick to learn many Greek words and surprised everyone in the audience during his excellent seminar in our ChE department by his occasional clever use of Greek words and sentences. We drove to Olympia the next day and I realized that Pablo knew more about it than the vast majority of Greeks. Yet, in an effort to encourage Greeks to visit Olympia and other archeological sites, the Greek Government had established a rule that only ‘foreigners’ had to pay for a ticket. But, Pablo and I wondered, ‘who is a Greek and who is a foreigner?’ Isokrates had re-solved this a long time ago by saying that, ‘Greeks are those who participate in our education’ (having read some Homer or Plato is enough). So, as I convinced him to do, Pablo was right to say, as we entered the site in Olympia, slowly and with a big smile: ‘Hellinas emai’ (‘Greek I am’).”
Upon completing his Master’s degree in 1981, Pablo de-cided to stay at MIT to pursue a Ph.D. with the renowned thermodynamicist Professor Robert (Bob) Reid. Thermo-dynamics research in the early 1980s was dominated by supercritical fluids, highly compressible systems that can pass from a dense, liquid-like state to a dilute gas with a change
Pablo, age 3, already displaying a proclivity for scholarship.
Pablo (left), with his brother Claudio in Buenos Aires.

Chemical Engineering Education160
in pressure, without encountering a phase boundary. Pablo’s research was on diffusion and mass transfer in supercritical carbon dioxide and involved both experimental studies at high pressures and molecular dynamics calculations, using FORTRAN code that Pablo wrote from scratch, running on what would today be considered primitive and extremely slow computers.
Bob’s group at the time was relatively small, consisting of five or six Ph.D. students and one or two Master’s students. Bob made sure that the students had the freedom to pursue their research interests, even if they were not exactly in line with the promises he made to the funding agencies at grant application time. He was extremely generous with his time and took great interest in his students’ overall well-being and personal development. As a result of the small size of the group as well as Bob’s encouragement of open exploration and in-depth discussion, close friendships developed. Group meetings were frequently punctuated by heated arguments on science questions and constructive criticism of each other’s work. Perhaps as a consequence of his close mentoring, a large fraction of Bob’s group ended up in academic positions and still maintain close friendships and professional interactions (and graciously provided comments for this article). Sanat Kumar (now chair of Chemical Engineering at Columbia University), Richard Willson (now in Chemical and Biomo-lecular Engineering at the University of Houston), and Thanos Panagiotopoulos were recruited to Bob’s group in 1982, and with Pablo, ended up being the last group of doctoral students that Bob mentored before retiring in 1985. Since Pablo was a few years older than the rest of the group, he was often mis-taken for a faculty member when the group went out together, and group members presciently began calling him “Professor
Pablo” years before this title became accurate. Indeed, shortly after Pablo left MIT and joined Princeton, the remaining Reid Group members pre-dicted (in 1986 or 1987) that Pablo would eventually become chair of his new department, a prediction that turned out to be spot-on.
Pablo was clearly on an academic path since early in his graduate stu-dent years. For example, in the fall of 1982, Bob Reid was away for a week-long conference in China, so he enlisted Pablo to substitute-lec-ture for him in the graduate Chemi-cal Engineering Thermodynamics course (10.40). One of the authors of this article, who had just entered MIT as a graduate student, remem-bers vividly the strong impression Pablo made on the class with his
style, clear blackboard technique, and overall presence. A year later, Pablo (still a graduate student) was offered the rare opportunity to co-teach the entire semester of 10.40, splitting the lectures roughly 50/50 with Professor Howard Brenner. Pablo jumped at the chance, eager to pass along his excitement for (and vast knowledge of) thermodynamics to a new batch of eager graduate students in the span of about 7 weeks. An-other of the authors had the unusual experience of taking this incarnation of 10.40 from Pablo (for an MIT Master’s degree), followed by a nominally comparable course two years later (for a Princeton Ph.D. degree). While the latter course—which had a somewhat less ambitious syllabus, and spread the ma-terial over 12 weeks of lecture instead of 7—went down a bit easier, it was definitely less memorable. As another early example of Pablo’s commitment to education, his second scholarly article was published in this very magazine while he was still a graduate student, a single-author paper entitled “The Thermodynamic Fundamentals of Exergy” [Chemical Engineering Education, 18, 116 (1984)].
At the American Institute of Chemical Engineers Annual Meeting a year or so prior to his graduation, Pablo expressed his gratitude to his advisor by taking Bob Reid out to dinner. As the host, Pablo had the task of selecting the wine, even though his very limited experience in this area provided him with little basis to make an informed choice. By either keen intuition or dumb luck, he chose an excellent wine, which was much appreciated by Bob. Somehow, the statement “let him select the wine” found its way into Bob’s letter of recommendation when Pablo started applying for faculty positions. When Bill Schowalter (then Chair at Princeton) started discussing wines on the way to the interview din-ner and was told by Pablo that this is a topic on which he is
Pablo with Thanos Panagiotopoulos at the Great Wall of China, June 1988.

Vol. 45, No. 3, Summer 2011 161
completely ignorant, Schowalter responded, “I hope that the other statements by Bob Reid in his reference letter are more accurate.” The Princeton faculty must have believed the truth of Bob’s other statements, as an offer was made to Pablo and eventually accepted.
FAMILY LIFEPablo and Silvia (nee Strauss) have been married for 24
years. They first met as teenagers, when they both attended St. Peter’s and St. Andrew’s Schools in Buenos Aires. They met again about a decade later when Silvia spent the summer of 1981 in Boston during a fellowship at the Appalachian Moun-tain Club. At their first meeting that summer, Silvia thought it was strange that Pablo was wearing heavy corduroy pants in the hot humid Boston weather. Later, she learned that Pablo’s odd attire reflected the fact that he was spending all his time running computer programs in the heavily air-conditioned rooms which housed the (primitive and slow, but very power-hungry) computers. This also explained to Silvia why Pablo never answered his phone—he lived in the computer lab! They married in 1987, after Pablo had started at Princeton and before Silvia finished her Ph.D. at Yale, in a ceremony held in Princeton University’s Prospect Gardens. Pablo and Silvia share the common profession of science educators: Silvia was a faculty member in the biology department at Montclair State University, organizer of Sigma Xi’s K-12 science outreach programs at Princeton, and since 1999, has been teaching at
the Princeton Day School, where she has been chair of the middle school science department since 2000. From 2000-2004, the Debenedettis shared the joys and tribulations of concurrently chairing their respective departments.
In 1990, their son Gabriel was born; he is currently a politics major at Princeton University, and also the editor-in-chief of the Daily Princetonian newspaper. Their daughter, Dina, was born in 1993; she is currently in high school with strong interests in bioethics and medicine. Early in their time at Princeton, the Debenedettis inherited a dog from Bill and Jane Schowalter, when the Schowalters left for France on sabbatical and later for the University of Illinois. Today, the Debenedetti family is rounded out by 7-year-old Tigger, a Bernese Mountain dog. The Debenedettis enjoy traveling and as a family have visited China, as well as several European and South American countries. They also immensely enjoyed a year (1991-’92) at UC-Berkeley, where Pablo had the plea-sure of spending his first sabbatical leave collaborating with Professor John Prausnitz ’55 H’95. They were there during the Oakland fire; while they were required to vacate their residence, fortunately the house did not sustain any harm.
When not busy with work and family, Pablo enjoys several hobbies, notably a love for classical music and opera; he often attends the Metropolitan Opera in New York City. Pablo has amassed a vast collection of classical music CDs, encom-passing multiple versions of the same piece. His favorite composer, by far, is J.S. Bach. He has a knack for identifying pieces, Opus number and all, and despite his best efforts, none of the other members of his family seem to have inherited this skill. A highlight for Pablo was a 10-day vacation in Salzburg, Austria, in 2004 with Silvia, when they attended many con-certs, operas, and recitals. In stark contrast to Pablo’s highly refined auditory interests, his favorite visual experiences are
Pablo and Silvia on their wedding day, in Princeton’s Prospect Gardens.
Pablo and Silvia’s children, Gabriel and Dina, in 2009.

Chemical Engineering Education162
watching horror movies and the Three Stooges. While Pablo no longer plays soccer or coaches Gabriel in the Princeton town recreational leagues, he remains an ardent fan of the sport, particularly every four years when the World Cup oc-curs; don’t look for Pablo on campus when Argentina or Italy is playing a match!
Pablo is also a history buff, a hobby first pursued by read-ing history books, and now by watching the History Chan-nel. One area of particular interest is the two World Wars, as some of Pablo’s relatives served in those conflicts; a second is the history of science and those who advanced it. Quoting former student Scott Shell, Ph.D. ’05, now at the University of California – Santa Barbara: “Pablo’s fervor for science seemed to be nearly matched by his love of science history. I remember that I had read a biography on Boltzmann my first year in graduate school; Pablo was elated to hear about it (more than I had expected) and we had several engaging conversations on the topic. Later, I saw this love in full view in his statistical mechanics course. Every third lecture or so would have a historical sidenote, where Pablo would discuss the life of a particular scientist who was relevant to that week’s topic (Gibbs, Planck, Einstein, etc.). It was a wonderful way to provide a story line, full of mysteries and epiphanies, that created a high level of excitement for such a mathematical course. I was so impressed with this technique that I now rou-tinely insert mini-biographies of the same sort in my classes. The students love it.”
PRINCETON UNIVERSITYPrinceton’s faculty members were overjoyed when Pablo
accepted their offer over the competition, and when he
arrived as a new assistant professor in February 1985. Pablo was rapidly promoted to associate professor in 1990, to full professor in 1994, and to his current position as the Class of 1950 Professor in Engineering and Applied Science in 1998. At Princ-eton, Pablo has built a world-class program focusing on, over the years, the thermodynamics and statistical mechanics of liquids and glasses; particle formation from supercritical fluids; the thermodynamics of water and aqueous solutions; and most re-cently, the origin of chiral asymmetry in the terrestrial biosphere.
But what his students remember most about their time in his group was Pablo’s individual attention to each and every one of them. Tom Truskett, Ph.D. ’01, now at the Uni-versity of Texas – Austin, writes: “One of the incredible things about
Pablo—which I’ve really grown to appreciate of late—is how successful he is about protecting substantial blocks of time for mentoring, e.g., discussing science with his research group. During the period I was at Princeton as a Ph.D. student, a group of two or three of us would meet with Pablo and Frank Stillinger for hours of uninterrupted time on Friday afternoons. Looking back, so many key ideas came out of those productive discussions. As students, we were learning how to think rigorously and creatively about science in those meetings, probably the most valuable part of our education.” From Andy Ferguson, Ph.D. ’10, soon to join the University of Illinois at Urbana-Champaign: “During my first semester in the group, there was no statistical mechanics course offering until the following year, so Pablo provided me with the singular opportunity of one-on-one weekly meetings in which he educated me in the rudiments of statistical thermodynamics. Together we worked through a number of sample problems and fundamental concepts which stood me in good stead to commence my doctoral research with a sound theoretical grounding. At the time I certainly didn’t appreciate the true value of his expert and generous mentoring—particularly when I was banging my head against my desk trying to wrap my first-year mind around grand potentials and Bose-Einstein condensation—but those Friday afternoons have since become one of my fondest memories of my graduate school career.” And from Jane Werling, Ph.D. ’01, now with Baxter Healthcare: “He struck the right balance between al-lowing his students enough freedom to learn independently (and make mistakes along the way) and keeping us focused and on track to complete the degree requirements.”
Current and former Debenedetti Group members celebrate Pablo’s election to the National Academy of Engineering at the Debenedetti home in 2000.

Vol. 45, No. 3, Summer 2011 163
Indeed, part of student mentoring is enriching the intellectual environment in which those students live. Pablo has enticed several long-term visitors to plant their flag at Princeton, not only Frank Stillinger (formerly at Bell Laboratories), but also Brian Pethica (former director of research at Unilever, and dean of science at Clarkson), and Vern Weekman (former director of research for Mobil Oil, and president of Mobil Solar Energy), who have interacted with undergraduates and graduate students all across Princeton’s Chemical and Biological Engineering Department and beyond.
Pablo has always had a capacity for productive work that has astounded his students and colleagues alike. Mike Win-ters, Ph.D. ’99, now at Merck, writes: “Thinking back, what I remember the most about Pablo was his work ethic. I recall that after a full day on campus he would often work from his home office until late into the night. I was always amazed by how much work Pablo could manage.” But while working long hours on his teaching and launching his research program, Pablo still managed to have some fun even as an assistant professor. Carolyn Bolton, Ph.D. ’89, recalls: “Pablo always has a joyful countenance! He loves people and he loves his work. In addi-tion to people, Pablo loved dogs. The administrative secretary at the time, Betty Bixby, brought her poodle Sandy to work with her each day. Pablo loved kicking the ball down the hall for Sandy to fetch. Until that ill-fated day… Pablo kicked the ball, it took a bad hop, and bounced into Sandy’s eye! The dog would never again come out into the hall to play with Pablo.” Which, presumably, left Pablo with even more time to devote to his research and teaching. Or to helping Silvia host memorable dinners for his research group at their home, complete with “amazing” pasta dishes, thanks to Silvia.
Among Pablo’s first research directions at Princeton was the study of metastable liquids. One of the authors remembers vivid discussions with Pablo at a thermodynamics conference in Helsingør, Denmark (site of “Hamlet’s castle”), where Pablo advocated that the study of metastable liquids could provide insights into nucleation, protein stability, the glass transition, and the behavior of water in unusual environments that could have important technological applications as well as fundamental scientific interest. As usual, Pablo turned out to be correct in his foresight. Pablo’s first decade at Princeton was capped in 1996 by the publication of his monograph, Metastable Liquids: Concepts and Principles, by Princeton University Press—today the standard reference in the field, which has educated several generations of graduate students
and researchers. This book quickly garnered substantial rec-ognition throughout the academic community and beyond, winning the title of “Best New Professional/Scholarly Book in Chemistry for 1996” from the Association of American Publishers—as much for the clarity of the presentation as for the authoritative nature of the work.
Indeed, clarity in exposition, whether orally or in writing, has always been a hallmark of Pablo’s, and something which he has consistently fostered in his students. From Jane Werling ’01: “I remember how he unswervingly insisted on clarity in thought, in writing, and in presentations, and his guidance in these areas still influences me today.” And from Mike Winters ’99: “As an advisor, he was excellent at returning comments and edits on draft manuscripts in a timely fashion. I learned a lot from him in terms of technical writing; he is an excellent writer and is able to clearly articulate his thoughts. Before presentations, Pablo would work with his students to improve their presentation skills.”
Especially in today’s world of incessant e-mails, one hallmark of Pablo’s civility and gentlemanly grace stands out: important events still merit a thoughtful handwritten note from Pablo, in his distinctive blue-ink fountain pen, executed with impeccable penmanship (surely unmatched by any Princeton Chemical Engineering faculty member before or since). Whether it’s a laudatory note to a faculty member who received an exceptional teaching evaluation, an encouraging note to a promising un-dergraduate struggling in thermodynamics, or a congratulatory note to a former student who received a distinction in his or her own career, those notes are still remembered fondly by their recipients many years later.
Pablo on-stage at Princeton Chemical Engineering’s annual Bierabend (2000), with Jay Benziger and Rick & Jeffrey Register.

Chemical Engineering Education164
Pablo’s leading scholarship has been recognized through major awards from the American Institute of Chemical Engineers (Professional Progress Award, 1997; William H. Walker Award, 2008; inclusion among the “100 Chemical Engineers of the Modern Era” at AIChE’s 2008 Centennial), as well as the American Chemical Society (Joel Henry Hil-debrand Award, 2008). In 2000, Pablo was inducted into the National Academy of Engineering, a capstone distinction for any engineer, “for microscopic theory, insight embodied in a scholarly monograph, and application of supercritical and metastable fluids.”
For all his scholarly achievements, Pablo has devoted him-self in equal measure to teaching. For several years, Pablo taught Princeton’s undergraduate thermodynamics course, and those students lovingly tagged him with a nickname that still resonates today: “The Therminator.” Chris Roberts, Ph.D. ’99, now at the University of Delaware, writes: “Pablo has always been an excellent lecturer (i.e., classroom teaching as well as in research), and in hindsight, this stems from his ability to distill complex problems to their essentials, and to do this and present it at a level appropriate to the audience. That ap-proach is something that I try to emulate and pass along to my students, as it is a model for teaching and research (and many other things in life, it seems).” There are three qualities which stand out as descriptors of Pablo’s teaching. First, he truly teaches his students how to think: to first conceptualize and then apply new ideas, rather than simply showing them a formulaic approach to solving particular types of problems. To reach this goal, Pablo firmly grounds his courses in the fundamentals of the subject, providing the students a solid base for their own work. Second—perhaps a corollary of the first—Pablo recognizes that different students learn differ-ently, and a new concept may be best explained to different students in different ways. Both in lecture and in his office hours, he will tirelessly approach the exposition of a new concept from various directions until he finds the method that allows a particular student to internalize the idea. Third, Pablo always makes himself accessible to his students (all the more remarkable given his other obligations, and facilitated by the fact that he doesn’t seem to need much sleep), and takes a personal interest in each one.
In 2008, Pablo’s excellence in teaching was simultaneously recognized by Princeton with both the President’s Award for Distinguished Teaching, and the School of Engineering and Applied Science’s Distinguished Teacher Award. From among the dozens of letters provided by students in support of his nominations for each of these awards, certain particular quotes stand out. From a student writing about undergraduate ChE thermodynamics: “It is not often that a class is so well taught that beyond learning material, a student grows from the experience to become a more analytical and deep thinker. Professor Debenedetti’s course in thermodynamics has cer-tainly provided the framework for me to grow.” Describing
an integrated freshman course in engineering, math, and phys-ics: “As you can imagine, the transition between high school and college can be daunting, but Professor Debenedetti’s easy demeanor and approachability made for a fun learning experience…. He even stayed with us students after hours in lab to make sure we could see and understand how solar cells worked. As we constructed mini fuel cell cars and took power output measurements, he would also tell stories about his fam-ily, Argentina, and occasionally—Astor Piazzola.” Regard-ing graduate ChE thermodynamics: “Honestly, I don’t like Thermodynamics…. But despite that, I really loved the class, just because of the way he taught it…. I now have a pretty thorough understanding of the material, and more importantly, a greater confidence in my ability to respond to intellectual challenge.… Watching the way Prof. Debenedetti conducted himself made me think that this is the way teaching should be done, and I know that he will always remain a role model for me throughout my professional career.” About a course in statistical mechanics: “Professor Debenedetti delivered many lectures on complex mathematics and physics and did so with an eloquence that I have not seen (elsewhere) in my educa-tional career. It was obvious that each lecture was carefully crafted from a variety of sources to provide the clearest and most intuitive understanding of the physical phenomena.” And finally, from a student in undergraduate ChE thermo, describ-ing a one-on-one meeting with Pablo: “Our meeting refueled my confidence and left me determined to do much better on the final exam. When I spoke to other students in the course about this experience, they all nodded in agreement. Some of them had also received handwritten notes and similar words of encouragement from Professor Debenedetti. One student pointed out that if it were not for Professor Debenedetti, she would have dropped the course.”
Finally—as if exceptional distinction in both research and teaching were not enough for one person—Pablo has also taken on positions of increasing responsibility in academic administration at Princeton, first serving as director of Gradu-ate Studies for Chemical Engineering (1990-’91 and 1992-’94, a role he reprised in 2006-’08), then as chair of Chemical Engineering for two terms (1996-2004), and currently as the first vice dean for Princeton’s School of Engineering and Ap-plied Science (2008-present). During Pablo’s tenure as chair, both Athanassios Panagiotopoulos and Stanislav Shvartsman joined the Princeton faculty, and the Department of Chemical Engineering substantially expanded its laboratory facilities through the conversion of former teaching spaces when the latter moved into the new Friend Center for Engineering Edu-cation. Now as vice dean, one of Pablo’s main projects has been planning the physical space for the Andlinger Center for Energy and the Environment, a 127,000-square-foot labora-tory building to open in 2015. Pablo’s achievements in these areas will be reflected in both the intellectual and physical landscapes of Princeton for many decades to come. p

Vol. 45, No. 3, Summer 2011 165
Vince Grassi is the director of Global Learning at Air Products and an adjunct professor of chemical engineering at Lehigh University. Vince has more than 32 years of engineering, management, and global business industrial experience. He has a BS from the University of Rochester, and M.S. and Ph.D. degrees form Lehigh University, all in chemical engineering.
William L. Luyben is a professor of chemical engineering at Lehigh University. He received his B.S. from Penn State and Ph.D. from the University of Delaware. He teaches Unit Operations Laboratory, Process Control, and Plant Design courses. His research interests include pro-cess design and control, distillation, and energy processes.
Cesar A. Silebi is a professor of chemical engineering at Lehigh Uni-versity. He received his B.S. from Universidad del Atlantico in Colombia and his Ph.D. from Lehigh University. He teaches Heat Transfer, Mass Transfer, and Process Design courses. His research interests include electrokinetic and hydrodynamic fractionation of colloids and rheology of dispersions.
© Copyright ChE Division of ASEE 2011
The traditional senior capstone design course has been an integral part of the chemical engineering curriculum for many decades. A recent paper by Biegler, et al.,[1]
discusses the importance, history, and trends. The course is usually a single semester and covers only steady-state aspects of process synthesis (flowsheets, economics, and optimization).
The desirability of combining steady-state and dynamic design has been discussed in process design circles since the pioneering work of Page Buckley at DuPont in the 1950s. Pa-pers and books have been written. Talks have been presented. Symposia have been run. The advantages of coupling design and control have been clearly identified. The simulation tools (software and hardware) are available. Design and control methodology has been developed and documented.
It appears, however, that little of this “theology” has been implemented in chemical engineering senior design courses. In almost all chemical engineering departments, process de-signs are developed with little or no consideration of whether or not the process is controllable. In our opinion, this repre-sents a major flaw in the education of chemical engineers. Old war stories abound of multi-million-dollar plants that have been built but could never be economically and safely oper-ated because of dynamic instabilities. The senior author of this paper has taught process control courses at Lehigh University for many years. Up until two decades ago, his research was in the area of process control of individual units (distillation columns and reactors) and control structures and tuning issues. He was not involved in teaching the senior design course, which was taught by faculty with strong engineer-ing backgrounds (Alan Foust, Leonard Wenzel, Matt Riley, Marvin Charles, and Harvey Stenger). In the mid 1990s the research began to consider broader plantwide control issues in collaborative work with Bjorn D. Tyreus and Michael L. Luyben of DuPont.
The need to incorporate this technology into the Lehigh design course was argued at faculty meetings. As usual, the result was “If you think it is a good idea, you have the job
of doing it!” For several years we struggled to shoehorn the material into our one-semester design course. Finally the faculty recognized the importance of the subject, and our curriculum was modified in 1995 to include a two-semester design course.
Many of our ideas for the design course came from produc-tive contacts with Warren Seider at the University of Penn-sylvania, who has used industrial consultants in his design course for many years. He was the source of many industrial contacts and suggestions for design projects.
We recognized that design, optimization, and control were subjects that needed to be included in design courses. Chris Floudas at Princeton shared this view. To follow up on these ideas and develop the technology, NSF funding was obtained for Penn, Princeton, and Lehigh in 1996. Funds were used for computer-aided classrooms and courseware development.
The scope of the Lehigh design course and its format have remained essentially the same during the subsequent decade. The course format works well as evidenced by the fact that essentially all of the student groups are able to complete the process design and plantwide control of complex chemical plant processes using a commercial
LEHIGH DESIGN COURSE
ChE curriculum
VincenT g. gRassi, William l. luyben and cesaR a. silebi LehighUniversity•Bethlehem,PA18015

Chemical Engineering Education166
grade process simulator. The industrial consultants serve to validate the quality of the work product. These are dis-cussed in the following sections.
FORMAT Groups of not-more-than three students are formed at the
beginning of the fall semester. There are many methods for selecting groups, but we believe the completely random “vol-leyball” method is fair and effective (line up students by height and count off by the number of groups to be formed). Group dynamics are an important element of the course, which the students do not experience in any other course.
Each group meets with an industrial consultant who has gener-ated a brief write-up of the design project. The students and the consultant use primarily e-mail and net-meeting to stay in contact during the year. Table 1 lists past and present consultants.
The course uses team teaching with two Lehigh faculty and an adjunct professor with extensive industrial experience in both process design and process control. All of the faculty are knowledgeable in both steady-state and dynamic simulation.
TABLE 1Present and Past Industrial Consultants
Art Abriss Sun Oil, retired
Don Bartusiak Exxon-Mobil
Paul Belanger Praxair
Jim Case Air Products
Allan Cheung Exxon-Mobil, retired
Brad Cook Air Products
Bert Diemer DuPont
Glenn Dissinger Aspen Tech
Mike Dou Exxon-Mobil
Ted Fidkowski Air Products
Vince Grassi Air Products
F. Glen Gallagher DuPont
Tom Hanson Praxair
Dennis Hendershot Rohm&Haas, retired
Keith Holtermann Air Products
Miles Julian DuPont, retired
Gary Kohler Exxon-Mobil, retired
Glenn Kinard Air Products, retired
Ed Longwell DuPont
Gene A. Lucadamo Air Products, retired
Bryon Maner Air Products
Larry Megan Praxair
Bob Moore Air Products, retired
Ron Myers Rohm&Haas, retired
Frank Petrocelli Air Products
John M. Repasky Air Products
Dave Prior Air Products
Dave Short DuPont, retired
Walt Silowka Air Products
Oliver Smith Air Products
Bjorn Tyreus DuPont
TABLE 2Schedule Fall and Spring Semesters
Week Recitation Topic Lecture Topic
Fall
1 Organization, Group Selection Design Fundamentals
2 Introduction to AspenPlus Consultant Presentations
3 Reactors in AspenPlus Reactor Design
4 Columns in AspenPlus Distillation Design
5 Progress Report No. 1
6 Recycle in AspenPlus Energy Systems
7 Ternary Diag., Azeotropes Azeotropic Distillation
8 Group Meetings Economics
9 Group Meetings Economics
10 Group Meetings Project Leadership
11 Progress Report No. 2
12 Group Meetings
13 Group Meetings
14 Group Meetings
First-Semester Written Report
Week Recitation Topic Lecture Topic
Spring
1 Intro to Aspen Dynamics Control Basics
2 Columns in Aspen Dynamics Distillation Control
3 Reactors in Aspen Dynamics Reactor Control
4 Recycles, Ratio, Flowsheet Eqn. Plantwide Control
5 Progress Report 1
6 Group Meetings Process Safety
7 Group Meetings Process Safety
8 Group Meetings Equipment Safety
9 Progress Report No. 2
10 Group Meetings Human Factors
11 Group Meetings Sustainability
12 Group Meetings
13 Group Meetings
14 Group Meetings
All-Day Oral Presentation of Design Projects to Consultants and Faculty Final Written Report Covering Both Semesters

Vol. 45, No. 3, Summer 2011 167
Team teaching provides a spectrum of perspectives and technical expertise that enhances the learning experience of the students.
Lectures are presented that give the students the principles and guidance they need to complete their projects. Recitation sessions are held to provide hands-on experience with the Aspen simulations in a laboratory environment. The students are coached in the recitations on how to use the simulators, what to look out for, and how to analyze the results. Table 2 gives the course syllabus for the fall and spring semesters.
Homework assignments are given early on in the course so that the students can apply what they have learned in the lec-tures and recitations. This helps them understand the material and makes their work on their projects more productive.
Oral progress reports are given by the students twice during each semester. At the end of the spring semester, an all-day meeting is held with consultants at which the students present their final results. Written reports are submitted at the end of each semester.
Regularly scheduled, frequent “one-on-one” meetings are held with the faculty and each individual group to review progress, answer questions, and provide technical assistance.
Guest lecturers from industry with extensive expertise in special areas are used to cover several important topics. Miles Julian gives several lectures covering practical engineering economics and provides a spreadsheet to facilitate economic analysis. Dennis Hendershot and Bob Rosen give excellent lectures in their area of expertise, process safety.
The emphasis on process safety is essentially the only exposure to safety our students receive. Quantitative stud-ies of dynamic reactor runaways and vessel over-pressuring can be made with the dynamic simulations of the process equipment. This safety analysis component of the process is a major advantage of incorporating dynamic simulation in the design course.
SCOPE The two-semester course covers the traditional capstone
design course topics plus dynamic plantwide control. The subject matter is summarized below.
1. IntroductiontoProcessSynthesisandAnalysis–flow-sheets, material and energy balances, reaction and separation sections, recycle, energy systems (steam, power, and refrigeration)
2. Distillation Column Synthesis – alternative sequences, pressureselection,refluxratio/numberoftraystrade-off,columnsizing,andauxiliaries.
3. Reaction Systems – alternative types of reactors, getting kinetics from performance data, importance of heat transfer,recycle/sizetrade-off
4. Engineering Economics – sizing, equipment and operat-ingcosts,profitability
5. Design Optimization – degrees of freedom, design opti-mization variables, heuristics
6. ProcessSafety–fundamentalsofexplosions,inherentlysafer design, case studies, relief-valve design, dynamic runawayofreactivesystems,dustexplosions
7. Dynamic Controllability – control of individual units, plantwide control, controller tuning, management of fresh feeds.
8. In-depth practice with Aspen Plus and Aspen Dynamics covering the use of these industrial grade simulators for plantwide processes with separation, reaction, and recycle.
TYPICAL PROJECTS There are 12 to 15 separate projects each year. Several
recent projects are listed below.
1. Hydrotreating for the production of low-sulfur diesel 2. Isomerization of n-butane 3. Refinery light-ends 4. Carbonylation of DME to produce methyl acetate 5. Conversion of methyl acetate to acidic acid 6. Production of DME from methanol 7. Production of MTBE 8. Combustion turbine with CO2 recovery 9. Steam methane reforming to produce H2 10. Production of monoisopropyl amine 11. Alkylation of C4 olefins 12. Production of dimethyl acetamide 13. Production of ethyl lactate 14. Drying distillers dry grain using DME 15. Ethanol from ethylene 16. Coal gasification for syn gas production 17. Syn gas to methanol 18. Production of ethylene oxide 19. Production of butyl acetate 20. Production of ethyl benzene 21. Production of styrene 22. Liquid hydrogen
STUDENT COMMENTS 1. SofartheCHE234designcoursehasbeenverybenefi-
cial for my understanding of process design and control and crucial to understanding and completing my design project.

Chemical Engineering Education168
2. I have learned that I need to fully understand the objectives and scope of the problem to be solved before using Aspen. This saves me a lot of time to diagnose a process problem from a use of the simulator problem.
3. The homework and recitations are very helpful. They allow me practice applying the principles of process designbeforeItacklethemoredifficultprojectproblem.
4. Aspenisverypowerfulandcomplex.Ihavelearnedthat one small mistake in coding Aspen can lead to manyhoursfixingit.ThereforeIhavelearneditisessential to understand how the simulator works and couldbeappliedtomyspecificproblembeforeenteringit into Aspen.
5. TheprojecthastaughtmealotmorethanIexpected.Ihave a better understanding how systems thinking must be applied to process design.
6. My team learned how team communication is im-portant. We need to coordinate how we divide up the problem, rather than just assigning a section to each team member.
DESIGN/CONTROL EXAMPLE It might be useful to present a simple example of the de-
sign/control issues that are core of the Lehigh design course. Consider the two alternative flowsheets shown in Figure 1. The chemistry is A→B. Component A is more volatile than component B, so any unreacted A goes overhead in the distil-lation column and is recycled back to the reactor.
The process on the left features a moderately sized reactor, so the conversion is somewhat low. A fairly large distillation column is required to recycle the reactant. Reactor size is given in gallons.
The process on the right is designed for higher conversion, so a bigger reactor is required. The column is smaller.
An economic analysis reveals that the total annual cost of the flowsheet on the left is smaller than that of the flowsheet on the right. Total annual cost includes energy cost and an-nual capital cost.
So which process should be built? The Lehigh answer to this question is “We do not know!”
Figure 1. Alternative processes.

Vol. 45, No. 3, Summer 2011 169
Until dynamic controllability is assessed, we do not know which flowsheet is “best.”
The results of dynamic testing of the two processes are shown in Figure 2. The plant with the smaller reactor shows much more product quality variability as disturbances enter the system. The larger reactor does a better job of filtering these disturbances.
“On-aim” control is assumed, so anytime the product impu-rity is outside the control band production during these periods represents a cost. The product must be reworked, sold for less, or disposed of. The capacity factor is defined as the fraction of the time that on-spec product is being produced.
The small-reactor process is out-of-spec 29% of the time. The large-reactor process is only out-of-spec 7% of the time. The size of the equipment must also be increased to produce the required net production rate. The net effect is that the profit of the small-reactor process is about half that of the large-reactor process. Remember that the steady-state economic criterion of total annual cost showed that the small-reactor process was less expensive.
This example illustrates one practical approach to the issue of how to balance steady-state economics with dynamic oper-
ability, which is discussed in the course. The capacity factor method looks at both TAC (total annual cost of energy and capital) and the economic results of making off-spec product (larger plant needed to achieve required production rate and cost of handling the off-spec material).
CONCLUSION The incorporation of dynamics into the plant design course
is essential in the education of our chemical engineering students. Covering only steady-state design is studying only half the problem. The Lehigh design course illustrates one way to satisfy this need.
REQUIRED TEXTBOOKS 1. Luyben, William, Distillation Design and Control Using Aspen Simula-
tion, AIChE, Wiley-Interscience, 2006 2. Turton, Richard, et. al, Analysis, Synthesis, and Design of Chemical
Processes, 2nd Ed., Prentice Hall, 2003
REFERENCE 1. Biegler, L.T., I.E. Grossmann, and A.W. Westerberg, “Issues and Trends
in the Teaching of Process and Product Design” AIChE Journal, 56, 1120-1125 (2010) p
Figure 2. Load responses.

Chemical Engineering Education170
Engineering economics is typically taught in chemical engineering design courses. Such courses are focused on cost estimation for equipment and processes, on
the calculation of product cost and profit, and the calcula-tion of profitability criteria in order to determine whether a process can be economically sustainable and profitable for a corporation or not. Even though these economic calculations incorporate the time value of money, effects of inflation, amortization costs, etc., they usually do not emphasize the fact that all cost or profit factors are not deterministic, but are subject to financial uncertainty. In fact, the prices of raw materials and products, the cost of energy and labor, and the financial landscape during the time period that a process will be in operation are likely to depend on factors that are outside of an engineer’s control (e.g., natural disasters, international conditions). At the same time, the literature in management and in industrial economics is rich in the presentation of mod-els that can handle and quantify uncertainty and risk (see, for example, Reference 1). Corporations that employ chemical engineers have, of course, utilized such models for planning and pricing policies and for taking decisions for many years. Risk analysis has received attention on and off in the last 30 to 40 years, as evidenced with sections on decision making and risk in textbooks.[2,3] The undergraduate curriculum in chemical engineering needs to remain updated in this area, and this updating can be done without extensive additional work on the part of the instructors.
INTRODUCING RISK ANALYSIS AND CALCULATION OF PROFITABILITY UNDER UNCERTAINTY IN ENGINEERING DESIGN
ChE curriculum
geoRgia KosmoPoulou, maRgaReT FReeman, and dimiTRios V. PaPaVassiliou
TheUniversityofOklahoma•Norman,OK73019
Dimitrios Papavassiliou is a Presidential Professor at the School of Chemical, Biologi-cal, and Materials Engineering at the Univer-sity of Oklahoma. He has received a Diploma from the Aristotle University of Thessaloniki, and M.S. and Ph.D. degrees from the Uni-versity of Illinois at Urbana-Champaign. His research interests are in turbulent transport, transport in porous media, microfluidics, and computational transport. He has been teach-ing Design I for more than 10 years.
Georgia Kosmopoulou is the Edith Kin-ney Gaylord Presidential Professor at the Department of Economics at the University of Oklahoma. She has received a B.S. from the University of Piraeus and her M.S. and Ph.D. from the University of Illinois at Ur-bana-Champaign. Her research interests are in industrial or-ganization, auc-tion theory,and mechanism de-sign.
Margaret Freeman is a senior student in the accelerated M.S./B.S. program in chemical engineering at the University of Oklahoma. She is also pursuing a minor in entrepre-neurship for engineering majors and is the recipient of an NSF-REU fellowship.
© Copyright ChE Division of ASEE 2011
Recently, renewed effort has been placed on the introduction of risk analysis in chemical engineering design.[4] At the most recent Annual AIChE Meeting, in Salt Lake City (November

Vol. 45, No. 3, Summer 2011 171
2010), in addition to our presentation,[5] there was one more presentation describing a new one-credit-hour course at the University of Michigan on risk analysis with expected profit.[6] Note that most mod-ern textbooks in chemical engineering design and in engineering economics used within other engineering disciplines offer a “risk free” content—calculations of profitability criteria do not account for financial risk. (An exception among recently published books is the third edition of Turton, et al.,[7] which includes a section on risk analysis).
Lately, through collaboration between chemical en-gineers and economists, we have developed classroom material that introduces the concepts of financial risk and decision making under uncertainty in Design I, a course that introduces engineering economics to chemical engineers who lack an extensive economics background. In a prior Chemical Engineering Edu-cation paper,[8] we discussed decision making based on expected profit and on expected utility, the use of decision-tree analysis, and also the development of classroom games (or class experiments, as they would be called in the economics literature) that demonstrate the concept of the utility function and strategic deci-sion making. In addition to discussing the educational objec-tives of each game, we discussed the mechanics of carrying out such experiments in the classroom. The concepts that were explored with those games can be used to quantify risk and facilitate decision making under uncertainty by modifying the way profitability is calculated. In the present work we demonstrate first the use of assignments and examples from everyday life to introduce the idea of financial uncertainty. Then we discuss how to quantify risk with Monte Carlo meth-ods and how to take it into account in profitability calcula-tions depending on the attitude of the decision maker towards risk. Such an approach, based on indifference curves and the notion of certainty equivalence, incorporates the subjective character of handling risk into the decision process and takes the students beyond the simple calculation of expected values. We also discuss the use of software that is readily available in assignments for the class.
INTRODUCING THE CONCEPT OF FINANCIALUNCERTAINTY
In our course, we try to illustrate financial uncertainty quite early in the semester. As part of the first assignment that the students receive, they are asked to establish a fictitious con-sulting company and then to recommend to their first client a production policy based on data and on forecasting of energy prices. Specifically, the students are asked to propose whether a small independent hydrocarbon producer in Oklahoma should stop production in a well and, instead, use the well to re-inject all or parts of the gas that another well is producing,
thus boosting hydrocarbon production from that second well. The details of the assignment are not important for our current discussion. What is important is that in order to respond to this problem, the students need to forecast the price of natural gas and the price of oil two years into the future. Data related to the price of oil and gas during the past decade are also offered as part of the assignment (see Table 1).
There is some implicit but useful information in Table 1: the prices shown are for “West Texas Intermediate” (as opposed to crude from other origins), and there is a peculiarity in the oil industry to use the roman symbols “M” to indicate 103 and the roman symbol “MM” (thousand)(thousand) to indicate 106. Other than that, the price prediction task initially appears trivial; maybe a plot of the values followed by a linear or poly-nomial fit can do the job (easy tasks for seniors having access to Excel). As the students plot the data and start thinking about how to extrapolate the prices into the future, however, they realize that this is not as trivial as it might seem. The more inquisitive students find even more historical data, and that can complicate things further, since energy prices dropped significantly in the late ’90s, but have been on the rise for a considerable part of this past decade, only recently dropping back.1 There are local minima and maxima, there is no clear direction, and the ratio of the oil to gas price is not constant. Neither does a periodic pattern emerge. In fact, one student in Fall 2010 told the instructor “This is impossible—I asked my mom who is an economist!” Some student groups end up
1 As can be seen in Table 1, in the middle of 2008 the price of oil in-creased to a level that was nearly 4 times higher than that of 2003.
TABLE 1Historic Data for the Price of Oil and Natural Gas
Date Oil Price(West Texas Intermediate, $/bbl)
Natural Gas Price($/MMBTU)
01/09/1999 9.50 1.95
03/01/2000 25.60 2.33
09/01/2000 33.25 4.79
08/24/2001 23.25 3.00
08/26/2002 25.50 3.50
08/27/2003 28.75 5.25
08/23/2004 44.00 5.50
08/18/2005 59.75 9.6
08/18/2006 66.75 6.7
08/18/2007 69.00 6.2
08/27/2008 114.65 8.7
08/25/2009 72.54 3.2
08/25/2010 68.15 4.9
The dollar values are not adjusted for inflation. The price of oil has been obtained on the dates indicated from<http://octane.nmt.edu/gotech/Main.aspx>, and the price of natural gas has been obtained on the same dates from <http://tfc-charts.w2d.com/chart/NG/M>.

Chemical Engineering Education172
using the price of futures for oil and gas that are available in the NYMEX (New York Mercantile Exchange).
Even though time-series analysis and calculation of seasonal and cyclical variations can be used to forecast in a reasonable way future prices of most commodities (see for example Chap-ter 6 in Reference 1, or Chapter 8 in Reference 2), the price of oil and gas is fluctuating in rather unpredictable ways. The prices are affected not only by inflation in the United States, but also by factors that are independent of the engineer’s control, and have to do for example with international events (like the first and second Gulf Wars), with natural disasters (like Hurricanes Katrina and Rita that affected production in the Gulf of Mexico in 2005), and with random events that occur in this market sector (like the BP leak in the Gulf of Mexico in summer 2010). As the assignment is discussed in class, it becomes clear to the students that it is not only them (seniors in a chemical engineering design class), but others more experienced and with more training in forecasting who cannot predict the future. We use examples of such expert failures in class to demonstrate the real-world implications of financial uncertainty. For example, we present in class a short clip from the UpFront section of the journal Business Week (issue of Oct. 2, 2006) with the title “Bad Bets: Cheaper Oil But Not for Most Airlines,” by Michael Arndt. This clip describes how major airlines forecasted that the price of oil was going to top $100/bbl in the fourth quarter of 2006, since there was a price maximum in July 2006. Leading companies (Continental, U.S. Airways, Northwest) hedged their fourth-quarter fuel contracts at prices in the range of $71.39/bbl to $79.40/bbl. The actual price was around $65/bbl, however, leading to major losses. Only one company (Southwest) man-aged to lock 73% of its fourth quarter fuel needs at $36/bbl. A second related example that is discussed in class is taken from the Money Section of USA Today (published March 15, 2008), where a risk analysis table was offered for airlines (see Table 2). The table provides the loss or gain that 12 airlines were going to have in 2008 as a function of the price of oil, ranging from $75/bbl to $110/bbl.
This example clearly shows that detailed predictions made by professional forecasters can be wrong, and different com-panies, based on their expert information, might be led to wrong decisions. If that happens, then real money is lost and those who make the worst predictions can go out of business. Furthermore, both of these examples indicate that there is competition in a business sector, and it is not only enough to manage risk, but manage it in consideration of the competitive environment. In the fourth quarter of 2006, Southwest could start a price war in which the rest of the airlines could not compete, even if they estimated that they would be profitable buying fuel at $79.40/bbl.
At the end of this discussion, the question arises of how to account for uncertainties like this in order to calculate profitability.
RISK QUANTIFICATION—MONTE CARLO SIMULATIONS
One way to take uncertainty into account for making busi-ness decisions is to maximizeexpectedprofits or to maximizeexpectedutility (see Reference 8 for ways to introduce these concepts in class with examples and class games). Expected profit can be calculated based on a probability density func-tion (pdf) for specific profits to occur. This pdf is generated from experts within a company, or from a consulting firm, and it is a pdf that describes the likelihood of potential discrete outcomes (each one associated with a profit or a loss) that may arise following each decision made by the company. This type of pdf is based on opinion and on tools such as market research and surveys, since one cannot repeat the same economic experiment under the same business conditions. A business situation occurs once; thus, one cannot generate a sample of outcomes given the decisions made and develop a rigorous statistical pdf.
One can also generate a pdf for each component that affects the profit function (e.g., equipment costs, inflation, raw mate-rial prices, labor costs, transportation costs, product prices, market share). These pdfs can be continuous, since there might be historical data available that can allow a reason-able guess about the form of the pdf. The expected value in the statistical sense (i.e., the average value) of costs, prices, etc., is then used to calculate expected profit or expected Net Present Worth (NPW).
TABLE 2Scenarios of Airline Gains/Losses as a Function of
Possible Oil PricesAirline $75 $95 $100 $110
Alaska 104 14 -9 -54
American 797 -538 -872 -1,539
Continental 444 -12 -126 -354
Delta 538 -100 -260 -579
Northwest 488 43 -69 -291
United 540 -116 -280 -609
Total majors 2,913 -709 -1,615 -3,426
AirTran 87 -27 -56 0
Allegiant 47 22 15 3
Frontier 9 -48 -63 -91
JetBlue 66 -45 -72 -91
Southwest 495 467 460 445
US Airways 259 19 -41 -160
Total Industry 3,877 -322 -1,371 -3,321
These are estimates of airlines’ net income or loss in millions if the price of oil averaged the values on the first row during 2008 (the values of this table were taken from the March 15, 2008, issue of USA Today, and they were attributed to Merrill Lynch).

Vol. 45, No. 3, Summer 2011 173
Generating the pdf for profit or for NPW can lead to the quantification of risk. A measure of risk is either the standard deviation, σ, of a pdf, or the coefficient of variation, V, which can be defined as follows:
V= σµ
( )1
where μ is the mean of the variable. The coefficient of variation is a normalized risk, since it designates uncertainty as a fraction of the mean. How can the coefficient of variation be calculated, however? For example, the NPW is a function of several vari-ables, like equipment cost, operating cost, the economic life of the process, the firm market share, the product price, the price of raw materials, inflation, etc. O’Donnell, et al.,[4] presented two techniques. One is the propagation of error, in which the assumption is made that the pdfs followed by the variables that comprise NPW are statistically independent. The second is a Monte Carlo technique, in which a great many scenarios are generated. Each one of these scenarios is based on a set of randomly selected values of the independent variables. The random selection is made so that the random variables take values from the specific pdfs that describe each one of them. The NPW is calculated for each randomly selected case, and a pdf for NPW can then be generated. The process stops when the mean and the standard deviation of the pdf that NPW fol-lows do not change significantly. Specifically, the Monte Carlo technique includes the following six steps:
i) Decide on the probability type for each independent variable.
ii)Estimatetheminimum,maximum,andmostlikelyvalue.iii) Generate random numbers for these variables based on
their probability functions.iv) Calculate NPW for each set of variables.v) Repeat as many times as necessary, i.e., until the prob-
abilitydistributionofNPWdoesnotchangesignifi-cantly. This may require hundreds or even thousands of repetitions.
vi) Calculate the mean and the standard deviation of the pdf that NPW follows.
A student with knowledge of Excel® can generate random numbers that follow a uniform pdf, or a normal pdf (see also Reference 4). Monte Carlo calculations, however, can be done quickly with Crystal Ball® by Oracle—an Excel add-in that is designed specifically for risk analysis applications and forecasting. Figure 1 is a typical pdf for NPW that was gener-ated using Crystal Ball by a student group in Fall 2010. Such software allows the user to simply click on a spreadsheet cell, opening up a menu of pdf choices (e.g., uniform, normal, log-normal, triangular), followed by the input of the parameters that characterize the pdf (e.g., mean and standard deviation). When the variable of interest (NPW) is written as a function of values in that spreadsheet cell, the generation of Monte Carlo realizations is started. The pdf appearing in Figure 1 is the re-sult of 3,000,000 different calculations of NPW. The software reports not only the pdf, but also the cumulative pdf, the most common value, the median, and the skewness and kurtosis of the pdf, and in general all the details that characterize the pdf. It can even perform a goodness-of-fit test to determine whether the NPW pdf can be described analytically.Class Problems. The introduction to Monte Carlo methods and risk quantification is done after the discussion of conven-tional profitability criteria. The following is an example of a sequence of assignment problems used in class. A process (cyclohexane production from benzene) is described, and data are provided related to the operation of this process. In the first problem of the sequence, the students need to apply conventional methods to calculate profitability based on cost, price, inflation, and other data, some of which are provided and some that need to be found by the students. The following are the questions asked related to profitability:
Problem 1•ReportonprofitabilitybasedonReturnon Investment
(ROI), rate of return based on discountedcashflow,NetPres-ent Worth (NPW), and pay-out time.•WhatwouldyourNPWbe,if
yourproductsweresoldatfivetimes the price that you estimated
Figure 1. Typical pdf gener-ated with Crystal Ball®. The NPW in this case is for a cy-clohexane production process where the prices of cyclohex-ane, hydrogen, and benzene are randomly selected from normal pdfs.

Chemical Engineering Education174
from your calculations above? What would your NPW be, if your products were sold at half the price you estimated above?
The second part of this problem reveals the possibility of changes in the financial circumstances during the economic lifetime of this process, and allows the follow-up problem, which is given to the students after our discussion in class about risk and Monte Carlo methods. The related questions in the follow-up problem are:Problem 2•Performsensitivityanalysisforthequantificationofrisk,
i.e.,showStraussplotsoftheNPWasafunctionoffixedcapi-tal investment, product cost, and product price (variables for which a probability density function is provided).•CalculatetheriskassociatedwithNPWusingtheerror
propagation method discussed in class.•Whatshouldtheminimumpricedifferencebetweenyour
product and the raw material be, in order to have positive expectedNPW?•UseCrystalBall® to estimate the NPW distribution when
thepriceofhydrogenisuniformlydistributedbetween$200/tonand$400/tonandthepriceofbenzenetakesvaluesfromanormaldistributionwithameanof$2/gallonandstandarddeviationof$1/gallon.
This second problem requires a full-scale risk characteriza-tion and quantification for the process. The Strauss plots are sensitivity analysis graphs that present the dependent variable (NPW) as a function of one of the independent variables (e.g., fixed capital investment) while the rest of the variables are set as constants (see References 4 and 7 for details). We have used Crystal Ball® only in Fall 2010, the most recent semester
that our Design class was taught. The students learned the software very quickly and produced quality reports without a need to conduct a training session.
TAKING FINANCIAL UNCERTAINTY AND ATTITUDE TOWARDS RISK INTO ACCOUNT FOR PROFITABILITY CALCULATIONS
The question that arises now is how to involve the calcula-tions of risk into the decision-making process and the determi-nation of whether a process that has a particular pdf for NPW is worth pursuing or not. It is natural that different people or different corporations have different attitudes towards risk. There are three types of people: (a) Those that are risk-averse, i.e., they would assume more risk only when the expected profit is much higher; (b) Those that are risk-loving, i.e., they are willing to assume more risk even when the increase in the expected profit is not large; and (c) Those that are risk-neutral, i.e., they are willing to take risk proportional to the expected profit. Figure 2 is a graphical representation of risk behavior. Most people, corporations, and especially small businesses owners are risk-averse and are willing to assume more risk only when the expected profit increases.
The formula that is used to calculate NPW is as follows:
NPWCF
i
V WC
iTCIk
ks
nk
n
=+( )
++
+( )−
=∑
1 12
1
( )
where n is the economic lifetime of the project, CFk is the cash flow at year k, i is the minimum acceptable rate of return, Vs is the salvage value, WC is the working capital, and TCI is the total capital investment. The working capital and the salvage value are usually not the source of risk. Risk mostly stems from the cash flow. Looking at Eq. (2), the way to incorpo-rate risk is to change the first term of the right-hand side of the equation. One can either change the numerator (the cash flows) or the denominator (the minimum acceptable rate for return) in a way that makes the profitability criterion stricter. Therefore, either the cash flows need to be reduced, or the riskless rate of return needs to be increased.
Use of the Notion of ‘Certainty Equivalence’ to Modify Cash Flows in the NPW Equation
Let us first introduce the concept of indifference curves. These are 2-D curves that represent combinations of choices that leave the decision maker indifferent. The decision maker (e.g., the boss) may be indifferent between undertak-ing a specific amount of risk for a high profit and obtaining a lower profit risk-free. The following example illustrates the concept.Example1. A company wants to decide whether to invest in a new automation system that will also result in a different typeofby-product.Accordingtothecompany’sexpertengi-neers, there is 0.3 probability that such a system will result
Figure 2. Graphical representation of a person’s attitude towards risk. The risk averter allows an increase in risk
only when the profit increases dramatically, the risk- neutral decision maker allows an increase in risk propor-tional to the expected profit, and the risk lover can take more risk even with small increases in expected profit.

Vol. 45, No. 3, Summer 2011 175
in a $1,600,000profit, a 0.2 probability that itwill resultina$700,000profit,0.1probability that itwillresult ina$300,000profit,anda0.4probabilitythatitwillresultina$800,000 loss.
The expected profit, in $103, for this case is given asExpected Profit= 0.3 3 1,600 + 0.2 3 700 + 0.1 3 300 – 0.4 3 800 = $330
The standard deviation is given asσ = [0.3x(1,600-330)2 + 0.2x(700-330)2 + 0.1x(300-330)2 + 0.4x(800-330)2]1/2 = $1,011and the coefficient of variation is V = σ / (Expected Profit) = 3.06.
Figure 3 is an example of an indifference curve where a manager is indifferent between venturing on this process, with risk expressed as V = 3.06 and an expected profit of $330,000, and receiving a certain profit of $200,000 from a risk-free alternative action. The exact curve would be generated using additional (profit, risk) points, for which the decision maker is indifferent when asked to choose between ventures with those profit/risk combinations or a zero-risk venture with profit of $200K. The indifference curve presented in Figure 3 is that of a typical risk-averter, since this decision maker is willing to take a higher risk than 3.06 only when the expected profit is much higher than $330,000. Mathematically, the curve is concave (the second derivative is negative as one is willing to take marginally more risk for a lot more profit). This zero-
risk value that corresponds to the indifference curve is called the certainty equivalent. We say, therefore, that the decision maker is indifferent between taking any risk along the indiffer-ence line with the corresponding expected profit and making a profit equal to the certainty equivalent with no risk.
The exact shape of indifference curves, like the one presented in Figure 3, describes the attitude of a particular individual. In business, this individual is the person who will make the decision whether to invest in a process or not. There are innumerous indifference curves for the decision maker, one for each certainty equivalent. In the example discussed above, there are other indifference curves that have certainty equivalents of $100K, $300K, $400K, etc. These curves are not intersecting each other (one can ask the students why that is, stimulating class discussion about indifference curves). One can obtain such indifference curves by presenting the decision maker with two options. Option A: a certainty of a specific profit, say P1, and Option B: a gamble that has a higher expected profit, say P2, but carries a certain risk V2. Starting with a high V2, the choice should be option A. Then, one can decrease V2 to the point where the option chosen becomes option B. The values P2 and V2 where this switch occurs designate a point on the indifference curve that has a certainty equivalent P1. (The interested reader can find a description of Excel-based classroom games that we have developed in the context of introducing the utility function to students.[8] These games place the students in the decision maker’s position and illustrate how one switches options when faced with such choices.)
In order, therefore, to take risk into account for the expected cash flows appearing in Eq. (2), one can use their certainty equivalents, as follows:
NPWCF
i
V WC
iTCIk
o
ks
nk
n
=+( )
++
+( )−
=∑
1 13
1
( )
where CFko is the certainty equivalent of the cash flow for
year k. For each year one needs to estimate both the expected cash flow and the risk associated with it, use the indifference curves to obtain the certainty equivalent for each cash flow, and then do the NPW calculation. If the NPW remains posi-
tive, then the process will be considered profitable even with risk.Use of ‘Risk Premium’ to Modify Acceptable Rate of Return in the NPW Equation
In this case, the minimum acceptable rate of return is modified based on an indifference curve that relates risk to rate of return. Figure 4 is an example of such a curve for the case where the minimum acceptable rate of return is 6% (for zero risk). This curve is again for a risk-averse decision maker, since it indicates that this person expects a marginally higher rate of return in order to accept marginally higher risk. The
Figure 3. Indifference curve for a certainty equivalent (i.e., zero risk option) of $200,000. A curve like this can be generated by surveying decision makers to obtain expected profit and corresponding risk points that make them indif-
ferent relative to the $200,000 and zero-risk option.
Figure 4. Indifference curve for an expected rate of return indicating a risk premium of 4% at risk of V = 2.

Chemical Engineering Education176
additional expected rate of return in order to assume risk is called risk premium, ip. Therefore, a modified rate of return, ir , needs to be used in Eq. (2) in this case, that is given as ir = i + ip. Eq. (2) then becomes
NPWCF
i
V WC
iTCIk
r
ks
nk
n
=+( )
++
+( )−
=∑
1 14
1
( )
where the discount factor for salvage value and working capital is not modified (because these amounts are not at risk). Eq. (4) can also be used with different risk premiums for each year k. If the new NPW is still positive, then the process will be considered profitable.
Example of a Homework/Test ProblemThe following is the type of problem that we give to the
students in a test. It only uses n = 2, in order to be doable in a few minutes in class, but it makes the students produce indifference curves, it allows them to calculate profitability and then to incorporate risk into their calculations. One can generate problems like this that would involve more extensive calculations rather easily.Problem 3The total capital investment is given at $750,000, the working capital is assumed to be 10% of the total capital investment, the salvage value is zero, and n is 2 years. The acceptable return on investment for your company is 8%. Consider the following data that describe the decision maker’s attitude towardsrisk.Theyprovidecombinationsofriskandexpectedprofitlevelsforwhichthedecisionmakerisindifferent.2
Risk (V) Expected Profit (EP1) Expected Profit (EP2) 0 100,000 200,000 0.5 125,000 250,000 1 175,000 330,000 1.5 250,000 430,000 2 340,000 600,000 2.5 550,000and the following data are provided for your investment: Year Expected Cash Flow Risk (V) 1 $400,000 2 2 $500,000 0.75(a) Calculate the NPW for this project without risk. Is the processprofitable?(b) Draw a plot of the indifference curves for this situation.(c) Calculate the NPW for this project incorporating risk intoyourcalculations.Isthisprocessconsideredprofitablenow?(d) What risk premium would be needed in order for the pro-cesstobeprofitablewhenriskistakenintoaccount?(Assumethat the risk premium would be the same for both years of operation, irrespective of risk.)
This process is profitable without risk [Eq. (2) gives NPW = $113,340]. For part (b), when the two indifference curves for this problem are drawn (one for certainty equivalent of $100,000 and one for $200,000, see Figure 5) the students realize that they need to draw two additional lines that would
Figure 5. Indifference curves corresponding to the data for Problem 3. The dashed lines indicate the two indifference curves corresponding to CF = $400,000 and V =2, and to CF = $500,000 and V=0.75
2 Notice that there is a different riskless rate of return associated with EP1 and EP2.

Vol. 45, No. 3, Summer 2011 177
be used to estimate the certainty equivalents of the cash flows for years 1 and 2. Knowing that indifference lines do not in-tersect, one can draw the dashed lines appearing in Figure 5 and estimate the certainty equivalent of $400K and estimated risk parameter V=2 to be about $140K and the certainty equivalent of $500K and estimated risk parameter V=0.75 to be $360K. Using these adjusted values in Eq. (3), it is found that the process is no longer profitable with the given risk and the given attitude towards risk.
CONCLUDING DISCUSSIONModern developments in economics and management include
techniques that address uncertainty and risk in a systematic and quantitative way. Deterministic models for the calculation of NPW can be used to introduce the concept of NPW, but further analysis that incorporates financial uncertainty should be offered. Uncertainty can be discussed in class using examples from the real world, such as the forecast of energy prices discussed herein. The financial implications of uncertainty can also be discussed with relevant examples or assignments. Uncertainty can be quantified by applying well-designed Monte Carlo methods, which have lately become easy to implement in a Design course due to the availability of commercial software that students can use with little or no training. In addition to quantifying risk and presenting options based on expected profit or expected NPW, the attitude towards risk can be taken into account in profitability calculations using indifference curves. Incorporating risk analysis in the teaching of Engineering Economics is not taxing in terms of class time (it usually takes one week to discuss in class the ideas presented here and conduct the class games described in Reference 8), and it offers the students an updated and relevant perspective on profitability.
ACKNOWLEDGMENTSThe support of the National Science Foundation through
a Course, Curriculum, and Laboratory Improvement grant (NSF-0737182) is gratefully acknowledged. An earlier ver-sion of this work has been presented at the AIChE meeting in the session “Steal this Course” in Salt Lake City in No-vember, 2010.[3] The material that we have developed as class games, as PowerPoint presentations, and as homework/test problems is available to interested colleagues who might want to contact us.
REFERENCES 1. Mansfield, E., Managerial Economics, 4th Ed., W.W. Norton & Com-
pany Inc., New York, (1999) 2. Resnick, W., Process Analysis and Design for Chemical Engineers,
McGraw-Hill, Inc, New York (1981) 3. Valle-Riestra, J.F., Project Evaluation in the Chemical Process Indus-
tries, McGraw-Hill Inc, New York (1983) 4. O’Donnell, B.R., M.A. Hickner, and B.A. Barna, “Economic Risk
Analysis, Using Analytical and Monte Carlo techniques,” Chem. Eng. Ed., 36(2), 94 (2002)
5. Papavassiliou, D.V., M. Freeman, and G. Kosmopoulou, “Introducing Risk Analysis in a Design I Course,” paper 247a, American Institute of Chemical Engineers Annual Conference, Salt Lake City, November 2010
6. Solomon, M.J., “Incorporating the Concept of Financial Risk Into Instruction in Economic and Profitability Analysis for Chemical Engineering Design,” paper 247b, American Institute of Chemical Engineers Annual Conference, Salt Lake City, November 2010
7. Turton. L., R.C. Bailie, W.B. Whiting, and J.A. Shaeiwitz, Analysis, Synthesis, and Design of Chemical Processes, 3rd Ed., Prentice Hall, Boson (2009)
8. Kosmopoulou, G., C. Jog, M. Freeman, and D.V. Papavassiliou, “Intro-ducing Decision Making Under Uncertainty and Strategic Considerations in Engineering Design,” Chem. Eng. Ed., 44(4), 267 (2010) p

Chemical Engineering Education178
Gas-Solid fluidization is a unique and well employed part of the field of Chemical Reaction Engineering and accordingly it is taught in most undergraduate
Chemical Engineering programs. Educational experiments employing fluidization are therefore not new to literature; prime examples can be found for adsorption[1] and polymer coating[2] experiments. The catalytic gas-fluidized bed reactor is a classic example of how hydrodynamics can affect reactor performance and it is likely to be one of the first examples for the undergraduate (or early post-graduate) student where classical reaction engineering principles are integrated with complex flow phenomena. It is well established that the contacting between the leaner and denser “phases” can cause severe deviations from the predicted behavior.[3] This is mainly due to the mass transfer resistance between the phases, where most of the reactant has to be transported from the lean phase to the dense (or emulsion) phase that contains most of the cata-lyst. Most undergraduate textbooks[4,5] focus on the bubbling fluidization regime where the lean phase is present in a bubble form and accordingly bubble-to-emulsion mass transfer is covered to a reasonable degree. These texts also illustrate how the conversions for a relatively fast reaction in the bubbling regime can be significantly less than that predicted by a plug flow (or even perfect mixing) model. To the knowledge of the authors no educational experiment has been published to illustrate the interphase mass transfer principle.
In this paper an experimental setup is presented to visually and experimentally illustrate the effect of interphase mass transfer on a fast chemical reaction in the smooth, bubbling, and turbulent regimes of fluidization. The student will be con-fronted with major differences in overall conversion between that of the smooth (homogeneous) fluidization regime and the bubbling regime, while the transition from the bubbling to the turbulent regime will illustrate how transfer limitations dimin-ish while only back mixing effects remain. Visual observations of the experiment allow for an intuitive confirmation of the measured results, while the modeling afterwards, based on well developed correlations, will tie the theory to practice.
DEMONSTRATING THE EFFECT OFINTERPHASE MASS TRANSFER
In a Transparent Fluidized Bed Reactor
Jean saayman and Willie nicol
UniversityofPretoria•Pretoria,SouthAfrica,0002
Jean Saayman is a Ph.D. student at the University of Pretoria. He received his B.Eng. degree, as well as his M.Eng. at the same institution. His research interests are in Re-action Engineering, specifically focusing on Fluidized Bed Reactors.
Willie Nicol is a professor in chem-ical engineering at the University of Pretoria. He re-ceived his B.Eng. degree from the University of Pretoria and his Ph.D. from the University of the Witwatersrand. He runs the Reaction Engineering Research Group that focuses on Trickle Bed Reactors and Gas-Solid Fluidization. He has been teaching the undergraduate reactor courses
in his department for more than seven years.© Copyright ChE Division of ASEE 2011
ChE curriculum

Vol. 45, No. 3, Summer 2011 179
The well established ozone decomposition reaction on iron oxide-impregnated Fluidized Catalytic Cracking (FCC) catalyst is used. The conditions of the suggested experiment were optimized in order to enhance the observation of mass transfer effects. It is suggested that the apparatus should be used for undergraduate demonstrations, while the generated data should be handed to the students in order for them to perform their own interpretations. On a postgraduate level the experiment can be performed by the students themselves. There are different options in terms of the level of interpreta-tion required. For undergraduates a simple Kunii-Levenspiel model[3] or a two-phase plug flow model[6] can be used, while more advanced dispersion modeling coupled with regime transition predictors[7] can be performed by postgraduates.
BASIC EXPERIMENTAL REQUIREMENTS There are different options in terms of the complexity of the
experimental setup. A transparent two-dimensional fluidized bed is suggested (some laboratories will already have such a setup). The complexity of the column design will depend on the velocity range required. The minimum requirement is a maximum superficial velocity of 0.2 m/s (based on FCC catalyst used in this study). This will allow for comfortable operation in the bubbling regime without significant solid entrainment, thus allowing for a simple solid separation device like a filter bag at the exit. Although this design will not be able to cover the turbulent regime, it will be able to demonstrate the severe interphase mass transfer effect in the bubbling regime. For higher superficial velocities a solids recycle will have to be used
by employing a cyclone (or multiple cyclones) and a dipleg (see section entitled “Demo Experimental Apparatus”) The column has to be supplied with a measured inflow of air. One will typically require two parallel flow measurement devices, one for the small flow ranges (packed bed and minimum fluidization ranges) and the other for the higher fluidization velocities. An ozone generator (with oxygen supply) and an online ozone analyzer are further requirements. It is preferable to link the ozone reading to a visual display. Lastly, fresh FCC catalyst is required as support, while ferric nitrate is used to prepare the ac-tive sites on the catalyst. A high-frequency pressure transmitter is optional, but will be useful for high-velocity experiments where bubbling-turbulent regime transition needs to be characterized.
The main cost contributors of the setup will be the ozone equipment, the Plexiglas column, and the gas flow measurement if an air stream is readily available. For our system the ozone analyzer cost $7,000, while the generator and the detector had a cost of only $2,500. The column used in this study cost $17,000; although a simple system with a less elaborate recycle system will be much less. Different options are available for the flow measurement but $8,000 should be sufficient.
DEMO EXPERIMENTAL APPARATUS
A two-dimensional Plexiglas column with a thickness of 25 mm, width of 0.4 m, and height of 4.5 m was used for the demonstra-tion. The reason for the two-cyclone system in Figure 1 is that the column was designed
Figure 1. Experimental setup.

Chemical Engineering Education180
to operate up to a superficial velocity of 1.2 m/s. A triangular pitch perforated plate distributor with 35x 2 mm holes was used. A porous cloth was placed below the distributor to pre-vent solids weepage. This assisted in increasing the pressure drop over the distributor to a value greater than the pressure drop over the bed, thus ensuring even gas distribution. The plenum chamber was filled with glass beads to enhance ozone mixing. A high frequency pressure transmitter was installed at a height of 0.3 m, just below the bed surface. The inlet of the sample probes were covered with porous cloth and sealed to ensure a solids-free sampling system. A UV-106 ozone analyzer was connected via a three-way valve to an inlet and outlet sample tube. The ozone generator (Eco-Tec’s MZPV-1000) had a maximum output of 1g/hr. The ozone production can be controlled by varying the inlet oxygen flow or by adjusting the intensity of the generator. The total feed (air + ozone generator outlet) concentration varied between 15 and 70 ppm, while the ozone conversion varied between 15 and 99.5%. The exit gas from the reactor was diluted with cyclone gas and released outside the laboratory. Activated carbon absorbers can be used, but the influence of the pres-sure drop over the absorber on the column pressure should be considered. Health-based standards established by the U.S. government recommend limiting an 8 hr exposure to a maximum ozone concentration varying between 70 – 120 ppb and an immediate danger to life or health limit of 5 ppm.[8] An ozone detector was installed next to the demo experimental setup which would sound an alarm at a ozone level of 100 ppb.
Ozone can already be smelled at 20 – 50 ppb, however.[9] Proper sealing and disposal should be ensured.
CATALYST The FCC catalyst (NEKTOR 366, Grace Davison Refinery
Technologies, Europe) has a Sauter mean diameter of 66 μm and exhibited typical Geldart A particle characteristics. The fresh catalyst is mixed with a 10 %(wt) ferric nitrate solution in a weight ratio of 1:1.8. The mixture is well-stirred for 2 hours, followed by decanting of the excess solution. The sepa-rated catalyst is dried overnight at 95 ̊C and then calcinated at 475 ̊C for 2 hours.[10] The required active site (Fe2O3) will form on the catalyst according to the following reaction:
Fe NO nH O Fe O NO O nH O3 3 2 3 2 2 22 12
3 34
1( ) → + + + ( ).
A fume hood or oven extraction system is required to re-move the formed NO2 gas. For the demo apparatus 5 kg of catalyst was prepared.
The reaction is known to be first order with respect to ozone at oxygen concentrations less than 50% and water concentrations less than 4%.[11] The demonstration catalyst was found to rapidly deactivate for the first 2.5 hours of operation, after which the activity remained constant for 10 hours. The volumetric rate constant (based on volume of solid) for the stable activity period was found to be 0.7 s-1. Deviations from this activity (for different FCC supports) will still illustrate the principles of the demonstration (see
Figure 2. Experi-mental data and
theoretical models.

Vol. 45, No. 3, Summer 2011 181
Figure 3). The rate constant of a specific catalyst batch can be determined from the bubbling regime measurements by using the Kunii-Levenspiel three-phase plug flow model [with 2D correction –see Eqs. (6) and (7)]. The accuracy of this model for the two-dimensional column was confirmed by using a rate constant that was independently determined in a separate fixed bed reactor. It is suggested that the rate constant should be established before the demonstration experiment, in order to supply the students with the kinetic information required for their own analysis.
RESULTS The steady state conversions at different superficial veloci-
ties are represented in Figure 2. In order to illustrate the major deviation from plug flow performance the y-axis is normal-ized with respect to the maximum (or PFR) conversions. It is interesting to note that the first data point (at u0 = 3.5mm/s) is at the maximum conversion. At this point the velocity is just beyond that of minimum fluidization and still within the smooth or homogeneous fluidization regime (umf = 3.1 mm/s and umb = 6.3 mm/s). The conversion in the smooth fluidization regime was found to be very similar to that of the packed bed and for practical purposes ideal plug flow can be assumed. Upon bubble formation there is a drastic drop in conversion (at u0 = 6.3 m/s the conversion is 31%) and from the theoretical CSTR solution on Figure 2 it is clear that the major difference cannot be attributed to mere mixing effects.
During observation the students will intuitively understand the major deviation in conversion, due to the bubble bypass-ing the emulsion (or catalyst bed). This will be a good time to address the importance of interphase mass transfer and the distribution of feed gas between bubble and emulsion flow. This should be done before increasing the velocity to the extent where the x/xPFR values start to increase (in order to clearly observe distinct bubbles rising in the bed).
The gradual recovery in the reactor performance with an increase in the superficial velocity will not be clearly observed in the conversion measurements due to the drop in the theo-retical plug flow conversion with an increase in throughput. Accordingly the turning behavior in Figure 2 will only be observed when plotting the relative conversion. On a visual level, however, the severity of bubble-dense phase interaction at higher velocities will be clearly observed.
Figure 3 gives the expected results for catalysts with a higher/lower activity than that of the demonstration catalyst. It is evident from the graph that the demonstration can be performed at higher/lower catalyst activities.
INTERPRETATION OF THE RESULTS The interpretation should center on the graphical representa-
tion of the data and predictive models in the suggested format of Figure 2. For undergraduate students a simple two- or three-phase plug flow with exchange model will be sufficient.
Figure 3. Predicted reactor performance for different catalyst activities using the Thompson, et al., transitional model[7] in conjunction with the Kunii-Levenspiel mass transfer coef-ficient for 2-phase flow.

Chemical Engineering Education182
The Kunii-Levenspiel three-phase model can be written as the following ordinary differential equations[5] (see textbook for more details):
udCdz
f R K C C
udC
bi b
b i bc i b i c
ci
,, ,
,
= ( )− −( ) ( )Cb δ 2
ccc i bc i b i c ce i c i edzf R K C C K C C= ( )+ −( )− −Cc δ δ, , , ,(( )( )
= ( )+ −( ) ( )
3
4udCdz
f R K C Cei e
b i ce i c i e,
, ,Ce δ
CC u C u C u Ci b i b c i c e i e= + + ( ), , , 5
Where the reaction rate, Ri(CJ), is a function of the species in the relevant phase. An area correction should be made to the volumetric mass transfer coefficients to account for the two dimensional bubbles so that:
K Kbc D bc D, ,2 3
23
6= ( )
K Kce D ce D, ,2 3
23
7= ( )
The distribution of catalyst for the demo example was chosen to be fb = 0.005; the bubble wake fraction of the model was chosen to be 0.4 and the bubble diameter used was 8.5 cm. Due to the first-order kinetics an analytical so-lution for the model is possible, but it is easier to solve the set of ordinary differential equations numerically. The basic Kunii-Levenspiel approach is to assume zero gas flow in the emulsion and cloud phases and thus Eqs. (3) and (4) will reduce to algebraic equations. The shortest method to solve the for-mulation is to assign small velocity values (0.1% of ub) to the cloud and emulsion velocities, specify the inlet concentration of reagent in all three-phases, and use a simple ordinary differential equation solver. The cloud and emulsion concentration
Figure 4. Data prediction over the entire velocity
range using the Thomp-son model (1999) with different 2-phase mass
transfer coefficients. Foka, et al.,[14] gives good
agreement.
will reach its steady state values within the first few integration steps, while the final solution will be very close to the analy-tical solution. The solution, in the format of three concentra-tions as a function of bed height, has the added advantage of graphically representing the concentration gradients as a function of bed height.
A two-phase plug flow approach will give the following two differential equations:
udCdz
f R k C Cbi b
b i be i b i e,
, ,= ( )− −( ) ( )Cb δ 8
udCdz
f R k C Cei e
e i be i b i e,
, ,= ( )+ −( ) ( )Ce δ 9
C u C u Ci b i b e i e= + ( ), , 10
The mass transfer correlation for two-dimensional bubbles of Sit and Grace[12] can be used:
K uD udbe mf
m mf b
b
= +
( )2
30 4 2 11.
επ
Alternatively the Kunii-Levenspiel model can be converted to a two-phase model by ignoring the cloud phase and by obtaining a single mass transfer coefficient given by:
KK KK Kbe
bc ce
bc ce
=+
( )12

Vol. 45, No. 3, Summer 2011 183
A similar approach to that of the three-phase model can be used to solve the formulation and students will be able to compare the two types of plug flow models. For the two-phase model represented in Figure 2 the catalyst distribution was chosen to be fb = 0.0355. It is evident from Figure 2 that both models give a reasonable fit for the lower velocity ranges, but underpredict the performance at higher velocities where the bed starts exhibiting properties of turbulent fluidization. More advanced students can follow the approach by Thompson, et al.,[7] where the transition between the bubble and turbulent regimes is modeled using probabilistic averaging. The transi-tion velocity uC* is required in this model and can be deter-mined from pressure fluctuation readings.[13] This transitional two-phase model employs axial dispersion in both phases and achieves an adequate prediction of the data over the complete velocity range, as can be seen in Figure 4.
TRIALS AS PART OF A POSTGRAD COURSEThe described experiment has been used as part of a
postgraduate course on reactor hydrodynamics. Before the demonstration experiment, the students were exposed to the two- and three-phase approach to modeling fluidized beds. The example in the Levenspiel textbook[5] was used as a base case scenario to verify the numerical solutions of both models. This provided the students with the necessary tools to predict conversions in the bubbling flow regime. This was all performed prior to the demonstration. The demonstration itself was a great success in terms of confirming the govern-ing principle of interphase mass transfer. Most students were keen to test the results against their already developed models and were surprised at the accuracy of their prediction in the bubbling regime. The observed deviation at higher velocities provided a platform for the lecture on the turbulent regime. From the student feedback the general consensus was that the demonstration (accompanied with the analysis of the experimental results) greatly assisted their understanding of fluidized bed hydrodynamics.
CONCLUSION This demonstration experiment is an ideal tool for illustrat-
ing the effect of interphase mass transfer in a fluidized bed reactor. The student is directly exposed to the reaction rate reduction effect of the bubbles in the bed. The experiment in combination with the theoretical interpretation provides an ideal platform for developing an integrated understanding of the subject. Trials with postgraduate group proved to be very successful in terms of student feedback and test results.
NOMENCLATURE Ci Gas concentration of species I (kmol/m3) Dm Gas diffusion coefficient (m2/s) db Bubble diameter (m) Kbc Bubble-Cloud mass transfer (s-1) Kce Cloud-Emulsion mass transfer (s-1) Kbe Bubble-Emulsion mass transfer (s-1)
kr Reaction rate constant based on volume catalyst (s-1) ub Bubble phase velocity (m/s) ubr Single bubble rise velocity (m/s) uc Cloud phase velocity (m/s) uC
* Minimum turbulent velocity 1 (m/s) ue Emulsion phase velocity (m/s) umb Minimum bubble velocity (m/s) umf Minimum fluidization velocity (m/s) uo Operating velocity (m/s) z Height in reactor (from distributor) (m) Subscripts b Bubble phase (Low density phase) c Cloud phase e Emulsion phase (High density phase) mf Minimum fluidization Greek letters ε Gas volume fraction f Solids volume fraction (1-ε) δ Phase volume fraction
ACKNOWLEDGMENTS The financial support to do the research, on which this paper
is based, came from Sasol. A special word of thanks goes to Natref who supplied the FCC catalyst.
REFERENCES 1. Wright, P.R., X. Liu, and B.J. Glasser, “A Fluidized Bed Adsorption
Laboratory Experiment,” Chem. Eng. Ed., 38, 14 (2004) 2. Hesketh, R.P., C.S. Slater, S. Farrell, and M. Carney, “Fluidized Bed
Polymer Coating Experiment,” Chem. Eng. Ed., 36, 138 (2002) 3. Kunii, D., and O. Levenspiel, Fluidization Engineering, 2nd Ed.,
Butterworth-Heinemann, London: Marine Technology Directorate, pp. 137-164 (1991)
4. Fogler, H.S., Elements of Chemical Reaction Engineering, 4th Ed., Prentice Hall, PTR International Series, pp. 851-854 (2006)
5. Levenspiel, O., Chemical Reaction Engineering, 3rd Ed., John Wiley & Sons, Inc., pp. 447-470 (1999)
6. Grace, J.R., “Generalized Models for Isothermal Fluidized Bed Reac-tors” in: Recent Advances in the Engineering Analysis of Chemically Reacting Systems, Doraiswamy, L.K. (ed), New Delhi. Wiley Eastern, pp. 237-255 (1984)
7. Thompson, M.L., H. Bi, and J.R. Grace, “A Generalized Bubbling/Turbulent Fluidized-Bed Reactor Model,” Chem. Eng. Sci., 54, 2175 (1999)
8. Britigan, N., A. Alshawa, and S.A. Nizkorodov, “Quantification of Ozone Levels in Indoor Environments Generated by Ionization and Ozonolysis Air Purifiers,” J. Air and Waste Manage. Assoc., 56, 601
9. Horváth, M., H. Bilitzky, and J. Hüttner, Ozone, Elsevier, Amsterdam – Oxford – New York – Tokyo, pp. 62 (1985)
10. Sun, G., and J.R. Grace, “The Effect of Particle Size Distribution on the Performance of a Catalytic Fluidized Bed Reactor,” Chem. Eng. Sci., 45(8), 2187 (1990)
11. Dhandapani, B., and S.T. Oyama, “Gas Phase Ozone Decomposition Catalyst,” Appl. Catal., B, 11, pp. 129-166 (1997)
12. Sit, S.P., and J.R. Grace, “Effect of Bubble Interaction on Inter-phase Mass Transfer in Gas Fluidized Beds,” Chem. Eng. Sci., 36, 327(1981)
13. Bi, H.T., N. Ellis, I.A. Abba, and J.R. Grace, “A State-of-the-Art Re-view of Gas-Solid Turbulent Fluidization,” Chem. Eng. Sci., 55, 4789 (2000)
14. Foka, M., J. Chaouki, C. Guy, and D. Klvana, “Gas Phase Hydrody-namics of a Gas-Solid Turbulent Fluidized Bed Reactor,” Chem. Eng. Sci., 51(5), 713 (1996) p

Chemical Engineering Education184
“Digital natives” is a term describing the majority of students in higher education today.[1-4] These students have had access to computers and the Internet from early
in childhood. Being connected to technology is considered normal with Smartphones and iPods always within reach. Educating technology-savvy students necessitates a more dynamic process than the standard lecture-homework-exam paradigm used at most universities during the 20th century.[4] Technology in the classroom is one way to engage the current generation of students (e.g., clickers, Tablet PCs, YouTube Fridays).[5-7] Using technology in a classroom setting is a form of active learning that successfully connects students and learning.[8] Of specific interest here, online homework is an out-of-class technology that challenges students and personalizes the learning experience.
Using a textbook and assigning homework problems from the book is a standard tool in most undergraduate engineering courses. The number of textbook choices for a specific course is limited. The course of interest in this work is Material and Energy Balances where one of two textbooks is usually required.[9, 10] With the limited number of book choices and the free flow of information via the Internet, most students are easily able to obtain textbook solutions manuals. One student informed me that you acquire the solutions manual by “just Googling it.” With solutions manual in hand, many students equate copying portions of the solutions manual with learning the problem-solving skills of a chemical engineer. While publishers very regularly print “new” editions of books, problems within textbooks do not engage the digital natives once the solutions manual becomes available.[11]
To overcome the stagnant content from the same textbook problems from year to year, several groups have turned to technology to personalize the homework experience. From faculty to small companies to large publishers, a change in the definition of homework in higher education has begun. The most comprehensive study in the literature evaluated learning
gains from online courseware with respect to usage and self-regulation for a statics course.[12] Based on performance on a series of in-class exams, students’ learning gains appeared to be more closely related to self-regulated usage (i.e., a student working problems until they feel they have learned the mate-rial) than total usage of the online homework environment.
Other groups have initiated online homework projects us-ing a system called LON-CAPA, an abbreviation for Learn-ing Online Network with Computer Assisted Personalized Approach. One group of authors explicitly indicates that the objective of this system is not an online textbook but a mechanism to engage the students in learning the content of the course.[13] The open-source nature of LON-CAPA allows faculty to write problems for use only at their home institu-tion and course or share with the greater community of us-ers.[14] The online homework system detailed in this study is a commercial web-based system from Sapling Learning.[15] Comparisons between commercial systems and open-source tools will be an important exercise as more courses in higher education adopt these types of personalized learning systems. Online homework, based on the improved student achieve-ment reported here, will become a more common tool in the coming years.
IMPLEMENTATION The undergraduate program in the Department of Chemical
Engineering at the Colorado School of Mines currently en-
IMPROVED STUDENT ACHIEVEMENT USING PERSONALIZED ONLINE HOMEWORK
for a Course in Material and Energy Balances
ChE classroom
maTTheW W. libeRaToRe
ColoradoSchoolofMines•Golden,Colorado80401
Matthew W. Liberatore is an assistant professor of chemical engineering at the Colorado School of Mines. He earned a B.S. degree from the University of Illinois at Chicago and M.S. and Ph.D. degrees from the University of Illinois at Urbana-Champaign, all in chemical engineering. His current research involves the rheology of complex fluids especially traditional and renewable energy fluids, entangled polymer solutions, and colloid slurries.
© Copyright ChE Division of ASEE 2011

Vol. 45, No. 3, Summer 2011 185
rolls more than 500 students. Three sections of the Material and Energy Balances (MEB) course were taught during the Spring 2010 semester. A different professor taught each section, but the students received common homework, quizzes, and exams (Table 1). All three instruc-tors used common lecture materials, and all three instructors scored at or above the university average when rated on their effectiveness as an instructor by the students. The difference between students in section B and the two other “control” sections was the format of their homework assignments, which made up 5% of their semester’s grade. The students in section B completed two homework sets each week: the common textbook-based problem set and a personalized online homework. The control sections completed one common textbook-based homework set and short multiple-choice reading quizzes in the course’s web environ-ment (Blackboard) each week. In general, the student achievement in the two control sections was indistinguishable (i.e., independent of the instructor). Details on the standard homework, web-based quizzes, and online homework are included below and followed by an analysis of the student achievement.
Students were assigned problems from the textbook (Felder and Rousseau) as homework throughout the semester as is commonly done in chemical engineering courses. The MEB course assigned three to six problems each week to be hand written and handed in as the com-mon homework for all three sections. The students were encouraged to work in groups, but individual hand-written solutions were turned in for credit and graded by teaching assistants. Generally, all of the homework problems were assigned from the textbook with the assumption that the solutions manual was readily available. Some problem sets included modified textbook problems (new numbers), problems written by the instructors, or materials taken from the BioEMB database.[16] Three types of homework sets were assigned: all textbook problems, mix of textbook and alternative problems, and all alternative problems (Table 2). The difference in the overall class averages indicates some level of mindless copying of the solutions manuals. Overall, the textbook problems with accessible solutions give the students a false sense of security as exam averages very rarely exceeded 75% in recent semesters.
One alternative to encourage textbook reading and studying is using multiple-choice quizzes (also called Blackboard quizzes or BBQs) inside of the class’s web-based instructional environment. The quizzes examine the students’ learning at the lowest levels of Bloom’s taxonomy, namely knowledge and comprehension.[17] Many problems test the students on very basic calculations, which will be a small part of a prob-lem on their homework.
The length and difficulty of the BBQs is demon-strated in examples related to reacting systems and vapor-liquid equilibrium (Figure 1). Overall, stu-dents scored at least 85% on these types of problems throughout a semester. Since these quizzes are due before class, just-in-time learning can be employed by the instructor.[18, 19] As class begins, the questions with the students’ responses (percentage) for each answer can be obtained by the instructor (and pro-jected for the class to see). If one or more questions have a low score (usually <80%), this topic is then
TABLE 1Outline of the Three Sections of Material and Energy Balances
Section Number of enrolled students
Class time
Handwritten homework
Online homework
Blackboard quizzes
A 51 8 am Yes No Yes
B 57 9 am Yes Yes Optional
C 56 9 am Yes No Yes
TABLE 2Average Student Achievement for All Sections on Three Types of Homework Problems
Homework problem type Number of homework sets Class Average (%) Standard Deviation (%)
All textbook problems 7 84.9 5.5
Mix of textbook and alternative problems 3 80.8 1.6
All alternative problems 2 70.0 n/a
Figure 1. Example questions from multiple-choice reading quizzes.

Chemical Engineering Education186
at least one of the numbers in the problem statement. Thus, the content and concepts are consistent across the class without obtaining the same numerical answer. Each question allows the student to answer until they obtain the correct solution. A small portion of the grade (5% in this case) is deducted with each incorrect response. For example, a 100-point problem would be award 85 points after 3 incorrect attempts. The prob-lems are accompanied by hints to guide the problem solving. Some problems have step-by-step tutorials that are available after a student enters an incorrect answer. After working the tutorial problem, the student returns to the original problem to complete the solution. Finally, fully annotated solutions are available once the student solves the problem or gives up.
The salient features of the Sapling personalized online system are summarized in Figure 2. One feature (Figure 2a) available on many problems is matching knowns (numbers with units) and unknowns to locations on a process flow diagram (PFD). Here, students click and drag the label to the appropriate location on the PFD. Drawing and labeling a PFD is a critical skill for mastery of the MEB course. PFDs trans-late words in the problems statements into simple diagrams representing physical processes. Also, hints are available to
Figure 2. Screen-
shots of an
example online home-
work problem (a.) and solution (b.) from Sapling
Learning.
re-introduced to start the class period. The multiple-choice quizzes ask five to 10 questions per week and take the students 30 minutes or less in most cases. Replacing the multiple-choice quizzes with online homework represented a greater time com-mitment for the students and required higher levels of Bloom’s taxonomy as will be explored in the next section.
A private company, Sapling Learning, provided the online homework system employed in this work. While Sapling has been providing online homework for several years in areas such as chemistry and biology, Fall 2009 was the first time chemical engineering content was available. The questions are organized by chapter and topic to follow the textbook (Felder in this case) and the course syllabus. Sapling provided a Ph.D. chemical engineer as a “Technology T.A.” to set up the assignments and assist the instructor. In this case, the Technol-ogy T.A. kept the instructor’s extra effort required to use the Sapling system to less than 1 hour per week. The content is web-based and each student has an individual login. Sapling creates weekly homework sets based on the topics in the course syllabus. The instructor can then customize the basic problem set (e.g., add/subtract problems, change due date). The questions are personalized for each student by changing

Vol. 45, No. 3, Summer 2011 187
facilitate problem solving as the student works the problem (Figure 2a, bottom). In addition to the hints, correct answers are displayed when the problem is completed correctly or aborted. More importantly, a full explanation of the solution is available for the students to review (Figure 2b). Overall, a simple web-based system provides a framework for guided personalized learning by solving relevant material and energy balance problems. Real-time feedback is available anytime with the online homework system while one-on-one attention during office hours is limited to a few hours each week.
Overall, in the author’s opinion, the difficulty of problems from the Sapling system is on par with questions from the Felder textbook, especially for reaction/recycle and vapor-liquid equilibrium problems discussed below. The students’ opinion on time needed to complete online vs. textbook homework and the relative difficulty are included in the Evaluation section.
STUDENT ACHIEVEMENT A series of hypothesis tests to determine the difference
between two means quantifies the statistical significance for the students using the online homework compare to the con-trol sections. The hypothesis is that the students using online homework earned the same level of achievement as the control group. Student achievement in the online homework section is considered statistically significant (i.e., disproving the hy-pothesis) if the cumulative probability (p) is smaller than the baseline p-value. This baseline significance was determined from the cumulative probability based on students’ overall grade point average (GPA) before the start of the semester. The online homework section had an average GPA of 3.16±0.54 while the control group’s average GPA was 2.95±0.52. Students’ t-test and degrees of freedom leads to the calculation of cumulative probability.[20, 21] The p-value for the preterm GPA is 0.0168. The hypothesis testing was applied to quizzes, exams, and final course grades.
Two of the most difficult types of problems in MEB are multi-unit reac-tion/recycle and va-por- liquid equilibrium (e.g., problems like Figure 2). Two online homework problems on reaction/recycle were completed before an in-class quiz and subsequent exams.
One online homework problem using Raoult’s law preceded the second midterm. The students’ achievement compared to the control sections on three reaction/recycle problems and two vapor-liquid equilibrium questions (Table 3). Four of the five questions analyzed show p values less than the sig-nificance of 0.0168. Therefore, student achievement showed statistically significant improvements. The improvement is believed to be strongly related to the additional practice using the rigorous online homework problems. Additional analysis of three midterms and one final exam showed the same statistically significant achievements.
The final course grades also quantify the increased student achievement (Table 4). The section using the online home-work earned more A’s and as many total A’s and B’s as the control sections despite having a significantly smaller number of students (56 and 100 for section B and A/C, respectively). The difference in GPA is statistically significant (p=0.0006), which places a very small probability that the hypothesis is true. A secondary metric for the Material and Energy Bal-ances course is the number of students earning a C or better (the minimum criteria to advance in the chemical engineer-ing curriculum). A C or better grade was achieved by 51 of 56 students (91%) in the section using the online homework while over one quarter of students in the control sections did not achieve a satisfactory score in the course. To place these numbers in context, an attrition rate of 25-35% for this course is believed to be “average” based on previous years at the Colorado School of Mines and my conversations with other faculty across the United States who teach the same course. Overall, the additional study time and practice using
TABLE 4Overall Grades for the Course
Number of students earning final gradein the course
Sections A B C D F W Average GPA1,2
Standard Deviation GPA1
%C or better1
B 20 15 16 4 1 1 2.93 1.05 91
A & C 17 18 37 15 13 7 2.27 1.24 721 Excludes students withdrawing from the course (grade of W).2 p=0.0006 based on average GPA.
TABLE 3Student Achievement and Cumulative Probability on Quiz and Exam Problems
Related to Two Difficult Course Topics
Test – Question type Online + Textbook Homework section(Ave. % ± St. Dev.)
Textbook Homework + BBQ section
(Ave. % ± St. Dev.) p
Quiz 5 - Reaction with recycle 68±31 50±33 0.0006
Exam 2 - Reaction with recycle 84±13 72±17 0.0022
Final - Reaction with recycle 79±21 69±29 0.0178
Exam 2 – Vapor-liquid equilibrium 80±26 69±29 0.0110
Final - Vapor-liquid equilibrium 77±21 67±25 0.0074

Chemical Engineering Education188
personalized online homework appears to lead to statistically significant improvements in student achievement.
EVALUATION In addition to analyzing the
students’ grades on the online homework and in the course, a one-page evaluation about online and textbook homework was given at the end of the semester. The students were required to put their names on the surveys, and the surveys were collected and held by one of the students until after the semester’s final grades were posted. Students’ identi-ties were cross correlated with the student’s final grade in the course. The responses to 10 multiple-choice questions, which allow four levels of response, and three free response questions, are summarized.
On average, the time needed to complete online homework was ~2 hours and textbook homework was ~2.5 hours. The distribution of average hours worked per week show the vast majority of the students spent 1 to 3 hours of time on each type of homework each week. The aggregate result of the number of hours per week spent working on the combination of online and textbook homework showed a notable trend (Figure 3). The students earning an A for the course put in more time each week on homework than the B students. The B students also put in more time on average than the C/D students. C and D students are grouped due to the small sample size of D students (n=4). The one student receiving an F in the test section did not take the survey (and was frequently absent from class). As an instructor, it was satisfying to learn that the harder-working students earned better grades in the course.
Six questions were ranked strongly agree, agree, disagree, or strongly disagree (Table 5). The first two questions probed the students’ perception of learning using online or textbook homework. The vast majority of the students believed they learned the course concepts and topics from both types of homework, with a slightly more positive response for textbook problem sets (84% and 93% agree/strongly agree for online and textbook homework, respectively). Next, the effectiveness of the learning aids (i.e., hints and explanations) of the online homework system was queried. Positive response from more than three quarters of the students (78% strongly agree/agree) verify the additional material was worth-while from the students’ perspective. Three questions asked if the students “like” doing Sapling, Felder, or a combination of both. Overall, the students slightly pre-ferred textbook to online homework. The students who received an A in the course gave a more positive response on all three “like” homework questions compared to the rest of the students. The preference of doing the com-
bination of online and textbook homeworks was similar to doing textbook homework alone. Thus, the student surveys indicated that the additional work needed to complete the combination of online and textbook homework did not alter how much the students liked doing their homework.
Continuing the online/textbook comparisons, the preferred homework method or methods was queried. The question asked, “To maximize learn-
TABLE 5Students’ Percentage Responses to Six Survey Statements
Statements StronglyAgree Agree Disagree Strongly
Disagree
Sapling homework helps me understand the course concepts and topics. 38 46 13 2
Felder homework helps me understand the course concepts and topics. 35 58 8 0
The hints and explanations on the Sapling homeworks helped me better understand the course material.
38 40 15 6
I like doing Sapling homeworks. 12 38 37 13
I like doing Felder homeworks. 8 58 29 6
I like doing the combination of Sapling and Felder homeworks. 10 53 25 12
Figure 3. Average time spent completing homework (combination of online and text-book) as a function of final grade in the course. Hours average from survey responses (Survey response=average time: <1=0.5 hr; 1-2=1.5 hr; 2-3=2.5 hr; >3=3.5 hr).

Vol. 45, No. 3, Summer 2011 189
ing of the course material, completing _____ is necessary.” where the choices were Sapling, Felder, Felder+Sapling, Felder+Sapling+BBQ. The majority of the class (66%) be-lieved doing more than one type of homework maximized their learning. Completing only a single homework type showed a strong preference to textbook over online homework (31% for textbook, 4% for online). Doing online homework as the only preparation for in-class quizzes and exams with pencil and paper may be analogous to mastering hitting home runs on a video game and then trying to hit a home run off of a major league pitcher.
The final multiple-choice question collected data on the number of Blackboard quizzes the student completed over the course of the semester (out of 12). More than two-thirds of the class completed two or fewer Blackboard quizzes. The responses confirm the fact that optional assignments are rarely completed.
A free-response question collected the students’ ideas on the aspect of online homework that helped them learn, what they would change or improve about the Sapling system, and a space for other comments. The hints and problems with step-by-step walkthrough were mentioned numerous times as helping the students grasp the problem solving (Table 6). Other representative comments reiterate points presented earlier, including taking significantly more time to complete than the Blackboard quizzes. Students wrote that online homework was more difficult than textbook homework, but it is unclear whether this feeling stems from not having the solutions manual when stuck on a problem (see final com-ment in Table 6). Overall, additional problems requiring step-by-step problem solving appear to make the students feel more prepared for quizzes and exams (based on these written responses).
Finally, the online homework evaluations and the standard university evaluations tallied several students requesting to do online homework as long as they (the students) do not have to pay for it. The cost per student is $34.99, but was discounted because the fee was paid by univer-sity funds. The concern about cost is legitimate with textbook prices for the latest version of the Felder text topping $200. If online homework is used in future semesters at the Colorado School of Mines, the cost of online homework will be paid for by the students, likely bundled with the textbook or e-book. The cost of personalized, online homework systems will likely fluctuate as publishers, third-party companies like Sapling, and open-source materials become widely avail-able in the coming years.
CONCLUDING REMARKS An experiment with personalized online home-
work with embedded hints and guides to encourage students to learn problem solving was completed. At the beginning of the 21st century, textbook homework problems are becoming less valuable as problems are stagnant (i.e., same year to year) and solution manuals are readily available. Two groups of students were compared. One group completed online homework (with its related problem solving and higher-order thinking) while a second group of students completed simple multiple-choice reading quizzes each week. Statistically significant improve-ments in student achievement was observed on two of the most difficult course topics, namely reaction with recycle and vapor-liquid equilibrium problems. Final course grades of the section completing the online homework found 91% of the class receive C or better while only 72% of the control group did (a statistically significant result based on a hypothesis test between two means). Finally, student evaluations show that textbook homework is preferred to online homework, but requiring both online and textbook homework was thought to maximize learning by 66% of the section completing online homework. Overall, online homework is a viable technology that can improve student achievement and should be imple-mented if resources allow.
ACKNOWLEDGMENTS The author acknowledges the Center for Engineering Edu-
cation and the Department of Chemical Engineering at the Colorado School of Mines for funding the online homework experiment during the Spring 2010 semester. The Trefny Institute for Educational Innovation at the Colorado School of Mines also provided financial support to the author to complete this work. The author would like to acknowledge Ron Miller and Keith Neeves for help with manuscript preparation.
TABLE 6Samples of Written Comments From Students About Online HomeworkThey are harder than normal problems, but having hints/explanations/tutorials helped.
I like the fact I could learn the material without too much penalty.
The explanations helped me understand where I was going wrong on the problems.
The Sapling problems helped me to understand the material by offering hints and explanations.
The detailed feedback on the questions I answered wrong helped me understand the concepts much better.
Sapling helps me learn the material a lot more than Blackboard quizzes because we have to work out problems and show our understanding step by step.
By doing Sapling before Felder, the Felder homework became easier.
I liked the hints given. It helped to teach a lesson rather than test a lesson.
As long as we aren’t paying for it, I think it is a great idea.
The BBQs I did generally took 30-60 minutes at the most where as the Sapling gener-ally for that week takes two or three times as long.
The step-by-step format of the problem allowed me to establish my concepts better.
Can we get solutions manuals for Sapling?

Chemical Engineering Education190
DISCLAIMER Sapling Learning, which provided the online homework
system used in this work, did not compensate the author in any way.
REFERENCES 1. Tapscott, D., Grown Up Digital [electronic resource]: How the
Net Generation is Changing Your World, McGraw-Hill, New York (2009)
2. Palfrey, J., and U. Gasser, Born Digital: Understand the First Genera-tion of Digital Natives, Basic Books, New York (2008)
3. Digital Natives blog, in Digital Natives (2009) 4. Pletka, B., Educating the Net Generation: How to Engage Students in
the 21st Century, Santa Monica Press, Santa Monica, CA (2007) 5. Kowalski, S.E., F.V. Kowalski, and T.Q. Gardner, “Lessons Learned
When Gathering Real-Time Formative Assessment in the University Classroom Using Tablet PCs,” in Proceedings of the 39th ASEE/IEEE Frontiers in Education Conference, San Antonio, TX (2009)
6. Liberatore, M.W., “YouTube Fridays: Engaging the Net Generation in Five Minutes a Week,” Chem. Eng. Ed., 44(3) 215 (2010)
7. Baylor, A.L., and D. Ritchie, “What Factors Facilitate Teacher Skill, Teacher Morale, and Perceived Student Learning in Technology-Using Classrooms?,” Computers & Education, 39(4) 395 (2002)
8. Prince, M., “Does Active Learning Work? A Review of the Research,” J. Eng. Ed., 2004 (July) 223-231
9. Felder, R.M., and R.W. Rousseau, Elementary Principles of Chemical
Processes, 3rd Ed., Wiley (2005) 10. Himmelblau, D.M., and J.B. Riggs, Basic Principles and Calculations
in Chemical Engineering, 7th Ed. (2003) 11. Boroughs, D., “ ‘Bye the Book,” Prism, 2010(April) 28-33 12. Steif, P.S., and A. Dollar, “Study of Usage Patterns and Learning Gains in
a Web-Based Interactive Static Course,” J. Eng. Ed., 98(4) 321 (2009) 13. McGroarty, E., et al., Supplementing Introductory Biology With On-
line Curriculum,” Biochemistry and Molecular Biology Ed., 32(1) 20 (2004)
14. Kortemeyer, G., et al., “Experiences Using the Open-Source Learning Content Management and Assessment System LON-CAPA in Introduc-tory Physics Courses,” American J. Physics, 76(4-5) 438 (2008)
15. Sapling Learning. [cited 2010 Aug. 16]; Available from: <http://www.saplinglearning.com/>
16. Komives, C., BioEMB: Bioengineering Educational Materials Bank. [cited 2010 Aug. 16]; Available from: <http://www.engr.sjsu.edu/~bioemb/>
17. Bloom, B.S., ed. TaxonomyofEducationalObjectives:theclassifica-tion of educational goals 1956, Longmans, Green, New York
18. Novak, G., et al., Just-In-Time Teaching: Blending Active Learning with Web Technology, Prentice Hall, Upper Saddle River, NJ (1999)
19. Simkins, S.P., and M.H. Maier, eds. Just-in-Time Teaching: Across the Disciplines, Across the Academy, Stylus Publishing: Sterling, VA (2010)
20. Box, G.E.P., J.S. Hunter, and W.G. Hunter, StatisticforExperimenters, John Wiley & Sons, Hoboken, NJ (2005)
21. Devore, J.L., Probability and Statistics for Engineering and the Sci-ences, Wadsworth, Belmont, CA (1995) p

Vol. 45, No. 3, Summer 2011 191
Schools teach you to imitate. If you don’t imitate what the teacher wants you get a bad grade. Here in college it was more sophisticated, of course; you were supposed
to imitate the teacher in such a way as to convince the teacher you were not imitating. (Robert Pirsig)
Teaching means creating situations where structures can be discovered: it does not mean transmitting structures which may be assimilated at nothing other than a verbal level. (Jean Piaget)
Learning takes place through the active behavior of the stu-dent: it is what he does that he learns, not what the teacher does. (Ralph Tyler)
Teaching and learning are correlative or corresponding pro-cesses, as much so as selling and buying. One might as well say he has sold when no one has bought, as to say that he has taught when no one has learned. (John Dewey)
I had a terrible education. I attended a school for emotionally disturbed teachers. (Woody Allen)
It is not the teacher’s task to teach interesting things, but to make interesting the things that must be taught. (C.S. Schlicter)
It’s an insane tragedy that 700,000 people get a diploma each year and can’t read the damned diploma. (William Brock)
I write when I’m inspired, and I see to it that I’m inspired at nine o’clock every morning. (Peter De Vries)
The intuitive mind is a sacred gift and the rational mind is a faithful servant. We have created a society that honors the servant and has forgotten the gift. (Albert Einstein)
Any subject can be effectively taught in some intellectually honest form to any child at any stage of development. (Jerome Bruner)
The illiterate of the future will not be the person who cannot read. It will be the person who does not know how to learn. (Alvin Toffler)
What’s another word for thesaurus? (Steven Wright)
Nine tenths of education is encouragement. (Anatole France)
Good teaching is one-fourth preparation and three-fourths pure theatre. (Gail Godwin)
Education has failed in a very serious way to convey the most important lesson science can teach: skepticism. (David Suzuki)
Self-education is, I firmly believe, the only kind of education there is. (Isaac Asimov)
What does education often do? It makes a straight-cut ditch of a free, meandering brook. (Henry Thoreau)
What if there were no hypothetical questions? (George Carlin)
In what may as well be starkly labeled smug satisfaction, an amazing 94% [of college instructors] rate themselves as above average teachers, and 68% rank themselves in the top quarter of teaching performances. (Patricia Cross)
When I heard the learn’d astronomer,When the proofs, the figures, were ranged in columns before me,When I was shown the charts and diagrams, to add, divide, and measure them,When I sitting heard the astronomer where he lectured with much applause in the lecture room,How soon unaccountable I became tired and sick,Till rising and gliding out I wander’d off by myself,In the mystical moist night-air, and from time to time,Look’d up in perfect silence at the stars.(Walt Whitman)
Random Thoughts . . .
SPEAKING OF EDUCATION—IVRichaRd m. FeldeR
North Carolina State University
Richard M. Felder is Hoechst Celanese Professor Emeritus of Chemical Engineering at North Carolina State University. He is co-author of Elementary Principles of Chemical Processes (Wiley, 2005) and numerous articles on chemical process engineering and engineering and science education, and regularly presents workshops on ef-fective college teaching at campuses and conferences around the world. Many of his publications can be seen at <www.ncsu.edu/effective_teaching>.
© Copyright ChE Division of ASEE 2011

Chemical Engineering Education192
I was a late bloomer when it came to teaching. After finishing my Ph.D. at Carnegie Mellon in the area of process design and optimization, I briefly considered academia, but thought, “If I’m going to teach people how to design processes, I’d better first design one myself.” And so I did. Working as an engineer at Eastman Chemical Company for nine years, I learned firsthand about how industry works and what it expects of new graduates. I enjoyed using the technical skills I had honed while getting my Ph.D., but I tended to enjoy most those positions that involved coaching other people. When I had the chance to return to NC State (my alma mater) in 2000 as the Undergraduate Director, I jumped at the chance. The fact that I had never taught before was intimidating, but I decided to make the leap, and I have never regretted it.
When asked why I teach, the following anecdote comes to mind. My colleague Carol Schroeder, the Director of the NC State Career Center, was helping a chemical engineering student who was seeking an in-ternship at a local company. The details of the student’s request required quite a bit of legwork on Carol’s part to chase down some funding opportunities. One of her co-workers expressed disbelief that she would spend so much time to help just one student. The co-worker admonished her, “For goodness sakes, Carol, n = 1!” Or, in other words, “How can you afford to spend so much time helping one student when there are so many others who also need your help?” As Carol shared this story with me, we agreed that, in education, “n always equals 1.” To the extent that I possibly can, I view each student as an individual in need of support, assistance, and encouragement.
Given our large department of 596 undergradu-ate students, balancing my advising load with my teaching responsibilities can be a challenge. One day last semester, I was dreading a very busy day ahead. As I thought about my day, with students
filing in every few minutes and a long line forming outside my office, I suddenly had a mental picture of a student coming through my door carrying a beautifully wrapped package in her hands. Looking at this student holding her package, I had a choice: I could tear open the package, toss the wrapping aside, take a brief look at the contents, and then get down to business. OR, I could accept the package, spend a moment admiring the beautiful wrapping, carefully unwrap it, take a few more moments to admire the contents, and thank the person for sharing this beau-tiful and special package with me. Here’s the thing: the second approach doesn’t necessarily take more time than the first, but it does require being totally present during my time with the student. This image so moved me that I bought some beautiful wrapping paper and a lovely bow and wrapped a small square box to sit on my desk where I can see it each time a student comes in. It reminds me that each person who walks through my door comes in holding an invisible package. Each is an offering to me, and it’s my choice as to how to respond to the gifts given: their talents, their hopes, and their fears.
Research is clear that if an undergraduate student connects with at least one person on campus, her chances of staying in her major and graduating increase dramatically. NC State is a big school. It’s easy for students to fall through the cracks. Teachers are the front line to connect with students—students who come to our office hours holding an invisible beauti-fully wrapped package and who appreciate our taking the time to receive it. I teach and advise because I hope to be the one who might provide that crucial bit of encouragement, support, or assistance to a student for whom it will make all the difference between staying or going, floundering or blossoming. For me, teach-ing is a calling, not just a job. For me as a teacher, n always equals 1.
Why I Teach(and Advise)
Lisa Bullard, CEE Publications Board
INVITED GUEST EDITORIAL

Vol. 45, No. 3, Summer 2011 193
Most undergraduate laboratory courses require groups of students to reproduce specific experi-ments repeatedly over the course of a term or year.
While such repetition might ensure that all students achieve a minimal level of understanding or proficiency, teachers are hard pressed to ensure that each group performs its own experiments, turns in its own work, and does not “borrow” from prior groups. All experiments can be only moderately complex, since students are not allowed to communicate with others and learn from their experience. Students are then faced with the prospect of translating the skills they learn in these isolated experiments into the effective research practices they will be required to use for the rest of their careers.
We have developed a completely different approach to teaching the undergraduate laboratory course that solves the problems associated with repetition by doing away with repetition entirely. We treat each experimental assignment as a charge to study a specific problem that the students them-selves propose based on the experience gained by previous groups running the same experimental apparata, the concepts the students have learned in their classes, and journal articles and/or books they have found. We challenge each new group of students to build on the results of prior groups and to achieve different, increasingly sophisticated goals.
This format requires that experimental stations be suf-ficiently complex that they enable successive groups to tackle progressively more and more sophisticated experiments throughout the year. Each group is involved in experiments at most experimental stations by the end of the year, and each experimental station carries with it a different level of
A MOVEABLE FEAST—A Progressive Approach to the Unit Operations Laboratory
Wm. cuRTis conneR JR., KaRl d. hammond,* and RobeRT l. lauRence
UniversityofMassachusetts•Amherst,MA01003
* Present address: Department of Nuclear Engineering, University of Tennessee,Knoxville,TN,37996.
© Copyright ChE Division of ASEE 2011
William Curtis Conner Jr. completed his B.S. in chemical engineering in 1968 and his Ph.D. in catalytic chemistry in 1973, both at the Johns Hopkins University. After four years at the Allied Chemical Corporation, he joined the faculty of the University of Massachusetts Amherst in chemical engineering in 1979. Most recently, he has studied the influence of microwaves on catalysis, sorption, and porous catalyst synthesis.
Karl Hammond studied chemical engineering at Caltech, where he earned a B.S. in 2003. Between 2004 and 2009, he earned his Ph.D. in chemical engineering at the University of Massachusetts Amherst. He was a lecturer at UMass Amherst in chemical engineering for the fall of 2009, teaching the un-dergraduate laboratory course. He is currently a post-doctoral researcher at the University of Tennessee, Knoxville, where he studies the materials science associated with magnetic confinement fusion.
Robert Laurence is a professor of chemical engineering (emeritus) at the University of Massachusetts Amherst, where he joined the faculty in 1968. He obtained his Sc.B. in chemical engineering practice from MIT in 1957, continued on to the University of Rhode Island for a master’s degree (1960), and earned his Ph.D. from Northwestern University in 1965. He has spent his career studying polymerization kinetics and reactor engineering and modeling polymeriza-tion processes; he is a co-author of the textbook Polymerization Process Modeling (Wiley-VCH, 1995). Professor Laurence is the namesake of the Robert L. Laurence Award of the New England Rugby Football Union.
ChE classroom

Chemical Engineering Education194
prior research—the first station is essentially a “new proj-ect,” while the last station represents the combined effort of months of research by colleagues (which they are then to continue). Further modifications to the laboratory procedure (manuals and working knowledge) are implemented by the students throughout the term of the laboratory and from year to year to enable knowledge and skills to be passed along to subsequent groups.
This laboratory approach was developed over the course of several years, and was catalyzed by a $250,000 grant from Analog Devices in 1987. This grant enabled us to integrate process control computers and online monitoring and control instruments throughout the laboratory.[1] The laboratory has developed into one of our capstone courses, wherein all as-pects of the curricula are revisited and reviewed. Our faculty supports expending the effort to continue to develop this course. This course is valued at four credits due to the oral and written reports involved.
STRUCTURE OF THE COURSEIn contrast to conventional laboratory courses—such as
those our students experience in introductory chemistry and physics—in which students are discouraged from using results from prior groups, we require students to share their results with groups that will be using the same experimental station to perform a modified experiment. The students are asked to give a proposal to ensure their planned experiment will be feasible and will supplement the knowledge gained by previous groups. This is accomplished through oral pre-sentations given to the entire class. Students are encouraged and expected to ask questions and listen to the instructors’ questions as well. We also ask students to share comments with the presenters (funneled through the teaching assistants to ensure anonymity) so as to better their presentations for the next round. At the end of each cycle, the students give a final oral report to the class (and again are required to ask questions and give peer review), followed by a written report describing what they have learned. This report is intended to be similar to a technical report or journal article.
At the beginning of the year, students are asked to divide themselves into groups of three to four students each. Larger groups are inadvisable—it becomes easy for one or more stu-dents to “coast” in a large group, learning little while getting by on their group members’ hard work. Each group is asked to do three experiments per semester (for groups of three) or four per semester (for groups of four), and each of the members of the group serves as group leader for one experiment. This individual is required to coordinate the overall operation of the group, give the oral reports, coordinate peer reviews of other group leaders’ presentations, and be the final authority on the content of the final written report.
Each group is in the laboratory for five four-hour periods (the fifth is a make-up period) per experiment and is involved
in the oral proposal/report periods. This reflects a total of about 24 hours over six afternoons per experiment, with three or four experiments per semester. Groups rotate between the 10 to 12 experimental stations described below. There are 40 potential laboratory periods per semester, and the laboratory hours thus fill half of these with days not in the laboratory. These days are used for reports, data analysis, report writing, and some classroom instruction. Classroom instruction includes scientific literature searching, safety, hazardous-waste handling, and supplemental topics specific to certain experiments.
The rest of this section outlines a typical sequence of events for one cycle of the laboratory, during which each group does experiments at one station.
PRELIMINARY PROPOSALSAbout two to four days before the students enter the labo-
ratory, they give an oral presentation to the entire class (in-structors and students) that details what they plan to do with their time in the lab. For the first experiment, this proposal is largely based on the initial assignment given to them by the instructors (similar to what might be done in a traditional laboratory course). In subsequent cycles and during the sec-ond semester, the groups propose the experiments they will do after consultation with the literature, prior groups and their reports/presentations, and the instructors. Each group’s group leader—because the leadership position rotates with each experiment, each student does it twice throughout the year—presents an oral presentation to the class and instruc-tors. This is typically 15-20 minutes plus 15-20 minutes of discussion and includes:1. Introductiontotheexperimentanditsapplications
outside the laboratory2. Background/theory(includingresultsfrompriorgroups
and literature)3. Experimentalequipmentandprocedure4. Data collection and analyses to be performed, espe-
cially those methods that differ from those employed by previous groups
5. Unusualsafetyand/orpracticalprecautionsandproce-dures
CONDUCTING EXPERIMENTSThe students are allowed five four-hour periods in the
laboratory in which to conduct their experiments, with the fifth period specifically designated as an “extra” day in which to check results and/or compensate for equipment glitches in previous periods. The students are required to analyze the results during this time period and are expected to show graphs and preliminary analyses when they come into the laboratory for the third period. This minimizes the number of incidents in which students gather four or five laboratory periods’ worth of data, stay up all night analyzing them, and

Vol. 45, No. 3, Summer 2011 195
attempt to write up their results only to realize that they did not collect enough data to complete their analyses and/or need to repeat some experiment or another.
Students are supervised in the laboratory by at least one teaching assistant, who is primarily responsible for answering questions and ensuring that the students observe proper safety practices and label hazardous waste and storage containers properly. The teaching assistants are asked to “check out” each group at the end of the laboratory by looking at the experimen-tal station and the students’ lab notebooks and checking each for consistency with safety and data integrity policies.
FINAL REPORTSFinal oral reports are presented two to four school days after
the last laboratory session during each cycle. The group lead-ers present 15–20 minute presentations focusing on results and analyses, especially those results that differed from or were unexpected based on the results of previous groups’ studies. Each group is also charged with suggesting experiments for the next group on the same experimental station. The students and instructors ask questions during and after these reports, which help each group refine the analyses and better under-stand the results. These suggestions are usually incorporated into the final written report, due a week or so later. Peer and self-evaluations (all oral presentations are videotaped for self-analyses) are submitted electronically to the instructors. The peer reviews are compiled by one of the teaching assistants and sent back to the presenters anonymously.
About a week after the final presentations (during which the proposals for the next experiment and possibly the first day of the next experimental cycle are occurring), the students hand in their final report for that experiment. This report incorpo-rates discussion of results obtained by the group writing the report, from the group(s) that ran the experiment in past lab cycles, and from the scientific literature and/or their textbooks. The structure of this report is typical of a technical report. The entire process gives our students their first real experi-ence with scientific writing, from developing a proposal to searching for prior literature on the topic to structuring and communicating their results to their colleagues. We employ Turnitin® to scan all reports for plagiarism from prior reports and other sources. Plagiarism is punished severely, in accor-dance with university policy.
EXPERIMENTAL STATIONSWe currently have 12 experimental stations in our labora-
tory, up to eight of which are used at any given time. This is an ever-changing list, as we modify several of the experiments each year and add one new experiment every two years on the average. Less productive experiments—those that are dif-ficult to perform and/or do not serve as effectively as teaching aids—are typically phased out to make way for more “cur-rent” experiments. For example, four years ago we developed
a biodiesel experiment, which produces diesel-range fuel from vegetable oil that can be used in a 6 kW diesel genera-tor by students in mechanical engineering. Nearly all of our experiments have interfaces with computer controls, which allow us to encode flexible, changeable interfaces with which to run any number of experiments.[1] A description of each experiment currently used in our laboratory is given in the rest of this section.
1. Methanation in a Fixed-Bed Catalytic ReactorSyngas (CO + H2) is reacted over a Ni/Al2O3 catalyst to
produce methane and water. We have two reactors, one ap-proximating a CSTR and the other a PFR. An in-line infrared CO detector is employed to quantify the conversion. Aspects that can be studied include the general kinetics (Lang-muir–Hinshelwood kinetics), including activation energies; the regions for diffusion control; and catalyst deactivation (and regeneration). Using the attached computer, one can manipulate the compositions via mass flow controllers and the reaction temperatures in each reactor via a PID control-ler. The catalyst can be changed such that later groups can make their own catalysts for study if desired. Students are encouraged to make use of a BET system in another labora-tory to estimate surface areas and eventually estimate catalyst turnover frequencies.
2. Polymerization KineticsAlkyl methacrylates (methyl- and others) are polymerized
using AIBN or benzoyl peroxide as initiators in this batch polymerization studied in a dilatometer. The polymeriza-tion reaction can be run in several ways: bulk (no solvent), solution/slurry, or emulsion in a selection of solvents. An oil bath is employed to control the temperature. Differences in the kinetics are studied; specifically, the apparent activation energies will differ under different conditions. In most cases, the differences will be reflected in the nature of the polymer product that is produced. The molecular weight (MN, MW) and its distribution (PDI) are measured with gel permeation chromatography (GPC) in our polymer science and engi-neering department. These experiments are typical of the development of new polymer products, wherein a range of reaction variables is studied to produce polymers for specific applications based on the polymer properties (molecular weight and its distribution).
3. Binary DistillationMethanol is separated from water using a 13-foot bubble-
plate column with 13 trays. Reflux, steam, product, and feed flows can be manipulated while each tray’s temperature, the reboiler height, and the steam pressure are measured online by a computer. A gas chromatograph (GC) is employed to analyze gas or liquid compositions drawn from each tray. The primary control variables are the steam flow rate into the reboiler and the reflux flow rate. The dependent variables are the bottoms and distillate compositions. There are logical

Chemical Engineering Education196
combinations of control and manipulated variables: steam-bottoms and reflux-distillate. It is crucial that the students present a proper energy analysis of this system. The dynamics of this semi-pilot sized system are somewhat slow and the optimum protocol for changes in the system parameters can be investigated. A diagram of the computer interface for this experiment is shown in Figure 1.
4. Production of Biodiesel From Vegetable OilVegetable oils are converted to diesel fuel replacements
(fatty acid alkyl esters) by transesterification with methanol or ethanol. The reaction is base-catalyzed, and students have the ability to choose between several catalysts, including NaOH, NaOCH3, KOH, KOCH3, Ca(OH)2, Ca(OCH3)2, and SrO. The students have the opportunity to study the catalytic kinetics of the process, which, in excess methanol, is roughly an A→B→C→D irreversible reaction (where A, B, C, and D are the triglyceride, diglyceride, monoglyceride, and fatty acid alkyl ester, respectively). The products are analyzed by gas chromatography, if appropriate, or high-pressure liquid chromatography. The pH is measured for waste oil feeds to ascertain any free fatty acids present and the presence of water is quantified in each phase before and after reaction.
5. Characterization & Control of a Heat ExchangerThis station consists of two sequential shell-and-tube heat
exchangers: a steam-water heat exchanger followed by a wa-ter-water heat exchanger. The water-water heat exchanger can be operated in co-current or counter-current configurations. Temperature is measured at 15 positions throughout the water streams, inside the steam chamber, and on the steam pipe walls. These temperatures are monitored by a computer, which also allows the students to control the water and steam flows. The focus of the first few experimental cycles is typically on the mechanics of heat exchange in the various configurations: measuring heat transfer coefficients, co-current vs. counter-current, verifying correlations for the Nusselt number vs. Reynolds number, and so on.
The focus of later experiments is typically on control. There are several options available to control the heat exchanger, and students are asked to choose one. These options include control of any of several temperatures (of the process or cooling water at various points), employing any of several inputs (steam, cooling, and process water), and using vari-ous control strategies (open-loop modeling, tuning relations, step/impulse responses, and frequency response). At first, simple P, PI, PD, and PID control can be employed. Students are encouraged to use simulation methods, especially with MATLAB® and Simulink,® to interpret their results (with and without feedback) as early as possible. This station is also able to study frequency response techniques, including gain/phase margin, Bode diagrams, and Nyquist diagrams—a part of control theory that is often overlooked in chemical engineering courses.
6. Membrane Separation by PermeationThe permeation station, similar to those described by Da-
vis and Sandall,[2,3] allows students to study the enrichment of oxygen from binary and ternary gas mixtures flowing in series or in parallel into two polymeric membranes (Permea, Inc.; St. Louis, MO). Groups investigate the separation of oxygen from nitrogen, argon, helium, or carbon dioxide as binary mixtures. In later experiments, students can choose to work with mixtures of oxygen and carbon dioxide in ternary mixtures, such as N2/O2/CO2 and He/O2/CO2, often with different mole fractions. We have an online infrared detector in addition to oxygen sensors to allow the students to detect carbon dioxide as well as oxygen. Groups propose to compare the enrichment of oxygen as a function of flow rate/back pressure from different feeds and to compare these to prior separations (employing different feed compositions and/or different column configurations).7. Ion Exchange
The ion exchange station employs a variety of ion-exchange resins for the removal of cupric sulfate (or optionally other metals) from an aqueous solution. A 4-inch-long column, 1/2 inch in diameter, is employed with an in-line UV/visible spec-trometer as a detector. A controllable liquid pump is employed along with valves to bypass the column and change the feeds. We have several resins of differing capacities and mesh sizes available, all strong acid cation resins produced by Dow. Each new group chooses a resin to compare to the prior results and to show and explain the differences. Equilibrium adsorption isotherms are measured in batch experiments prior to the online measurements in the column by computer. Column regeneration and the dynamics of the processes involved can also be studied. Pressure and flow measurements across the column enable the students to analyze flow in porous media. Modeling the column as a series of CSTR’s and/or PFR’s is encouraged.8. pH Control
This experiment involves the control of a liquid-phase stirred tank reactor to control the pH of acid-base streams. The basic setup is based on the work of Henson.[4] As in all control situations, the initial approach is to understand and analyze the dynamics followed by the design and implementation of a control scheme. A buffer stream can also be introduced into the reactor as a disturbance as well as a way to moderate the pH. Students have the potential to control several reactor
Figure 1 (facing page). Computer interface for our distil-lation experiment. The upper portion of the interface allows students to adjust the gains to simple PID con-
trollers, while the rest of the diagram reports all online measurements. This type of interface allows the students to perform a wide variety of experiments on the column.
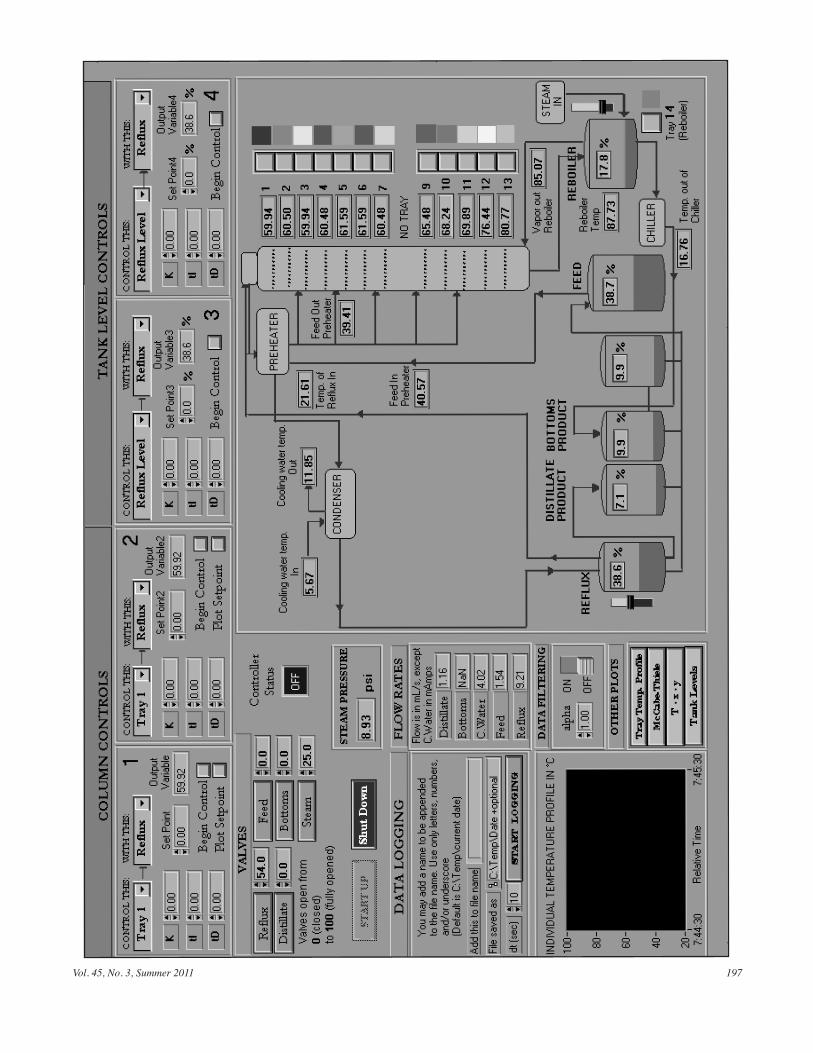
Vol. 45, No. 3, Summer 2011 197

Chemical Engineering Education198
parameters, including acid, base, and buffer flow rates (in and out); reactor volume (liquid depth); and reactor stirring. There are any of several control schemes that can be implemented from simple P/PI/PID to MIMO. Groups choose a scheme, collect appropriate data on dynamics, implement the scheme, and evaluate the resulting controlled dynamics. The nonlin-earity of pH is a challenge. Groups can build on the work of previous groups to implement more and more sophisticated controllers in later cycles. Frequency response analysis can be utilized in these experiments as well, if desired.9. Polymer Extrusion
The purpose of polymer extrusion is to produce a continu-ous strand of polymer of uniform dimension from pellets. Several dies of varying dimensions, including round and ribbon dies, are available. The conditions throughout the extruder control the nature of the product. This experiment should employ experimental design techniques to optimize the production process and its influence on dimension and uniformity for different die sizes. We have several choices of polymers available, and each group is charged with character-izing the product in terms of dimension and uniformity. Die swelling can be a complicating factor for certain polymers under specific conditions, and the students are asked to es-timate the extent of die swelling for their polymer. We have access to differential scanning calorimetry to characterize the polymer crystallinity, which will depend on process condi-tions. By employing polymers of different colors, students may be able to estimate the uniformity of the mixing during the extrusion process and examine the effects of mixing on material properties. A photograph of our extruder in operation is included as Figure 2.10. Polymer Injection Molding
This station makes use of a polymer injection molding apparatus to produce a part (plastic dog bone or spiral) with certain properties. Dog bones can be tested with an Instron mechanical testing instrument to compute engineering stress/strain curves either in stretch to failure or three-point bending. Normally, the goal is to produce the strongest part, but it could also be to produce a part that breaks within a given range of stresses. There are several variables that can be manipulated in this process that change the strength, uniformity, and/or mechanical performance of the final part. These are ideally suited to experimental design techniques, which allow the students to learn as much as possible while wasting as little time and material as possible. The spiral mold allows students to study heat transfer and viscosity as a function of injection pressure by observing how far the polymer makes it into the mold. We have several polymers to choose from for injection molding and extrusion, includ-ing polycarbonate (Lexan®), acrylonitrilebutadiene-styrene (Cycolac®), polypropylene-poly(phenylene oxide) (Noryl®), and high-density polyethylenes of different molecular weights and polydispersity indices.
11. FermentationThis experiment studies fermentation of sugars—either
synthetic sugar/water solutions or juices—using a 1.25 L BioFlo III stirred tank fermenter (New Brunswick Scientific; Edison, NJ). This allows students to study a living catalyst (yeast) and measure the kinetics of the yeast’s production of ethanol. Two varieties of yeast are available, each of which produces a different rate of sugar metabolism. The setup allows students to change reactor volume, stirring rate, and sugar source. Students are expected to test and understand the changing kinetics of yeast growth and ethanol produc-tion to determine the optimum mixing, feed (including O2), and temperature settings that maximize alcohol production and/or yeast growth. The groups can also measure the total CO2 production due to yeast growth and alcohol production by performing a total carbon balance for the process.
12. Protein SeparationThis experiment uses chromatography to separate active
biological enzymes (acid phosphotase, AcP) from wheat germ or non-pathogenic E. coli bacteria. Students extract AcP using osmotic lysis, pass the extracted material through an ion exchange chromatographic column and collect fractions, measure the enzyme concentration of each fraction, measure the total protein content of each fraction, and use this infor-mation to improve the process and make suggestions for the design of an industrial-scale system. Enzyme concentrations are determined by measuring the rate of the enzyme-catalyzed
Figure 2. Students extruding Lexan® (polycarbonate) with a ribbon die while following the solidification on the
conveyor belt using an infrared camera.

Vol. 45, No. 3, Summer 2011 199
conversion of p-nitrophenyl phosphate into p-nitrophenol by assuming Michaelis–Menten kinetics with excess substrate. We have recently acquired a UV-Vis spectrometer to follow the separations on-line with a flow cell.
EXAMPLE PROJECT PROGRESSIONSThere are many possible sequences of projects that can be
accomplished at each experimental station over the course of the year. We give three examples here, based on students’ work in one particular semester.Methanation
The first two groups attempted to extract the apparent reac-tion order using the CSTR. The third group found their results to be inconsistent, so they proposed to study the same thing (apparent reaction order) using the PFR instead. The fourth group, similarly, found their results to be questionable, so they proposed experiments to measure (a) the order of the reaction, (b) the activation energy (by studying different temperatures), and (c) the effect of residence time on conversion (and whether it was consistent with the orders found by previous groups). Another group proposed to do experiments to estimate the Thiele modulus and therefore the extent of diffusion vs. reac-tion control, as well as the turnover frequency.
This sequence is typical of a first semester: students think they understand kinetics and reactor engineering, proceed to take measurements of, say, the rate, plot it against inlet concentration over a relatively narrow range of conversions, and assume they have a graph that tells them the reaction order. The instructors point out the error of their ways, and they either attempt to fix it in later experiments or explain the problem in the final report so that subsequent groups can do the experiment over again (with their own modifications) to obtain the results they think are appropriate and correct. The resulting reaction orders and activation energies can be compared to the numerous literature studies of methanation over similar nickel catalysts. Langmuir–Hinshelwood rate ex-pressions are employed to rationalize the observed orders.Heat Exchange
The first groups proposed to measure the heat transfer coef-ficients in the steam-water section and the water-water section, respectively. The next group proposed to corroborate the first groups’ values through Wilson plots and other correlation-based methods. Subsequent groups attempted to characterize the response of the process water temperature to a change in process water flow rate, finding a first order plus time delay model to be more or less adequate. Another group chose to characterize the response of process water temperature to changes in cooling water flow rate, finding that a second order model that included inverse response was necessary; another group varied steam pressure. Later groups attempted to find the effective operating range of the models they had developed, the range of PID gains that could be used, and the
frequency response (closed and open-loop Bode diagrams and resulting analysis) of both their models and the real system. All later groups explored the differences—particularly the non-linearities and actuator saturations that exist—between their model and the real thing.
The heat exchanger, when used in this manner, is a particu-larly effective teaching tool: students learn that they are not quite as comfortable as they thought they were with concepts such as overall heat transfer coefficients and effectiveness fac-tors, and they learn volumes about the practicalities of control that are only possible to hint at in a classroom setting.Polymer Extrusion
The first group to study extrusion was given its choice of polymer among the five polymers and several batches per polymer available, selecting a particular batch of Lexan polycarbonate. They observed correlations between tem-perature and pressure, torque and flow rate, and torque and temperature at a given screw speed. They also found (perhaps unwittingly) that drawing the polymer during cooling changes the tensile strength. Subsequent groups studied each of these phenomena in more depth. One group attempted to maximize tensile strength in high-density polyethylene (HDPE); another studied the effect of screw speed vs. ultimate tensile strength in HDPE; another studied the effects of mechanically mixing different colors and lots of Lexan polycarbonate; the next studied the effect of nozzle temperature and cooling rate on the extent of crystallinity in HDPE; another studied the effects of nozzle temperature, screw speed, and composition for mixing two batches of Noryl PPX [poly(phenylene ether) mixed with polypropylene], also studying the effect of drawing rate on physical properties. The last group studied die swell using a circular die using Lexan polycarbonate and Noryl PPX. The extrusion and injection molding experiments are, for many students, the first exposure to things like stress and strain, polymer rheology, and concepts like tensile strength.
OUTCOMESOur unit operations laboratory has developed into a cap-
stone course in our curriculum. It draws upon and incorporates material from all prior courses in the department, including material balances, thermodynamics, fluid mechanics, heat and mass transfer, separations, kinetics and reactor engineering, design, and control. Material from many classes taught outside the department (e.g., spectroscopy, chemistry, rheology) is often utilized as well. Many experiments make use of concepts from several courses, as detailed in Table 1 (next page). In addition, this format accentuates
• Groupwork,includinginter-groupinteractions.
• Leadershipskills
• Oralcommunications,includingself-andpeerreview
• Scientificwriting
• Real-timedataacquisition

Chemical Engineering Education200
•Statisticalanalysisandexperimentaldesign
•Searchingforandunderstandingpriorstudies— including primary literature
•Projectproposals
This format prepares students not only for laboratory work, but teaches them to function as engineers and scien-tists and gives them valuable training across all facets of the discipline.
An ongoing website (<http://www.ecs.umass.edu/che/che401-2/>) is maintained throughout the semester with equipment manuals as well as ongoing lab manuals that are updated as the students learn how best to run each experiment. Safety is a prime concern, and the students receive training before they enter the laboratory and are immediately sent out if violations (such as lack of safety glasses or improper foot-wear) are observed. Students are asked to prepare a “SAFE” form before each new experiment and inform the class of any unusual hazards at the time of their proposal.
Student feedback from this course is generally quite posi-tive, even though the workload is significant. More often than not, the students remark, “Now I know how that actually works!” or “It worked so much better in class….” or “Could we modify the experiment next time to look for…?” The open format allows the last question to be answered “yes” more often than not, which gives the students an additional feeling of empowerment over the work they do.
CONCLUSIONSThis approach to the senior laboratory course has been
integrated into our curriculum for more than 15 years now, and we are very pleased with the outcome. Students learn as much or more about some topics—particularly catalytic and polymerization kinetics—than they ever could in their regular courses. It also empowers students: they develop the assign-ments, they determine which analyses are appropriate, they de-termine the level of work that is necessary to obtain the results they need, and they determine what shreds of knowledge and experience are important enough to warrant being discussed in both their own reports and in the lab manuals. The writing, oral communication, and planning skills they learn as part of the proposal/final report structure are indispensable, giving our students a head start on the skills necessary to create the project/grant proposals, journal articles, technical reports, and other scientific communications they will be asked to write during the remainder of their careers.
ACKNOWLEDGMENTSThe authors thank Sue Roberts, Mike Henson, and Neil
Forbes for their help with the fermentation, pH control, and protein separation experiments as well as numerous students and teaching assistants over the years for writing lab manuals, designing computer interfaces, and testing new experiments. We owe special thanks to Gary Czupkiewicz, Paul Garbin, Joe Smith, and Tom Spooner for providing invaluable techni-
TABLE 1Outcomes From Specific Courses Used in the Course Of Each Experiment
Mas
s/En
ergy
Bala
nces
Ther
mod
ynam
ics
Flui
dM
echa
nics
Hea
tTra
nsfe
r
Mas
sTra
nsfe
r
Kin
etic
s
Reac
torE
ngin
eerin
g
Sepa
ratio
ns
Con
trol
Des
ign
Bio
engi
neer
ing
Poly
mer
s/Rhe
olog
y
Mat
eria
lsSc
ienc
e
Des
ign
ofEx
perim
ents
Methanation X X * * X X * * * *Polymerization * X * * * X * X * X X *Distillation X X X X X * X *Biodiesel * X * * X X X * X *Heat Exchange X X X X * X *Membrane Separation X * X X * * * *Ion Exchange X X X * X X * *pH Control X X X X *Extrusion X X X * X X XInjection Molding X X * * X X XFermentation X X X X * * X *Protein Separation X X X X X * X *
Experimentsthatrequireagivensubjectmatterforallworkonthatstationaredenoted“X”;thosethatcanusethatsubjectmatter(dependingontheexperiment)aredenotedbyanasterisk(*).

Vol. 45, No. 3, Summer 2011 201
cal support and other assistance. The department is greatly indebted to Analog Devices for donating, some 25 years ago, start-up money (so to speak) that allowed us to implement computer-controlled measuring apparatus on most experi-ments in the laboratory. We are also grateful to GE Plastics (now SABIC Innovative Plastics) and DOW (formerly Union Carbide) for donating many of the polymers we use in the extrusion and injection molding experiments. We are also indebted to HiTech Trader and Gillette for the donation of many pieces of equipment for our laboratory.
REFERENCES 1. Conner, W.C., “Incorporation of Process Control Computers in the
Undergraduate Laboratory: A Case Study,” Chem. Eng. Ed., 24(2), 106 (1990)
2. Davis, R.A., and O.C. Sandall, “A Membrane Gas Separation Experi-ment for the Undergraduate Laboratory,” Chem. Eng. Ed., 25(1), 10 (1991)
3. Davis, R.A., and O.C. Sandall, “A Simple Analysis for Gas Separation Membrane Experiments,” Chem. Eng. Ed., 37(1), 74, (2003)
4. Henson, M.A., Feedback Linearization Strategies for Nonlinear Process Control, Ph.D. Dissertation, University of California, Santa Barbara (1992) p

Chemical Engineering Education202
Fundamental Research in Engineering Education
Session 206, “Fundamental Research in Engineering Education,” at the Nashville AIChE meeting in No-vember 2009 was sponsored by group 4 of the National
Program Committee to start a dialog on doing rigorous fun-damental educational research. The session was chaired by Dr. LaRuth McAfee and co-chaired by Drs. David Silverstein and Phil Wankat who made introductory remarks. Papers were presented by Professors Milo Koretsky, Margot Vigeant, and Ron Miller.
Engineering education research is becoming more important as illustrated by: NAE attention and development of CASEE, increased ASEE attention, NSF grants and sponsorship of national colloquiums, tightening of Journal of Engineering Education (JEE) publication requirements, and new Ph.D. programs. Chemical engineering professors (e.g., Felder, Miller, Prince, Shaeiwitz) are currently leaders, but most ChE professors are not trained to do rigorous engineering education research.
The paradigm for quality in engineering education research has slowly ratcheted up and become more rigorous. Before 1993, data, a literature review, and references were not re-quired and the message was often, “I tried it, it worked and students loved it.” In 1993 JEE introduced what I will call the Old Quality Paradigm that papers had to be scholarly. Typically, papers covered course or curriculum innovation and included a short literature review, references, and data in the form of student surveys and/or evaluations. In 2003 and again in 2008 JEE introduced the New Rigorous Paradigm that aimed to place the quality of JEE papers at the level of the best educational journals. This paradigm requires: hypoth-esis in advance, a thorough literature review, grounding the research in learning theory or human development theory, an appropriate mix of quantitative and qualitative research meth-ods, Institutional Review Board (IRB) approval in advance,
© Copyright ChE Division of ASEE 2011
Fundamental Research in Engineering Education: INTRODUCTORY REMARKS
Phil WanKaT
SchoolofChemicalEngineering•PurdueUniversityand testing of the hypothesis during the research. Very few engineering professors have been trained to do engineering education research at this level.
Many important educational items do not fit into this definition of educational research. We still need to have ChE professors working in course and curriculum, laboratory, and homework development. Although JEE will no longer accept papers in these areas, CEE, a peer-reviewed archival journal, and the ASEE and FIE Conference Proceedings happily accept a large number of papers in these areas. These papers will be informed by the rigorous research published in JEE, but will not employ the same research methodology.
The following steps are recommended for professors who want to learn to do rigorous educational research: First, col-laborate with a social scientist. Acceptance rate is 10 times greater in JEE if an engineering professor collaborates with a social scientist. Second, although it takes significant effort, retool and learn how to do rigorous educational research. Methods to do this include attending the NSF-sponsored REE workshops, taking educational research courses on campus, and extensive self-study.
An alternative for professors who do engineering educa-tion research as a hobby or who are slowly learning how to do rigorous research is to initially publish in venues that are less arbitrary in the type of papers they will accept than JEE. There are research journals such as the International Journal of Engineering Education that accept a wider variety of papers than JEE. In addition, many more papers are published in the ASEE and FIE Conference Proceedings than in all of the engineering education research journals combined. Although this alternative is viable for individual professors, to retain its leadership in Engineering Education, ChE must have more professors doing rigorous educational research.

Vol. 45, No. 3, Summer 2011 203
Engineers need to possess a deep understanding of the fundamental concepts of their field. Even advanced engineering students, however, may hold miscon-
ceptions that are “robust” or resistant to instruction.[1] This paper describes an integration of two ongoing research lines combining identification of students’ misconceptions of difficult engineering concepts with efforts to repair some particularly robust misconceptions. Previous studies reported that misconceptions related to heat transfer, fluid mechanics, thermodynamics, and other engineering and science concepts persist among engineering students even after they completed college-level courses in the subjects.[2] Therefore, the first line of our research is focused on two research questions:
•“Whatimportantconceptsinthermalandtransport sciencearedifficultforengineeringstudentstolearn?”
•“Howcanavalidandreliableinstrumentbedevelopedto identify engineering student misconceptions of these difficultandimportantconcepts?”
The first research question was investigated by conducting a Delphi study with experienced engineering faculty to iden-tify important and difficult concepts in thermal and transport science.[3] The second research question was investigated by developing the Thermal and Transport Concept Inventory (TTCI). The TTCI is an instrument that measures the con-ceptual understanding of key ideas in thermodynamics, fluid mechanics, and heat transfer for undergraduate engineering students. Thus, TTCI is also a tool for identifying students’ misconceptions in thermal and transport science. Details of misconception identification and TTCI development are provided in the following section.
IDENTIFYING AND REPAIRING STUDENT MISCONCEPTIONS IN THERMAL
AND TRANSPORT SCIENCE: Concept Inventories and Schema Training Studies
Ronald l. milleR
Colorado School of MinesRuTh a. sTReVeleR
Purdue UniversitydaZhi yang
Boise State Universityaidsa i. sanTiago Román
University of Puerto Rico at MayagüezRonald L. Miller is a professor of chemical engineering and director of the Center for Engineering Education at the Colorado School of Mines, where he has taught chemical engineering and interdisciplinary courses and conducted engineering education research for the past 25 years. He has received three university-wide teaching awards and has held a Jenni teaching fellowship at CSM. He has received grant awards for education research from the National Science Foundation, the U.S. Department of Education FIPSE program, the National Endowment for the Humanities, and the Colorado Commission on Higher Education, and has published widely in the engineering education literature. His research interests include measuring and repairing engineering student misconceptions in thermal and transport science.
Ruth A. Streveler is an assistant professor in the School of Engineering Education at Purdue University. Before coming to Purdue she spent 12 years at Colorado School of Mines, where she was the founding director of the Center for Engineering Education. She earned a B.A. in biology from Indiana University-Bloomington, an M.S. in zoology from the Ohio State University, and a Ph.D in educational psychology from the University of Hawaii at Manoa. Her primary research interest is investigating students’ understanding of difficult concepts in engineering science.
Dazhi Yang is an assistant professor in the Department of Educational Technology at Boise State University. Prior to coming to Boise State, she was a postdoctoral researcher and instructional designer in the School of Engineering Education at Purdue University, West Lafayette, Indiana. Her research interests include technology-assisted learning, especially emerging learning technologies in online and distance education, and effective instructional strategies for teaching difficult and complex science and engineering concepts.
Aidsa I. Santiago Román is an assistant professor in the General Engi-neering Department and director of the Strategic Engineering Education Development Office at the University of Puerto Rico, Mayagüez Campus (UPRM) where she has taught programming and solid mechanics courses since January 2000. She obtained her Ph.D. degree from Purdue University in August 2009. Since then she has received three awards: 2010 UPRM’s Female Engineering Educator, 2010 ASEE ERM Apprentice Faculty Award, and 2010 FIE New Faculty Fellow. Her research interests include measur-ing and repairing bilingual engineering student misconceptions in solid mechanics, programming, and thermal and transport science. Recently, she has received a BRIGE grant award for education research from the National Science Foundation to study the efficacy of the Statics Concept Inventory with bilingual students.
© Copyright ChE Division of ASEE 2011
Fundamental Research in Engineering Education

Chemical Engineering Education204
The second line of our research is focused on how to repair students’ misconceptions of difficult engineering concepts once the misconceptions are identified. As indicated in the misconception literature, some of these misconceptions are particularly robust and therefore are particularly difficult to repair using traditional pedagogical strategies. Thus, for this line of the research, we are testing schema training strategies for helping engineering students develop more fundamentally accurate mental models of selected engineering and science concepts. Specific research questions in this research line include the following:
•Canschematrainingmaterialsbedevelopedtohelpstudents develop appropriate schema for understanding difficultengineeringconcepts?
•Howeffectiveisschematraininginmakingmeasurablechange in students’ conceptual understanding of heat transfer,massdiffusion,andmicrofluidics?
The schema training strategies were based on the assump-tion that students learn new concepts by assimilating or encod-ing new information into an existing schema or framework. Assimilation helps students make inferences about and assign attributes to a new concept or phenomenon. When students begin learning some particularly challenging engineering con-cept that is fundamentally different from their common-sense conception, however, they can make the wrong inference or assign incorrect attributes to the new concept based on their existing incomplete or incorrect schema. For example, a sig-nificant number of students think that the hot or cold sensation we sense when touching an object indicates its temperature when actually it is a measure of how fast energy is transferred into or out of our finger.
To repair such robust misconceptions, Chi and her col-leagues proposed an innovative instructional approach involv-ing schema training methods that focuses on helping students develop appropriate schemas or conceptual frameworks for learning difficult and challenging engineering and science concepts.[4] Such methods were effective in helping middle school students and undergraduate psychology students learn difficult science concepts. We are testing Chi’s theoretical framework by developing effective schema training protocols and materials that help engineering students create appro-priate mental models of fundamentally important dynamic processes and concepts, especially those operating at small length scales.
There is ample evidence in the literature to suggest that stu-dents of all ages (including science and engineering students) do not easily understand fundamental small-scale phenomena such as heat transfer, diffusion, fluid mechanics, and electric-ity.[2] Given the current interest in advances at small length scales (e.g., microfluidics, biotechnology, genetic engineering, nanoscale machines), new engineering graduates must have a firm grasp of fundamental processes that are characterized by small-scale dynamic systems. Therefore, schema training
methods hold promise not only for thermal and transport sci-ence but also for other disciplines in engineering.
METHODSIn this section, we discuss the methodology used to identify
important and difficult thermal and transport science concepts that are included in the TTCI instrument. We also discuss the methodology and procedures used to generate TTCI items and the results of validity and reliability analyses from TTCI pilot testing with engineering students. Development of schema training methodologies and materials is discussed followed by a brief summary of schema training results obtained so far.
Identifying Important But Difficult Concepts in Thermal Science
After considering several methods of identifying important but difficult concepts in thermal and transport science, we choose the Delphi method, which focuses on developing consensus expert opinion. We considered “experts” to be experienced engineering professors who paid close attention to student learning. Over their professional careers, these faculty members have informally collected data about student misconceptions directly from student interactions. Collect-ing misconception data from students themselves would be problematic, however, since students with strongly held misconceptions would not be able to determine if misconcep-tions are difficult and/or important—the task posed to the Delphi study experts. Our experts consisted of 31 engineering professors ranging from assistant to full professors. Five of the experts were also textbook authors. They were asked to complete a generative round to develop candidate concepts and then three rating rounds in which each concept was rated on two scales: importance and difficulty. The non-parametric median and interquartile range were used (rather than mean and standard deviation) because an ordinal scale was used to rate the concepts. The rankings for most concepts stabilized by round two (the median for 19 of the 28 concepts changed by a value of 0.5 or less) as suggested by other Delphi studies reported in the literature.[5]
The goal of this part of the study was to identify concepts that were very important (those that were given a high rank-ing in the “importance” scale) and were also conceptually difficult (those that were given a low ranking on the “con-ceptual understanding” scale). As shown in Table 1, a total of 12 concepts (from an original list of 28 concepts from the generative round) were identified as meeting the criteria of high importance but low conceptual understanding. These items included key topics in thermal science and transport disciplines such as the second law of thermodynamics in-cluding reversible vs. irreversible processes, conservation of fluid momentum, viscous momentum transfer, the Bernoulli principle, several energy-related topics (heat, temperature, enthalpy, internal energy), and steady-state vs. equilibrium processes. At the request of several Delphi participants, we

Vol. 45, No. 3, Summer 2011 205
included the ideal gas law and conservation of mass con-cepts in the TTCI since both are fundamental concepts in fluid mechanics and thermodynamics. With the exception of thermal radiation, all concepts listed in Table 1 are included in TTCI items. Students’ specific conceptual difficulties with thermal radiation have yet to be identified, but the plan is to include this concept in future versions of the instrument. It is important to emphasize once again that the concepts in Table 1 only represent a small sub-domain of all relevant concepts in thermal and transport science—the sub-domain of difficult but important concepts as identified by the Delphi study experts.
TTCI Development and ResultsBased on results of the Delphi study, items were developed
for the TTCI assessment instrument.[6] Each item was devel-oped using a seven-step process recommended by Downing and Haladyna[7] including:
•draftingopen-endedquestionsabouttheconcept•collectingstudentresponsedataorally(think-aloudprob-
lem-solving sessions) and in written form•usingtheresponsestoconverttheopen-endedquestions
to multiple-choice items with distractors describing plau-sible but incorrect answers
•betatestingthedrafteditemsongroupsofengineeringstudents
•collectingexpertreviewsoneachitemtoestablishcon-tent validity
•revisingtheitemsbasedonstatisticalperformanceandexpertfeedback
•collectingadditionalbetatestdata.
Updated versions of the TTCI have been created by deleting or adding items based on difficulty and discrimination indi-ces. Statistics for each succeeding version of the instrument have indicated improved reliability. The present version of the instrument (version 3.04) has consistently demonstrated reliabilities of 0.7 and higher for each of the following in-ventories:
•heattransfer–12itemscontaining18questions(0.77)
•fluidflow–19itemscontaining26questions(0.70)
• thermodynamics–17itemscontaining24questions(0.70)
The number of questions exceeds the number of items in each inventory because some items consist of two ques-tions—usually of the form “what will happen?” in a posed situation followed by a question of the form “why did it happen?” or “why did you answer the first question the way you did?” Other items consist of one question in which the answers (correct answer and distractors) contain information about both “what?” and “why?” An example of each item construct is provided in Appendix A. The first sample item assesses students’ understanding of the difference between the amount of energy required to melt ice vs. the rate at which the energy is delivered to the ice. The second item focuses on students’ understanding of the difference between the actual temperature of an object and the perceived temperature when the object is walked on with bare feet. More details about TTCI development have been published[6] and version 3.04 is now available online (<www.thermalinventory.com>). Nearly 1,200 students at more than 20 engineering schools have used at least one of the three TTCI instruments. To protect the integrity of the instrument, items in the TTCI are password protected. Faculty interested in reviewing the TTCI or using any of the TTCI inventories in their classes are encouraged to contact Dr. Miller at [email protected] for a password.
Schema Training DevelopmentChi has argued that students possess robust misconceptions
because they have no existing schema or mental framework for understanding some complicated science and engineering processes.[4] A particular ontological class of difficult concepts identified by Chi is termed “emergent processes,” which are fundamentally different from “sequential processes.” Emer-gent processes occur in systems of constituent elements (e.g., molecules) interacting over time in a random and simultane-ous pattern. In contrast, sequential processes occur in systems of interacting agents in a causal and dependent pattern. For example, the schooling of fish is the result of an emergent process. Even though the fish seem to move as one, there is no “leader” fish directing their movements. All members of the school simply want to stay as close to their neighbors as possible. This is a survival strategy that helps an individual fish from being singled out by a predator. So the pattern we see is a result of all the individual fish simultaneously moving together. In contrast, the construction of a skyscraper is an
example of a sequential process. All actions by different actors (i.e., different construction trades) need to occur step-by-step in a particu-lar sequence to reach the overall goal.
Many of the concepts with which engi-neering students struggle can be identified as emergent processes including heat trans-fer and diffusion.[4,8,9] Emergent process misconceptions are particularly resistant to traditional instruction because they occur at the ontological level where students ascribe a
TABLE 1Difficult and Important Concepts in Thermal and Transport Science
Identified in the Delphi Study• Bernoulli principle • Enthalpy vs. internal energy (flow work)
• Linear fluid momentum • Viscous momentum transfer
• Second law of thermodynamics • Ideal gas law
• Reversible vs. irreversible processes • Mass conservation in fluid systems
• Heat vs. energy • Steady-state vs. equilibrium
• Heat vs. temperature • Thermal radiation

Chemical Engineering Education206
fundamental characteristic to the concept that is at odds with the scientifically normative view.[4] What does it mean to hold a misconception at an ontological level? A simple example may help clarify. Some people may misclassify a whale as kind of fish instead of kind of mammal. This misclassification would probably lead people to think that whales had the same attributes as fishes. So one might think that whales get their oxygen from the water and lay eggs to reproduce, because that’s what fish do. In the same way if students think that dif-fusion is the result of a sequential process, they may think that diffusion terminates when equilibrium is reached—because sequential processes have an endpoint.
To help students learn concepts of the emergent process ontology, instruction should help students develop a “sche-ma” or mental framework for emergence that would make subsequent related concepts easier to understand.[9,10] The schema training we describe in this article provides students with an explicit explanation of the attributes of emergent processes and provides a step-by-step comparison with the attributes of sequential processes. Examples of each process are illustrated and embedded computer simulations allow students to manipulate system parameters to see the effects on emergent patterns.
Since prior work has demonstrated that even advanced engineering students still hold misconceptions about fun-damental concepts in thermal sciences and other scientific subjects,[11] this study is intended to test whether the schema training framework is effective in helping repair engineer-ing students’ misconceptions in heat transfer, diffusion, and microfluidics.
Following the work of Chi and her colleagues, the schema training experiment collected both quantitative and qualitative data. Quantitative data were collected from multiple-choice questions (in pre- and post tests). Qualitative data were col-lected from students’ verbal explanations of their answer choices to multiple-choice questions. The qualitative data were coded to explore the amount of “emergent” vs. “sequen-tial” language used in the explanations.
The a priori codes were developed using common attributes of emergent and sequential processes as described by Chi. Specific examples of what constituted emergent or sequential language are shown in Table 2. Prior to coding the entire data-set, three researchers coded the same set of data selected from three verbal explanation questions on diffusion for 10 partici-pants and the inter-coder agreement was over 90%. Then two researchers independently coded the datasets collected from diffusion and microfluidics assessments. The coding scheme developed for this analysis is summarized in Table 2.
If emergent process language was used (e.g., the partici-pant’s explanation included one or more attributes of emergent processes or a detailed description about the independent be-havior of a single molecular entity) that participant’s response
was coded as 1, otherwise it was coded as 0. For instance, when asked to explain in their own words what diffusion is, Peter responded, “Diffusionisspreadingandmixingofgasesor liquids from the random motion of molecules” an example of using emergent process language. On the contrary, Bill responded, “Diffusion is the process of molecules, atoms, etc., moving from an area of higher concentration to an area of lower concentration,” exemplifying the use of sequential process language.
After the coding, we summed all the “1”s and “0”s for both experimental and control participant groups and conducted a nonparametric “two-independent samples” test between the experimental and control group results because a nonpara-metric test makes minimal assumptions about the underlying distribution of the data.[12]
As shown in Figure 1, both experimental and control groups were matched for equivalent levels of engineering education (the gray portion of Figure 1 indicates where instruction dif-fers between experimental and control groups). A pre-test in heat transfer concepts was used as a further measure of the “equivalence” of the two groups prior to schema training, by establishing that prior knowledge of the students was similar. The experimental group completed an online training module describing the characteristics of sequential and emergent pro-cesses and described why diffusion is an emergent process. The purpose of the training module was to help experimental group participants develop a “schema” for thinking about dif-fusion in emergent terms. Students’ emergent schema were further developed using two computer simulations—one showed the macroscopic behavior of blue dye in water while the second showed molecular behavior of the same diffu-sion process. The effect of changing dye concentration was observed in each simulation.
The control group completed an online training module of approximately equivalent length and complexity (words and figures) that described the nature of science. Diffusion was
TABLE 2Summary of Coding Scheme
Language Coding Rubric
Emergent Process
0 If subject does not respond, or provides an inaccurate or irrelevant response.
1 If the subject refers to emergent themes such as “indirect,” “continuous,” “independent,” “simultaneous,” “equilibrium,” or “balanced ratio of molecules.”
Sequential Process
0 If subject does not respond, or provides an inaccurate or irrelevant response.
1 If subject refers to sequential themes such as “direct,” “distinguishable,” “restricted,” “sequenced,” “dependent,” or “end/terminate.”
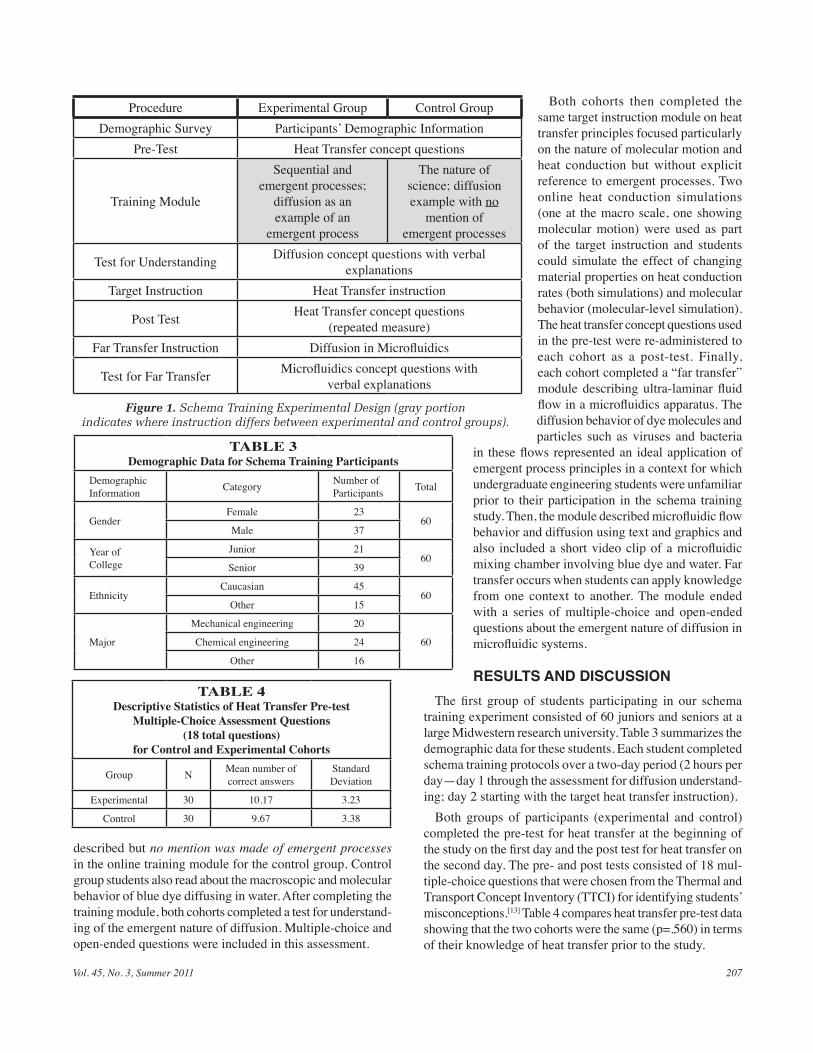
Vol. 45, No. 3, Summer 2011 207
Both cohorts then completed the same target instruction module on heat transfer principles focused particularly on the nature of molecular motion and heat conduction but without explicit reference to emergent processes. Two online heat conduction simulations (one at the macro scale, one showing molecular motion) were used as part of the target instruction and students could simulate the effect of changing material properties on heat conduction rates (both simulations) and molecular behavior (molecular-level simulation). The heat transfer concept questions used in the pre-test were re-administered to each cohort as a post-test. Finally, each cohort completed a “far transfer” module describing ultra-laminar fluid flow in a microfluidics apparatus. The diffusion behavior of dye molecules and particles such as viruses and bacteria
in these flows represented an ideal application of emergent process principles in a context for which undergraduate engineering students were unfamiliar prior to their participation in the schema training study. Then, the module described microfluidic flow behavior and diffusion using text and graphics and also included a short video clip of a microfluidic mixing chamber involving blue dye and water. Far transfer occurs when students can apply knowledge from one context to another. The module ended with a series of multiple-choice and open-ended questions about the emergent nature of diffusion in microfluidic systems.
RESULTS AND DISCUSSIONThe first group of students participating in our schema
training experiment consisted of 60 juniors and seniors at a large Midwestern research university. Table 3 summarizes the demographic data for these students. Each student completed schema training protocols over a two-day period (2 hours per day—day 1 through the assessment for diffusion understand-ing; day 2 starting with the target heat transfer instruction).
Both groups of participants (experimental and control) completed the pre-test for heat transfer at the beginning of the study on the first day and the post test for heat transfer on the second day. The pre- and post tests consisted of 18 mul-tiple-choice questions that were chosen from the Thermal and Transport Concept Inventory (TTCI) for identifying students’ misconceptions.[13] Table 4 compares heat transfer pre-test data showing that the two cohorts were the same (p=.560) in terms of their knowledge of heat transfer prior to the study.
Figure 1. Schema Training Experimental Design (gray portion indicates where instruction differs between experimental and control groups).
TABLE 3Demographic Data for Schema Training Participants
Demographic Information Category Number of
Participants Total
Gender Female 23
60Male 37
Year of College
Junior 2160
Senior 39
EthnicityCaucasian 45
60Other 15
Major
Mechanical engineering 20
60Chemical engineering 24
Other 16
TABLE 4Descriptive Statistics of Heat Transfer Pre-test
Multiple-Choice Assessment Questions (18 total questions)
for Control and Experimental Cohorts
Group N Mean number of correct answers
Standard Deviation
Experimental 30 10.17 3.23
Control 30 9.67 3.38
Procedure Experimental Group Control GroupDemographic Survey Participants’ Demographic Information
Pre-Test Heat Transfer concept questions
Training Module
Sequential and emergent processes;
diffusion as an example of an
emergent process
The nature of science; diffusion example with no
mention of emergent processes
Test for Understanding Diffusion concept questions with verbal explanations
Target Instruction Heat Transfer instruction
Post Test Heat Transfer concept questions (repeated measure)
Far Transfer Instruction Diffusion in Microfluidics
Test for Far Transfer Microfluidics concept questions with verbal explanations
described but no mention was made of emergent processes in the online training module for the control group. Control group students also read about the macroscopic and molecular behavior of blue dye diffusing in water. After completing the training module, both cohorts completed a test for understand-ing of the emergent nature of diffusion. Multiple-choice and open-ended questions were included in this assessment.

Chemical Engineering Education208
The overall mean gain (the average of post test scores minus pre-test scores) for the experimental group (1.10) was larger than that of the control group (0.97) as shown in Table 5. There was no statistically significant difference (p=0.82) between the two groups, however. These results can be explained in one of two ways: 1) the schema training approach did not help stu-dents in the experimental group repair misconceptions about the emergent nature of heat conduction, or 2) the pre-/post test heat transfer questions did not adequately assess the presence or absence of an emergent schema in the study cohorts. To help clarify this result, future schema training experiments will include additional heat transfer questions designed specifically to probe for the presence or absence of emergent thinking in student participants. Students without prior coursework in heat transfer will also be included in the study.
Table 6 summarizes the results of diffusion and microfluid-ics assessment questions. Based on the data from 19 multiple-choice diffusion concept questions, the overall mean for the experimental group (15.40) was larger than that of the control group (13.87). In addition, there was a significant difference (p=0.037) between the two groups and effect size was 0.56, a moderately large effect size. This result showed that the schema training approach did help those engineering students in the experimental group develop a better “emergent focused” understanding of some diffusion concepts.
Based on the data from five multiple-choice questions on microfluidics, the overall mean for the experimental group (3.60) was larger than that of the control group (2.77). In ad-dition, there was a significant difference (p=0.027) between the two groups and the effect size was 0.60, a moderately large effect size. This result is particularly encouraging because it shows a statistically significant improvement in development of students’ emergent schema as applied to a far transfer topic—that is, a topic they had never seen before and one that is far different than traditional diffusion applications in their classes and textbooks. Since the ability to transfer knowl-edge from one context to another indicates development of a coherent understanding of underlying concepts,[14] evidence of far transfer reinforces the conclusion that students in the experimental group have developed their emergent schema for thinking about diffusion processes.
To gain a better understanding of how students’ emer-gent schema (or lack thereof) influenced their answers to the multiple-choice assessment ques-tions, we used the coding scheme shown in Table 2 to analyze qualita-tive data collected from open-ended questions that ask students to explain their choices to diffusion and micro-fluidics multiple-choice questions. Table 7 summarizes the results for 22 diffusion explanation questions;
the overall mean for the experimental group (17.03) was much larger than that (2.97) of the control group, a statistically sig-nificant difference (p<0.0005). This result indicates that the schema training approach did facilitate students’ conceptual change in terms of the kind of emergent process language they displayed when explaining their answers to the diffusion multiple-choice questions.
Based on results from six microfluidics explanation ques-tions, the overall mean for the experimental group (4.10) was much larger than that of the control group (0.63) as shown in Table 7. In addition, there was a statistically significant differ-ence between the two groups (p<0.0005). This result also sug-gests that the schema training approach facilitated students’ conceptual change in terms of the kind of emergent process language they displayed when explaining their answers to the microfluidics multiple-choice questions.
Although preliminary, these data suggest that schema train-ing methods can be designed to help engineering students repair strongly held misconceptions of concepts in which a well-developed emergent schema is required for correct understanding. The absence of a measurable improvement in heat transfer scores for the experimental group is still under investigation but perhaps may be attributed to students taking multiple heat transfer courses that may solidify (sometimes incorrect) cognitive structures of heat transfer processes. For example, a statistically significant improvement in heat transfer scores was found for students taking two or fewer heat transfer courses while no improvement was noted for students who completed three or more courses. More inves-tigation is needed but these results do support the notion that additional heat transfer instruction did not improve pre- and post test gains.
TABLE 5Descriptive Statistics for Mean Gain in Heat Transfer
Multiple-Choice Assessment Questions(18 total questions)
Group N MeanGain*
StandardDeviation
Experimental 30 1.10 1.97
Control 30 0.97 2.59
*gain = (# correct answers on post test) – (# correct answers on pre-test)
TABLE 6Descriptive Statistics for Performance on Diffusion and Microfluidics
Multiple-Choice Assessment Questions
Assessment Group N Mean Number of correct answers
Standard Deviation
Effect size
Diffusion (19 questions)
Experimental 30 15.40 2.670.56
Control 30 13.87 2.89
Microfluidics (5 questions)
Experimental 30 3.60 1.380.60
Control 30 2.77 1.45

Vol. 45, No. 3, Summer 2011 209
CONCLUSIONSThis paper has described two related lines of research
involving development and testing of an assessment instru-ment to identify strongly held student misconceptions in thermal and transport science and development of a method for helping students develop accurate schema for describing and understanding emergent processes that are common in heat transfer, molecular diffusion, and molecular momen-tum transfer. Results show that the assessment instrument, the Thermal and Transport Concept Inventory (TTCI), can reliably identify misconceptions related to 12 important but poorly understood concepts in heat transfer, thermodynam-ics, and fluid flow.
The TTCI instrument is now available online and can be used for course and/or program-level assessment. Used only as a pre-test, instructors can use the TTCI to gauge students’ conceptual understanding as they begin a course. This will allow the instructor to focus on areas where misconceptions are most prevalent. Used with repeated administrations, the TTCI can be used to calculate gain scores that are an indicator of concept repair and depth of learning. For example, com-parison of gain scores on the Force Concept Inventory have been used in physics education to compare the effectiveness of different modes of instruction[15] and such a comparison of TTCI gain scores could be used in chemical engineering education for the same purpose.
Preliminary schema training results show that materials informed by relevant psychological theory can be used to help students develop correct mental schema for understanding robust misconceptions involving emergent processes impor-tant to thermal and transport science. We believe that under-standing emergent processes will become more important as greater emphasis is put on learning about physical phenomena at the micro-, nano-, and molecular scales. Thus we predict that understanding emergent processes and the phenomena that result from emergent systems will become an important outcome of educating future chemical engineers.
This line of research is based on the assumption that students have little experience with emergent processes and therefore their mental framework (or schema) for understanding these kinds of phenomena may be weak or missing altogether.
The training we are developing attempts to strengthen frameworks for thinking about emergent phenomena or provide a framework if none exists. This kind of training may be of greatest use at the beginning of instruction in a new conceptual area. Our results suggest that, not surprisingly, changing frameworks about topics for which students have had a great deal of instruction is much more difficult to accomplish.
Additional data collected in this project will provide more detailed guidance about how to transform schema training to classroom contexts. Because the current
training materials are modular and web-based, it will be possible to develop stand-alone modules that can be used for instruction at different times. The format of the modules also lends itself to adaptation as an electronic supplement to appropriate engineering textbooks. What implications does this research have for the chemical engineering educator? Our data suggest that helping students learn about the emergent processes of systems can increase students’ deep understand-ing of important concepts in the thermal and transport sci-ences. Ideally, instruction will help students develop systems thinking at appropriate length scales and highlight where and when simultaneous interactions occur.
ACKNOWLEDGMENTSWe wish to thank the National Science Foundation for
supporting this project through grant EEC-0550169, “De-veloping Ontological Schema Training Methods to Help Students Develop Scientifically Accurate Mental Models of Engineering Concepts” and grant DUE-0127806, “Develop-ing an Outcomes Assessment Instrument for Identifying En-gineering Student Misconceptions in Thermal and Transport Sciences.”
REFERENCES 1. Streveler, R.A., T.A. Litzinger, R.L. Miller, and P.S. Steif, “Learning
Conceptual Knowledge in the Engineering Sciences: Overview and Future Research Directions, J. Eng. Ed., 97(3), 279 (2008)
2. Duit, R., Bibliography: Students’ and Teachers’ Conceptions and Science Education. Kiel, Germany: Institute for Science Education. Available at <http://www.ipn.uni-kiel.de/aktuell/stcse/> (2009)
3. Streveler, R.A., B.M. Olds, R.L. Miller, and M.A. Nelson, “Using a Delphi Study to Identify the Most Difficult Concepts for Students to Master in Thermal and Transport Science,” Proceedings of the Ameri-can Society for Engineering Education Annual Conference (electronic), Nashville, TN (2003)
4. Chi, M.T.H., Common-sense Conceptions of Emergent Processes: Why Some Misconceptions are Robust, J. the Learning Sciences, 14(2), 161, (2005)
5. Linstone, H.A., M., Turoff, eds., The Delphi Method: Techniques and Applications, Reading, MA: Addison-Wesley Publishing Company. (1996)
6. Streveler, R.A., R.L. Miller, A.I. Santiago Roman, M.A. Nelson, M.R. Geist, and B.M. Olds, “Using the ‘Assessment Triangle’ as a Framework for Developing Concept Inventories: a Case study Using the Thermal and Transport Concept Inventory,” Int. J. Eng. Ed., (in press) (2011)
TABLE 7Descriptive Statistics for Students’ Open-Ended Explanations:
Diffusion and Microfluidics Assessment Items
Assessment Group N Mean Standard Deviation
Diffusion(22
questions)
Experimental 30 17.03 2.12
Control 30 2.97 1.85
Microfluidics(6 questions)
Experimental 30 4.10 1.77
Control 30 0.63 0.89

Chemical Engineering Education210
7. Downing, S.M., and T.M. Haladyna, Handbook of Test Development, Mahwah, NJ, Lawrence Erlbaum Associates, eds. (2006)
8. Slotta, J.D., M.T.H. Chi, and E. Joram, “Assessing Students’ Misclas-sifications of Physics Concepts: An Ontological Basis for Conceptual Change,” Cognition and Instruction, 13, 373 (1995)
9. Reiner, M., J.D. Slotta, M.T.H Chi, and L.B Resnick, “Naive Physics Reasoning: A Commitment to Substance-Based Conceptions,” Cogni-tion and Instruction, 18(1), 1 (2000)
10. Slotta, J.D., and M.T.H. Chi, “Helping Students Understand Chal-lenging Topics in Science Through Ontology Training, Cognition and Instruction, 24, 261, (2006)
11. Miller, R.L., R.A. Streveler, B. Olds, M.T.H. Chi, A. Nelson, and M.R. Geist, “Misconceptions About Rate Processes: Preliminary Evidence for the Importance of Emergent Conceptual Schemas in Thermal and Transport Sciences,” Proceedings of 2006 American Society for Engineering Education Annual Conference (Electronic), Chicago, IL (2006)
12. Siegel, S., and N.J. Castellan, Nonparametric Statistics for the Behav-ioral Sciences, 2nd Ed., McGraw Hill, New York (1998)
13. Olds, B.M., R.A. Streveler, R.L. Miller, and M.A. Nelson, “Preliminary Results From the Development of a Concept Inventory in Thermal and Transport Science,” Proceedings of the 2004 American Society for Engineering Education Annual Conference (Electronic), Salt Lake City, Utah. (2004)
14. Bransford, J.D., A.L. Brown, and R.R. Cocking, eds., How People Learn, Washington, DC: National Academy Press, (2000)
15. Hake, R.R., “Interactive-Engagement vs. Traditional Methods: A Six-Thousand Student Survey of Mechanics Test Data for Introductory Physics Courses,” American J. Physics, 66(1), 64 (1998)
APPENDIX A – SAMPLE TTCI ITEMSSample Two-Question Item
You are in the business of melting ice at 0 ˚C using hot blocks of metal as an energy source. One option is to use one metal block at a temperature of 200 ̊ C and a second option is to use two metal blocks each at a temperature of 100 ˚C.
All the metal blocks are made from the same material and have the same weight and surface area.
If the blocks are placed in insulated cups filled with ice water at 0 ˚C, which option will melt more ice?
a. the100˚Cblocks
b. the200˚Cblock
c. Either option will melt the same amount of ice.
d. Can’t tell from the information given.
I answered the question the way I did because:e. Two blocks have twice as much surface area as one block
so the energy transfer rate will be higher when more blocks are used.
f. Energy transferred is proportional to the mass of blocks used and the change in block temperature during the process.
g. Using a higher temperature block will melt the ice faster because the larger temperature difference will increase the rate of energy transfer.
h. Higher temperature blocks contain more energy per mass of block than lower temperature blocks.
i. The heat capacity of the metal is a function of tempera-ture.
j. Multiple blocks have more mass and therefore more energy than a single block.
k. The temperature of the hotter block will decrease faster as energy is transferred to the ice water.
Sample One-Question ItemAn engineering student walking barefoot (without shoes or
socks) from a tile floor onto a carpeted floor notices that the tile feels cooler than the carpet.
Which of the following explanations seems like the most plausible way to explain this observation?
a. The carpet has a slightly higher temperature because air trapped in the carpet retains energy from the room better.
b. The carpet has more surface area in contact with the student’s foot than the tile does, so the carpet is heated faster and feels hotter.
c. The tile conducts energy better than the carpet, so energy moves away from the student’s foot faster on tile than carpet.
d. The rate of heat transfer into the room by convection (air movement) is different for tile and carpet surfaces.
e. The carpet has a slightly higher temperature because air trapped in the carpet slows down the rate of energy transferthroughthecarpetintothefloor.p

Vol. 45, No. 3, Summer 2011 211
As a Chemical Engineering educator, you have perhaps experienced a situation in which a student who has done well on a numerical problem fails to grasp the
underlying concept. For example, a student who correctly calculates that two objects that have come to thermal equi-librium in a room at 25 ºC must be at 25 ºC might also tell you (based on his or her perception walking barefoot across the floor) that a tile floor is cooler than a carpeted one, even if they are in the same room. These two situations describe the same problem, but the second situation highlights the student’s failure to grasp the underlying concept in ways that the first situation does not. Understanding of basic concepts, rather than memorization of formulae, lays the groundwork for students’ future study and their ability to apply principles to real problems as their careers progress.[1, 2]
A key barrier to conceptual understanding of important engineering concepts is that students arrive in our classrooms not as blank slates, but with existing conceptual frameworks describing how the world works.[1, 3, 4] In some cases, their earlier experience creates significant misconceptions that are not overcome by simply telling them the correct answer.[1, 5, 6]
A key finding of the National Research Council’s report “How People Learn” was that faculty need to draw out and engage
DEVELOPMENT OF CONCEPT QUESTIONS AND INQUIRY-BASED ACTIVITIES
in Thermodynamics and Heat Transfer:An Example for Equilibrium vs. Steady State
Fundamental Research in Engineering Education
maRgoT VigeanT,+ michael PRince,+ and KaThaRyn noTTis*
+BucknellUniversityDepartmentofChemicalEngineering•Lewisburg,PA17837*BucknellUniversityDepartmentofEducation•Lewisburg,PA17837
© Copyright ChE Division of ASEE 2011
Margot Vigeant is an associate professor of chemical engineering and associate dean of engineering at Bucknell University. She has taught at Bucknell for 12 years, and is inter-ested in innovative ways to improve conceptual understanding in undergraduate engineering courses, particularly thermodynamics.
Michael Prince is a professor of chemi-cal engineering at Bucknell University. His current work in engineering education is in student motivation, conceptual learning, assessment, and “best practices” in undergraduate education. He is involved in the annual National Effective Teaching Institute workshop as well as numerous other
workshops on active, collaborative, and prob-lem-based learning.
Katharyn Nottis is a professor of education at Bucknell University. Her interests include educational assessment, statistics, and STEM education. Dr. Nottis has done leading work on teaching in diverse environments, successfully preparing students for work in a wide variety of school settings.
student preconceptions and help students understand ideas within the context of a conceptual framework.[3] As an exam-ple of the difficulty of instilling conceptual change, research

Chemical Engineering Education212
with physics students demonstrated that traditional teaching methods produced only marginal improvement in students’ conceptual understanding of basic physics concepts.[5, 6]
Fortunately for us and for our students, there are a number of instructional methods that have been shown to result in more significant conceptual gains than lecture. Hake showed that instruction that emphasizes student engagement significantly improved students’ conceptual learning in physics.[5] Laws, et al.,[6] also working in physics, showed that inquiry-based laboratories were successful in improving conceptual under-standing. Their implementation of inquiry-based activities, defined as instruction incorporating the elements in Table 1, resulted in more than 80% of students correctly understanding force, acceleration, and velocity while standard instruction had resulted in 20-50% of the students understanding those concepts.[6]
There are many definitions of “inquiry-based,” but in gen-eral the approaches require that students pose and answer questions through direct experimentation, rather than lecture or in a plug-and-play style laboratory.[7]
The overall goal of the present work is to adapt the success-ful model of inquiry-based activities for conceptual change from physics to chemical engineering students in heat trans-fer and thermodynamics. The two components of this work have been to create reliable instruments to assess students’ conceptual understanding in these areas and to develop and test inquiry-based activities. Ongoing work with the concept inventories has resulted in reliable assessments as well as documentation of student misconceptions that are altered little by traditional instruction.[8] We have also demonstrated some improvement of students’ conceptual understanding as a result of a sub-set of the activities under development.[9] In this article, we present the development steps taken for a specific inquiry-based activity within our work. The particular activity and associated concept inventory question may be of interest to the readers, but we hope that the development process may be useful as well for engineering colleagues interested in adapting this educational approach. By adapting the demonstrated success of the physics model to chemical engineering concepts, we hope to enable similar growth in conceptual understanding in our own students.
QUESTION DEVELOPMENTThe first step in developing an inquiry-based module is se-
lecting the concept area to target. Equilibrium vs. Steady State was identified in a Delphi study by Streveler, et al., (2003) as a concept that was both important for students to understand and commonly misunderstood.[10] Our own classroom experi-ence confirmed that this area can be a source of confusion for students. When two objects are at equilibrium, it implies the absence of net driving forces for change (for example, two metal blocks in thermal equilibrium are at the same tempera-ture). “Steady state” describes a system where the measurable characteristics are invariant with respect to time. For example, water boiling in a pan on top of a gas flame may reach steady state, but the water is not in thermal equilibrium with either the flame or the surrounding environment. The prevalent student misconception about equilibrium and steady state is that they are simply two terms describing the same state. For example, a junior-level chemical engineering student defined “steady state” in the following way: “a steadily occurring process at equilibrium.” It is important that practicing engineers be able to distinguish these two states; imagine the poor decisions that might be made by a plant engineer who believes a stream to be at the same temperature as its surroundings because someone told him or her it was at “steady state.”
The next step is to create concept inventory questions that will assess whether students understood the concept correctly. To identify specific misconceptions, we want to create questions where the possible answers contain “distrac-tors” or the most common misconceptions held by students. Therefore, the first version of a question is open-ended rather than multiple-choice in order to draw out students’ specific preconceptions.
Examining student responses, we saw that misconceptions were often revealed more clearly in questions asking about an “everyday” setting rather than questions focusing on an “en-gineering” context. This makes sense as everyday situations readily draw upon students’ prior knowledge and experience. While a number of excellent questions had been developed and tested for Equilibrium vs. Steady State by Miller, et al.,[11-13] each of these was in a plant or laboratory context. We therefore developed a question drawing on students’ daily experience, the first draft of which is Q1 below:
[Q1] A cookware company makes cooking pans where both the pan and the pan’s long handle are made of the same metal, joined in a continuous manner (no insulation be-tween the handle and the body of the pan). Yet, they adver-tise that the handle is “cool touch.” Can this be true when the pan is used to boil water on a conventional stovetop? Pleaseexplain.
This question was included in a draft concept inventory given to 78 chemical engineering students at three universi-ties. The students’ answers were sorted into groups based upon common themes. Using this approach, four theme areas
TABLE 1Elements of Inquiry-Based Activity Modules[6]
a) Use peer instruction and collaborative work
b) Use activity-based, guided-inquiry curricular materials
c) Use a learning cycle beginning with predictions
d) Emphasize conceptual understanding
e) Let the physical world be the authority
f) Evaluate student understanding
g) Make appropriate use of technology
h) Begin with the specific and move to the general

Vol. 45, No. 3, Summer 2011 213
emerged, shown in Table 2. Eleven answers are omitted from Table 2, being either totally unique or left blank.
Student responses grouped in the first row in Table 2 as-sume thermal equilibrium between the boiling water and the metal of the handle. Students in the second grouping correctly answer that a handle may remain cool, but incorrectly answer that the only way for this to occur would be for the system not to be at steady state. The third row are correct in that the handle can remain cool, but claim the only way for this to happen is if the rate of conduction is low. While this is cor-rect, it is not the only way for the handle to remain cool. The final group recognizes that it is possible to attain a steady state temperature that is lower than 100 ºC by balancing conduction and convection. While many students answered correctly, about half got the problem conceptually wrong.
Based upon the results in Table 2, a draft multiple-choice version of the question was constructed. This version con-tained an answer corresponding to each of the categories above, grouping the middle two answer themes into “b” as shown in Q2 below.
[Q2]. A cookware company makes cooking pans where both the pan and the pan’s long handle are made of the same metal, joined in a continuous manner (no insula-tion between the handle and the body of the pan). Yet, they advertise that the handle is “cool touch.” Can this be true when the pan is used to boil water for a long time at 100 ºC on a conventional stovetop?
a) Yes, it is both possible and practical to create a continu-ously joined metal cool-touch handle.
b) Maybe. Such a handle could be designed, but such a design would be unlikely to prove practical.
c) No, it is not possible to create a continuously joined metal cool-touch handle.
Q2 was piloted in a draft concept inventory taken in the first two weeks of class by 129 chemical and general engineering students at five institutions. A conventional item analysis was also conducted, guided by Classical Reliability theory.[14] Ac-cording to this theory, information about identifiable factors of individual test questions is used to guide any changes in the inventory and increase the reliability of the total score. Two aspects of the individual test questions were examined: item discrimination and item difficulty. The Discrimination Index (D-Index), with a range from –1.00 to +1.00, was used to estimate discrimination of test items.[14] Participants were divided into the upper and lower third, based upon their overall scores. Students’ scores on a specific item were then correlated with their overall score. The greater the positive value, the better the question discriminates. A positive value approach-ing 1.0 for discrimination index indicates that students who answered a given question correctly also scored well on the test as a whole, while those who answered incorrectly did not. A negative value for discrimination index would indicate that students who did poorly overall were able to answer a particular question correctly, while their better-scoring peers were not. A value of zero indicates a total lack of correlation between the score on the given item and the overall score. The “difficulty” of each question was measured by the percentage of students correctly answering a given question. According to Kaplan and Saccuzzo,[15] the ideal difficulty of a question is about 63% with questions on the total assessment ranging from 30% to 70% best able to distinguish among learners.
Evaluation of responses showed that the question had a difficulty of 15.3% and a discrimination index of 0.14. Looking more closely at responses, “a” was chosen by 15% of the students, “b” by 33%, and “c” by 52%. The target dif-ficulty for the assessment is between 33% – 66% along with a discrimination index of at least 0.25. Faculty instructing the
TABLE 2Grouped Short-Answer Responses for Q1
Answer Theme Concept Interpretation Example Student Response # of students
Not possible; metal handle must be too hot if water is boiling
Equilibrium is being assumed between pot and handle
“No because heat will be transferred uniformly through the whole pan and all parts of the pan will heat up.”
26
Possible; if rate of conduc-tion is slow or handle is very long (nonsteady state)
Neither equilibrium nor steady state are assumed; the handle temperature rises continually, but so slowly as to not matter
“It is possible that the convection through the metal could take long enough that the water can boil before the handle gets hot enough to burn you. But it is dependent on the length of the handle and how much water it is heating.”
9
Possible; if rate of conduc-tion is slow (steady state)
Steady state heat transfer can be at-tained because the relatively small amount of energy to the handle can be released to the air
“Yes it can be true, as long as the rate of convection off the handle is greater than the rate of conduction through the handle.” 5
Possible; if conduction through handle matches convection away from handle
Steady state heat transfer is assumed “Yes. If the pan handle is long enough, the heat con-ducted through the metal handle may come to steady state with heat loss through convection, leaving the pot handle at a touchable temperature.”
27
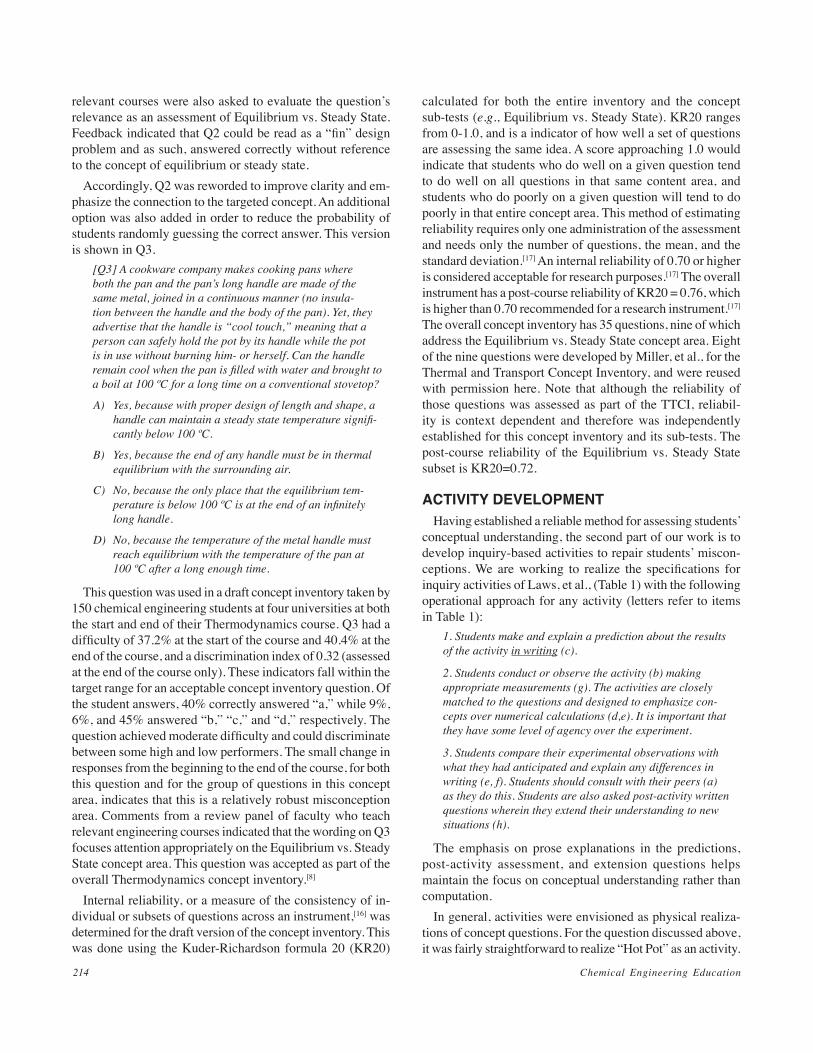
Chemical Engineering Education214
relevant courses were also asked to evaluate the question’s relevance as an assessment of Equilibrium vs. Steady State. Feedback indicated that Q2 could be read as a “fin” design problem and as such, answered correctly without reference to the concept of equilibrium or steady state.
Accordingly, Q2 was reworded to improve clarity and em-phasize the connection to the targeted concept. An additional option was also added in order to reduce the probability of students randomly guessing the correct answer. This version is shown in Q3.
[Q3] A cookware company makes cooking pans where both the pan and the pan’s long handle are made of the same metal, joined in a continuous manner (no insula-tion between the handle and the body of the pan). Yet, they advertise that the handle is “cool touch,” meaning that a person can safely hold the pot by its handle while the pot is in use without burning him- or herself. Can the handle remaincoolwhenthepanisfilledwithwaterandbroughttoa boil at 100 ºC for a long time on a conventional stovetop?
A) Yes, because with proper design of length and shape, a handlecanmaintainasteadystatetemperaturesignifi-cantly below 100 ºC.
B) Yes, because the end of any handle must be in thermal equilibrium with the surrounding air.
C) No, because the only place that the equilibrium tem-peratureisbelow100ºCisattheendofaninfinitelylong handle.
D) No, because the temperature of the metal handle must reach equilibrium with the temperature of the pan at 100 ºC after a long enough time.
This question was used in a draft concept inventory taken by 150 chemical engineering students at four universities at both the start and end of their Thermodynamics course. Q3 had a difficulty of 37.2% at the start of the course and 40.4% at the end of the course, and a discrimination index of 0.32 (assessed at the end of the course only). These indicators fall within the target range for an acceptable concept inventory question. Of the student answers, 40% correctly answered “a,” while 9%, 6%, and 45% answered “b,” “c,” and “d,” respectively. The question achieved moderate difficulty and could discriminate between some high and low performers. The small change in responses from the beginning to the end of the course, for both this question and for the group of questions in this concept area, indicates that this is a relatively robust misconception area. Comments from a review panel of faculty who teach relevant engineering courses indicated that the wording on Q3 focuses attention appropriately on the Equilibrium vs. Steady State concept area. This question was accepted as part of the overall Thermodynamics concept inventory.[8]
Internal reliability, or a measure of the consistency of in-dividual or subsets of questions across an instrument,[16] was determined for the draft version of the concept inventory. This was done using the Kuder-Richardson formula 20 (KR20)
calculated for both the entire inventory and the concept sub-tests (e.g., Equilibrium vs. Steady State). KR20 ranges from 0-1.0, and is a indicator of how well a set of questions are assessing the same idea. A score approaching 1.0 would indicate that students who do well on a given question tend to do well on all questions in that same content area, and students who do poorly on a given question will tend to do poorly in that entire concept area. This method of estimating reliability requires only one administration of the assessment and needs only the number of questions, the mean, and the standard deviation.[17] An internal reliability of 0.70 or higher is considered acceptable for research purposes.[17] The overall instrument has a post-course reliability of KR20 = 0.76, which is higher than 0.70 recommended for a research instrument.[17] The overall concept inventory has 35 questions, nine of which address the Equilibrium vs. Steady State concept area. Eight of the nine questions were developed by Miller, et al., for the Thermal and Transport Concept Inventory, and were reused with permission here. Note that although the reliability of those questions was assessed as part of the TTCI, reliabil-ity is context dependent and therefore was independently established for this concept inventory and its sub-tests. The post-course reliability of the Equilibrium vs. Steady State subset is KR20=0.72.
ACTIVITY DEVELOPMENTHaving established a reliable method for assessing students’
conceptual understanding, the second part of our work is to develop inquiry-based activities to repair students’ miscon-ceptions. We are working to realize the specifications for inquiry activities of Laws, et al., (Table 1) with the following operational approach for any activity (letters refer to items in Table 1):
1.Studentsmakeandexplainapredictionabouttheresultsof the activity in writing (c).
2. Students conduct or observe the activity (b) making appropriate measurements (g). The activities are closely matched to the questions and designed to emphasize con-cepts over numerical calculations (d,e). It is important that theyhavesomelevelofagencyovertheexperiment.
3.Studentscomparetheirexperimentalobservationswithwhattheyhadanticipatedandexplainanydifferencesinwriting (e, f). Students should consult with their peers (a) as they do this. Students are also asked post-activity written questionswhereintheyextendtheirunderstandingtonewsituations (h).
The emphasis on prose explanations in the predictions, post-activity assessment, and extension questions helps maintain the focus on conceptual understanding rather than computation.
In general, activities were envisioned as physical realiza-tions of concept questions. For the question discussed above, it was fairly straightforward to realize “Hot Pot” as an activity.

Vol. 45, No. 3, Summer 2011 215
The activity apparatus consists of a metal cooking pot with a continuously joined metal handle placed on a hot plate and instrumented with thermocouples (or thermometers) on the pot and on the pot’s handle as shown in Figure 1. To run the activity, students fill the pot with water and monitor the temperature of these locations as the water heats to boiling as well as while it boils. In addition to this “steady state” pot, an identical pot with the mass of water is left sitting on
the laboratory bench in order to provide the “equilibrium” counterpoint. The current draft of the student handout for this activity is included in the appendix.
While this seems simple, the activity allows students to participate in the construction of a situation where the most common distractors are obviously incorrect. The logging of temperatures at various locations on the pot (Figure 2) clearly shows that, while the water is boiling (after ~850s), the tem-peratures at these locations are approximately time-invariant (steady state). Figure 2 also demonstrates that these steady state values are different from each other as well as from the temperature of the boiling water (nonequilibrium). An addi-tional interactive piece of this experiment is that students are invited to actually grasp the handle on the pot and experience for themselves that they can do so safely.
Context is important to the activities having their desired effect on conceptual understanding. In the three-step process outlined above, two of the steps involve student reflection and explanation. In order to create the potential for longer-term conceptual change, it is important that students go beyond observing the activities and be encouraged to take steps to internalize the lessons. Writing has been shown to be effective[19, 20] and has the benefit of being assignable as homework. As seen in the appendix, students are asked to Figure 1. “Hot Pot” activity apparatus.
Figure 2. Sample data from “Hot Pot” activity. Dashed line indicates OSHA hot-surface personnel protection temperature, as assessed by ASTM Standard C 1055.[18]

Chemical Engineering Education216
predict, in writing, what will happen. The overall goal of the post-experiment questions is to require students to compare their observations with the distractors from Q3. For example, in the experiment students observe that the pot handle remains touchable, but this could be due to Q3 answers a or b. In order to eliminate b, students measure the temperature of a pot that is at equilibrium with the room air and directly observe that the temperature is different for the “hot” pot.
An example of a student prediction (from a class in a small, private university), just prior to the activity, is “Yes [the handle could burn someone] because the metal will most likely be conductive and thus it should reach the same temperature as the boiling H2O, which is hot enough to burn.” As this student worked through the activity, she logged data similar to that shown in Figure 2. When asked in the analysis to predict what she would observe (question 7, Appendix) if the pot were in a) thermal equilibrium with the air, b) thermal equilibrium with the hot plate, or c) steady state with respect to energy transferred from the hot plate, she correctly predicts what would happen to the temperature of the handle and why: “a) No it would not burn you… it would be the same temperature as the air. b) Yes, it would burn you. If it’s in equilibrium with the hot plate, then it would be the same temperature as the hot place, which is hot enough to cause a burn. c) No, it would not burn you. From the experiment, we learned that if the pot is at steady state with the hot plate, then the temperature of the handle will be cooler than the hot plate and thus safe to touch.” In conclusion, she states “In this experiment, I learned that steady state and equilibrium are two completely different things. Just because a process has achieved steady state and is constant with time does not mean that everything is at the same temperature and in thermal equilibrium.” All students in this class (n=25) were able to correctly address questions about the metal pot handle immediately after this experiment, with several specifically mentioning that it had helped clarify the difference between equilibrium and steady state.
Testing of our draft activities on a national scale is currently under way. While the small scale results noted above were promising, the sample size is too small (n=25) to draw overall conclusions. Larger-scale tests of activities show encouraging results. Overall, students from five diverse institutions (public, private, >20,000 students as well as <4,000) performing at least some activities score 66% (N=147) on the concept inven-tory post test, while those at four institutions without activities score 56% (N=143), a statistically significant improvement (p<0.01). Because not every test site performed every activity, there is not yet sufficient data to draw conclusions about the impact of the “Hot Pot” activity specifically. Further testing is ongoing and should remediate this problem soon.
CONCLUSIONRepairing student misconceptions requires first that we
document their existence and then that we adopt effective
techniques for conceptual change. In this paper, we consid-ered the development of a single concept question in the area of Equilibrium vs. Steady State as well as the creation of a corresponding inquiry-based activity. Preliminary testing of this activity as well as those for other related concepts has shown promise.[9] Through broader testing, we hope to demonstrate, using concept inventory results, at least two successful activities for each of the nine target concept areas within thermodynamics and heat transfer.
ACKNOWLEDGMENTSThe study was funded through NSF DUE 0717536. We
gratefully acknowledge the participation of faculty and stu-dents at our test-site institutions as well as much constructive feedback from Ron Miller, Ruth Streveler, John Perschetti, and Jeff Stein.
REFERENCES 1. Lightman, A., and P. Sadler, “Teacher Predictions Versus Actual Student
Gains,” The Physics Teacher, 31, 162 (1993) 2. Novak, J.D., A Theory of Education, Ithaca, NY: Cornell University
Press (1977) 3. Bransford, J., A. Brown, and R. Cocking, How People Learn: Brain,
Mind,Experience and School, Washington, D.C.: Commission on Behavioral and Social Science and Education, National Research Council (2000)
4. Hausfather, S., “It’s Time for a Conceptual Change,” Science and Children, Nov/Dec 1992, 22-23
5. Hake, R.R., “Interactive-Engagement vs. Traditional Methods: A Six-Thousand-Student Survey of Mechanics Test Data for Introductory Physics Courses,” American J. Physics, 66(1), 64 (1998)
6. Laws, P., D. Sokoloff, and R. Thornton, “Promoting Active Learning Using the Results of Physics Education Research,” UniServe Science News, 13 (1999)
7. Inquiry Descriptions From the Exploratorium Institute Inquiry Forum, Accessed May 5, 2004
8. Prince, M., M. Vigeant, and K. Nottis, “Assessing Misconceptions of Undergraduate Engineering Students in the Thermal Sciences,” International J. Eng. Ed., 26, 880 (2010)
9. Prince, M., M. Vigeant, and K. Nottis, “A Preliminary Study on the Ef-fectiveness of Inquiry-Based Activities for Addressing Misconceptions of Undergraduate Engineering Students,” Ed. for Chem. Engineers, 4(2), 29 (2009)
10. Streveler, R., B. Olds, R. Miller, and M. Nelson, “Using a Delphi Study to Identify the Most Difficult Concepts for Students to Master in Ther-mal and Transport Science,” Presented at ASEE Annual Conference, at Nashville, TN (2003)
11. Thermal and Transport Concept Inventory, <http://www.thermalinven-tory.com/surveys.html>, Accessed March 14, 2011
12. Miller, R.L., R.A. Streveler, B.M. Olds, M.T.H. Chi, M.A. Nelson, and M.R. Geist, “Misconceptions About Rate Processes: Preliminary Evidence for the Importance of Emergent Conceptual Schemas in Thermal and Transport Sciences,” Presented at ASEE Annual Confer-ence, Chicago (2006)
13. Olds, B., R. Streveler, R. Miller, and M.A. Nelson, “Preliminary Re-sults From the Development of a Concept Inventory in Thermal and Transport Sciences,” Presented at ASEE Annual Conference, Salt Lake City, UT (2004)
14. Suen, H.K., Principles of Test Theories, Hillsdale, NJ: Lawrence Erlbaum (1990)
15. Kaplan, R.M., and D.R. Saccuzzo, Psychological Testing: Principles, Applications, and Issues, 4th ed., Pacific Grove, CA: Brooks/Cole

Vol. 45, No. 3, Summer 2011 217
(1997) 16. Huck, S.W., and W.H. Cormier, Reading Statistics and Research, 2nd
ed., New York: Harper Collins (1996) 17. Fraenkel, J.R., and N.E. Wallen, How to Design and Evaluate Research
in Education, 7th ed., New York: McGraw-Hill (2009) 18. ASTM, 2001, “Standard Guide for Heated System Surface Conditions
That Produce Contact Burn Injuries,” In Section 4: Construction, Volume 04.06, Thermal Insulation and Environmental Acoustics, West Conshohoeken, PA: ASTM (2001)
19. Hand, B., L. Hohenshell, and V. Prain, “Examining the Effect of Multiple Writing Tasks on Year 10 Biology Students’ Understandings of Cell and Molecular Biology Concepts,” Instructional Science: An International Journal of the Learning Sciences, 35(4), 343 (2007)
20. Hohenshell, L.M., and B. Hand, “Writing-to-Learn Strategies in Sec-ondary School Cell Biology: A Mixed Method Study,” International Journal of Science Education, 28(2-3), 261 (2006)
APPENDIX: STUDENT HANDOUT FOR INQUIRY- BASED ACTIVITYInquiry- Based Activity 1: Hot Pot
Student Name or Number______________________The following experiment is going to simulate cooking on a
stove. One pot with water will be heated on a hot plate while a second pot, also with water, will sit on the lab bench. You will be comparing the temperatures of each of the pots at the marked locations and recording them in the table provided. Following the experiment, there will be a series of questions to answer about what was observed in the experiment.
Materials:2 Covers for the pots1 Hot plate1 Infrared thermometer1 Timer or stopwatchEither3 Computer-enabled thermocouples, and a computer with
data-logging softwareorAt least 2 thermocouples or thermometers
Safety:In this laboratory you will be boiling water and several
objects can get extremely hot and will have the potential to burn you. Carefully follow the instructions and only touch objects where and when you are instructed to do so.
Directions:1. You are going to be heating the water until it is boiling, in a pot with a metal handle. When the water is boiling, do you believe the handle will be at a high enough temperature to burn you? Why or why not?
2. When your group is finished answering the first part, put one pot of water on the hot plate. Set the second pot on the lab bench to the side of the hot plate.
3. Place a lid on each of the pots. Position the lid so that half of the holes on the side of the lid are visible at the sides as shown in Figure A1.
4. Measure the initial temperatures for both pots at the marked locations and record these values in the table on the next page (if using a computer data logger, you need not record the temperatures by hand).
5. Turn the hot plate on to the highest setting and start the timer or stopwatch.
6. After each minute, take measurements of the temperature at the marked locations for the pot on the hot plate. Record the temperatures in the table on the next page. Take periodic measurements on the counter-top pot, as shown in the table.
7. Once the water boils, turn the setting down to half of the maximum power. The goal is to maintain the boiling water at a low but constant rate of evaporation.
8. Continue taking measurements while the pot is boiling until temperatures measured at each location remain constant. Record your measurements in Table A1 (next page).
9. Do NOT actually do this, but think about the situa-tion. While the pot on the hot plate is boiling at steady state, would you consider putting your hand in the water? Would you consider touching the hot plate? What about the handle in the marked spot?
10. The ASTM/OSHA standard for a stovetop burn is about 120 °F (50 °C). Could the marked spot on the handle burn you?
11. If your measurements indicate that the handle is safe to touch, and if someone is comfortable doing so, have him or her pick up the pot in the appropriate spot. Did that person get burned?
12. Turn off the hot plate and save your data if you are using the computer.
Analysis–todoafterclass/labandhandin:
1. What did you see in this experiment and how does your
Figure A1. Correct positioning of the pot lid.

Chemical Engineering Education218
observation compare with your prediction? If what was ob-served contrasts your prediction, explain what happened and why. Discuss this with your group before answering.
2. For the pot on the hot plate, plot the temperature at a given location as a function of time. What happens to the temperature?
3. For the pot on the lab bench, plot the temperature at a given location as a function of time. What happens to the temperature?
4. For each of the pots consider the temperature profile at points 1-3. How do the temperatures compare throughout?
5. Using your answer from the previous question, which pot was at steady state but not equilibrium? Which pot came to thermal equilibrium?
6. Using the terms unsteady state, steady state, and equilib-rium, which one applies to each of the following situations and why:
a. Apotjustfilledwithroom-temperaturewaterisheatedbyanopenflameforafewminutesanddoesnot come to a boil.
b. Aheatexchangercontinuouslycoolsstyrenemonomerfrom 300 °C to 150 °C using 20 °C water.
c. A distillation column continuously separating a 50:50 mixtureofethanolandwaterto80%bymoleofetha-nol in the distillate.
d. A single tray of a distillation column performing the same separation mentioned in part c.
e. A turkey that has cooked in the oven at 250 °C for 12 hours.
f. A piece of road is heated by the sun on a hot summer day
7. Determine if the following situations would burn you if you grabbed the handle of the hot pot at point 3:
a. The temperature of the pot is in equilibrium with the air.
b. The temperature of the pot is in equilibrium with the hot plate.
c. The temperature of the pot is at steady state with the heat transferred from the hot plate.
8. Hand in your original prediction and your comparison to question 1 above, specifically noting if and how your thinking has changed with respect to the experiment. What, if anything, did you learn?
9. Remember to put your name or identifying student number on each page of your response. p
TABLE A1Temperature Data
Hot Plate Pot Lab Bench Pot
Time (min) Location 1 Location 2 Location 3 Location 1 Location 2 Location 3
0
1
2
3
4
5
6
7
8
9
10
11
12
13
14
15
16
17
18
19
20

Vol. 45, No. 3, Summer 2011 219
The undergraduate laboratory plays a pivotal role in sci-ence and engineering curricula.[1,2] Traditional physical laboratories are resource intensive, however, and due
to these constraints, do not always achieve their diverse set of intended learning outcomes. One way to overcome these limitations is to use alternative modes of delivery, such as virtual or remote laboratories.[3] In a virtual laboratory, stu-dents do not interact with real equipment to obtain data, but rather with computer simulations of laboratory or industrial process equipment that produce results that can be obscured by pre-programmed statistical variation.
In the most common approach, the virtual laboratory is used as an alternative mode and simulates a similar set of activities as in the corresponding physical laboratory at the university.[4-7] In a few cases, virtual laboratories have been used to create learning activities with no analog to the university instructional laboratory.[8,9] The instructional and software design of the virtual laboratories described in this study fall into the latter case and are based on the situated context of a practicing engineer in industry. The virtual labora-tory project is structured around the task of having students determine the operating parameters for chemical processes for volume production through experimental design, inter-pretation, and iteration. In this sense, the virtual laboratory project simulates what expert engineers do in practice, and ends up very different in character than the physical labora-tory at the university.
Student Learning in
INDUSTRIALLY SITUATED VIRTUAL LABORATORIES
Fundamental Research in Engineering Education
milo d. KoReTsKy, chRisTine Kelly
OregonStateUniversity•Corvallis,OR97331-2702ediTh gummeR
CenterforClassroomTeachingandLearning,EducationNorthwest•Portland,OR97204
Milo Koretsky is an associate professor in the School of Chemical, Biological, and Environ-mental Engineering at Oregon State University. He received his B.S. and M.S. degrees from UC San Diego and his Ph.D. from UC Berkeley, all in chemical engineering. He currently has research activity in areas related to thin film materials processing and engineering educa-tion and is interested in integrating technology into effective educational practices and in promoting the use of higher-level cognitive skills in engineering problem solving.
Christine Kelly is an associate professor in the School of Chemical, Biological, and Environ-mental Engineering at Oregon State University. She received her B.S. degree from the Univer-sity of Arizona and her Ph.D. from the University of Tennessee, both in chemical engineering. She currently has research activity in biological production and use of ligninolytic enzymes in biomass deconstruction for bioproducts and biofuels manufacture.
Edith Gummer is the director of the Classroom-Focused Research
and Evaluation Program for the Center for Classroom Teaching and Learning at Educa-tion Northwest. She received her B.A. degree from Indiana University in biology, M.S. de-grees from the State University of New York in biology and in science education, and her Ph.D. from Purdue University in curriculum and instruction. Her interests are in the devel-opment of innovative mathematics curricular activities and formative assessment in math-ematics problem solving.
© Copyright ChE Division of ASEE 2011

Chemical Engineering Education220
The virtual laboratory functions similarly to pedagogies described by problem-based learning,[10,11] model-eliciting activities,[12] and context-rich problems.[13] Like these pedago-gies, a complex, ill-structured, open-ended, authentic problem forms the context for learning, and students actively and collaboratively engage in the solution. The environment also requires students to greatly extend their personal responsibil-ity for learning. In the case of the virtual laboratory, however, the data are generated dynamically by the software based on each student team’s distinct choices of reactor parameters and measurements, as opposed to having the instructor provide static data sets. Therefore, not only is the solution path unique for each group, but the data that are used to find that solution are also unique.
Shavelson, et al.’s,[14] cognitive framework is used to inves-tigate student learning in the virtual laboratory environment. This framework describes scientific achievement as consisting of four types of knowledge: declarative (“knowing that”), procedural (“knowing how”), schematic (“knowing why”), and strategic (“knowing when, where, and how our knowl-edge applies”). Schematic knowledge includes principles, schemas, and mental models that explain the physical world. Strategic knowledge is demonstrated by determining how and what knowledge applies to a new situation and includes domain-specific conditional knowledge and strategies such as troubleshooting and problem-solving as well as monitor-ing.[15] Although laboratory experiences are meant to draw upon and develop all four types of knowledge, often the physical laboratory at the university relies upon the declara-tive and procedural aspects of recall of facts and adherence to proper protocol. In the virtual laboratories, however, the physical component is removed and students are able to focus on developing schematic knowledge, by integrating concepts and building models, and strategic knowledge, by intelligently combining these models to formulate a solution to an ill-structured and open-ended task.
This paper provides an overview to the instructional design of the virtual laboratory project as it has evolved over the past six years. This description is followed by presen-tation of the three major research meth-ods that have been used to investigate student cognition, metacognition, and social interactions in this environment, and a summary of some of the research
findings from each method. The research aims to provide greater understanding of student learning in this environment. This understanding is needed for more systematic software development and instructional design, application to other engineering processes, and widespread use. With a clearer understanding of the cognitions and social interactions of students, the role of virtual laboratories in the curriculum and in accreditation processes can be explicitly identified.
INSTRUCTIONAL DESIGNTwo virtual laboratories have been developed: a Virtual
Chemical Vapor Deposition (VCVD) Laboratory and a Virtual Bioreactor (VBioR) Laboratory. Screenshots of the three-di-mensional student interfaces for each virtual laboratory are shown in Figure 1. The instructional design is “industrially situated” both in the scale of the process and by the nature of the engineering task that student teams complete. The VCVD Laboratory simulates an industrial-scaled vertical chemical vapor deposition reactor in which silicon nitride is deposited from dichlorosilane and ammonia gases at low pressure and high temperature. Students are tasked with achieving maximum thickness uniformity and minimum dichlorosilane utilization by adjusting operating parameters including gas feed rates, temperatures of five reactor zones, system pres-sure, and duration of operation. The VBioR Laboratory is based on an industrial stirred-tank fed-batch bioreactor, and can be used for different applications, such as production of a recombinant protein or degradation of waste, and run in either batch or fed-batch mode. Students aim to achieve maximum volumetric productivity by varying input parameters such as temperature, substrate concentrations, cultivation times, and feed flow rate. Random process and measurement variation is added to the data for students from the simulation output. In both of these virtual laboratories, the students are experienc-ing industrial aspects of engineering that they typically do not experience in university classes and laboratories. The details of the VCVD and VBioR Laboratories have been previously published.[16-18]
A. B.
Figure 1. Screenshots of the student interfaces: A. The Virtual CVD laboratory and B. The Virtual BioR Laboratory.

Vol. 45, No. 3, Summer 2011 221
Although centered in different domains, both the Virtual CVD and Virtual BioR laboratories have at their root reaction kinetics and material balances. Schematics of the simulated systems are indicated in Figure 2. The VCVD system can be described using a simulation with transient solid phase accumulation, and a pseudo-steady state gas phase. The VBioR is an inherently transient system, with cell growth, substrate consumption, and product synthesis and degradation occurring throughout the cultivation. Both scenarios present an adequate challenge to students while eliciting the use of engineering principles and models.
The instructional activities are constructed around prin-ciples of scaffolding, coaching, reflection, articulation, and exploration.[19] The group-based project tasks teams to develop a process recipe (i.e., values for reactor parameters) for release to high-volume manufacturing, by:
• Composing an experimental design strategy memoran-dum and reviewing it with the instructor before access-ingthevirtuallaboratory.(reflection-on-actionactivity);
• Recordingactivityinanexperimental journal, keeping track of the run parameters, data analysis, interpreta-tion, and conclusions and decisions from the interpreta-tion.(reflection-in-actionactivity);
• Preparinganupdate memorandum and reviewing it with the instructor one week after having access to the virtual laboratoryandrevisingexperimentaldesign(reflection-on-actionactivity);and
• Synthesizingexperimentalresultsintheformofafinalwritten and oral report.
Consider two central learning events that occur in partner-ship with the software: (1) as the students prepare to engage in the virtual laboratory and (2) when they respond to the data that is dynamically generated. Both require a transition from
schematic knowledge to strategic knowledge. In both cases, the learning does not occur directly within the software inter-face; rather, students need to engage at a range of cognitive activities, from anticipating data from planned experiment trials to sequencing runs, from evaluating data to linking data patterns to parameters that need to be changed.
The beginning of the project directs students to an infor-mation gathering/problem scoping phase that places unusual responsibility on the students themselves to formulate the problem. This formulation is structured around a 20- to 30-minute design meeting with the student team and a faculty instructor, the domain expert who acts in the role of manager and coach. In this role, the instructor reinforces the epistemic frame of the engineering profession by modeling the way an engineer thinks and acts.[20] At this meeting, the students must deliver a memorandum that specifies the parameters for their first “run,” a strategy for subsequent runs, the approach to evaluate the experimental data from the runs, and a vir-tual budget. In pursuing their design strategy, students both search the literature to obtain reasonable reactor parameters and integrate prior knowledge from a diverse set of courses ranging from material balances and reaction kinetics to ap-plied statistics and experimental design. Developing a project budget motivates the teams to consider the entire project scope (e.g., the number of runs and measurements that are needed), situates the problem in the context of engineering practice, and provides an urgency for students to be thoughtful and efficient in experimental design. During the meeting, the instructor provides feedback by asking questions to guide the students in developing features of the strategy, initial parameters, and budget that they have not appropriately addressed. Only after the team has an acceptable design (typically after a revision) are they given access to the virtual laboratory. Both the de-sign meeting and the following intermediate update meeting
id
Feed mediumB.To Pump
A.
Agitator motor
Off gas
Acid
Base
Water return Si3N4deposition
Diffusion
Wafer
e Fu
rnac
e
Wafers
DO probe
pH probefrom jacket
TemperatureTemperature controlled water
reaction
Gas flow
NH
Wafer5 Zo
ne
PQuartz boat
Air
Sample port
NH3
SiCl2H2
Figure 2. Schematic of the equipment simulated by the two virtual laboratories: A. chemical vapor deposition reactor and B. bioreactor.

Chemical Engineering Education222
provide rich opportunities for reflection-on-action, which can result in improvements to the experimental approach and promote a deeper understanding of the process.[21]
A second primary learning mechanism occurs throughout the bulk of the project when students obtain the output data generated by their virtual experiment at the run conditions that they have chosen. When they perform an experiment and obtain data, the student teams must confront what they actually obtained vs. what they expected (or did not consider). We have noticed resulting cases of cognitive conflict and cognitive confirmation. Posner, et al.’s,[22] model proposes that conflict caused by anomalous data is a necessary first step to achieving conceptual change. It is believed significant learning occurs during the time when the students are trying to make sense of their data and trying to make decisions about what input parameters to try during their next run; however, more research is needed to elucidate the specific nature of the student cognition.
RESEARCH QUESTIONS AND METHODSThe mixed methodological basis of this research is grounded
in a phenomenological perspective of ascertaining how students who are engaged in the virtual laboratory as a learning environ-ment make sense of their experiences; how they operational-ize their schematic and strategic knowledge; and how their cognitions manifest and the degree to which the cognitions are distributed. Specific research questions include:
1. Whatisthenatureoftheexperimentaldesignprocessthat students apply in the virtual laboratories?
2. How does students’ tolerance for ambiguity change while completing the virtual laboratories?
3. In what ways do students perceive the virtual laborato-riesasanauthenticexperiencethatisreflectiveofreal-life engineering? How do the ways that students perceive virtual laboratories compare to physical laboratories?
4. What types of knowledge structures and cognitions are demonstrated by students when engaging with the virtual laboratories?
Figure 3 shows the primary research meth-ods that have been used in our research: survey analysis, talk-aloud protocol analysis, and model representation and usage maps. These methods do not align solely to a specific research ques-tion, but rather can be analyzed through different lenses to address the four research questions. Having multiple data sources for each research question allows triangulation of results and test-ing of alternative explanations to ensure research rigor.[23] The theoretical framework is based on a multi-tier teaching experiment design that is used both to assess iteratively the knowledge structures evoked by students engaged in the virtual labora-tory experiments and to improve systematically the
instructional design.[24] Rather than pre- and post-test design, this approach is to generate audit trails that reveal important and in-depth information about the nature of learning and development that occurs.
SURVEY ANALYSISA set of free response survey questions has been posed to
students in the first term of the capstone Senior Laboratory class in which the virtual laboratory project is delivered. This method seeks to identify how students’ perceptions of their knowledge and awareness of their own learning evolve as they move through the three structured laboratory experiences in that class. The first and third laboratories are physical laboratories, based on the unit processes of heat exchange and ion exchange. The second is the virtual laboratory. Students’ perceptions of learning provide a lens into their metacognitive processes. Metacognition is the process of students monitoring their own learning and is an important element of student learning in the engineering context.[25] Student understanding of the goals of learning experiences is a critical element in student acquisition of the content understanding and deep cognitive and procedural skill development in higher education.[26]
The survey questions were asked after each of the three laboratories as soon as possible after submission of the fi-nal laboratory report for that given laboratory. There were, in some cases, overlaps with content presentation for the next laboratory. The following questions were coded and analyzed:
Q1. What do you think the instructors intended you to learnbydoingthe(IonExchange/Virtual/HeatEx-change) laboratory?
Q2. Howwouldyouexplainthislaboratoryexperiencetoafirst-yearstudent?
Q3. Whenyoucloseyoureyesandpicturethelabexperi-ment, what do you see?
The course performance of students, measured by the weighted final score on all assignments, was used to correlate aggregate responses to performance. The survey has been
Assess Student Learning and Social Interactions in Virtual Laboratories
Model Representations
Talk Aloud Protocol Analysis
Survey Analysis
Winter 2006 … Fall 2008 …Fall 2007 …
Figure 3. Research methods to assess student perceptions and learning in the virtual laboratories.

Vol. 45, No. 3, Summer 2011 223
administered for the past three years. To date, a total of 999 student responses have been coded. The student responses were anonymous, and responses to all three laboratories were only analyzed after the course was complete.
The coding method for responses was developed as follows. The raw data were analyzed by content analysis to establish categories to group the responses.[27] The number of coded statements in each category was summed across all of the student surveys for each of three researchers for each of the three laboratories. To achieve adequate interrater reliability, the following process was used. The three faculty researchers met together and the independently coded responses were compared and the differences reconciled. To determine the validity and reliability, two other researchers with no connec-tion to the project were given a subset of 60 responses from one of the survey questions (20 responses per question per laboratory). This subset of responses was randomized among the three laboratories, so the researchers could not identify what response was associated with what laboratory. The two researchers went through the same process of individually coding and then reconciling the data. The value of interrater reliability using the Cohen’s Kappa (κ ) statistic was 0.89. The fact that the second group had randomized responses suggests that there is not a bias based on the laboratory. Statistically significant categories of the nonparametric, ordinal coded response data to the survey questions were determined using the Pearson chi-square test.
A sample response to survey Question 1 for the Virtual Laboratory project follows:
“Ibelievetheinstructorswantedustoexperiencehowlab work is and should be performed in the real world. We did not have to worry about actual lab procedures, so experimentaldesignandanalysiswerethefocalpointsofthe lab. We had the added constraint of a budget, which madeproperexperimentaldesignkey,sincewecouldnotovercome problems created by collecting data from poorly plannedexperimentsbyrunningtheexperimentmanytimesand collecting lots of data to get it right. I think they also wanted us to work on the process of looking at the theory behindthelabfirsttogetanideaofwheretostartourexperiments,andthenperformintermediatedataanalysistodeterminebestcourseforfutureexperimentsasmoreinformation became known.”
This response was rated as higher-order cognition, and rated in the following categories: experimental design, critical thinking, and situated nature. Further details of this analysis are presented elsewhere.[28,29]
Analysis of the complete set of survey responses shows en-hanced awareness of experimental design, a greater reference to critical thinking, and more responses rated at higher-order cognition in the virtual laboratory, and an enhanced awareness of laboratory protocol in the physical laboratories. The sum of high-cognition rated statements for the three laboratories correlated with student overall performance in the course.
There is growing tolerance for ambiguity as students move through the course and a shift from a perception of ambiguity in the instruction and instructors’ expectations to an ambiguity in the experimental process itself. There is indication, how-ever, that a significant portion of students may not view the virtual laboratory as a real system. Even with limitations in the physical presence induced by the software interface, many students have indicated an ability to suspend disbelief and demonstrate psychological immersion in the virtual labora-tory project. There is evidence that cognitive partnerships are formed between students and the virtual laboratory artifact, characteristic of a rich learning experience.
TALK-ALOUD PROTOCOL ANALYSISProtocol analysis consists of audio recording selected
student teams while they “talk aloud” as they solve the vir-tual laboratory project. Protocol analysis has been shown to give insight into cognitive processes, especially in situations where higher-order critical thinking ability is needed.[3,30] In the virtual laboratory project, analysis of the talk-aloud data can provide information about the nature of the iterative experimental design process, how models are developed and the knowledge structures used, the nature of the feedback in the design and update meetings, the team’s tolerance for ambiguity, the effect that the team dynamic has on the proj-ect direction, and instances in which cognition is distributed through cognitive partnerships.
Over the span of five years, complete data sets have been audio recorded from 16 student teams as they have completed the virtual laboratory project (12 CVD and four BioR). The method we have developed follows. The researcher observes and audio records the teams at all times they work on the project, which has averaged approximately 20 hours. To the extent possible, recording occurs at all times the teams are engaged in the project, from problem scoping to their final oral presentation. During data collection, students are instructed to verbalize their thoughts, but not encouraged to describe or explain their thoughts. As the students proceed, the researcher fills out a data sheet. This data sheet has been specifically designed to align with the qualitative analysis method in several ways.[31] The right side of the data sheet contains a table where observed tasks are chunked into the design processes and the quality is evaluated according to a rubric we have developed. Significant sociocognitive
It is believed significant learning occurs during the time when students are trying to make sense of their data and trying to make decisions about what input parameters to try during their next run.…

Chemical Engineering Education224
interactions that impact the completion of the task are noted. On the left side of the data sheet a task map visually depicts the flow of tasks. The “tolerance for ambiguity” demonstrated by the team during the session is quantified as rated according to Perry’s[32] empirical model with nine levels of intellectual growth. The data are then transcribed for more fine-grained analysis.
We have identified a set of performance tasks in which the students engage as they complete this situated project. An example of this analysis is shown in Figure 4, which depicts the experimental pathways taken by a student team. The sequence of tasks completed by the teams is indicated in numerical sequence in the pathway. Inspection shows the team achieved many iterative cycles, completing three design cycles (outer loop), 11 analysis cycles (inner loop), and one Design of Experiments (tasks 26-33). Similarly, results from the task analysis from the other teams participating in the think-aloud sessions have been compiled.[16, 31] In all cases, the teams demonstrated an iterative approach to experimental design, completing an average of three design loops and 12 analysis loops. This evidence suggests that students were engaged in the intended approach of experimental design.
The modified Perry’s levels were applied to quantify the teams’ tolerance for ambiguity. Evaluation results elucidating
tolerance for ambiguity indicate that by completing this open-ended problem most students evolve past “blind acceptance of authority” and become aware of a “multiplicity of views”; however, while some teams continued to climb Perry’s levels, eventually becoming comfortable with the idea of “contextual relativism,” other students did not.[31] An interesting parallel to these differences is found in the nature of the sociocogni-tive interactions found in the different student teams; these interactions seem to be able to either promote the desired learning, or they can be detrimental to the intended learning outcomes.
MODEL REPRESENTATION AND USAGE MAPSTo capture the model construction and higher cognition and
to characterize the schematic and strategic knowledge invoked by the virtual laboratory project, we have developed Model Development and Usage Representations (Model Representa-tions) as an analysis tool. The Model Representations are gen-erated from student work products, such as journals/laboratory notebooks, written reports, and memorandums, and from the instructor interface, which records all groups’ run parameters and results. They are a visual and chronological coding tool used to identify and characterize student knowledge struc-tures and cognition as students perform the virtual laboratory project. The Model Representations can be used to identify
the ways students use their sche-matic knowledge to build models and use their strategic knowledge to integrate these models into their project solutions.
Student journals serve as the primary source of information for coding since they are intended to contain all references, notes, results, and calculations over the course of the project. Model com-ponents are identified from the student journals chronologically and are then supplemented with information from other sources that serve to confirm, explain, or expand upon the journal content. Student researchers first individually dissect the work products to construct the preliminary Model Representation. Consensus is then obtained by a group of two students and two faculty. One faculty member—the domain expert in the appropriate field—examines the source mate-rial and evaluates the accuracy and context of the Model Representa-tion. An Overview statement is then written that summarizes in
Experimental design & measurement strategyOuter
loop
2,5,8,11,14,17,20,2337 41 45 48 51 54
Conduct an experiment
Tasks 1,36,40,44
26,27,28,29,30,31,32,33
35,39,43 Inner
loop37,41,45,48,51,54
3,6,9,12,15,18,21,2434,38,42,46,49,52,55
4,7,10,13,16,19,22,25,47,50,53
Analyze and Interpret the data.
Submit final recipe &
Draw conclusions & make decisions
56
Submit final recipe & report findings
Figure 4. Experimental paths derived from task analysis of one team that participated in the “talk-aloud” study.

Vol. 45, No. 3, Summer 2011 225
a concise manner the group’s approach and integration of model components in its unique solution to this authentic, ill-structured problem. To assure reliability of coding between the Model Representations of the two virtual laboratories, the student and faculty who analyze the other virtual laboratory participate in this process. A more complete description of the methodology for developing Model Representations is presented elsewhere.[33]
Figure 5 shows a summary of the coding key that has been developed. Model Representations specify the types of model components employed (quantitative or qualitative, statistical or empirical), their degree of utilization (operationalized, abandoned, or not engaged), their correctness, and the experi-
mental runs to which they are relevant. This information is combined along a timeline with experimental runs, emotional responses, and instructor interaction to show context and form the complete Model Representation.
To illustrate the effectiveness of Model Representations as a tool to study student learning, a subset from one Virtual CVD Laboratory group (CVD Team I) is presented in Figure 6 show-ing the progression of the kinetics model component through the project. As illustrated in the first box from the left, the team started by using a form of the first order rate law found in a common textbook in silicon processing[34]; however, they did not explicitly recognize it as a first order rate law. The group then replaced this expression with a more complex,
= Qualitative Component
Models developed by type: Model Progression Chronologically:
= Quantitative Component Primary Model Components
#, #
Runs in which model was incorporated
Connecting arrow: engaged in a useful way
Problem
E = Empirically Based
Statistically Based
Modeling Actions:Operationalized (Green)Ab d d (R d) Secondar model components
#, #
Considered,but not engaged
ProblemScoping
Represents students’ preliminary investigation
S = Statistically Based
Abandoned (Red)Not Engaged (Black)
Run markers by motive:
Secondary model components
Text/quote Text/quote
preliminary investigation
= Parameter Defining Run
= Qualitative Verification
Instructor Consultation
M d l Di t d R
“Title or Source”
Emotional Response
= Model Directed Run
Clearly Incorrect= Unrelated to Modeling Literature Reference
Figure 5. A summary of the Model Representation component key.
“The Model”Wolf & Tauber
T sC k YG n mR kC C R kC R kC1
GN 3DCS NHR kC C DCSR kC DCSR kC
Figure 6. Progression of the kinetics model component through the project for CVD Team I.

Chemical Engineering Education226
Figure 7 (facing page). Four model representations placed in reference to evaluation of schematic knowledge
(x-axis) and strategic knowledge (y-axis) demonstrated.
higher-order rate equation that they were simultaneously covering in their reactors class. They were unable to solve for the higher-order rate parameters using the complex data sets generated from their runs and measurements. Consequently, they abandoned this approach (as illustrated by the dashed line in Figure 6 or a red line in Figure 7). They then simplified the expression to a pseudo-first order rate equation (third box from left). This form was utilized with an empirical correc-tion factor in this team’s progression towards final parameters (fourth box). Integration of other model components (includ-ing a material balance and the Arrhenius relationship) led to what the team anthropomorphically called “The Model,” which was used to predict run parameters to converge on the process recipe. The progression of this model component is reflective of deep learning and shows characteristic adapt-ability of experts. This group was rated as high for their use of schematic knowledge in developing the model and high for their use of strategic knowledge in operationalizing the model effectively to obtain a useful solution.
A total of 27 Model Representations have been completed for the 2008 cohort in the capstone laboratory course at Oregon State University and four examples are presented in Figure 7. This figure places the Model Representations on axes of schematic and strategic knowledge. The complete model representation for CVD Team I is shown in the up-per right as high schematic and high strategic. The different model components are illustrated with respect to the 17 runs the team performed using the component key shown in Figure 5. Similarly the other 26 teams were rated on use of schematic and strategic knowledge. Examples of teams rated as high-strategic, low-schematic (Team II); high-schematic, low-strategic (Team IV); and low-schematic, low-strategic (Team III) are shown. Inspection of Figure 7 shows the wide range and variety of model development approaches in solv-ing this authentic, ill-structured problem.
Team IV showed sound schematic knowledge and engineer-ing skill using a model-based approach, and attained high uniformity after just four runs. Their strategic knowledge was insufficient to respond to a special cause of variation or to determine a meaningful end point to the project, however. Interestingly, failure to identify a reasonable end point was followed by largely incorrect methods, which later yielded to empirical adjustments. Conversely, Team II’s schematic knowledge is incomplete and demonstrates misconceptions. For example, their value for activation energy is originally inaccurate, due to an incorrect application of a model. The unreasonable value is recognized, however, and the value is quickly changed to a value from the patent literature (good strategic thinking), which is central to the team’s solution.
The Model Representations indicate learning may be occur-ring across the spectrum of quality of knowledge structures. For example, consider Team III (low-schematic, low-strate-gic). Initially, their methods appear to consist of randomly
responding to cues within the problem without any evidence of drawing from a knowledge framework. As illustrated in the top line of the Model Representation, many methods from different classes are attempted. Run 6, however, allows the group to identify a core concept and integrate it into the project. This guides their future efforts. All run input parameters prior to run 6 used a gradient in temperature, and the group had trouble simultaneously considering both the kinetic influence of temperature and the influence of gas flow rate on reactant depletion. In run 6, zone temperatures were constant throughout the reactor. At this point the team identified that “decreasing growth rate up the tower (sic) is due to decreasing concentra-tion.” While the team showed low schematic and strategic knowledge, the experience of Run 6 enabled a transformation in their solution process (see bottom line vs. top line of the Model Representation). This transformation may indicate genuine change of the students’ conceptual understanding, but other explanations are also plausible and this aspect needs to be more carefully studied. We believe traditional curricula characterized by fragmented courses emphasizing contrived end-of-chapter type calculations may contribute to the lack of coherence in knowledge structures.
CONCLUSIONSThe following major conclusions have been found from this
research on student learning in industrially situated virtual laboratories:
• VirtualLaboratoriescanprovideadynamicProblem-BasedLearningexperiencewherestudentsengageinanauthentic industrially situated task.
• Dataanalysisshowsthatstudentsexhibittheintendediterativeexperimentaldesignprocessandexhibitgreaterreferences to critical thinking and higher-order cogni-tion in the virtual laboratories than in capstone physical laboratories.
• Evidencesuggeststhatthestudents’toleranceforambiguity is developed as students move through the project. Additionally, there is a shift from a perception of ambiguityintheinstructionandinstructors’expectationstoanambiguityintheexperimentalprocessitself.
• Asignificantportionofstudentsmaynotachievephysicalpresence and view the virtual laboratory as a real system. Many demonstrate the ability to suspend disbelief leading to psychological immersion, however. In some cases, a clear cognitive partnership between the students and the virtual laboratory artifact is demonstrated.
• Cognitivehistoricalanalysisofworkproductsshowsa diverse set of modeling approaches in the student solutions to the virtual laboratory project. This method shows promise for discriminating between widely vary-ing the schematic and strategic knowledge structures of the teams.

Vol. 45, No. 3, Summer 2011 227
CV
D Team
IC
VD
Team II
edge
High
Activation
EnergyWolf &
Tauber
egic Knowle
H
Problem
Scoping
Activation Energy,
EA #1
EA#2
12
34
0kt
AC
Ce
DCS
RkC
,1
22
1
DCS
ABA
ZA
AC
DN
yy
zz
Patent 6936548
11, 2, 3
Ideal Gas
LawMaterial
BalanceE
Problem
Scoping
Material
BalanceMass
transfer range=
higher
12
34
56
7
3
nm
DC
SN
HR
kCC
2,3,4,5
2,3,4,52,3,4,5
1
Ts
CkY
GN
0
aERT
sk
ke
DCSR
kC
Strate
78
910
1112
1314
15
Lower
Pressure,
FinalParam
eters0
AERT
Ar
ke
C
expA
ERT
7
uniformity
Thickness changes
linearlywith
“The Model”
Correction Factor: α
89
1011
1213
1415
1617
“The Model
worked V
ery well!!”
FinalParam
eters0
aERT
DC
SD
CS
RkC
ke
YRT
E
CV
D Team
IIIC
VD
Team IV
Schematic K
nowledge
High
Low
Higher
Uniform
ity12
exp
new
oldA
RTzz
ERT
8‐13
linearly with
time
11,12
ProblemScoping
DC
SR
kC
Rxn. Rate Lim
ited vs.
Diffusion Lim
itedMaterial
Balance 2Material
Balance 1Wolf &
Tauber1
Arrhenius Graph
2 Depletion
occurs when in
Mass Transfer
Limited Regim
e
Utilization
34
5
1
2
Instructor Consultation
ProblemScoping
Utilization
0.02%
Rxn. Rate Limited
vs.Diffusion Lim
ited
12
34
56
7
8IdealG
as Law
d
76
ii
Gk T
i
GT
Material
Balance
0
AERT
kk
e
22
a
kTP
Welty et al.
Thickness changes
linearly with
time
6
Temperature
controls grow
th rates
7“H
ad trouble calculating T
dit”
Run 17 is a re‐run of run
16
Utilization
0.02 %
Measurem
ent error
Higher
Temperature, Higher
Utilization
910
1617
1819
LawAs D
CS is used, T must
rise to keep Rxn. Rate the sam
e
FinalParam
eters
1112
1314
15
4
Low
gradient”
89
1011
1213
1415
1617
FinalParam
eters
Empirical
Adjustm
ents9‐16
run 16s
EEm
pirical Model (G
rowth
Rate Graph)
Decrease
NH3 Flow
to Increase
Uniform
ity
Uniform
ity goes dow
n if flow
rate goes up
Ideal Gas
Model
11‐1511

Chemical Engineering Education228
ACKNOWLEDGMENTSThe authors are grateful for support provided by the In-
tel Faculty Fellowship Program and the National Science Foundation’s CCLI Program, under Proof-of-Concept grant DUE-0442832 and Phase 2 grant DUE-0717905. The au-thors acknowledge Debra Gilbuena, Kendra Seniow, Erick Nefcy, Connelly Barnes, Bill Brooks, Eric Gunderson, Jeff Noffsinger, Derek Meyers-Graham, Danielle Amatore, Sho Kimura, and Phil Harding for their contributions to this proj-ect. Any opinions, findings, and conclusions or recommenda-tions expressed in this material are those of the authors and do not necessarily reflect the views of the National Science Foundation.
REFERENCES 1. Feisel, L.D., and A.J. Rosa, “The Role of the Laboratory in Undergradu-
ate Engineering Education,” J. Eng. Ed., 94, 121 (2005) 2. Hofstein, A., and V. Lunetta, “The Laboratory in Science Education:
Foundations for the Twenty-first Century,” Science Education, 88, 28 (2004)
3. Ma, J., and J.V. Nickerson, “Hands-On, Simulated, and Remote Labo-ratories: A Comparative Literature Review,” ACM Computing Surveys, 38, 1 (2006)
4. Mosterman, P.J., M.A.M. Dorlandt, J.O. Campbell, C. Burow, R. Bouw, A.J. Brodersen, and J. Bourne, “Virtual Engineering Laboratories: Design and Experiments,” J. Eng. Ed., 83, 279 (1994)
5. Shin, D., and E.S. Yoon, “Web-based, Interactive Virtual Laboratory System for Unit Operations and Process Systems Engineering Educa-tion,” Computers & Chemical Engineering, 24, 1381 (2000)
6. Wiesner, T.F., and W. Lan, “Comparison of Student Learning in Physi-cal and Simulated Unit Operations Experiments,” J. Eng. Ed., 93, 195 (2004)
7. Woodfield, B., M. Andrus, T. Andersen, J. Miller, B. Simmons, R. Stranger, G. Waddoups, M. Moore, R. Swan, R. Allen, and G. Bodily, “The Virtual ChemLab Project: A Realistic and Sophisticated Simula-tion of Organic Synthesis and Organic Qualitative Analysis,” J. Chemi-cal Education, 82, 1728 (2005)
8. Kuriyan, K., W. Muench, and G.V. Reklaitis, “Air Products Hydrogen Liquefaction Project: Building a Web-Based Simulation of an Industrial Process,” Computer Applications in Eng. Ed., 9, 180 (2001)
9. Harmon, T.C., G.A. Burks, J.J. Giron, W. Wong, G.K.W.K. Chung, and E. Baker, “An Interactive Database Supporting Virtual Fieldwork in an Environmental Engineering Design Project,” J. Eng. Ed., 91, 167 (2002)
10. Woods, D.R., Problem-Based Learning: How to Gain the Most from PBL, McMaster University Bookshop, Hamilton, Ontario (1994)
11. Boud, D.J., and G.I. Feletti, The Challenge of Problem-Based Learning, Kogan Page, London (1997)
12. Hamilton, E., R. Lesh, F. Lester, and M. Brilleslyper, “Model-Eliciting Activities (MEAs) as a Bridge Between Engineering Education Re-search and Mathematics Education Research” Advances in Engineering Education, Summer 2008
13. Heller, P., and M. Hollabaugh, “Teaching Problem Solving Through Cooperative Grouping. Part 1: Group Versus Individual Problem Solv-ing,” American J. of Physics, 60, 627 (1992)
14. Shavelson, R., M.A. Ruiz-Primo, M. Li, and C.C. Ayala, “Evaluating New Approaches to Assessing Learning,” Center for the Study of Evaluation Report, UCLA (2003)
15. Li, M., and R.J. Shavelson, “Examining the Linkage Between Science
Achievement and Assessment,” paper presented at the AERA Annual Meeting, Seattle, WA. (2001)
16. Koretsky, M.D., D. Amatore, C. Barnes, and S. Kimura, “Enhancement of Student Learning in Experimental Design Using a Virtual Labora-tory,” IEEE Transactions on Education, 51, 76 (2008)
17. Kelly, C., E. Gummer, P. Harding and M.D. Koretsky, “Teaching Experimental Design Using Virtual Laboratories: Development, Implementation, and Assessment of the Virtual Bioreactor Laboratory,” Proceedings of the 2008 American Society for Engineering Education Annual Conference & Exposition (2008)
18. Koretsky, M.D., C. Barnes, D. Amatore, and S. Kimura “Experiential Learning of Design of Experiments Using a Virtual CVD Reactor,” Proceedings of the 2006 American Society for Engineering Education Annual Conference & Exposition (2006)
19. Collins, A., J.S. Brown and A. Holum, “Cognitive Apprenticeship: Making Thinking Visible,” American Educator, 15, 6 (1991)
20. Schön, D.A., Educating theReflectivePractitioner:TowardaNewDesign for Teaching and Learning in the Professions, San Francisco: Jossey-Bass (1987)
21. Svarovsky, G.N., and D.W. Shaffer, “Design Meetings and Design Notebooks as Tools For Reflection in the Engineering Design Course,” Frontiers in Education Conference, 36th Annual, 7-12 (2006)
22. Posner, G.J., K.A. Strike, P.W. Hewson, and W.A. Gertzog, “Accom-modation of a Scientific Conception: Toward a Theory of Conceptual Change,” Science Education, 66, 211 (1982)
23. Creswell, J.W., Qualitative Inquiry and Research Design: Choosing Among Five Traditions, Thousand Oaks, CA: Sage (1998)
24. Lesh, R., “Research Design in Mathematics Education: Focusing on Design Experiments,” in Handbook of International Research in Math-ematics Education, L.D. English, Ed. Lawrence Erlbaum Associates: Mahwah, NJ (2002)
25. Wankat, P.C., “Improving Engineering and Technology Education by Applying What is Known about How People Learn,” J. SMET Educa-tion: Innovations and Research, 3, 1 (2002)
26. Wiliam, D., “Keeping Learning on Track,” in Lester, F. (ed.) Second Handbook of Mathematics Teaching and Learning. Information Age Publishing, Greenwich 1051–1098 (2007)
27. Silverman, D., “Analyzing Talk and Text” in Handbook of Qualita-tive Research, 2nd ed., N.K. Denzin and Y.S. Lincoln (Editors). Sage Publications: Thousand Oaks, CA (2000)
28. Koretsky, M.D., C. Kelly, P. Harding, and E. Gummer., “Student Per-ceptions of Learning in the Laboratory: Comparison of Industrially Situated Virtual Laboratories to Capstone Physical Laboratories,” J. Eng. Education, July (2011)
29. Koretsky, M.D., C. Kelly, P. Harding, and E. Gummer, “Comparison of Student Perceptions of Virtual and Physical Laboratories,” Proceed-ings of the 2009 American Society for Engineering Education Annual Conference & Exposition (2009)
30. Ericsson, K.A., and H.A. Simon, Protocol Analysis: Verbal Reports as Data, Cambridge, MA: MIT Press (1996)
31. Amatore, D., E. Gummer, and M.D. Koretsky, “Instructional Design and Evaluation of a Virtual Laboratory in Nanoelectronics Processing,” Proceedings of the 2007 American Society for Engineering Education Annual Conference & Exposition (2007)
32. Perry, W.G., Forms of Intellectual and Ethical Development in the College Years: A Scheme, San Francisco: Jossey-Bass (1970)
33. Seniow, K., E. Nefcy, C. Kelly, and M.D. Koretsky, “Representations of Student Model Development in Virtual Laboratories based on a Cognitive Apprenticeship Instructional Design,” Proceedings of the 2010 American Society for Engineering Education Annual Conference & Exposition (2010)
34. Wolf, S., and R.N. Tauber, Silicon Processing for the VLSI Era, Lattice Press, Sunset Beach, CA, (2000) p