chemical composition of organic carbon fractions barbara zielinska
TRANSCRIPT

Chemical Composition of Organic Carbon Fractions
Barbara Zielinska

Study:ARIES: chemical characterization of atmospheric aerosol in support of Atlanta (Georgia) health study.Our goal: to provide information related to fine particle and semi-volatile organic carbon concentrations and composition

ARIES Study:24-Hr samples were collected daily from mid-July 1998 to end of December 1999, at a residential/industrial site in Atlanta, Georgia (Jefferson Street)
DRI Sequential Fine Particle/SVOC Sampler with 2.5 µm inlet and flow rate 113 L/minQuartz filters (10 cm) followed by PUF/XAD/PUF cartridges

Sample Extraction and Analysis:
0.5 cm2 punch from the filter was analyzed for OC and EC by thermal/optical reflectance (TOR) method.Samples (filters and PUF/XAD/PUF) were extracted with DCM followed by acetone and then by water by microwave extraction.Aliquot of each extract (~20 µl) was deposited on a pre-fired quartz filter punch and the solvent was evaporated to a constant weight.Quartz punches were analyzed by TOR method for OC/EC.

Monthly Means for TOR Analysis of Quartz Filters
0
2
4
6
8
10
12Ju
ly
Aug
ust
Se
pt
Oct
ob
No
vem
De
cem
Jan
Fe
b
Ma
rch
Ap
ril
Ma
y
June
ug
/m3 OC
EC

Extract OC
0
5
10
15
20
25
30
9/23
/98
9/27
/98
10/1
/98
10/5
/98
10/9
/98
10/1
3/98
10/1
7/98
10/2
1/98
10/2
5/98
10/2
9/98
11/2
/98
11/6
/98
11/1
0/98
11/1
4/98
11/1
8/98
11/2
2/98
11/2
6/98
11/3
0/98
12/4
/98
12/8
/98
12/1
2/98
12/1
6/98
12/2
0/98
12/2
4/98
12/2
8/98
ug
/m3
filt_oc dcm_oc ace_oc h2o_oc

Organic Composition of Extracts
Select extracts were analyzed by gas chromatography/mass spectrometry (GC/MS) using a thermal desorption method. Thermal desporption was conducted in sequential fashion with increasing temperatures that mimic the temperature ramps used with the TOR method (1: 120 ºC; 2: 250 ºC; 3: 380 ºC) .

1st desorption (120 ºC)
DCM extract
2nd desorption (250 ºC)
3rd desorption (380 ºC)

First Desorption, 120 °C
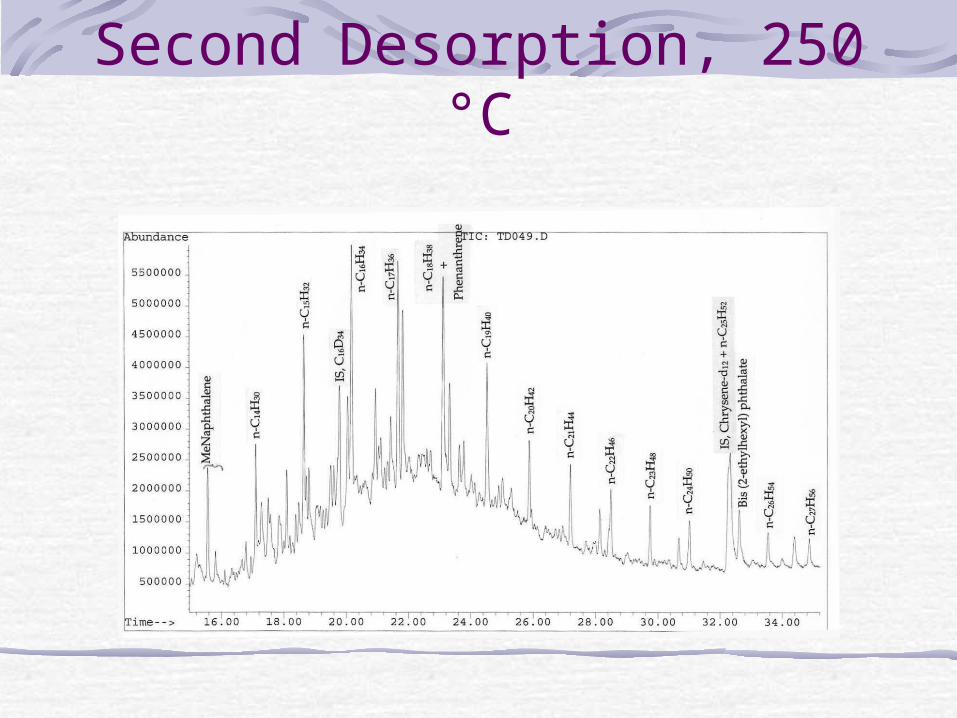
Second Desorption, 250 °C

Third Desorption, 380 °C

Hydrocarbons in DCM Extracts

Correlation of Organic Carbon to Mass for DCM Extracts
DCM - Filter/PUF, OC/Mass
y = 1.6728x + 0.4523
R2 = 0.883
0
10
20
30
40
50
60
70
80
90
0 10 20 30 40 50
OC (ug/m3)
Ma
ss (
ug
/m3)
DCM - Filter, OC/Mass
y = 1.4619x + 1.4825
R2 = 0.792
0
2
4
6
8
0 1 2 3 4 5
OC (ug/m3)
Ma
ss (
ug
/m3)

Correlation of Organic Carbon to Mass for Acetone Extracts
Acetone - Filter/PUF, OC/Mass
y = 2.0491x - 0.0797
R2 = 0.8899
0
2040
6080
100120
140160
180
0 20 40 60 80 100
OC (ug/m3)
Ma
ss (
ug
/m3)
Acetone - Filter, OC/Mass
y = 2.5165x - 0.6641
R2 = 0.9428
0
5
10
15
20
25
30
35
0 2 4 6 8 10 12 14
OC (ug/m3)
Ma
ss (
ug
/m3)

Conclusions:Sequential extraction of fine particle samples showed that most of the organic carbon is distributed between the DCM and acetone extracts. It is possible that many of the compounds that could be extracted with water are extracted in the first two solvents.Sequential thermal desorption of a DCM extract onto a GC/MS showed a series of non-polar compounds of increasing volatility. The desorption method can provide an insight into the composition of the organic fractions observed during the TOR temperature ramps.

Conclusions, cont.Thermal desorption analysis of the acetone extracts would require some derivitization method to aid in the analysis of polar compounds that are present in the acetone and water fractions.The relationship between PM2.5 mass and organic carbon for DCM and acetone extracts yields slopes that is slightly higher than current estimates of correction factors that should be applied to organic carbon numbers derived from the TOR method. A higher slope is observed for acetone, which is a higher polarity solvent and contains more oxygenated compounds.

Acknowledgements
The author would like to thank Electric Power Research Institute (EPRI Project Manager – presently Dr. Alan Hanson, formerly Dr. Tina Bahadori ) for the financial support of this work. Mr. Eric Edgerton (ARA, Inc.) is thanked for sample collection and Dr. Tina Bahadori for her continuous interest and encouragement.