chemical complexity with the ska
TRANSCRIPT

Chemical Complexity with the SKA
Jose CernicharoDepartement of Astrophysics
Center for AstrobiologyCSIC-INTA
Madrid. Spain

Why low frequencies to search for molecular complexity when in the millimeter/ submillimeter domains we have lines enough to give work to a lot of astronomers during several years ?
Why SKA for that purpose when ALMA and other existing facilities can allow to study in detail (high angular resolution) many astronomical environments ?
Different physical and chemical processes. Different observational approaches and different goals such as a large field of view for example or molecules without strong transitions in the mm/submm domain (heavy species, PAHs)

Belen Tercero, PhD, CAB
30-m IRAM radiotelescope. Beamsize 12-30”. Frequency range80-280 GHz. Source : Orion IRc2


Orion as seen with
30-m IRAM
Telescope.
10 min observing
time/GHz
30 GHz at 1mm &30 GHz at 3mm Simultaneously+ many 2’x4’ maps= 35 hours observingtimeB. Tercero & Cernicharo
16000 observed linesInitially 8000 U linesNow 4000 U lines4000 lines arising fromIsotopes of abundantspecies

Heavy molecules, more than 10-11 atoms, will have their emission peak at cm wavelenghts.
Some PAHs (more than 100 atoms) will have many lines below 2-3 GHz
Molecular emission from PDRs and diffuse clouds is often very weak andlarge collecting areas are needed
In many cases observations of atomic hydrogen are a crucial step to understand chemistry and the physical evolution of the clouds
The transition between atomic and molecular phases can be only understood ifdata from HI and molecular species is available. Combined cm/mm/submm surveys (SKA, large single dish millimeter telescopes; angular resolution ≈20’’)
High angular resolution is needed to study some apeculiarlty interesting astrophysical environnements such as the photosphere and dust formation zone of evolved stars (ALMA, SKA), or the warm, and molecular rich, innermost regions of protoplanetary disks.

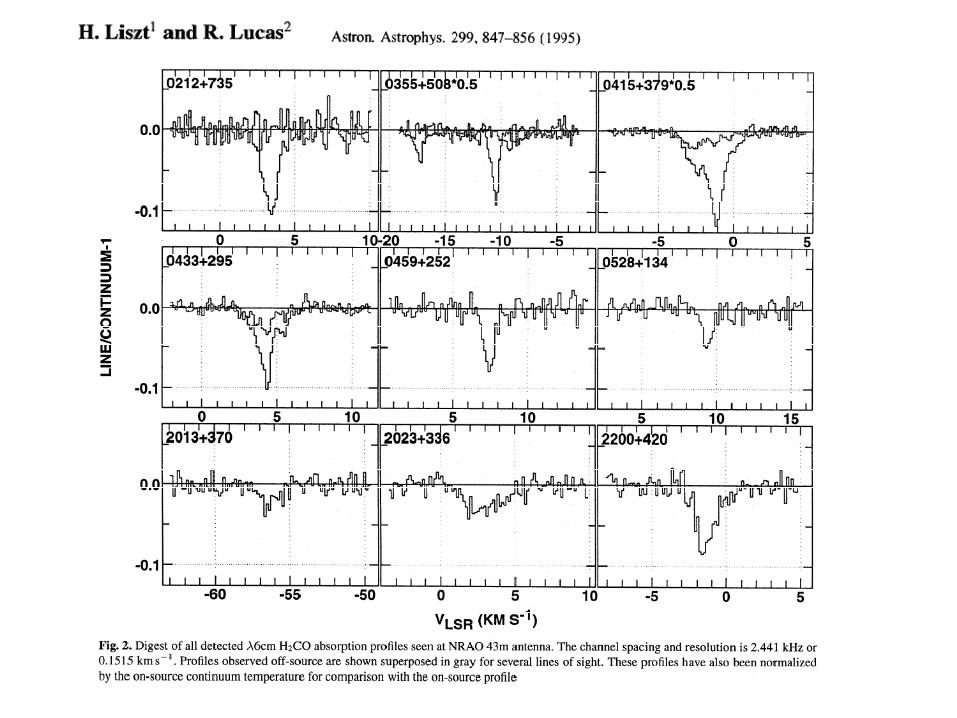
Chemical Complexity and Physical Structure in Diffuse clouds
ATCA observations with 100” resolution; local clouds; very long filaments with aspect ratio 170:1; magnetic field >30μG, <N(HI)>=2 1020 cm-2; Ts=40 K, Av=0.05-0.2 mag; <n(HI)>≈400 cm-3
are molecules there ? is CO mostly photodissociated ? What the SKA can do in this field ?

Wilson & Minn 1977, A&A, 54, 933

Cernicharo & Guélin 1987, 176, 299

2006, ApJ

The HI large scale structure of Molecular Clouds
• HI absorption measurements towards radiocontinuum sources show important line profile variations in short time scales
• HI self absorption traces the frontier between atomic (diffuse) and molecular clouds
• Large scale maps of OH and CH with high angular resolution in molecular clouds. Correlation of HI with OH and with the emission of other molecules observed with single dish telescopes at other frequencies.
• Can we detect complex molecules in the diffuse clouds ?


Corannulene emission in diffuse clouds (collisional excitation)
65 GHz
What about large molecules ?
Intensity proportionalto column density
IF UV pumped the lines could be very much more stronger as the equivalent rotational temperature will increase. For NC=100 the emission peak will be around 2-3 GHz. SKA as a machine to identify and characterize individual PAHs !!

Protoplanetary Disks• OH• Complex Molecules• SKA sensitivity is unique for maser searches and
molecular emission from heavy molecules in the illuminated surface of the disks
• HI ????Above 2 GHz::• Water Masers• Ammonia• Formaldehyde, and many other species
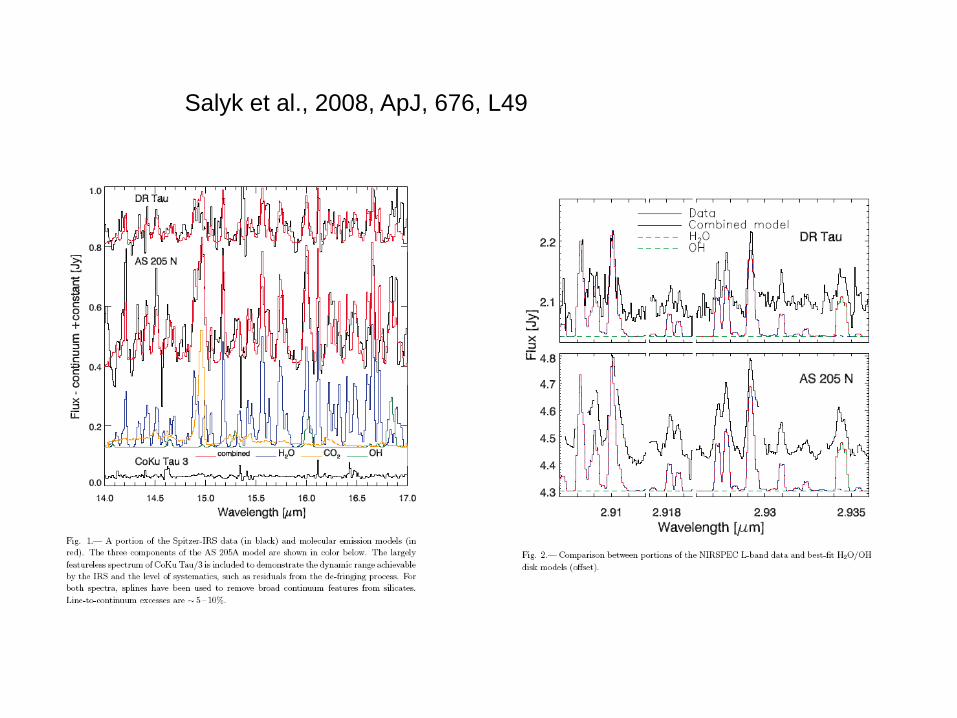
Salyk et al., 2008, ApJ, 676, L49

Water Masers in Protoplanetary diks
Cernicharo et al., 2009, ApJ, 703, L123

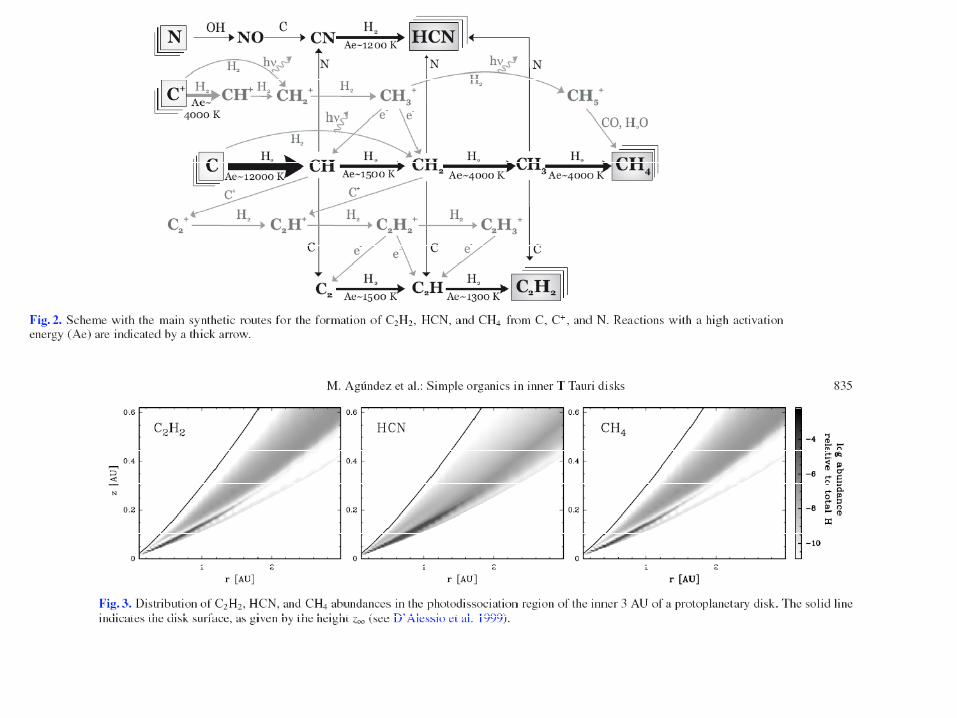
Tex>350 K, abundances of HCN and C2H2 >10-5, size < 13 AU
How these molecules have been formed ?What is the limit to chemical complexity in protoplanetary disks ?


Geers et al., 2006, A&A, 459, 545
PAH emission in the gas around T Tauri Stars

SKA and molecules in Protoplanetary disks
• Molecules have been observed with existing facilities but limited angular resolution and only a few of them have been detected.
• Most “hot” emission must arise from a very small region of 1-3 AU.
• Heavy molecules (single PAHs) will have their emission peak well below 30 GHz.
• Other molecules : H2CO, CH, HC3N, HC5N,… (below and above 2 GHz)
• Water masers (and OH) with SKA will provide a new view of the role of water in the evolution of the disks and on their structure in the zones heavily exposed to the radiation from the star.

Chemical Complexity in Evolved Stars
• Below 30 GHz a large amount of molecular lines showing thermal emission can be used to trace the structure of the envelopes of AGBs and post-AGBs objects.
• 22 GHz water masers.
BELOW 2 GHz::
• OH masers • Thermal emission of HCnN, CnH, CnN, and their anions in C-rich
stars • Masers of HCN (Δ J=0, Δl=1 lines) ?• Thermal emission of complex organic molecules (COMs) in O-rich
stars (heavy alcohols, ethers, …)• Where is the HI/H2 border in these objects ???• What is the extend of the envelopes ? What is the mass loss history
of these objects ?

O-rich star[C]/[O] < 1
C-rich star[C]/[O] > 1
O-bearing molecules:H2O, SiO, OH, …
C-bearing molecules:C2H2, HCN, CS, …

Leao et al. 200610’’

Guélin & coworkers

IRC+10216
CO J=2-1
30mdata
Outer carbonRadicals
shell
InnerRefractorySpecies
Shell
ExtremeOuterShells
Zone where dust shells have been observed
Where is the HI border ?

Angular Radius (‘’)
Radius (cm)
CO
abu
ndan
ce re
lativ
e to
H2
First ejected shell ≈ 2-3 104 years ago
Last ejected shell
Dust and HI mustfurther away the shell

IRC+10216
Cernicharo & Guélin 2004, A&A

Heavy molecules in IRC+10216• Heavy species such as C7H, C8H,… start to dissapear in
the 3mm spectrum of IRC+10216. The reason is that the emission from these heavy species peaks at longer wavelenghts (in spite of the large abundance they have, CnH/Cn+2H≈3)
• Chemical models predict that the anions of these radicals will have larger abundances than the neutrals (CnH-/CnH>1 for n>10).
• C3N-, C5N-, C4H-, C6H-, C8H- already detected in IRC+10216 (and some of them also in TMC1).
• The long carbon anionic chains will have very large dipole moments. Hence, their emission could be searched for with the SKA. These molecules have huge effects on the chemistry.
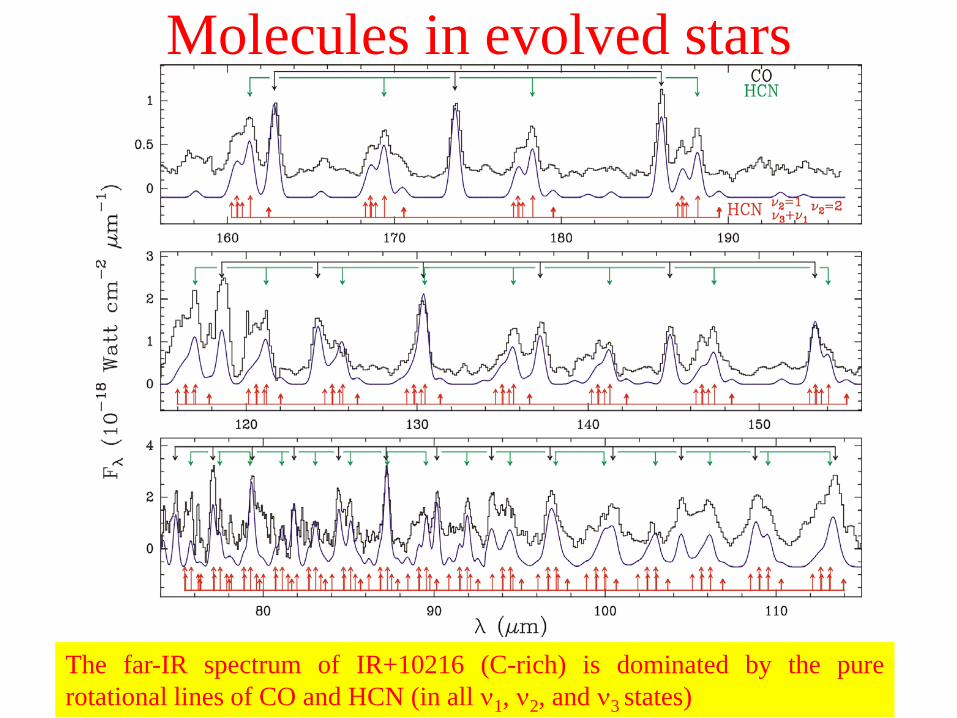
Molecules in evolved stars
The far-IR spectrum of IR+10216 (C-rich) is dominated by the purerotational lines of CO and HCN (in all ν1, ν2, and ν3 states)

HCN masersFirst HCN maser towards evolved stars detected by Guilloteau et al., 1987, A&A, 176, L24: J=1-0 of ν2=2 l=0
Very bright towards CIT6 but weak in IRC+10216

Strong HCN maser emission in IRC+10216
Lucas & Cernicharo, 1989, A&A, 218, L20
The emission was found in the J=2-1 lineof ν2=2 l=1c

Red arrows indicate ΔJ=0 transitions
Lucas & Cernicharo, 1989, A&A, 218, L20

HCN ν2=1 transitionsLINE Ju Lu Jl Ll FREQ(MHz) Eupp Aul Sij----- --- --- --- --- -------------- ------- --------- ---------
1 1 1 1 -1 448.94327 .0 3.127E-12 1.00E+00 Possible maser2 2 1 2 -1 1346.76596 8.6 2.533E-11 5.00E-01 Expected thermal emission of several K3 3 1 3 -1 2693.34035 21.4 9.646E-11 3.33E-01 4 4 1 4 -1 4488.47496 38.5 2.604E-10 2.50E-015 5 1 5 -1 6731.91463 59.9 5.751E-10 2.00E-01 Possible thermal (emission several K)6 6 1 6 -1 9423.34060 85.5 1.112E-09 1.67E-017 7 1 7 -1 12562.37069 115.4 1.958E-09 1.43E-018 8 1 8 -1 16148.55946 149.6 3.210E-09 1.25E-019 9 1 9 -1 20181.39844 188.1 4.984E-09 1.11E-01 Thermal emission around 100 K10 10 1 10 -1 24660.31630 230.8 7.404E-09 1.00E-0111 11 1 11 -1 29584.67918 277.8 1.061E-08 9.09E-0212 12 1 12 -1 34953.79093 329.1 1.476E-08 8.33E-02 13 13 1 13 -1 40766.89346 384.6 2.001E-08 7.69E-0214 14 1 14 -1 47023.16708 444.4 2.655E-08 7.14E-0215 15 1 15 -1 53721.73087 508.5 3.457E-08 6.67E-0216 16 1 16 -1 60861.64309 576.8 4.427E-08 6.25E-0217 17 1 17 -1 68441.90161 649.4 5.587E-08 5.88E-0218 18 1 18 -1 76461.44440 726.2 6.959E-08 5.56E-0219 19 1 19 -1 84919.14998 807.3 8.568E-08 5.26E-02 Detected with the 30m (weak TA but high TB)20 20 1 20 -1 93813.83799 892.7 1.044E-07 5.00E-02 Probably thermal emission21 21 1 21 -1 103144.26969 982.3 1.260E-07 4.76E-0222 22 1 22 -1 112909.14858 1076.2 1.507E-07 4.55E-0223 23 1 23 -1 123107.12102 1174.3 1.789E-07 4.35E-0224 24 1 24 -1 133736.77680 1276.6 2.109E-07 4.17E-0225 25 1 25 -1 144796.64989 1383.2 2.469E-07 4.00E-0226 26 1 26 -1 156285.21908 1494.1 2.872E-07 3.85E-0227 27 1 27 -1 168200.90872 1609.2 3.322E-07 3.70E-02
SKA: Maps with very high angular resolution of the photosphere and the dust formationzone of an evolved star !!!ALMA will reach angular resolutions of ≈0.01 arcseconds in the submm domain

WHERE IS HI in EVOLVED STARS?
• In the inner shells most HI has been transformed into H2
• In the outer shells H2 could be photodissociated. Hence, a neutral layer of atomic hydrogen must exist somewhere around AGB stars.
• Large field of view and angular resolution below 10” is needed to made sensitive searches for HI in these objects (the size of the CO shells is <10”).

IRC+10216CO J=2-130m data
Cernicharo et al.
Outer carbonRadicals
Shell(ALMA, SKA?)
InnerRefractorySpecies
Shell(ALMA,SKA)
ExtremeOuterShells
Zone where dust shells have been observed
Where is the HI border ? (VLA, SKA)

Protoplanetary Nebula• C-rich protoplanetary nebula, such as CRL618, show the
presence of the simplest PAH, Benzene, polyacetilines CnH2 (Cernicharo et al., 2001), and a lot of long carbon chains HC2n+1N (Pardo et al., 2006, 2007, 2008)
• They also shows thermal water and OH emission as observed with ISO (Herpin & Cernicharo 2002)
• They show a complex pattern of HC3N lines arising from many bending modes (ΔJ=0 transitions)
• Chemical models predict the presence of very large carbon clusters and their anions.

• Around 2500 líneas from 24 molecular species + recombination lines of H y He.
• Initially more than 80% of lines were U. Very soon we realized that the spectrum is dominated by HC3N & HC5N which are responsible for 85% of the total number of detected lines.
• Most lines have P-Cygni profiles. They transform into pure emission at high frequency. Some molecules do not show any absorption components, even at low freq.
• Abundant species show broad linewings (CO, HCN, HC3N, HCO+)
The line survey of CRL618
The large number of transitions for each molecule allows to reconstruct the morphology of the object:
MORPHOLOGY – PHYSICAL CONDITIONS – CHEMICAL ABUNDANCES.

• 3 bending modes and four stretching modes.• Bending modes: (n7,n6,n5): Energies below 663 cm-1
• Stretching mode n4 at 881 cm-1. The other are above 2000 cm-1 (and not detected in CRL618).
• 14 vib states detected in CRL618 with energies up to 1100 cm-1.
• The line profiles show : high velocity wind, low velocity expanding envelope, P-Cygni profiles decreasing when �increases.
Spectroscopy of HC3N Some HC3N line profiles
H C C C N
T A*(
K)

Reconstructing CRL618 step by step
Region responsible for the P-Cygni (inner envelope)
Tracer : code for HC3N in vib excited states
Help: Previous studies, continuum
and lines
Pardo & Cernicharo 2007, ApJ 654; Pardo et al., 2004, ApJ, 615, 495 & 2005, ApJ, 628, 275;

3 mm window : Data and final model

2 mm window : Data and final model

1.3 mm window : Data & final model

Looking for new molecules : Modelling
Chemical modelling specific to a C-rich PDR
Cernicharo 2004,
ApJ, 608, L41

ISO-SWS data
Cernicharo et al., 2001, ApJ

HC3N ν7=1 ΔJ= 0 spectrumLINE Ju Lu Jl Ll FREQ(MHz) Eupp Aul Sij----- --- --- --- --- -------------- ------- --------- ---------
1 1 1 1 -1 13.07723 .0 1.202E-16 1.00E+002 2 1 2 -1 39.23129 .9 9.739E-16 5.00E-013 3 1 3 -1 78.46140 2.2 3.710E-15 3.33E-014 4 1 4 -1 130.76640 3.9 1.002E-14 2.50E-015 5 1 5 -1 196.14471 6.1 2.213E-14 2.00E-016 6 1 6 -1 274.59439 8.8 4.281E-14 1.67E-01 High collecting area and7 7 1 7 -1 366.11308 11.8 7.538E-14 1.43E-01 High angular resolution are needed8 8 1 8 -1 470.69806 15.3 1.237E-13 1.25E-01 Size of the emitting region=1”9 9 1 9 -1 588.34620 19.3 1.921E-13 1.11E-01 expected brightness temperatures10 10 1 10 -1 719.05398 23.7 2.855E-13 1.00E-01 0.10-0.50 K11 11 1 11 -1 862.81751 28.5 4.095E-13 9.09E-0212 12 1 12 -1 1019.63249 33.8 5.699E-13 8.33E-0213 13 1 13 -1 1189.49425 39.5 7.734E-13 7.69E-0214 14 1 14 -1 1372.39770 45.6 1.027E-12 7.14E-0215 15 1 15 -1 1568.33741 52.2 1.338E-12 6.67E-0216 16 1 16 -1 1777.30753 59.2 1.715E-12 6.25E-0217 17 1 17 -1 1999.30182 66.6 2.166E-12 5.88E-0218 18 1 18 -1 2234.31369 74.5 2.701E-12 5.56E-02 Expected brightness temperatures > 1 K19 19 1 19 -1 2482.33613 82.8 3.329E-12 5.26E-0220 20 1 20 -1 2743.36176 91.6 4.061E-12 5.00E-0221 21 1 21 -1 3017.38281 100.8 4.907E-12 4.76E-0222 22 1 22 -1 3304.39115 110.5 5.878E-12 4.55E-0223 23 1 23 -1 3604.37823 120.5 6.987E-12 4.35E-0224 24 1 24 -1 3917.33516 131.1 8.245E-12 4.17E-0225 25 1 25 -1 4243.25265 142.0 9.665E-12 4.00E-0226 26 1 26 -1 4582.12103 153.4 1.126E-11 3.85E-0227 27 1 27 -1 4933.93025 165.2 1.305E-11 3.70E-0228 28 1 28 -1 5298.66990 177.5 1.503E-11 3.57E-0229 29 1 29 -1 5676.32919 190.2 1.724E-11 3.45E-0230 30 1 30 -1 6066.89693 203.4 1.968E-11 3.33E-0231 31 1 31 -1 6470.36159 217.0 2.237E-11 3.23E-0232 32 1 32 -1 6886.71126 231.0 2.533E-11 3.13E-0233 33 1 33 -1 7315.93365 245.4 2.856E-11 3.03E-0234 34 1 34 -1 7758.01611 260.3 3.210E-11 2.94E-02
From diffuse to dense gas in the Milky Way with the SKA
• HI in molecular and diffuse clouds to study the time evolution of these objects and the border between the atomic and molecular zones. OH lines as a tracer of the molecular zone.
• Measurements of the magnetic field.• Physical structure and physical evolution• HI in evolved stars and post-AGB objects. Large complex
molecules• Heavy molecules (PAHs), heavy anions in several
environnements• Masers of Water, OH, CH, and other molecular species• Emission from the bending modes of polyatomic linear
molecules (HCN, HC3N,…)• Very large prebiotic molecules in protoplanetary disks